Woodbranch, TX Map & Demographics
Woodbranch Map
Woodbranch Overview
$29,895
PER CAPITA INCOME
$80,625
AVG FAMILY INCOME
$79,375
AVG HOUSEHOLD INCOME
45.3%
WAGE / INCOME GAP [ % ]
54.7¢/ $1
WAGE / INCOME GAP [ $ ]
0.35
INEQUALITY / GINI INDEX
1,614
TOTAL POPULATION
909
MALE POPULATION
705
FEMALE POPULATION
128.94
MALES / 100 FEMALES
77.56
FEMALES / 100 MALES
34.8
MEDIAN AGE
3.3
AVG FAMILY SIZE
3.1
AVG HOUSEHOLD SIZE
722
LABOR FORCE [ PEOPLE ]
65.8%
PERCENT IN LABOR FORCE
4.3%
UNEMPLOYMENT RATE
Income in Woodbranch
Income Overview in Woodbranch
Per Capita Income in Woodbranch is $29,895, while median incomes of families and households are $80,625 and $79,375 respectively.
| Characteristic | Number | Measure |
| Per Capita Income | 1,614 | $29,895 |
| Median Family Income | 450 | $80,625 |
| Mean Family Income | 450 | $92,933 |
| Median Household Income | 518 | $79,375 |
| Mean Household Income | 518 | $90,858 |
| Income Deficit | 450 | $0 |
| Wage / Income Gap (%) | 1,614 | 45.33% |
| Wage / Income Gap ($) | 1,614 | 54.67¢ per $1 |
| Gini / Inequality Index | 1,614 | 0.35 |
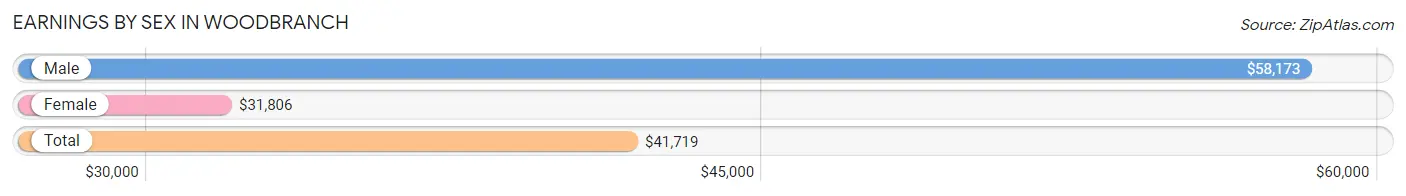
Earnings by Sex in Woodbranch
Average Earnings in Woodbranch are $41,719, $58,173 for men and $31,806 for women, a difference of 45.3%.
| Sex | Number | Average Earnings |
| Male | 423 (56.8%) | $58,173 |
| Female | 322 (43.2%) | $31,806 |
| Total | 745 (100.0%) | $41,719 |
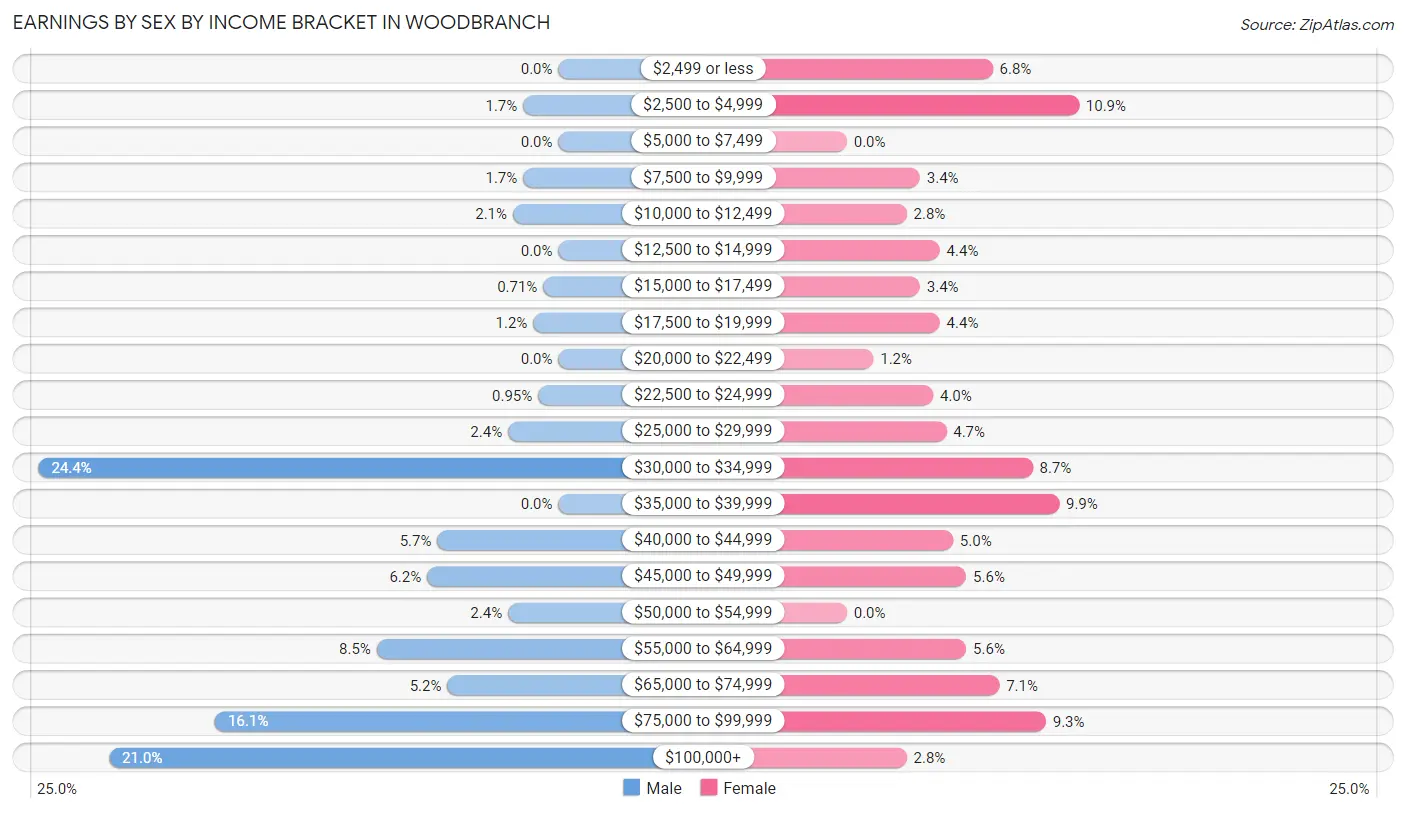
Earnings by Sex by Income Bracket in Woodbranch
The most common earnings brackets in Woodbranch are $30,000 to $34,999 for men (103 | 24.3%) and $2,500 to $4,999 for women (35 | 10.9%).
| Income | Male | Female |
| $2,499 or less | 0 (0.0%) | 22 (6.8%) |
| $2,500 to $4,999 | 7 (1.7%) | 35 (10.9%) |
| $5,000 to $7,499 | 0 (0.0%) | 0 (0.0%) |
| $7,500 to $9,999 | 7 (1.7%) | 11 (3.4%) |
| $10,000 to $12,499 | 9 (2.1%) | 9 (2.8%) |
| $12,500 to $14,999 | 0 (0.0%) | 14 (4.3%) |
| $15,000 to $17,499 | 3 (0.7%) | 11 (3.4%) |
| $17,500 to $19,999 | 5 (1.2%) | 14 (4.3%) |
| $20,000 to $22,499 | 0 (0.0%) | 4 (1.2%) |
| $22,500 to $24,999 | 4 (0.9%) | 13 (4.0%) |
| $25,000 to $29,999 | 10 (2.4%) | 15 (4.7%) |
| $30,000 to $34,999 | 103 (24.3%) | 28 (8.7%) |
| $35,000 to $39,999 | 0 (0.0%) | 32 (9.9%) |
| $40,000 to $44,999 | 24 (5.7%) | 16 (5.0%) |
| $45,000 to $49,999 | 26 (6.1%) | 18 (5.6%) |
| $50,000 to $54,999 | 10 (2.4%) | 0 (0.0%) |
| $55,000 to $64,999 | 36 (8.5%) | 18 (5.6%) |
| $65,000 to $74,999 | 22 (5.2%) | 23 (7.1%) |
| $75,000 to $99,999 | 68 (16.1%) | 30 (9.3%) |
| $100,000+ | 89 (21.0%) | 9 (2.8%) |
| Total | 423 (100.0%) | 322 (100.0%) |
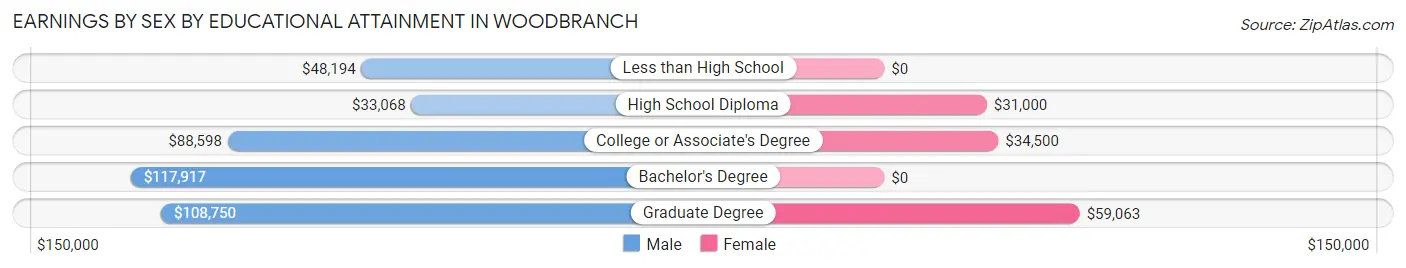
Earnings by Sex by Educational Attainment in Woodbranch
Average earnings in Woodbranch are $60,598 for men and $34,500 for women, a difference of 43.1%. Men with an educational attainment of bachelor's degree enjoy the highest average annual earnings of $117,917, while those with high school diploma education earn the least with $33,068. Women with an educational attainment of graduate degree earn the most with the average annual earnings of $59,063, while those with high school diploma education have the smallest earnings of $31,000.
| Educational Attainment | Male Income | Female Income |
| Less than High School | $48,194 | $0 |
| High School Diploma | $33,068 | $31,000 |
| College or Associate's Degree | $88,598 | $34,500 |
| Bachelor's Degree | $117,917 | $0 |
| Graduate Degree | $108,750 | $59,063 |
| Total | $60,598 | $34,500 |
Family Income in Woodbranch
Family Income Brackets in Woodbranch
According to the Woodbranch family income data, there are 127 families falling into the $100,000 to $149,999 income range, which is the most common income bracket and makes up 28.2% of all families.
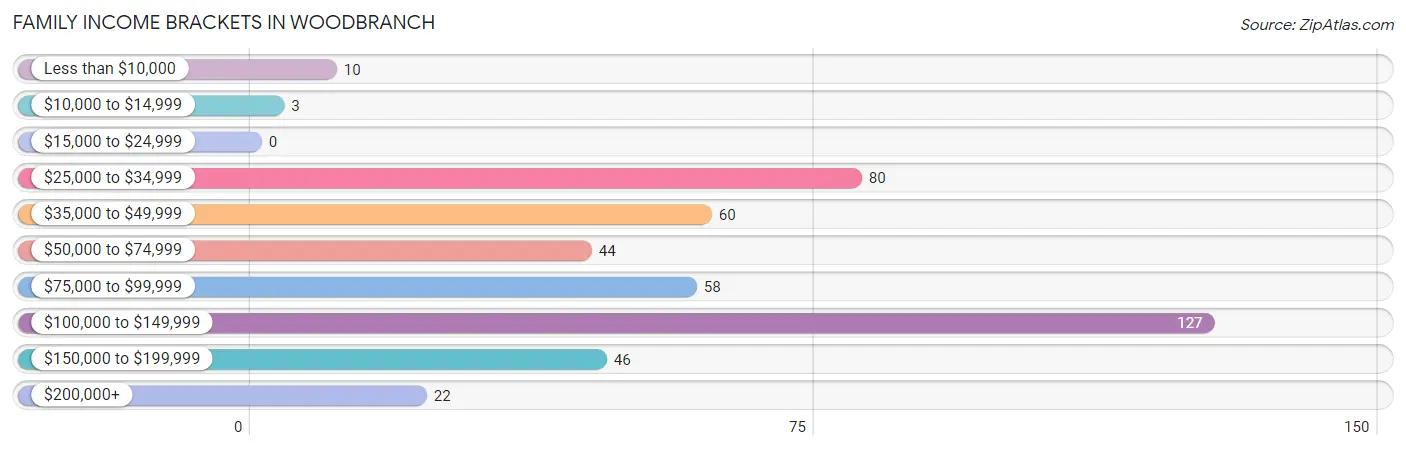
| Income Bracket | # Families | % Families |
| Less than $10,000 | 10 | 2.2% |
| $10,000 to $14,999 | 3 | 0.7% |
| $15,000 to $24,999 | 0 | 0.0% |
| $25,000 to $34,999 | 80 | 17.8% |
| $35,000 to $49,999 | 60 | 13.3% |
| $50,000 to $74,999 | 44 | 9.8% |
| $75,000 to $99,999 | 58 | 12.9% |
| $100,000 to $149,999 | 127 | 28.2% |
| $150,000 to $199,999 | 46 | 10.2% |
| $200,000+ | 22 | 4.9% |
Family Income by Famaliy Size in Woodbranch
5-person families (21 | 4.7%) account for the highest median family income in Woodbranch with $145,375 per family, while 2-person families (208 | 46.2%) have the highest median income of $57,222 per family member.
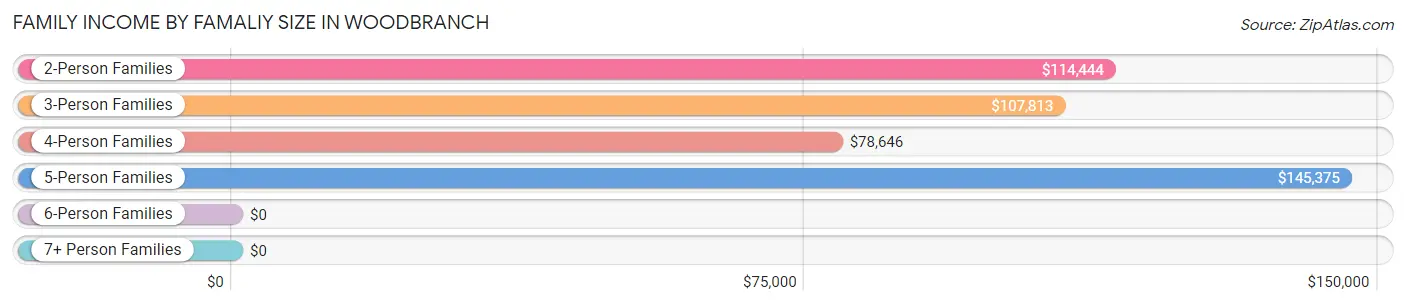
| Income Bracket | # Families | Median Income |
| 2-Person Families | 208 (46.2%) | $114,444 |
| 3-Person Families | 93 (20.7%) | $107,813 |
| 4-Person Families | 37 (8.2%) | $78,646 |
| 5-Person Families | 21 (4.7%) | $145,375 |
| 6-Person Families | 81 (18.0%) | $0 |
| 7+ Person Families | 10 (2.2%) | $0 |
| Total | 450 (100.0%) | $80,625 |
Family Income by Number of Earners in Woodbranch
The median family income in Woodbranch is $80,625, with families comprising 3+ earners (50) having the highest median family income of $175,455, while families with 1 earner (183) have the lowest median family income of $40,938, accounting for 11.1% and 40.7% of families, respectively.
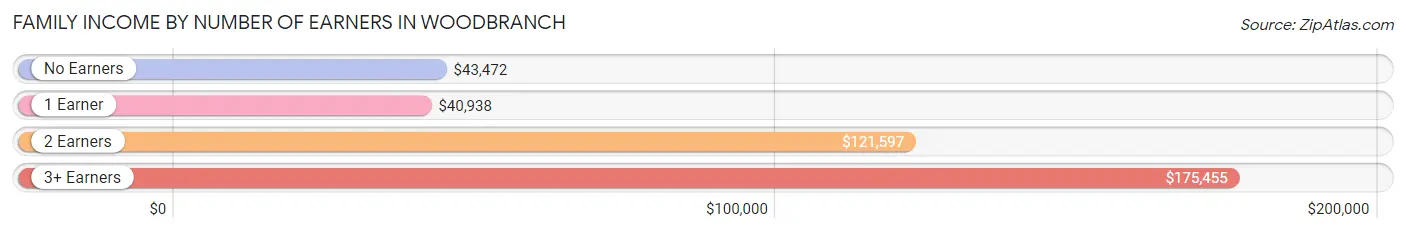
| Number of Earners | # Families | Median Income |
| No Earners | 53 (11.8%) | $43,472 |
| 1 Earner | 183 (40.7%) | $40,938 |
| 2 Earners | 164 (36.4%) | $121,597 |
| 3+ Earners | 50 (11.1%) | $175,455 |
| Total | 450 (100.0%) | $80,625 |
Household Income in Woodbranch
Household Income Brackets in Woodbranch
With 114 households falling in the category, the $100,000 to $149,999 income range is the most frequent in Woodbranch, accounting for 22.0% of all households. In contrast, only 3 households (0.6%) fall into the $10,000 to $14,999 income bracket, making it the least populous group.
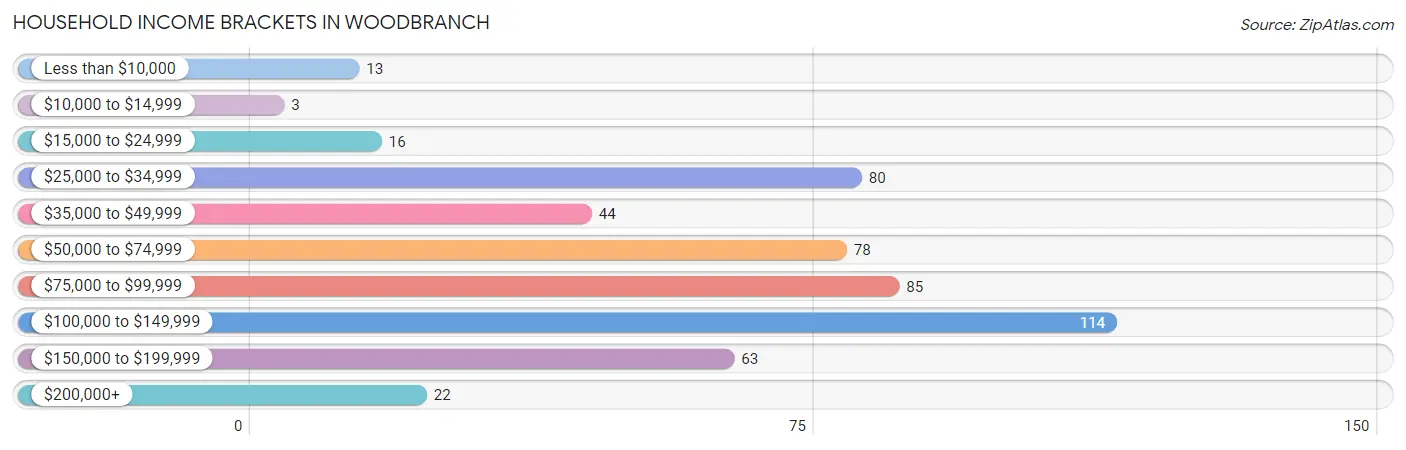
| Income Bracket | # Households | % Households |
| Less than $10,000 | 13 | 2.5% |
| $10,000 to $14,999 | 3 | 0.6% |
| $15,000 to $24,999 | 16 | 3.1% |
| $25,000 to $34,999 | 80 | 15.4% |
| $35,000 to $49,999 | 44 | 8.5% |
| $50,000 to $74,999 | 78 | 15.1% |
| $75,000 to $99,999 | 85 | 16.4% |
| $100,000 to $149,999 | 114 | 22.0% |
| $150,000 to $199,999 | 63 | 12.2% |
| $200,000+ | 22 | 4.2% |
Household Income by Householder Age in Woodbranch
The median household income in Woodbranch is $79,375, with the highest median household income of $137,850 found in the 45 to 64 years age bracket for the primary householder. A total of 181 households (34.9%) fall into this category. Meanwhile, the 15 to 24 years age bracket for the primary householder has the lowest median household income of $0, with 12 households (2.3%) in this group.
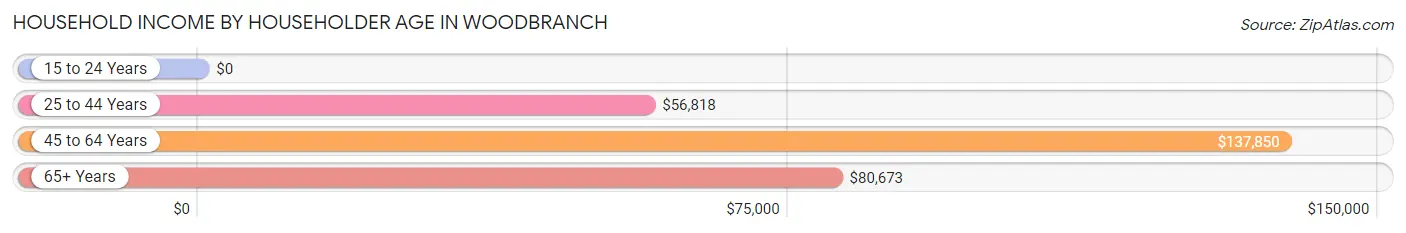
| Income Bracket | # Households | Median Income |
| 15 to 24 Years | 12 (2.3%) | $0 |
| 25 to 44 Years | 176 (34.0%) | $56,818 |
| 45 to 64 Years | 181 (34.9%) | $137,850 |
| 65+ Years | 149 (28.8%) | $80,673 |
| Total | 518 (100.0%) | $79,375 |
Poverty in Woodbranch
Income Below Poverty by Sex and Age in Woodbranch
With 39.4% poverty level for males and 16.2% for females among the residents of Woodbranch, under 5 year old males and 15 year old females are the most vulnerable to poverty, with 206 males (90.3%) and 4 females (57.1%) in their respective age groups living below the poverty level.
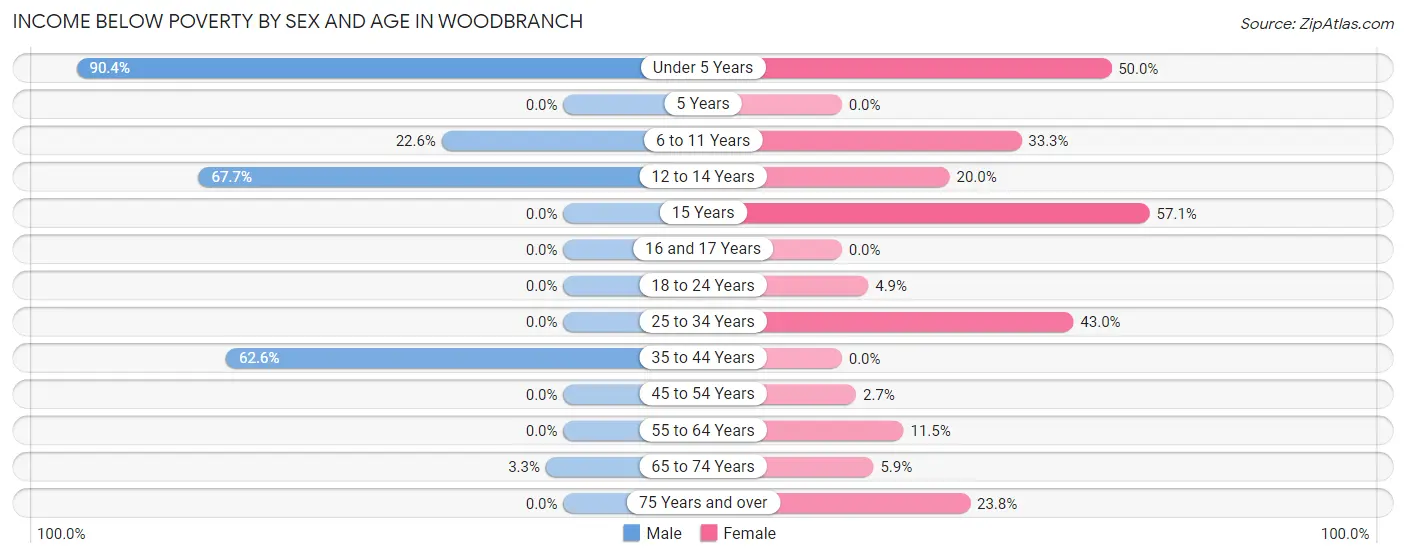
| Age Bracket | Male | Female |
| Under 5 Years | 206 (90.3%) | 7 (50.0%) |
| 5 Years | 0 (0.0%) | 0 (0.0%) |
| 6 to 11 Years | 7 (22.6%) | 19 (33.3%) |
| 12 to 14 Years | 65 (67.7%) | 7 (20.0%) |
| 15 Years | 0 (0.0%) | 4 (57.1%) |
| 16 and 17 Years | 0 (0.0%) | 0 (0.0%) |
| 18 to 24 Years | 0 (0.0%) | 3 (4.9%) |
| 25 to 34 Years | 0 (0.0%) | 46 (43.0%) |
| 35 to 44 Years | 77 (62.6%) | 0 (0.0%) |
| 45 to 54 Years | 0 (0.0%) | 3 (2.6%) |
| 55 to 64 Years | 0 (0.0%) | 11 (11.5%) |
| 65 to 74 Years | 3 (3.3%) | 4 (5.9%) |
| 75 Years and over | 0 (0.0%) | 10 (23.8%) |
| Total | 358 (39.4%) | 114 (16.2%) |
Income Above Poverty by Sex and Age in Woodbranch
According to the poverty statistics in Woodbranch, males aged 5 years and females aged 5 years are the age groups that are most secure financially, with 100.0% of males and 100.0% of females in these age groups living above the poverty line.
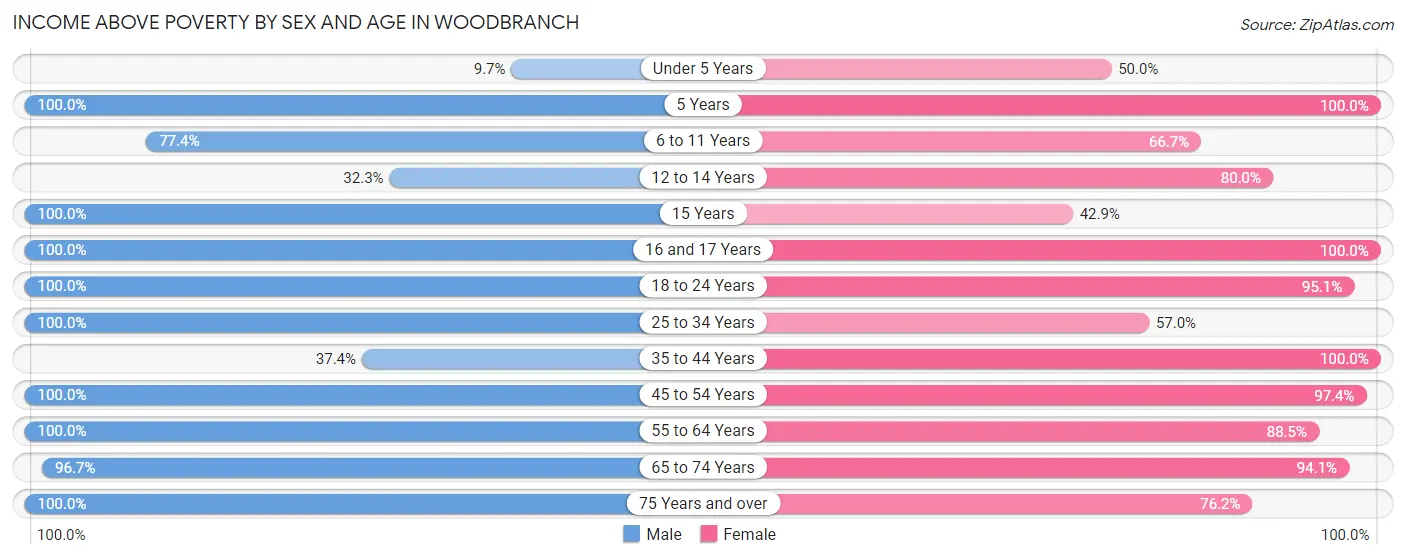
| Age Bracket | Male | Female |
| Under 5 Years | 22 (9.7%) | 7 (50.0%) |
| 5 Years | 22 (100.0%) | 22 (100.0%) |
| 6 to 11 Years | 24 (77.4%) | 38 (66.7%) |
| 12 to 14 Years | 31 (32.3%) | 28 (80.0%) |
| 15 Years | 4 (100.0%) | 3 (42.9%) |
| 16 and 17 Years | 24 (100.0%) | 11 (100.0%) |
| 18 to 24 Years | 44 (100.0%) | 58 (95.1%) |
| 25 to 34 Years | 59 (100.0%) | 61 (57.0%) |
| 35 to 44 Years | 46 (37.4%) | 72 (100.0%) |
| 45 to 54 Years | 80 (100.0%) | 110 (97.4%) |
| 55 to 64 Years | 84 (100.0%) | 85 (88.5%) |
| 65 to 74 Years | 89 (96.7%) | 64 (94.1%) |
| 75 Years and over | 22 (100.0%) | 32 (76.2%) |
| Total | 551 (60.6%) | 591 (83.8%) |
Income Below Poverty Among Married-Couple Families in Woodbranch
The poverty statistics for married-couple families in Woodbranch show that 21.6% or 80 of the total 371 families live below the poverty line. Families with 5 or more children have the highest poverty rate of 100.0%, comprising of 7 families. On the other hand, families with 1 or 2 children have the lowest poverty rate of 0.0%, which includes 0 families.
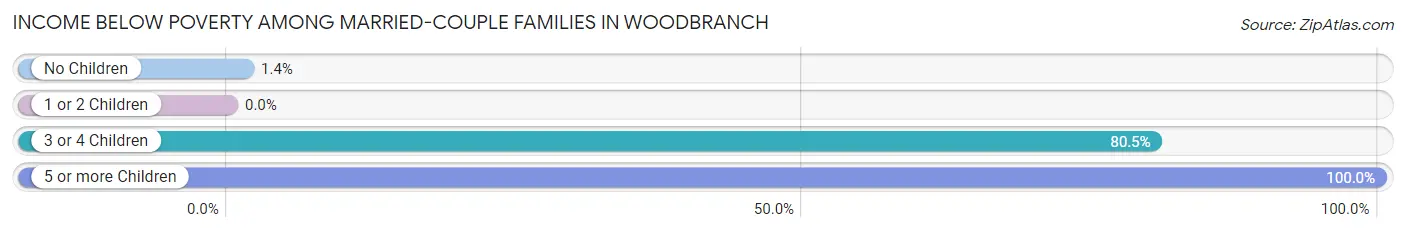
| Children | Above Poverty | Below Poverty |
| No Children | 212 (98.6%) | 3 (1.4%) |
| 1 or 2 Children | 62 (100.0%) | 0 (0.0%) |
| 3 or 4 Children | 17 (19.5%) | 70 (80.5%) |
| 5 or more Children | 0 (0.0%) | 7 (100.0%) |
| Total | 291 (78.4%) | 80 (21.6%) |
Income Below Poverty Among Single-Parent Households in Woodbranch
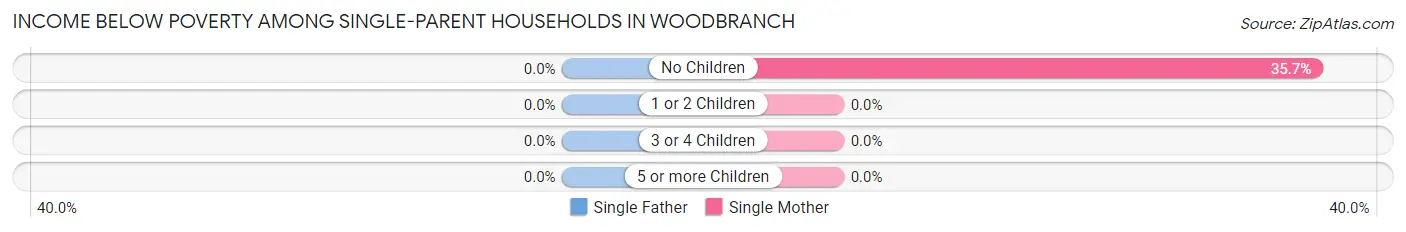
| Children | Single Father | Single Mother |
| No Children | 0 (0.0%) | 10 (35.7%) |
| 1 or 2 Children | 0 (0.0%) | 0 (0.0%) |
| 3 or 4 Children | 0 (0.0%) | 0 (0.0%) |
| 5 or more Children | 0 (0.0%) | 0 (0.0%) |
| Total | 0 (0.0%) | 10 (18.5%) |
Income Below Poverty Among Married-Couple vs Single-Parent Households in Woodbranch
The poverty data for Woodbranch shows that 80 of the married-couple family households (21.6%) and 10 of the single-parent households (12.7%) are living below the poverty level. Within the married-couple family households, those with 5 or more children have the highest poverty rate, with 7 households (100.0%) falling below the poverty line. Among the single-parent households, those with no children have the highest poverty rate, with 10 household (35.7%) living below poverty.
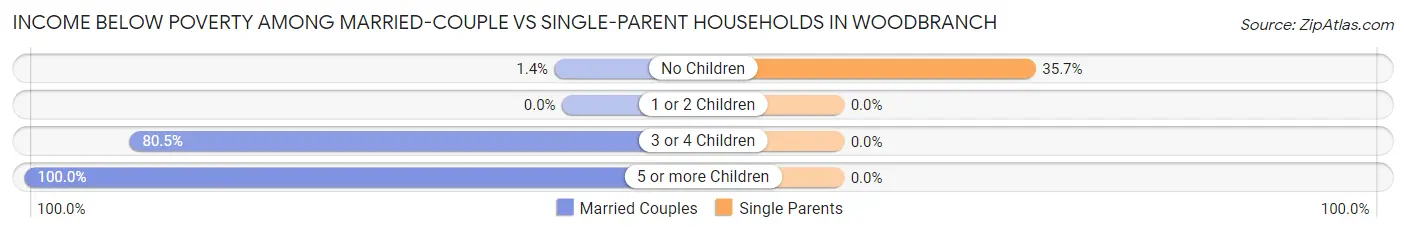
| Children | Married-Couple Families | Single-Parent Households |
| No Children | 3 (1.4%) | 10 (35.7%) |
| 1 or 2 Children | 0 (0.0%) | 0 (0.0%) |
| 3 or 4 Children | 70 (80.5%) | 0 (0.0%) |
| 5 or more Children | 7 (100.0%) | 0 (0.0%) |
| Total | 80 (21.6%) | 10 (12.7%) |
Race in Woodbranch
The most populous races in Woodbranch are White / Caucasian (1,031 | 63.9%), Hispanic or Latino (659 | 40.8%), and Two or more Races (559 | 34.6%).
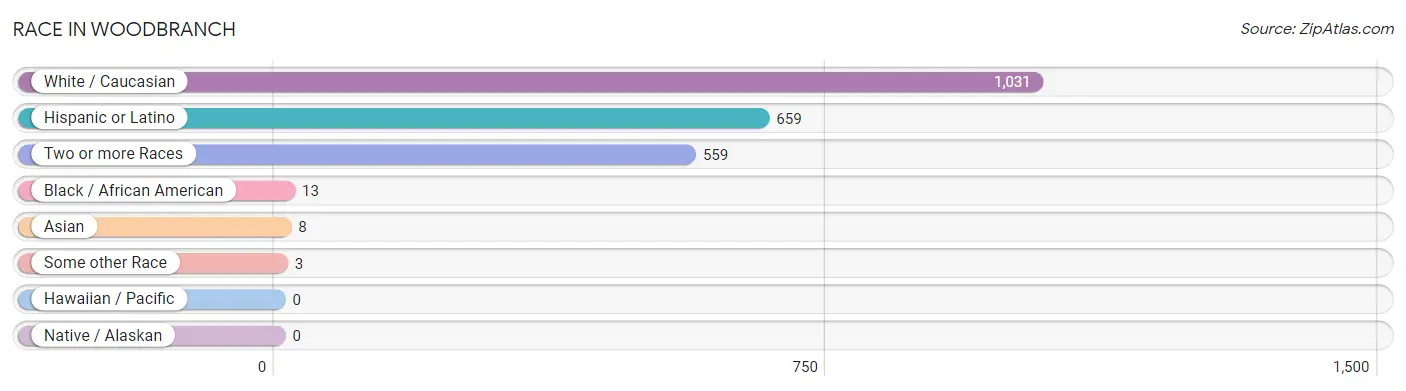
| Race | # Population | % Population |
| Asian | 8 | 0.5% |
| Black / African American | 13 | 0.8% |
| Hawaiian / Pacific | 0 | 0.0% |
| Hispanic or Latino | 659 | 40.8% |
| Native / Alaskan | 0 | 0.0% |
| White / Caucasian | 1,031 | 63.9% |
| Two or more Races | 559 | 34.6% |
| Some other Race | 3 | 0.2% |
| Total | 1,614 | 100.0% |
Ancestry in Woodbranch
The most populous ancestries reported in Woodbranch are Mexican (627 | 38.9%), English (499 | 30.9%), Irish (315 | 19.5%), German (157 | 9.7%), and American (153 | 9.5%), together accounting for 108.5% of all Woodbranch residents.
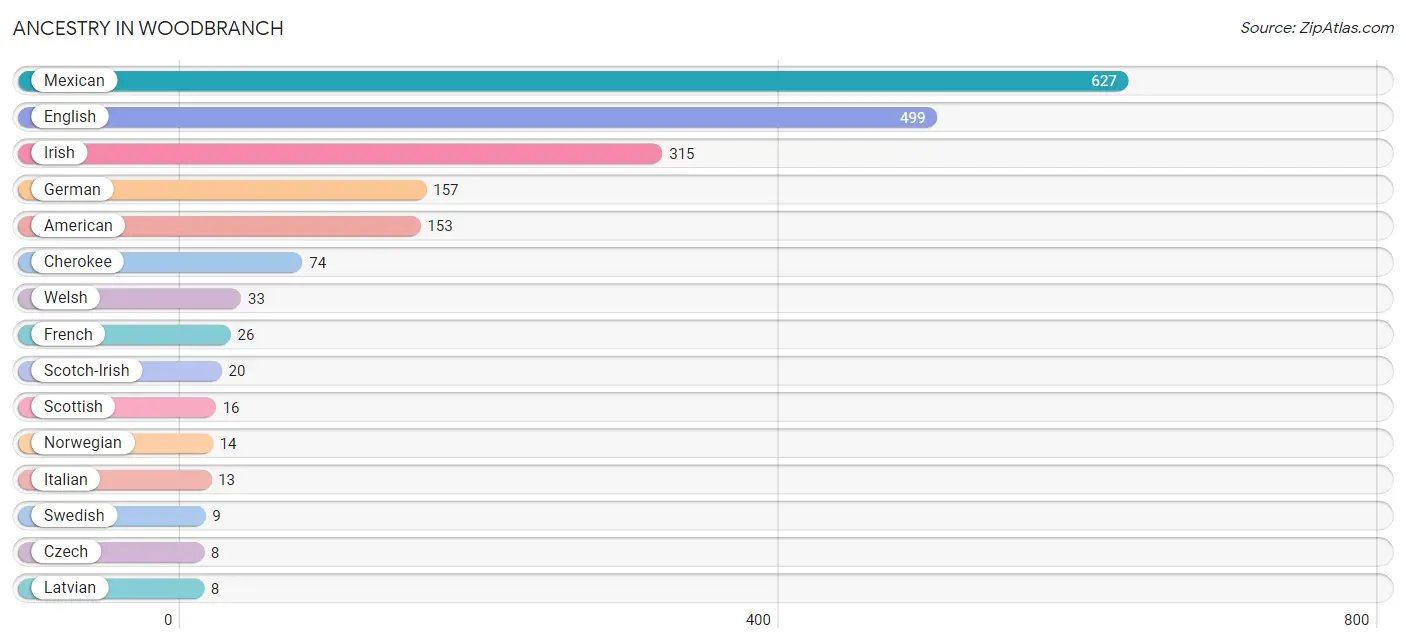
| Ancestry | # Population | % Population |
| American | 153 | 9.5% |
| Apache | 1 | 0.1% |
| Austrian | 4 | 0.3% |
| Belgian | 2 | 0.1% |
| Burmese | 5 | 0.3% |
| Cajun | 7 | 0.4% |
| Central American | 4 | 0.3% |
| Cherokee | 74 | 4.6% |
| Chilean | 4 | 0.3% |
| Croatian | 3 | 0.2% |
| Czech | 8 | 0.5% |
| Danish | 6 | 0.4% |
| English | 499 | 30.9% |
| French | 26 | 1.6% |
| French Canadian | 4 | 0.3% |
| German | 157 | 9.7% |
| Guatemalan | 4 | 0.3% |
| Irish | 315 | 19.5% |
| Iroquois | 3 | 0.2% |
| Italian | 13 | 0.8% |
| Latvian | 8 | 0.5% |
| Lithuanian | 7 | 0.4% |
| Mexican | 627 | 38.9% |
| Northern European | 4 | 0.3% |
| Norwegian | 14 | 0.9% |
| Pakistani | 6 | 0.4% |
| Scandinavian | 4 | 0.3% |
| Scotch-Irish | 20 | 1.2% |
| Scottish | 16 | 1.0% |
| Slovak | 3 | 0.2% |
| South American | 4 | 0.3% |
| Swedish | 9 | 0.6% |
| Welsh | 33 | 2.0% | View All 33 Rows |
Immigrants in Woodbranch
The most numerous immigrant groups reported in Woodbranch came from Central America (54 | 3.4%), Latin America (54 | 3.4%), Mexico (54 | 3.4%), Asia (8 | 0.5%), and South Eastern Asia (6 | 0.4%), together accounting for 10.9% of all Woodbranch residents.
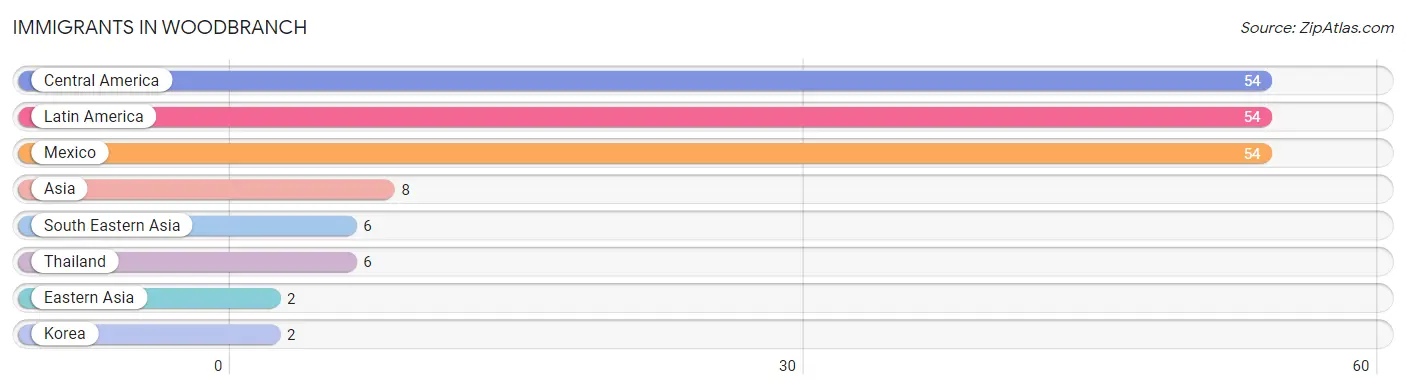
| Immigration Origin | # Population | % Population |
| Asia | 8 | 0.5% |
| Central America | 54 | 3.4% |
| Eastern Asia | 2 | 0.1% |
| Korea | 2 | 0.1% |
| Latin America | 54 | 3.4% |
| Mexico | 54 | 3.4% |
| South Eastern Asia | 6 | 0.4% |
| Thailand | 6 | 0.4% | View All 8 Rows |
Sex and Age in Woodbranch
Sex and Age in Woodbranch
The most populous age groups in Woodbranch are Under 5 Years (228 | 25.1%) for men and 30 to 34 Years (75 | 10.6%) for women.
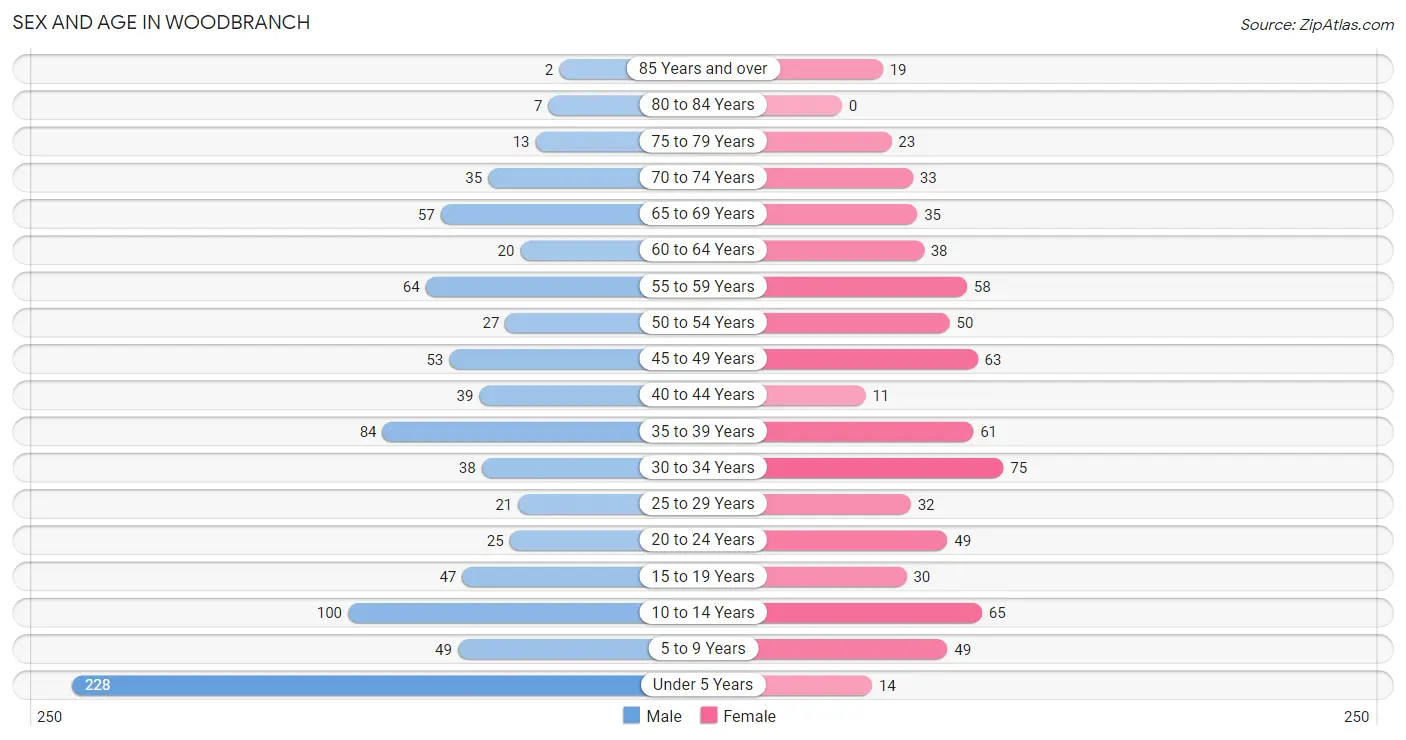
| Age Bracket | Male | Female |
| Under 5 Years | 228 (25.1%) | 14 (2.0%) |
| 5 to 9 Years | 49 (5.4%) | 49 (7.0%) |
| 10 to 14 Years | 100 (11.0%) | 65 (9.2%) |
| 15 to 19 Years | 47 (5.2%) | 30 (4.3%) |
| 20 to 24 Years | 25 (2.8%) | 49 (7.0%) |
| 25 to 29 Years | 21 (2.3%) | 32 (4.5%) |
| 30 to 34 Years | 38 (4.2%) | 75 (10.6%) |
| 35 to 39 Years | 84 (9.2%) | 61 (8.6%) |
| 40 to 44 Years | 39 (4.3%) | 11 (1.6%) |
| 45 to 49 Years | 53 (5.8%) | 63 (8.9%) |
| 50 to 54 Years | 27 (3.0%) | 50 (7.1%) |
| 55 to 59 Years | 64 (7.0%) | 58 (8.2%) |
| 60 to 64 Years | 20 (2.2%) | 38 (5.4%) |
| 65 to 69 Years | 57 (6.3%) | 35 (5.0%) |
| 70 to 74 Years | 35 (3.8%) | 33 (4.7%) |
| 75 to 79 Years | 13 (1.4%) | 23 (3.3%) |
| 80 to 84 Years | 7 (0.8%) | 0 (0.0%) |
| 85 Years and over | 2 (0.2%) | 19 (2.7%) |
| Total | 909 (100.0%) | 705 (100.0%) |
Families and Households in Woodbranch
Median Family Size in Woodbranch
The median family size in Woodbranch is 3.32 persons per family, with married-couple families (371 | 82.4%) accounting for the largest median family size of 3.48 persons per family. On the other hand, single male/father families (25 | 5.6%) represent the smallest median family size with 2.44 persons per family.
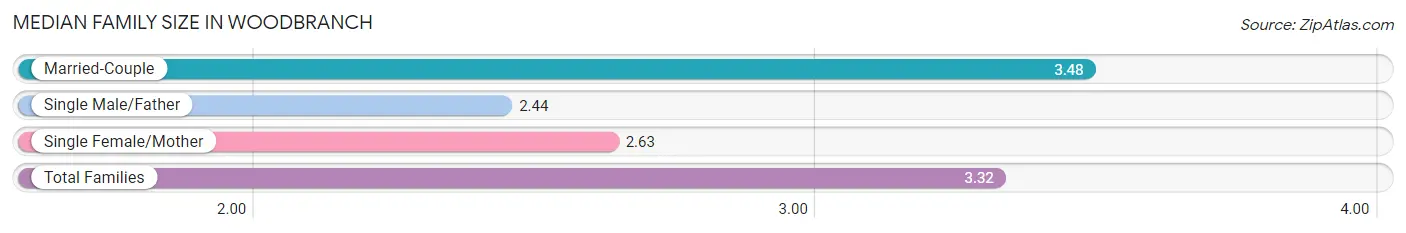
| Family Type | # Families | Family Size |
| Married-Couple | 371 (82.4%) | 3.48 |
| Single Male/Father | 25 (5.6%) | 2.44 |
| Single Female/Mother | 54 (12.0%) | 2.63 |
| Total Families | 450 (100.0%) | 3.32 |
Median Household Size in Woodbranch
The median household size in Woodbranch is 3.12 persons per household, with married-couple households (371 | 71.6%) accounting for the largest median household size of 3.5 persons per household. non-family households (68 | 13.1%) represent the smallest median household size with 1.18 persons per household.
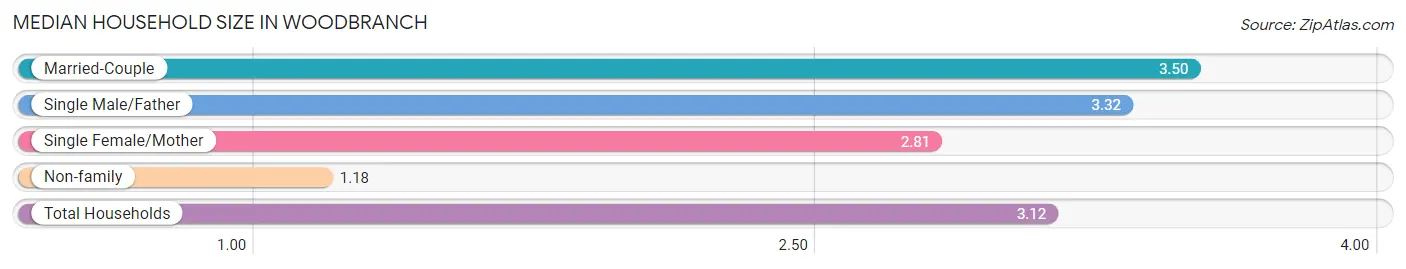
| Household Type | # Households | Household Size |
| Married-Couple | 371 (71.6%) | 3.50 |
| Single Male/Father | 25 (4.8%) | 3.32 |
| Single Female/Mother | 54 (10.4%) | 2.81 |
| Non-family | 68 (13.1%) | 1.18 |
| Total Households | 518 (100.0%) | 3.12 |
Household Size by Marriage Status in Woodbranch
Out of a total of 518 households in Woodbranch, 450 (86.9%) are family households, while 68 (13.1%) are nonfamily households. The most numerous type of family households are 2-person households, comprising 196, and the most common type of nonfamily households are 1-person households, comprising 55.
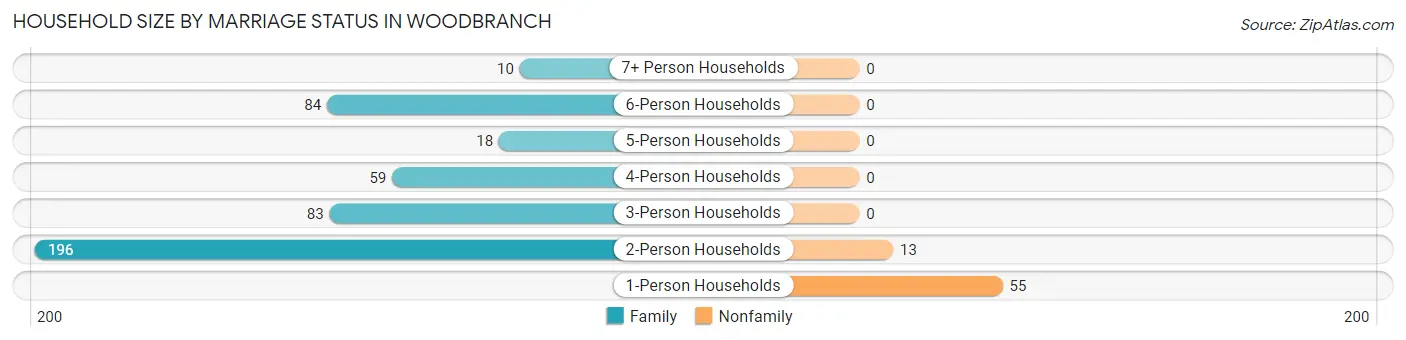
| Household Size | Family Households | Nonfamily Households |
| 1-Person Households | - | 55 (10.6%) |
| 2-Person Households | 196 (37.8%) | 13 (2.5%) |
| 3-Person Households | 83 (16.0%) | 0 (0.0%) |
| 4-Person Households | 59 (11.4%) | 0 (0.0%) |
| 5-Person Households | 18 (3.5%) | 0 (0.0%) |
| 6-Person Households | 84 (16.2%) | 0 (0.0%) |
| 7+ Person Households | 10 (1.9%) | 0 (0.0%) |
| Total | 450 (86.9%) | 68 (13.1%) |
Female Fertility in Woodbranch
Fertility by Age in Woodbranch
Average fertility rate in Woodbranch is 63.0 births per 1,000 women. Women in the age bracket of 20 to 34 years have the highest fertility rate with 109.0 births per 1,000 women. Women in the age bracket of 20 to 34 years acount for 80.9% of all women with births.
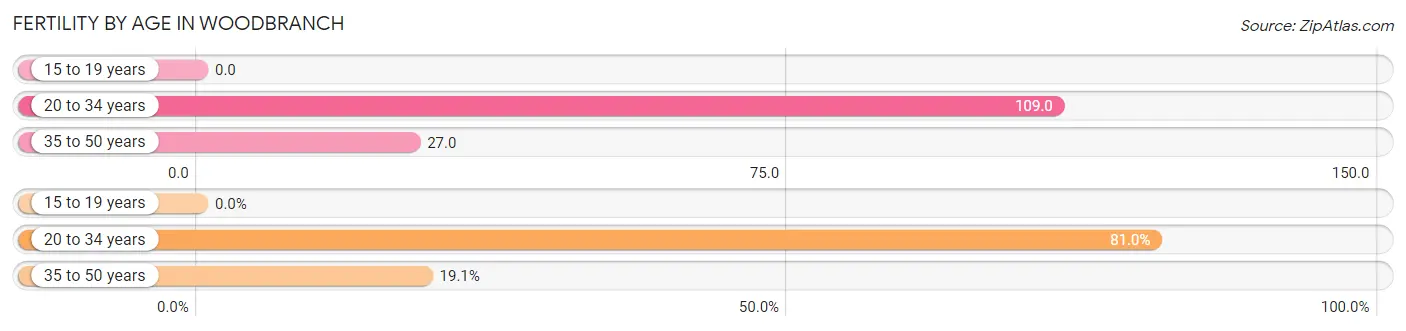
| Age Bracket | Women with Births | Births / 1,000 Women |
| 15 to 19 years | 0 (0.0%) | 0.0 |
| 20 to 34 years | 17 (80.9%) | 109.0 |
| 35 to 50 years | 4 (19.1%) | 27.0 |
| Total | 21 (100.0%) | 63.0 |
Fertility by Age by Marriage Status in Woodbranch
61.9% of women with births (21) in Woodbranch are married. The highest percentage of unmarried women with births falls into 35 to 50 years age bracket with 100.0% of them unmarried at the time of birth, while the lowest percentage of unmarried women with births belong to 20 to 34 years age bracket with 23.5% of them unmarried.
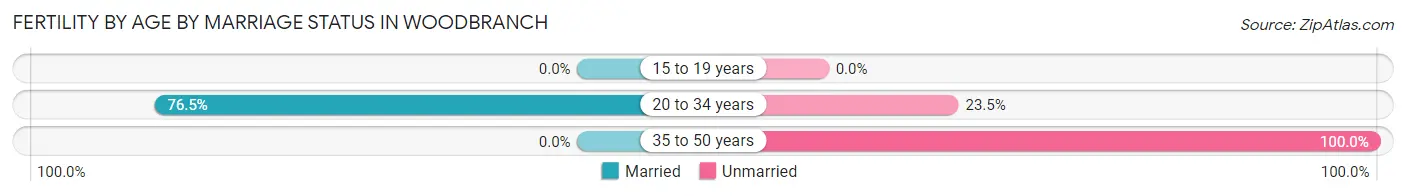
| Age Bracket | Married | Unmarried |
| 15 to 19 years | 0 (0.0%) | 0 (0.0%) |
| 20 to 34 years | 13 (76.5%) | 4 (23.5%) |
| 35 to 50 years | 0 (0.0%) | 4 (100.0%) |
| Total | 13 (61.9%) | 8 (38.1%) |
Fertility by Education in Woodbranch
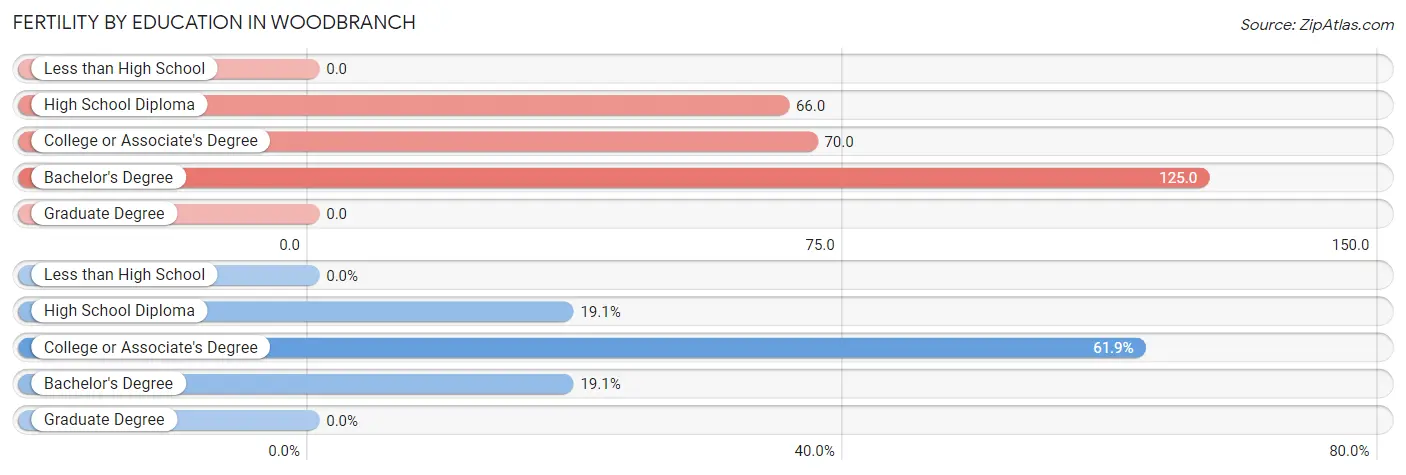
| Educational Attainment | Women with Births | Births / 1,000 Women |
| Less than High School | 0 (0.0%) | 0.0 |
| High School Diploma | 4 (19.1%) | 66.0 |
| College or Associate's Degree | 13 (61.9%) | 70.0 |
| Bachelor's Degree | 4 (19.1%) | 125.0 |
| Graduate Degree | 0 (0.0%) | 0.0 |
| Total | 21 (100.0%) | 63.0 |
Fertility by Education by Marriage Status in Woodbranch
38.1% of women with births in Woodbranch are unmarried. Women with the educational attainment of college or associate's degree are most likely to be married with 100.0% of them married at childbirth, while women with the educational attainment of high school diploma are least likely to be married with 100.0% of them unmarried at childbirth.
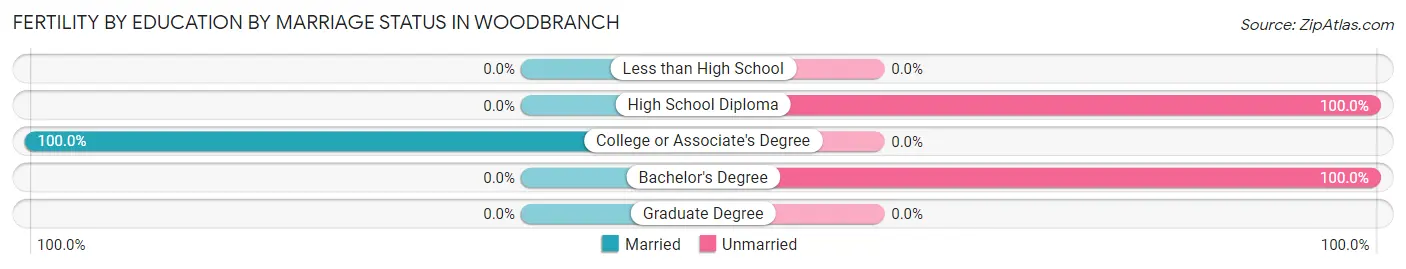
| Educational Attainment | Married | Unmarried |
| Less than High School | 0 (0.0%) | 0 (0.0%) |
| High School Diploma | 0 (0.0%) | 4 (100.0%) |
| College or Associate's Degree | 13 (100.0%) | 0 (0.0%) |
| Bachelor's Degree | 0 (0.0%) | 4 (100.0%) |
| Graduate Degree | 0 (0.0%) | 0 (0.0%) |
| Total | 13 (61.9%) | 8 (38.1%) |
Employment Characteristics in Woodbranch
Employment by Class of Employer in Woodbranch
Among the 674 employed individuals in Woodbranch, private company employees (490 | 72.7%), self-employed (not incorporated) (63 | 9.3%), and local government employees (41 | 6.1%) make up the most common classes of employment.
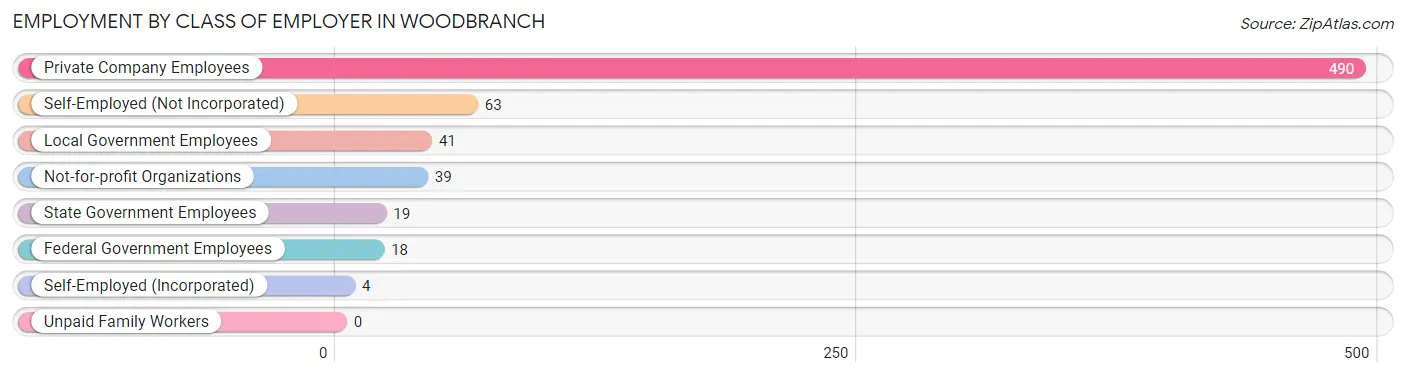
| Employer Class | # Employees | % Employees |
| Private Company Employees | 490 | 72.7% |
| Self-Employed (Incorporated) | 4 | 0.6% |
| Self-Employed (Not Incorporated) | 63 | 9.3% |
| Not-for-profit Organizations | 39 | 5.8% |
| Local Government Employees | 41 | 6.1% |
| State Government Employees | 19 | 2.8% |
| Federal Government Employees | 18 | 2.7% |
| Unpaid Family Workers | 0 | 0.0% |
| Total | 674 | 100.0% |
Employment Status by Age in Woodbranch
According to the labor force statistics for Woodbranch, out of the total population over 16 years of age (1,098), 65.8% or 722 individuals are in the labor force, with 4.3% or 31 of them unemployed. The age group with the highest labor force participation rate is 35 to 44 years, with 95.9% or 187 individuals in the labor force. Within the labor force, the 16 to 19 years age range has the highest percentage of unemployed individuals, with 32.0% or 8 of them being unemployed.
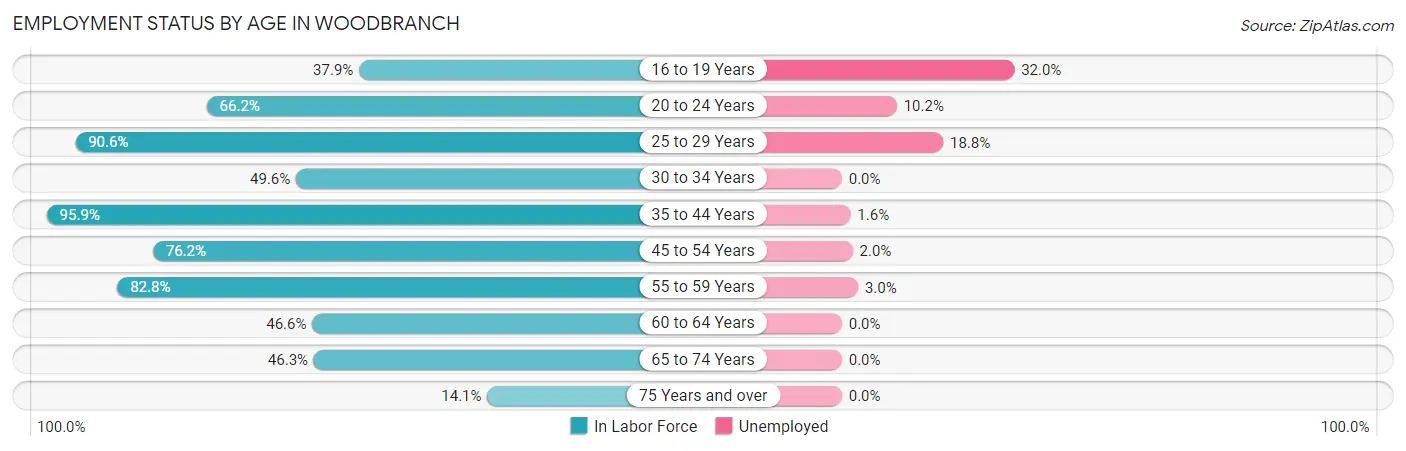
| Age Bracket | In Labor Force | Unemployed |
| 16 to 19 Years | 25 (37.9%) | 8 (32.0%) |
| 20 to 24 Years | 49 (66.2%) | 5 (10.2%) |
| 25 to 29 Years | 48 (90.6%) | 9 (18.8%) |
| 30 to 34 Years | 56 (49.6%) | 0 (0.0%) |
| 35 to 44 Years | 187 (95.9%) | 3 (1.6%) |
| 45 to 54 Years | 147 (76.2%) | 3 (2.0%) |
| 55 to 59 Years | 101 (82.8%) | 3 (3.0%) |
| 60 to 64 Years | 27 (46.6%) | 0 (0.0%) |
| 65 to 74 Years | 74 (46.3%) | 0 (0.0%) |
| 75 Years and over | 9 (14.1%) | 0 (0.0%) |
| Total | 722 (65.8%) | 31 (4.3%) |
Employment Status by Educational Attainment in Woodbranch
According to labor force statistics for Woodbranch, 77.1% of individuals (566) out of the total population between 25 and 64 years of age (734) are in the labor force, with 3.2% or 18 of them being unemployed. The group with the highest labor force participation rate are those with the educational attainment of high school diploma, with 87.4% or 257 individuals in the labor force. Within the labor force, individuals with less than high school education have the highest percentage of unemployment, with 12.0% or 3 of them being unemployed.
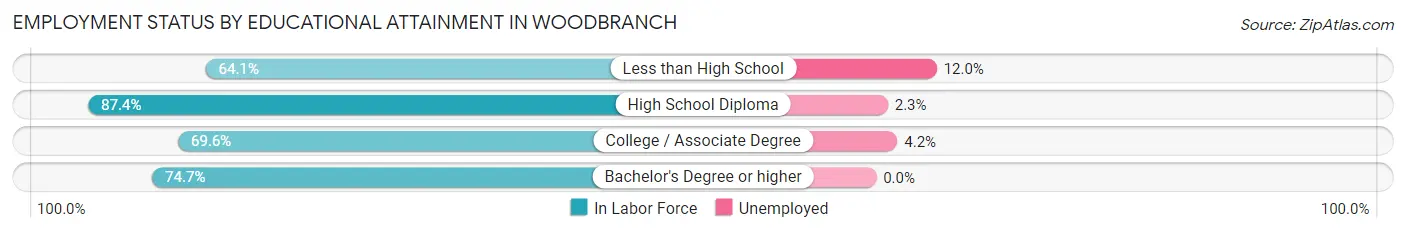
| Educational Attainment | In Labor Force | Unemployed |
| Less than High School | 25 (64.1%) | 5 (12.0%) |
| High School Diploma | 257 (87.4%) | 7 (2.3%) |
| College / Associate Degree | 213 (69.6%) | 13 (4.2%) |
| Bachelor's Degree or higher | 71 (74.7%) | 0 (0.0%) |
| Total | 566 (77.1%) | 23 (3.2%) |
Employment Occupations by Sex in Woodbranch
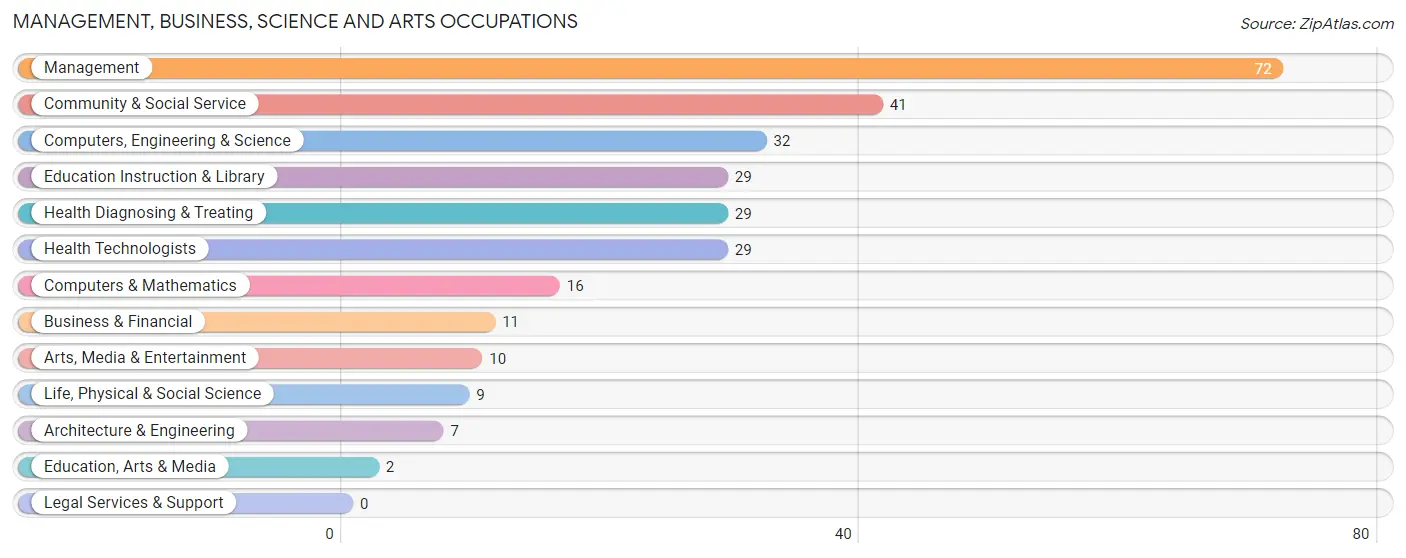
Management, Business, Science and Arts Occupations
The most common Management, Business, Science and Arts occupations in Woodbranch are Management (72 | 10.4%), Community & Social Service (41 | 5.9%), Computers, Engineering & Science (32 | 4.6%), Education Instruction & Library (29 | 4.2%), and Health Diagnosing & Treating (29 | 4.2%).
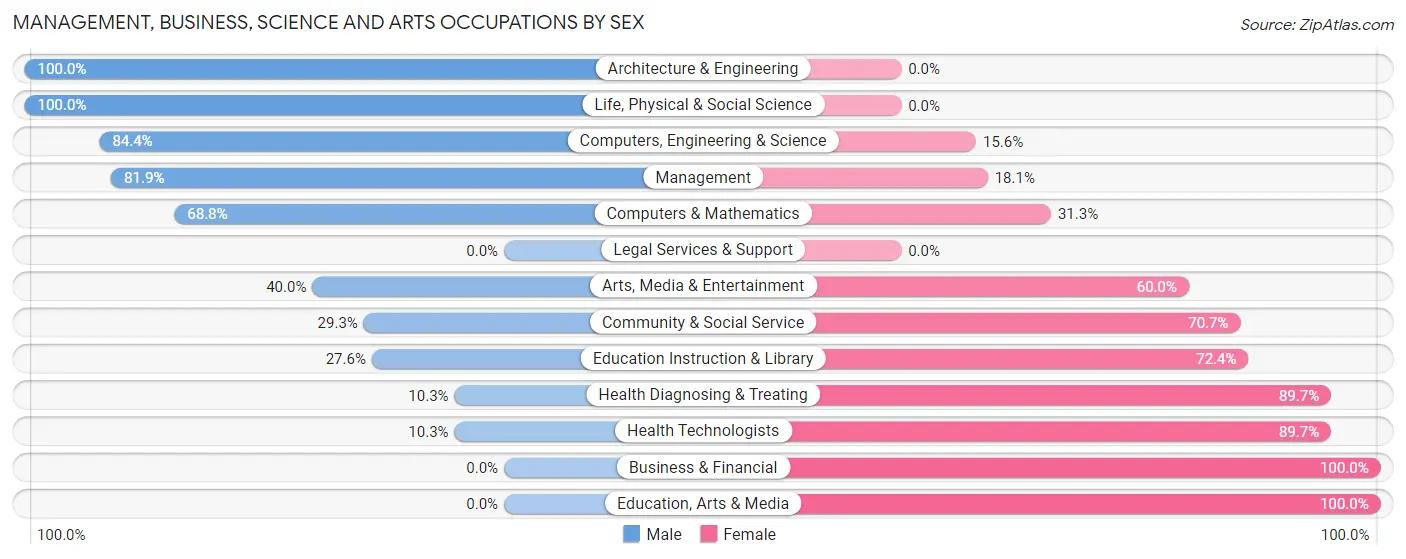
Management, Business, Science and Arts Occupations by Sex
Within the Management, Business, Science and Arts occupations in Woodbranch, the most male-oriented occupations are Architecture & Engineering (100.0%), Life, Physical & Social Science (100.0%), and Computers, Engineering & Science (84.4%), while the most female-oriented occupations are Business & Financial (100.0%), Education, Arts & Media (100.0%), and Health Diagnosing & Treating (89.7%).
| Occupation | Male | Female |
| Management | 59 (81.9%) | 13 (18.1%) |
| Business & Financial | 0 (0.0%) | 11 (100.0%) |
| Computers, Engineering & Science | 27 (84.4%) | 5 (15.6%) |
| Computers & Mathematics | 11 (68.8%) | 5 (31.2%) |
| Architecture & Engineering | 7 (100.0%) | 0 (0.0%) |
| Life, Physical & Social Science | 9 (100.0%) | 0 (0.0%) |
| Community & Social Service | 12 (29.3%) | 29 (70.7%) |
| Education, Arts & Media | 0 (0.0%) | 2 (100.0%) |
| Legal Services & Support | 0 (0.0%) | 0 (0.0%) |
| Education Instruction & Library | 8 (27.6%) | 21 (72.4%) |
| Arts, Media & Entertainment | 4 (40.0%) | 6 (60.0%) |
| Health Diagnosing & Treating | 3 (10.3%) | 26 (89.7%) |
| Health Technologists | 3 (10.3%) | 26 (89.7%) |
| Total (Category) | 101 (54.6%) | 84 (45.4%) |
| Total (Overall) | 406 (58.7%) | 286 (41.3%) |
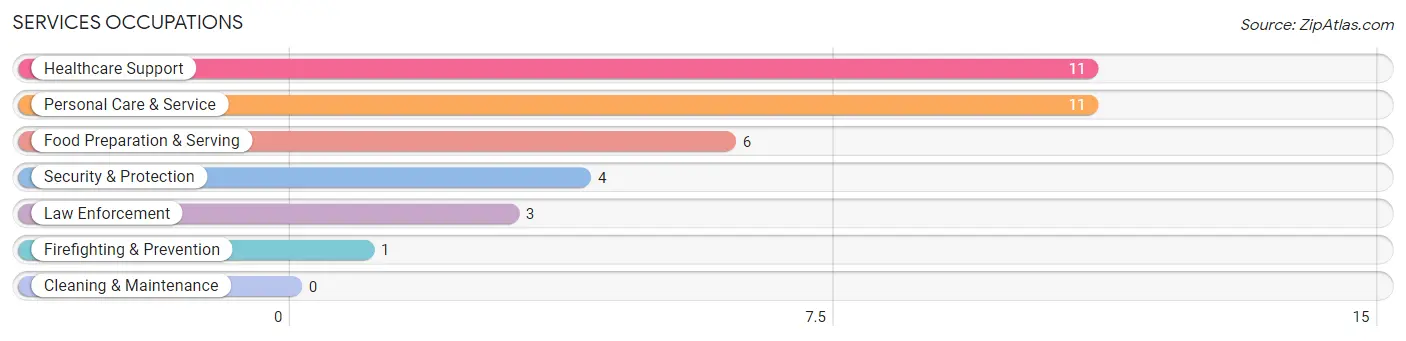
Services Occupations
The most common Services occupations in Woodbranch are Healthcare Support (11 | 1.6%), Personal Care & Service (11 | 1.6%), Food Preparation & Serving (6 | 0.9%), Security & Protection (4 | 0.6%), and Law Enforcement (3 | 0.4%).
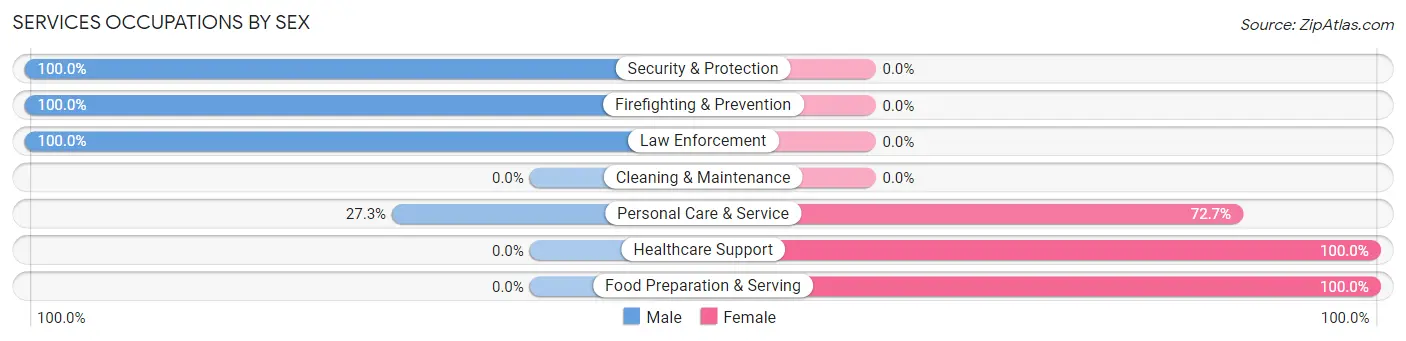
Services Occupations by Sex
Within the Services occupations in Woodbranch, the most male-oriented occupations are Security & Protection (100.0%), Firefighting & Prevention (100.0%), and Law Enforcement (100.0%), while the most female-oriented occupations are Healthcare Support (100.0%), Food Preparation & Serving (100.0%), and Personal Care & Service (72.7%).
| Occupation | Male | Female |
| Healthcare Support | 0 (0.0%) | 11 (100.0%) |
| Security & Protection | 4 (100.0%) | 0 (0.0%) |
| Firefighting & Prevention | 1 (100.0%) | 0 (0.0%) |
| Law Enforcement | 3 (100.0%) | 0 (0.0%) |
| Food Preparation & Serving | 0 (0.0%) | 6 (100.0%) |
| Cleaning & Maintenance | 0 (0.0%) | 0 (0.0%) |
| Personal Care & Service | 3 (27.3%) | 8 (72.7%) |
| Total (Category) | 7 (21.9%) | 25 (78.1%) |
| Total (Overall) | 406 (58.7%) | 286 (41.3%) |
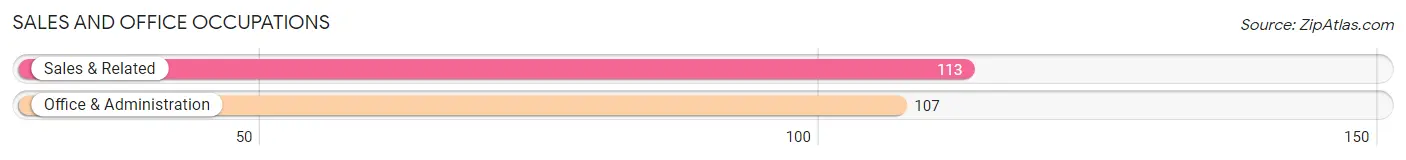
Sales and Office Occupations
The most common Sales and Office occupations in Woodbranch are Sales & Related (113 | 16.3%), and Office & Administration (107 | 15.5%).
Sales and Office Occupations by Sex
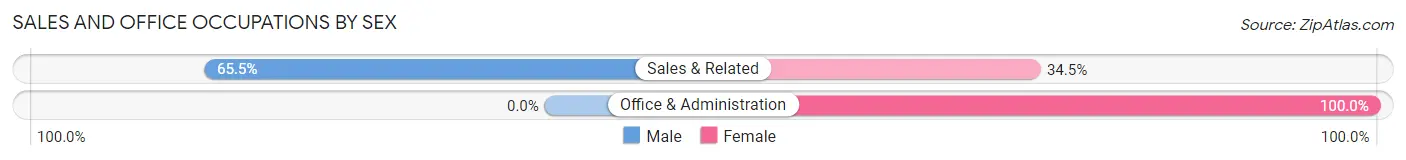
| Occupation | Male | Female |
| Sales & Related | 74 (65.5%) | 39 (34.5%) |
| Office & Administration | 0 (0.0%) | 107 (100.0%) |
| Total (Category) | 74 (33.6%) | 146 (66.4%) |
| Total (Overall) | 406 (58.7%) | 286 (41.3%) |
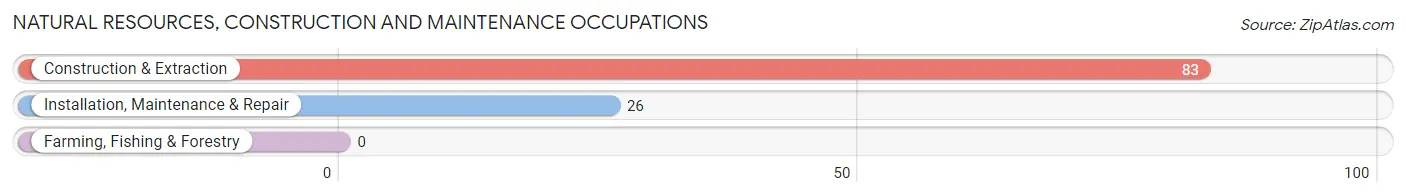
Natural Resources, Construction and Maintenance Occupations
The most common Natural Resources, Construction and Maintenance occupations in Woodbranch are Construction & Extraction (83 | 12.0%), and Installation, Maintenance & Repair (26 | 3.8%).
Natural Resources, Construction and Maintenance Occupations by Sex
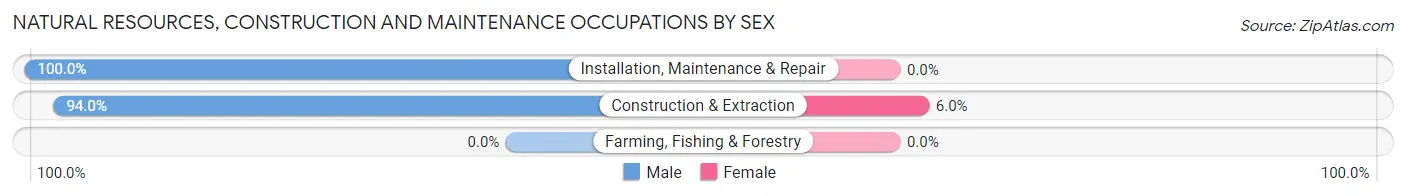
| Occupation | Male | Female |
| Farming, Fishing & Forestry | 0 (0.0%) | 0 (0.0%) |
| Construction & Extraction | 78 (94.0%) | 5 (6.0%) |
| Installation, Maintenance & Repair | 26 (100.0%) | 0 (0.0%) |
| Total (Category) | 104 (95.4%) | 5 (4.6%) |
| Total (Overall) | 406 (58.7%) | 286 (41.3%) |
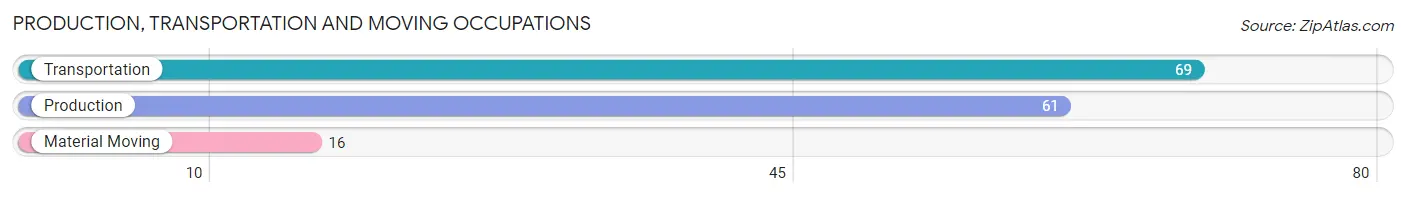
Production, Transportation and Moving Occupations
The most common Production, Transportation and Moving occupations in Woodbranch are Transportation (69 | 10.0%), Production (61 | 8.8%), and Material Moving (16 | 2.3%).
Production, Transportation and Moving Occupations by Sex
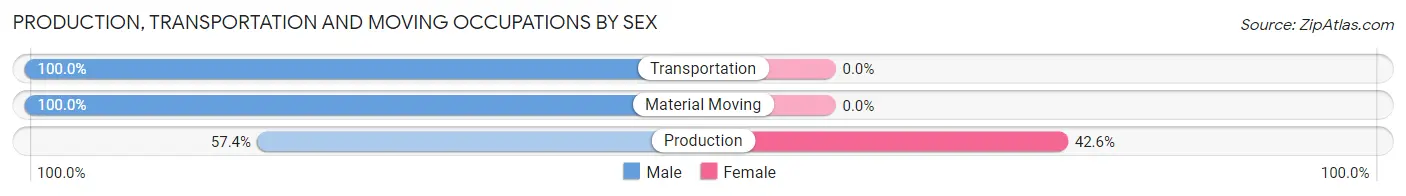
| Occupation | Male | Female |
| Production | 35 (57.4%) | 26 (42.6%) |
| Transportation | 69 (100.0%) | 0 (0.0%) |
| Material Moving | 16 (100.0%) | 0 (0.0%) |
| Total (Category) | 120 (82.2%) | 26 (17.8%) |
| Total (Overall) | 406 (58.7%) | 286 (41.3%) |
Employment Industries by Sex in Woodbranch
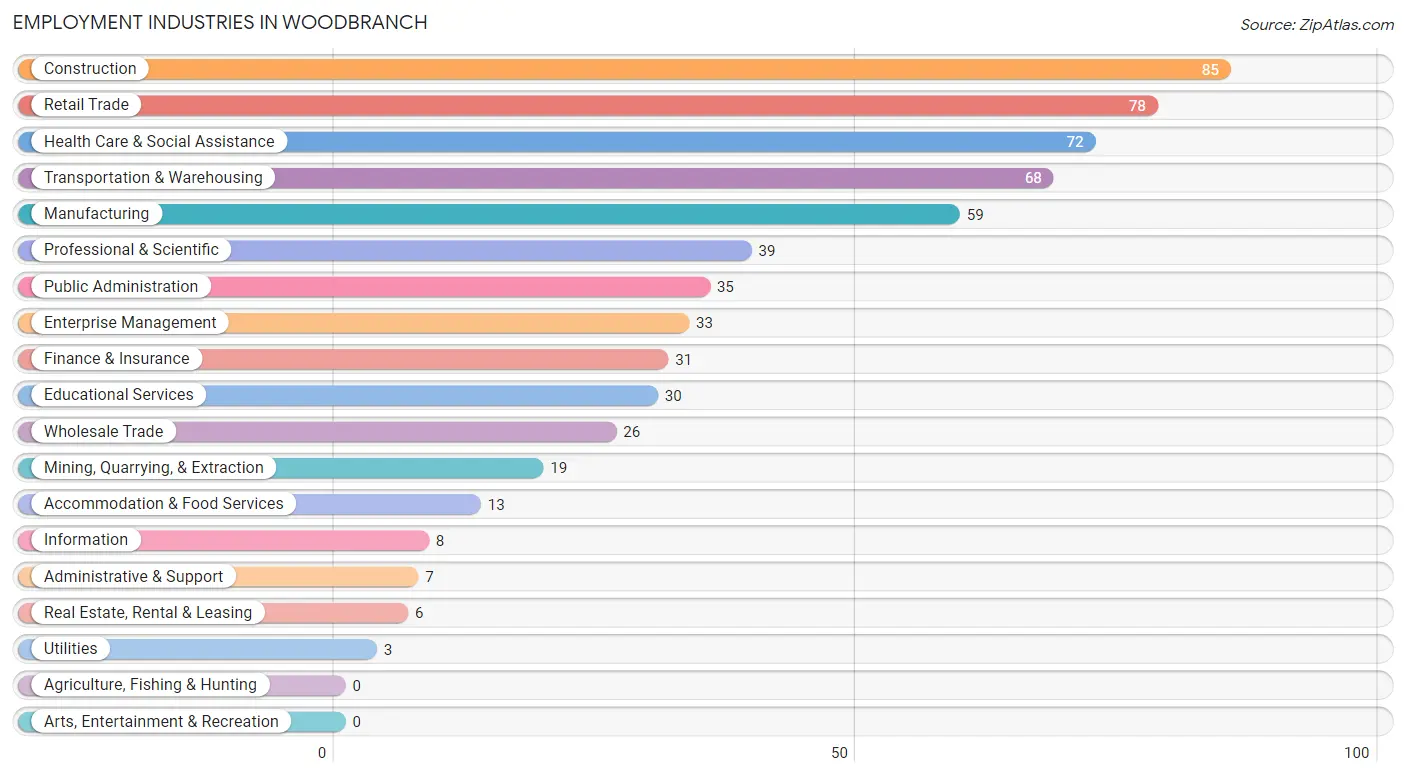
Employment Industries in Woodbranch
The major employment industries in Woodbranch include Construction (85 | 12.3%), Retail Trade (78 | 11.3%), Health Care & Social Assistance (72 | 10.4%), Transportation & Warehousing (68 | 9.8%), and Manufacturing (59 | 8.5%).
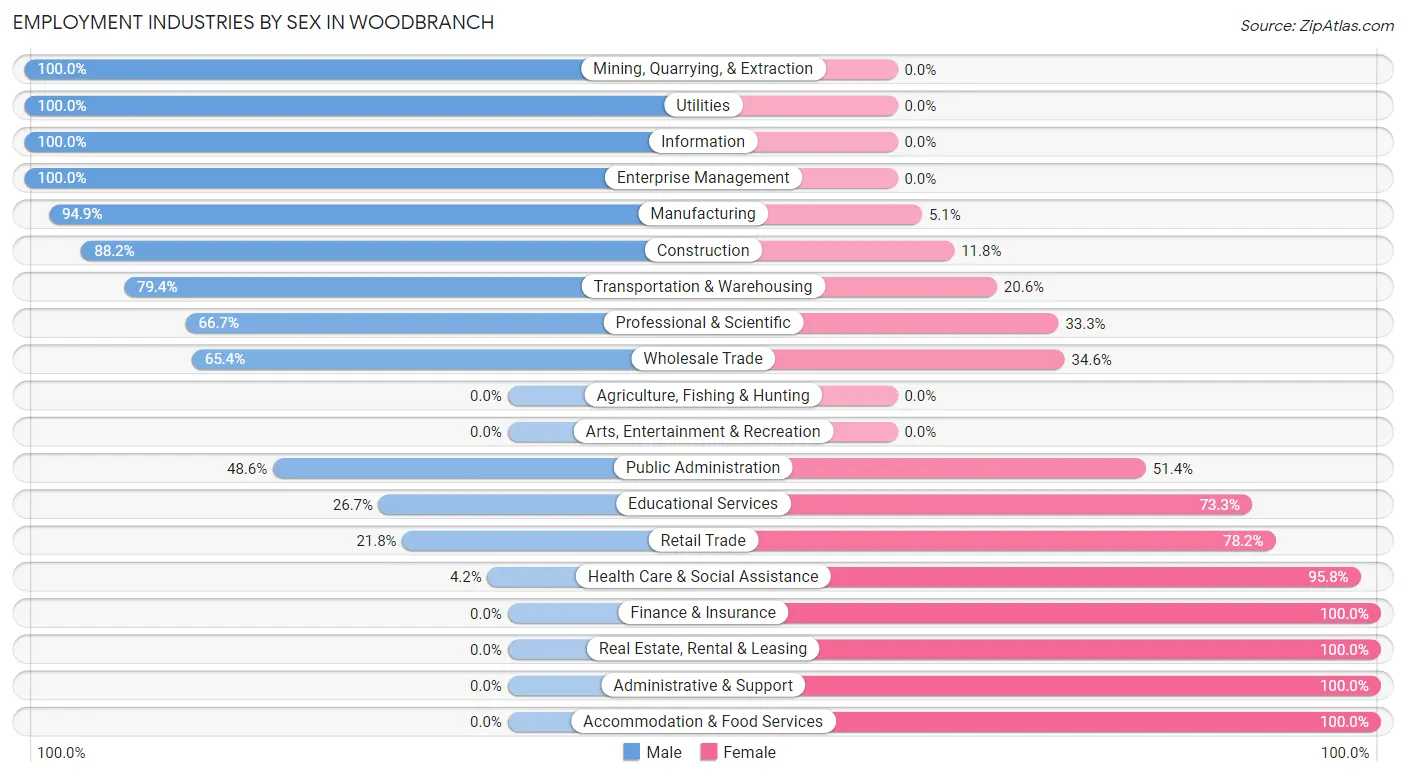
Employment Industries by Sex in Woodbranch
The Woodbranch industries that see more men than women are Mining, Quarrying, & Extraction (100.0%), Utilities (100.0%), and Information (100.0%), whereas the industries that tend to have a higher number of women are Finance & Insurance (100.0%), Real Estate, Rental & Leasing (100.0%), and Administrative & Support (100.0%).
| Industry | Male | Female |
| Agriculture, Fishing & Hunting | 0 (0.0%) | 0 (0.0%) |
| Mining, Quarrying, & Extraction | 19 (100.0%) | 0 (0.0%) |
| Construction | 75 (88.2%) | 10 (11.8%) |
| Manufacturing | 56 (94.9%) | 3 (5.1%) |
| Wholesale Trade | 17 (65.4%) | 9 (34.6%) |
| Retail Trade | 17 (21.8%) | 61 (78.2%) |
| Transportation & Warehousing | 54 (79.4%) | 14 (20.6%) |
| Utilities | 3 (100.0%) | 0 (0.0%) |
| Information | 8 (100.0%) | 0 (0.0%) |
| Finance & Insurance | 0 (0.0%) | 31 (100.0%) |
| Real Estate, Rental & Leasing | 0 (0.0%) | 6 (100.0%) |
| Professional & Scientific | 26 (66.7%) | 13 (33.3%) |
| Enterprise Management | 33 (100.0%) | 0 (0.0%) |
| Administrative & Support | 0 (0.0%) | 7 (100.0%) |
| Educational Services | 8 (26.7%) | 22 (73.3%) |
| Health Care & Social Assistance | 3 (4.2%) | 69 (95.8%) |
| Arts, Entertainment & Recreation | 0 (0.0%) | 0 (0.0%) |
| Accommodation & Food Services | 0 (0.0%) | 13 (100.0%) |
| Public Administration | 17 (48.6%) | 18 (51.4%) |
| Total | 406 (58.7%) | 286 (41.3%) |
Education in Woodbranch
School Enrollment in Woodbranch
The most common levels of schooling among the 458 students in Woodbranch are kindergarten (143 | 31.2%), middle school (128 | 28.0%), and elementary school (71 | 15.5%).
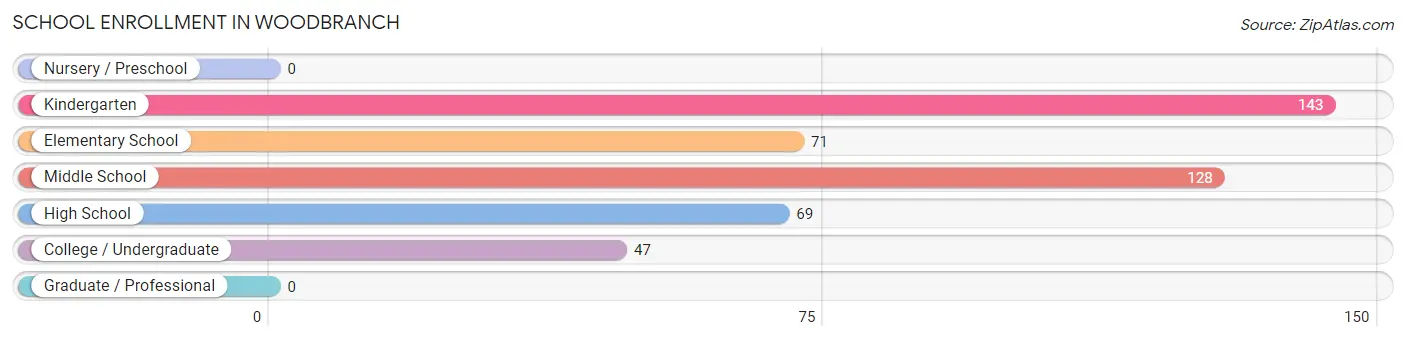
| School Level | # Students | % Students |
| Nursery / Preschool | 0 | 0.0% |
| Kindergarten | 143 | 31.2% |
| Elementary School | 71 | 15.5% |
| Middle School | 128 | 28.0% |
| High School | 69 | 15.1% |
| College / Undergraduate | 47 | 10.3% |
| Graduate / Professional | 0 | 0.0% |
| Total | 458 | 100.0% |
School Enrollment by Age by Funding Source in Woodbranch
Out of a total of 458 students who are enrolled in schools in Woodbranch, 47 (10.3%) attend a private institution, while the remaining 411 (89.7%) are enrolled in public schools. The age group of 35 years and over has the highest likelihood of being enrolled in private schools, with 7 (41.2% in the age bracket) enrolled. Conversely, the age group of 15 to 17 year olds has the lowest likelihood of being enrolled in a private school, with 46 (100.0% in the age bracket) attending a public institution.
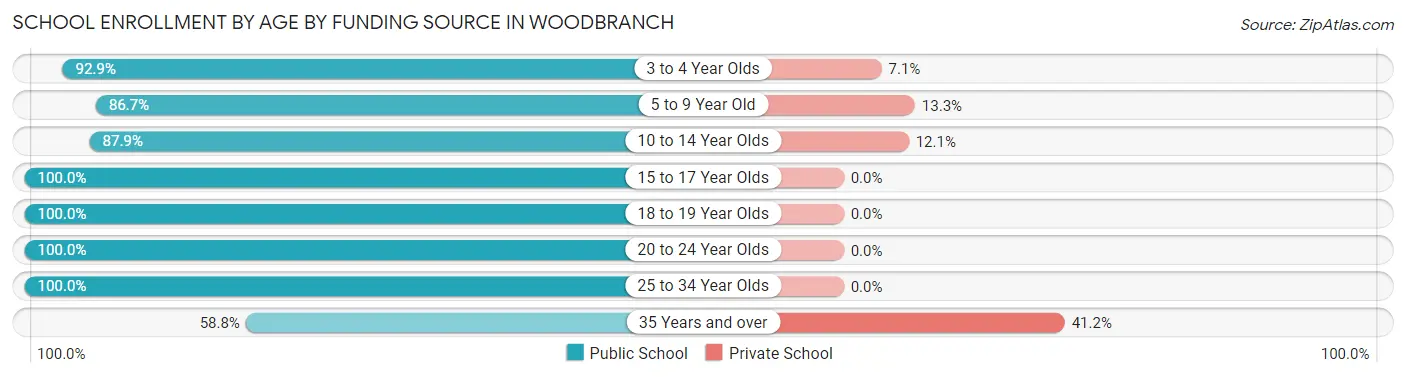
| Age Bracket | Public School | Private School |
| 3 to 4 Year Olds | 92 (92.9%) | 7 (7.1%) |
| 5 to 9 Year Old | 85 (86.7%) | 13 (13.3%) |
| 10 to 14 Year Olds | 145 (87.9%) | 20 (12.1%) |
| 15 to 17 Year Olds | 46 (100.0%) | 0 (0.0%) |
| 18 to 19 Year Olds | 12 (100.0%) | 0 (0.0%) |
| 20 to 24 Year Olds | 11 (100.0%) | 0 (0.0%) |
| 25 to 34 Year Olds | 10 (100.0%) | 0 (0.0%) |
| 35 Years and over | 10 (58.8%) | 7 (41.2%) |
| Total | 411 (89.7%) | 47 (10.3%) |
Educational Attainment by Field of Study in Woodbranch
Education (19 | 16.8%), science & technology (18 | 15.9%), communications (18 | 15.9%), business (15 | 13.3%), and visual & performing arts (14 | 12.4%) are the most common fields of study among 113 individuals in Woodbranch who have obtained a bachelor's degree or higher.
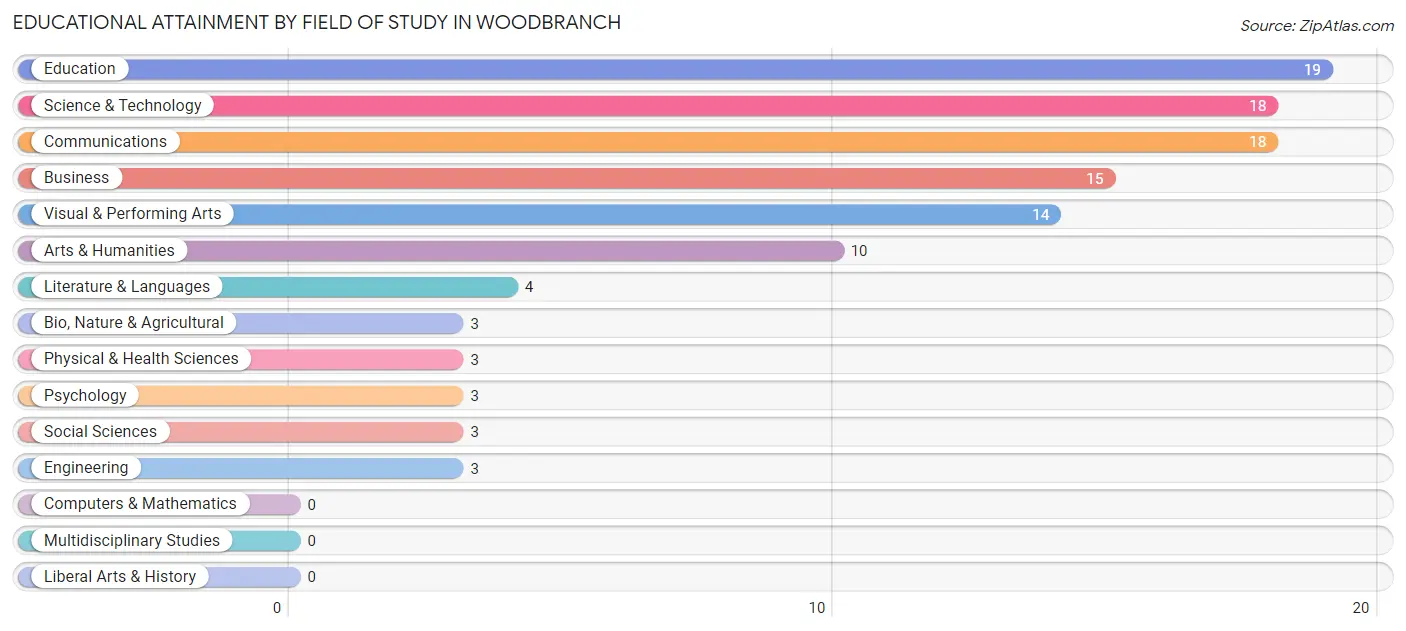
| Field of Study | # Graduates | % Graduates |
| Computers & Mathematics | 0 | 0.0% |
| Bio, Nature & Agricultural | 3 | 2.6% |
| Physical & Health Sciences | 3 | 2.6% |
| Psychology | 3 | 2.6% |
| Social Sciences | 3 | 2.6% |
| Engineering | 3 | 2.6% |
| Multidisciplinary Studies | 0 | 0.0% |
| Science & Technology | 18 | 15.9% |
| Business | 15 | 13.3% |
| Education | 19 | 16.8% |
| Literature & Languages | 4 | 3.5% |
| Liberal Arts & History | 0 | 0.0% |
| Visual & Performing Arts | 14 | 12.4% |
| Communications | 18 | 15.9% |
| Arts & Humanities | 10 | 8.8% |
| Total | 113 | 100.0% |
Transportation & Commute in Woodbranch
Vehicle Availability by Sex in Woodbranch
The most prevalent vehicle ownership categories in Woodbranch are males with 2 vehicles (195, accounting for 49.9%) and females with 2 vehicles (124, making up 68.9%).
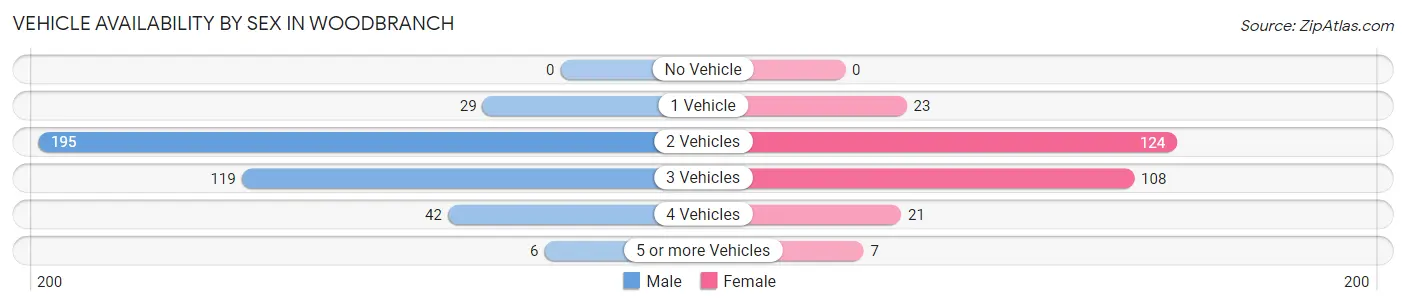
| Vehicles Available | Male | Female |
| No Vehicle | 0 (0.0%) | 0 (0.0%) |
| 1 Vehicle | 29 (7.4%) | 23 (8.1%) |
| 2 Vehicles | 195 (49.9%) | 124 (43.8%) |
| 3 Vehicles | 119 (30.4%) | 108 (38.2%) |
| 4 Vehicles | 42 (10.7%) | 21 (7.4%) |
| 5 or more Vehicles | 6 (1.5%) | 7 (2.5%) |
| Total | 391 (100.0%) | 283 (100.0%) |
Commute Time in Woodbranch
The most frequently occuring commute durations in Woodbranch are 60 to 89 minutes (130 commuters, 20.3%), 45 to 59 minutes (123 commuters, 19.2%), and 30 to 34 minutes (95 commuters, 14.8%).
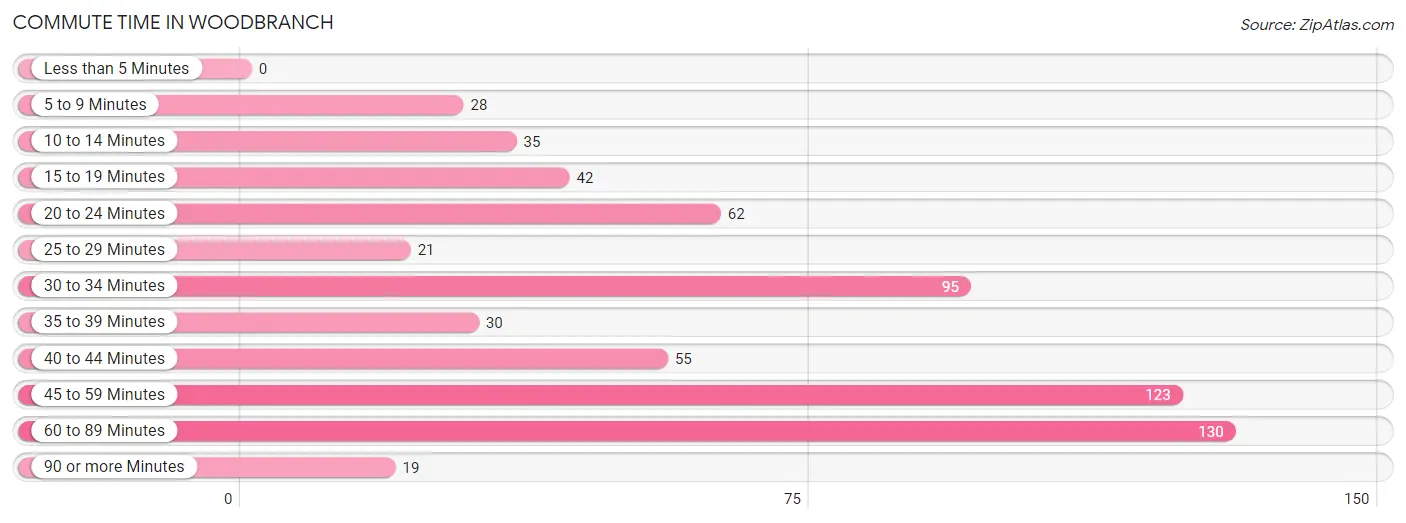
| Commute Time | # Commuters | % Commuters |
| Less than 5 Minutes | 0 | 0.0% |
| 5 to 9 Minutes | 28 | 4.4% |
| 10 to 14 Minutes | 35 | 5.5% |
| 15 to 19 Minutes | 42 | 6.6% |
| 20 to 24 Minutes | 62 | 9.7% |
| 25 to 29 Minutes | 21 | 3.3% |
| 30 to 34 Minutes | 95 | 14.8% |
| 35 to 39 Minutes | 30 | 4.7% |
| 40 to 44 Minutes | 55 | 8.6% |
| 45 to 59 Minutes | 123 | 19.2% |
| 60 to 89 Minutes | 130 | 20.3% |
| 90 or more Minutes | 19 | 3.0% |
Commute Time by Sex in Woodbranch
The most common commute times in Woodbranch are 45 to 59 minutes (96 commuters, 26.0%) for males and 20 to 24 minutes (51 commuters, 18.8%) for females.
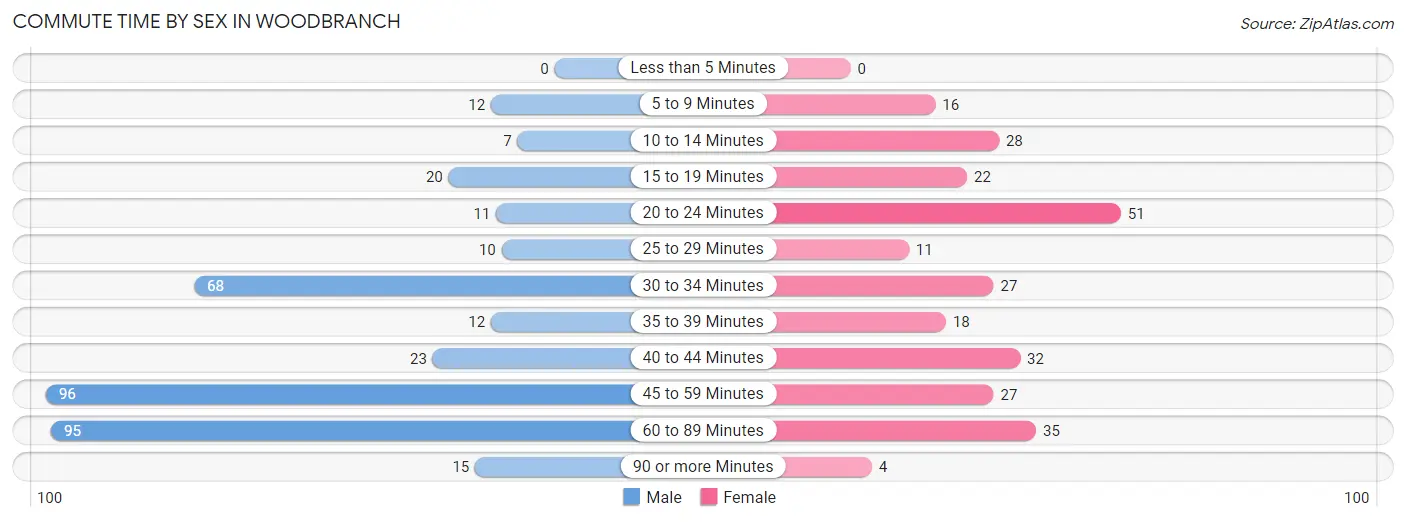
| Commute Time | Male | Female |
| Less than 5 Minutes | 0 (0.0%) | 0 (0.0%) |
| 5 to 9 Minutes | 12 (3.3%) | 16 (5.9%) |
| 10 to 14 Minutes | 7 (1.9%) | 28 (10.3%) |
| 15 to 19 Minutes | 20 (5.4%) | 22 (8.1%) |
| 20 to 24 Minutes | 11 (3.0%) | 51 (18.8%) |
| 25 to 29 Minutes | 10 (2.7%) | 11 (4.1%) |
| 30 to 34 Minutes | 68 (18.4%) | 27 (10.0%) |
| 35 to 39 Minutes | 12 (3.3%) | 18 (6.6%) |
| 40 to 44 Minutes | 23 (6.2%) | 32 (11.8%) |
| 45 to 59 Minutes | 96 (26.0%) | 27 (10.0%) |
| 60 to 89 Minutes | 95 (25.8%) | 35 (12.9%) |
| 90 or more Minutes | 15 (4.1%) | 4 (1.5%) |
Time of Departure to Work by Sex in Woodbranch
The most frequent times of departure to work in Woodbranch are 8:00 AM to 8:29 AM (86, 23.3%) for males and 9:00 AM to 9:59 AM (39, 14.4%) for females.
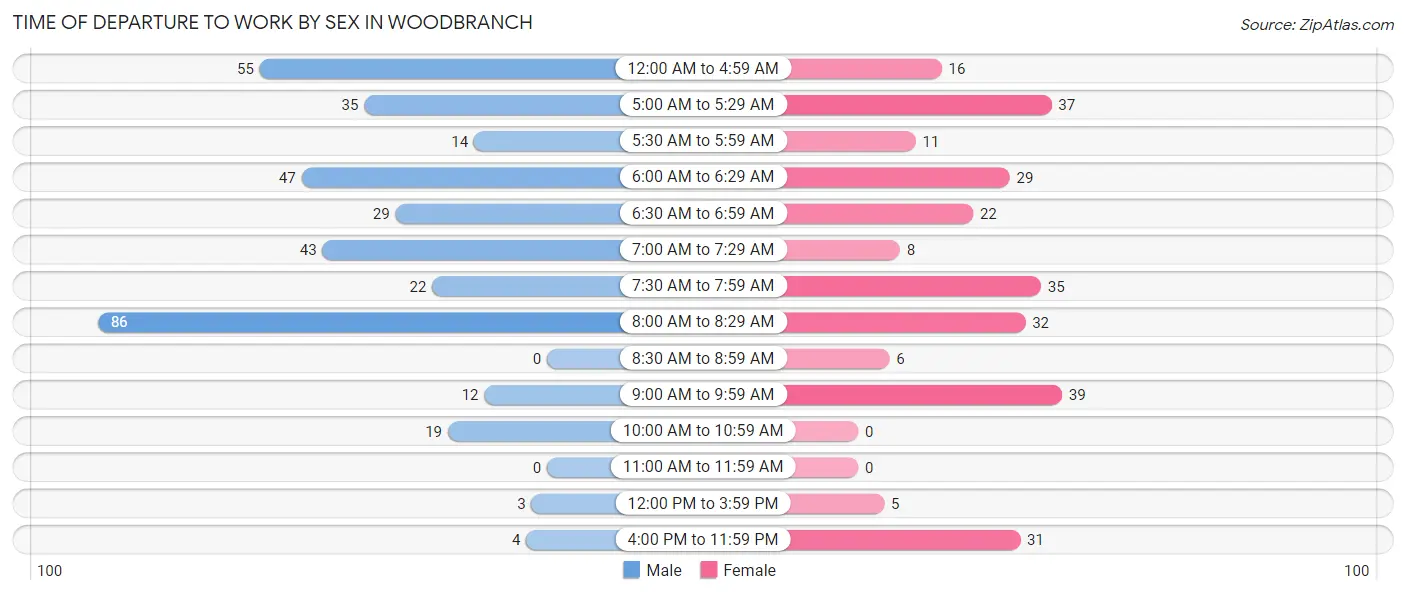
| Time of Departure | Male | Female |
| 12:00 AM to 4:59 AM | 55 (14.9%) | 16 (5.9%) |
| 5:00 AM to 5:29 AM | 35 (9.5%) | 37 (13.7%) |
| 5:30 AM to 5:59 AM | 14 (3.8%) | 11 (4.1%) |
| 6:00 AM to 6:29 AM | 47 (12.7%) | 29 (10.7%) |
| 6:30 AM to 6:59 AM | 29 (7.9%) | 22 (8.1%) |
| 7:00 AM to 7:29 AM | 43 (11.7%) | 8 (2.9%) |
| 7:30 AM to 7:59 AM | 22 (6.0%) | 35 (12.9%) |
| 8:00 AM to 8:29 AM | 86 (23.3%) | 32 (11.8%) |
| 8:30 AM to 8:59 AM | 0 (0.0%) | 6 (2.2%) |
| 9:00 AM to 9:59 AM | 12 (3.3%) | 39 (14.4%) |
| 10:00 AM to 10:59 AM | 19 (5.1%) | 0 (0.0%) |
| 11:00 AM to 11:59 AM | 0 (0.0%) | 0 (0.0%) |
| 12:00 PM to 3:59 PM | 3 (0.8%) | 5 (1.8%) |
| 4:00 PM to 11:59 PM | 4 (1.1%) | 31 (11.4%) |
| Total | 369 (100.0%) | 271 (100.0%) |
Housing Occupancy in Woodbranch
Occupancy by Ownership in Woodbranch
Of the total 518 dwellings in Woodbranch, owner-occupied units account for 477 (92.1%), while renter-occupied units make up 41 (7.9%).
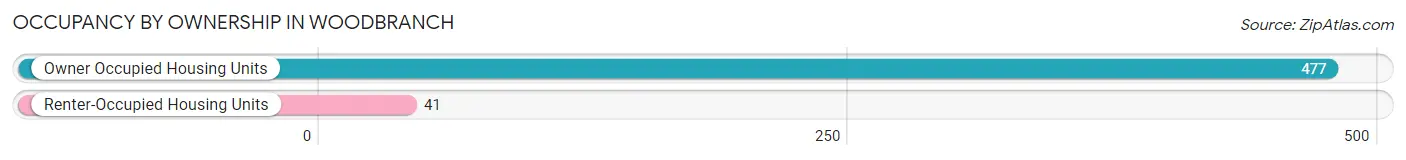
| Occupancy | # Housing Units | % Housing Units |
| Owner Occupied Housing Units | 477 | 92.1% |
| Renter-Occupied Housing Units | 41 | 7.9% |
| Total Occupied Housing Units | 518 | 100.0% |
Occupancy by Household Size in Woodbranch
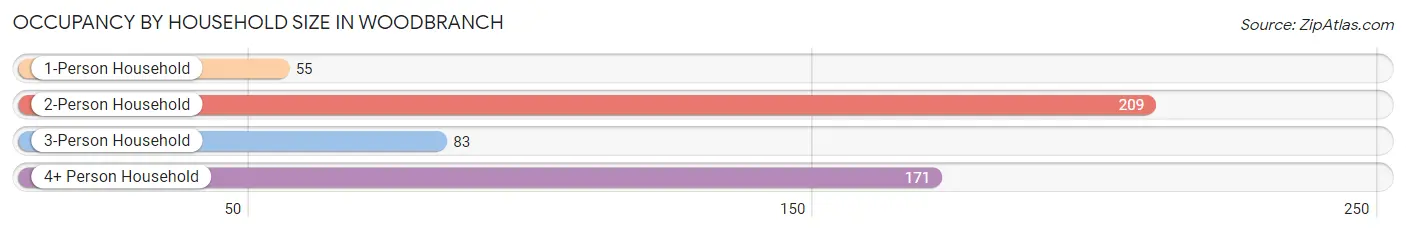
| Household Size | # Housing Units | % Housing Units |
| 1-Person Household | 55 | 10.6% |
| 2-Person Household | 209 | 40.4% |
| 3-Person Household | 83 | 16.0% |
| 4+ Person Household | 171 | 33.0% |
| Total Housing Units | 518 | 100.0% |
Occupancy by Ownership by Household Size in Woodbranch
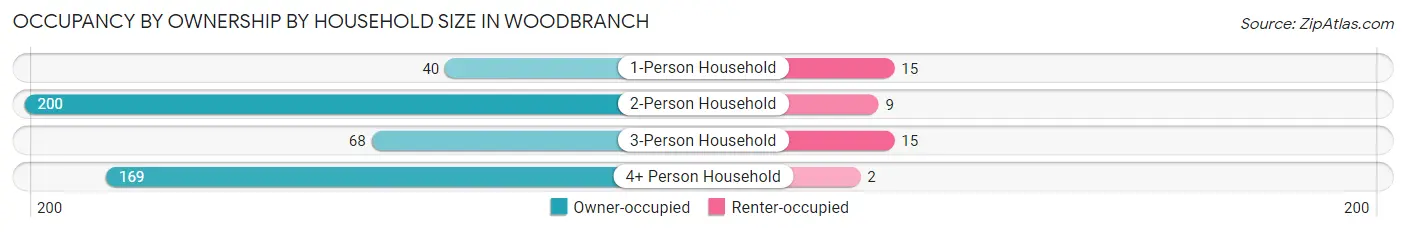
| Household Size | Owner-occupied | Renter-occupied |
| 1-Person Household | 40 (72.7%) | 15 (27.3%) |
| 2-Person Household | 200 (95.7%) | 9 (4.3%) |
| 3-Person Household | 68 (81.9%) | 15 (18.1%) |
| 4+ Person Household | 169 (98.8%) | 2 (1.2%) |
| Total Housing Units | 477 (92.1%) | 41 (7.9%) |
Occupancy by Educational Attainment in Woodbranch
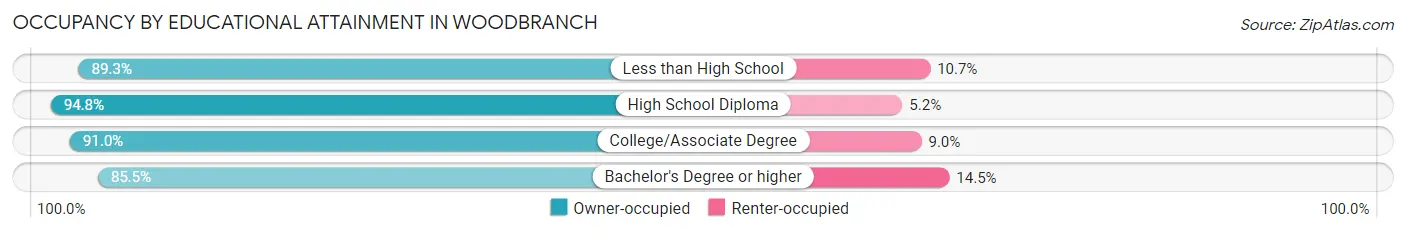
| Household Size | Owner-occupied | Renter-occupied |
| Less than High School | 25 (89.3%) | 3 (10.7%) |
| High School Diploma | 237 (94.8%) | 13 (5.2%) |
| College/Associate Degree | 162 (91.0%) | 16 (9.0%) |
| Bachelor's Degree or higher | 53 (85.5%) | 9 (14.5%) |
Occupancy by Age of Householder in Woodbranch
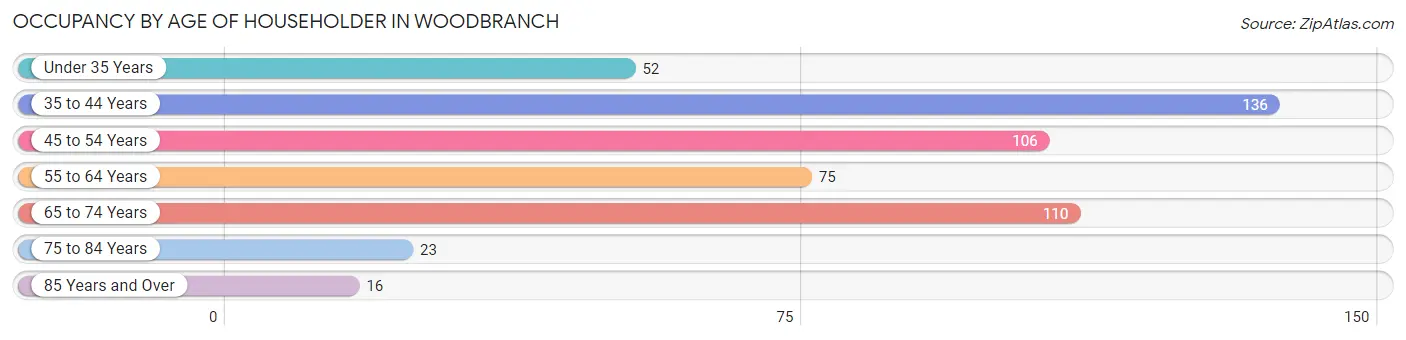
| Age Bracket | # Households | % Households |
| Under 35 Years | 52 | 10.0% |
| 35 to 44 Years | 136 | 26.3% |
| 45 to 54 Years | 106 | 20.5% |
| 55 to 64 Years | 75 | 14.5% |
| 65 to 74 Years | 110 | 21.2% |
| 75 to 84 Years | 23 | 4.4% |
| 85 Years and Over | 16 | 3.1% |
| Total | 518 | 100.0% |
Housing Finances in Woodbranch
Median Income by Occupancy in Woodbranch
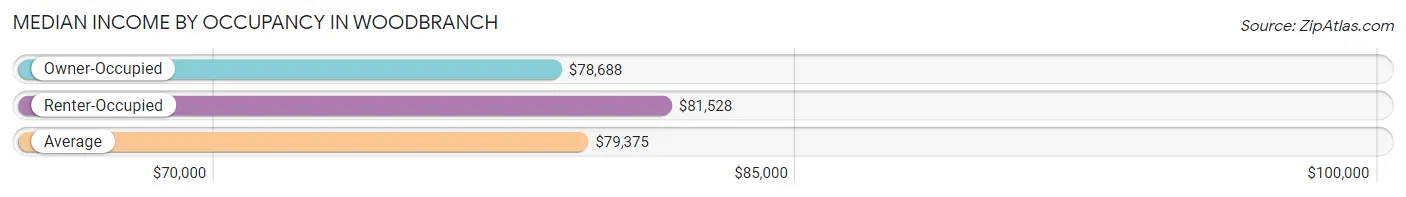
| Occupancy Type | # Households | Median Income |
| Owner-Occupied | 477 (92.1%) | $78,688 |
| Renter-Occupied | 41 (7.9%) | $81,528 |
| Average | 518 (100.0%) | $79,375 |
Occupancy by Householder Income Bracket in Woodbranch
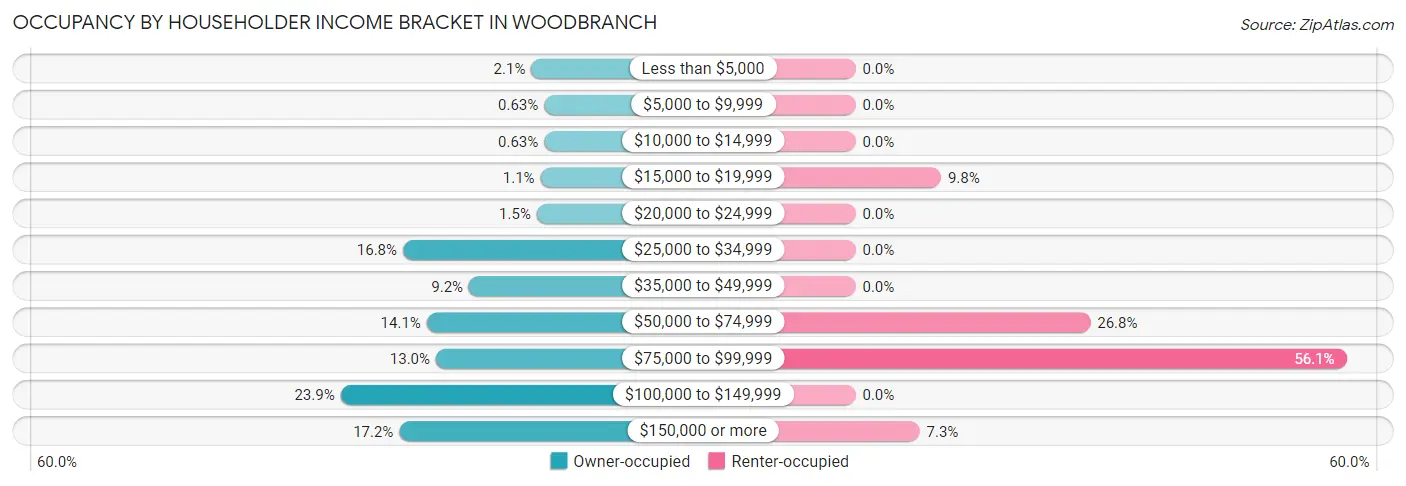
| Income Bracket | Owner-occupied | Renter-occupied |
| Less than $5,000 | 10 (2.1%) | 0 (0.0%) |
| $5,000 to $9,999 | 3 (0.6%) | 0 (0.0%) |
| $10,000 to $14,999 | 3 (0.6%) | 0 (0.0%) |
| $15,000 to $19,999 | 5 (1.1%) | 4 (9.8%) |
| $20,000 to $24,999 | 7 (1.5%) | 0 (0.0%) |
| $25,000 to $34,999 | 80 (16.8%) | 0 (0.0%) |
| $35,000 to $49,999 | 44 (9.2%) | 0 (0.0%) |
| $50,000 to $74,999 | 67 (14.1%) | 11 (26.8%) |
| $75,000 to $99,999 | 62 (13.0%) | 23 (56.1%) |
| $100,000 to $149,999 | 114 (23.9%) | 0 (0.0%) |
| $150,000 or more | 82 (17.2%) | 3 (7.3%) |
| Total | 477 (100.0%) | 41 (100.0%) |
Monthly Housing Cost Tiers in Woodbranch
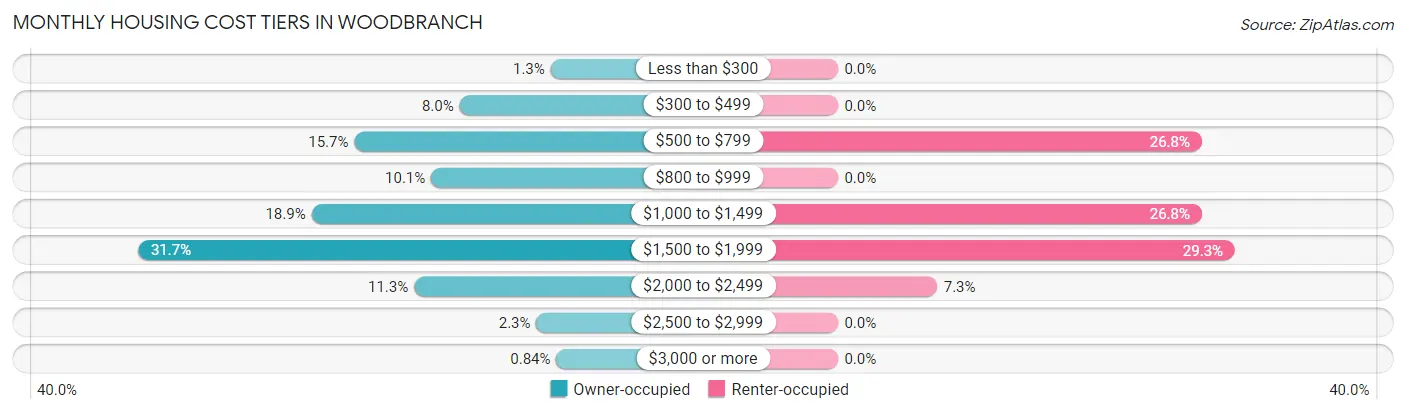
| Monthly Cost | Owner-occupied | Renter-occupied |
| Less than $300 | 6 (1.3%) | 0 (0.0%) |
| $300 to $499 | 38 (8.0%) | 0 (0.0%) |
| $500 to $799 | 75 (15.7%) | 11 (26.8%) |
| $800 to $999 | 48 (10.1%) | 0 (0.0%) |
| $1,000 to $1,499 | 90 (18.9%) | 11 (26.8%) |
| $1,500 to $1,999 | 151 (31.7%) | 12 (29.3%) |
| $2,000 to $2,499 | 54 (11.3%) | 3 (7.3%) |
| $2,500 to $2,999 | 11 (2.3%) | 0 (0.0%) |
| $3,000 or more | 4 (0.8%) | 0 (0.0%) |
| Total | 477 (100.0%) | 41 (100.0%) |
Physical Housing Characteristics in Woodbranch
Housing Structures in Woodbranch
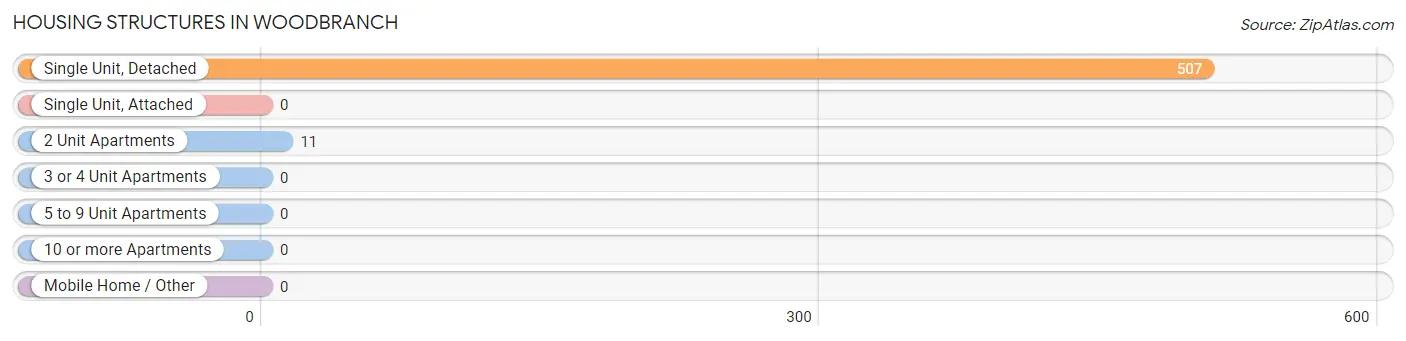
| Structure Type | # Housing Units | % Housing Units |
| Single Unit, Detached | 507 | 97.9% |
| Single Unit, Attached | 0 | 0.0% |
| 2 Unit Apartments | 11 | 2.1% |
| 3 or 4 Unit Apartments | 0 | 0.0% |
| 5 to 9 Unit Apartments | 0 | 0.0% |
| 10 or more Apartments | 0 | 0.0% |
| Mobile Home / Other | 0 | 0.0% |
| Total | 518 | 100.0% |
Housing Structures by Occupancy in Woodbranch
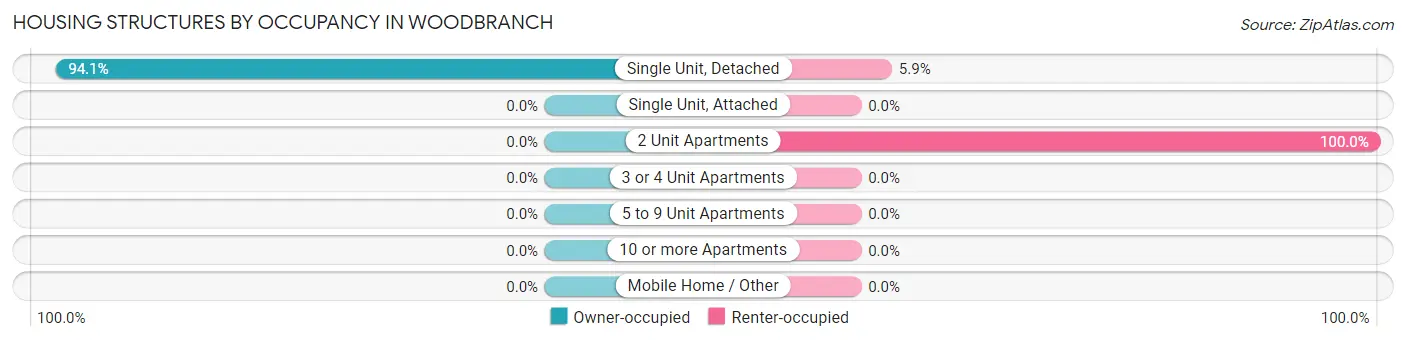
| Structure Type | Owner-occupied | Renter-occupied |
| Single Unit, Detached | 477 (94.1%) | 30 (5.9%) |
| Single Unit, Attached | 0 (0.0%) | 0 (0.0%) |
| 2 Unit Apartments | 0 (0.0%) | 11 (100.0%) |
| 3 or 4 Unit Apartments | 0 (0.0%) | 0 (0.0%) |
| 5 to 9 Unit Apartments | 0 (0.0%) | 0 (0.0%) |
| 10 or more Apartments | 0 (0.0%) | 0 (0.0%) |
| Mobile Home / Other | 0 (0.0%) | 0 (0.0%) |
| Total | 477 (92.1%) | 41 (7.9%) |
Housing Structures by Number of Rooms in Woodbranch
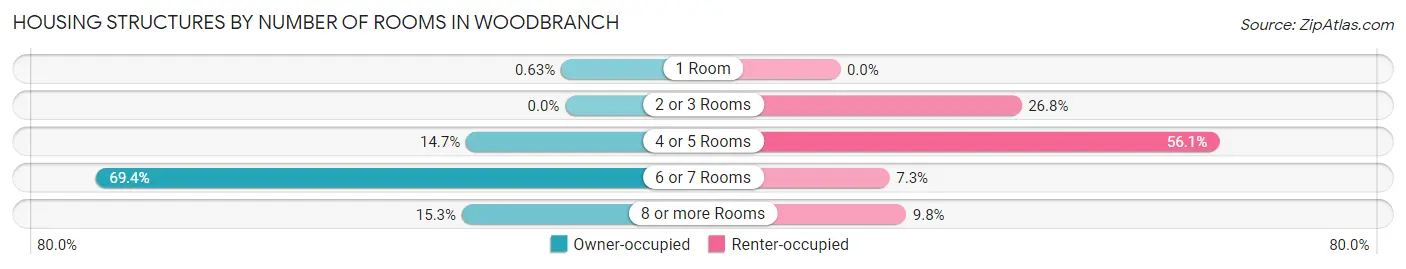
| Number of Rooms | Owner-occupied | Renter-occupied |
| 1 Room | 3 (0.6%) | 0 (0.0%) |
| 2 or 3 Rooms | 0 (0.0%) | 11 (26.8%) |
| 4 or 5 Rooms | 70 (14.7%) | 23 (56.1%) |
| 6 or 7 Rooms | 331 (69.4%) | 3 (7.3%) |
| 8 or more Rooms | 73 (15.3%) | 4 (9.8%) |
| Total | 477 (100.0%) | 41 (100.0%) |
Housing Structure by Heating Type in Woodbranch
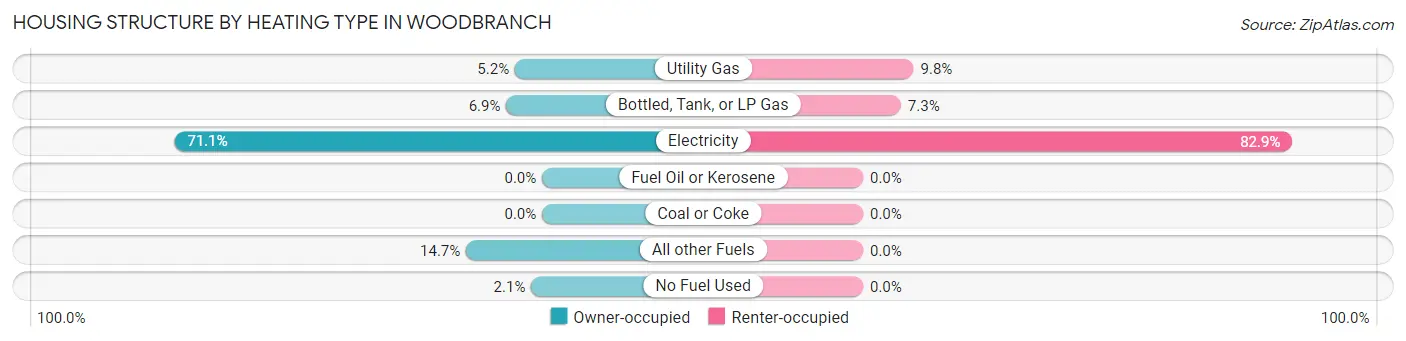
| Heating Type | Owner-occupied | Renter-occupied |
| Utility Gas | 25 (5.2%) | 4 (9.8%) |
| Bottled, Tank, or LP Gas | 33 (6.9%) | 3 (7.3%) |
| Electricity | 339 (71.1%) | 34 (82.9%) |
| Fuel Oil or Kerosene | 0 (0.0%) | 0 (0.0%) |
| Coal or Coke | 0 (0.0%) | 0 (0.0%) |
| All other Fuels | 70 (14.7%) | 0 (0.0%) |
| No Fuel Used | 10 (2.1%) | 0 (0.0%) |
| Total | 477 (100.0%) | 41 (100.0%) |
Household Vehicle Usage in Woodbranch
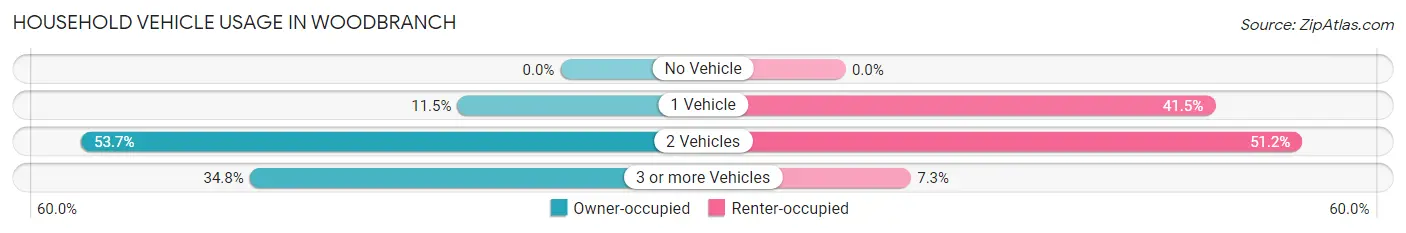
| Vehicles per Household | Owner-occupied | Renter-occupied |
| No Vehicle | 0 (0.0%) | 0 (0.0%) |
| 1 Vehicle | 55 (11.5%) | 17 (41.5%) |
| 2 Vehicles | 256 (53.7%) | 21 (51.2%) |
| 3 or more Vehicles | 166 (34.8%) | 3 (7.3%) |
| Total | 477 (100.0%) | 41 (100.0%) |
Real Estate & Mortgages in Woodbranch
Real Estate and Mortgage Overview in Woodbranch
| Characteristic | Without Mortgage | With Mortgage |
| Housing Units | 180 | 297 |
| Median Property Value | $216,100 | $250,600 |
| Median Household Income | $69,250 | $70 |
| Monthly Housing Costs | $747 | $4 |
| Real Estate Taxes | $2,800 | $7 |
Property Value by Mortgage Status in Woodbranch
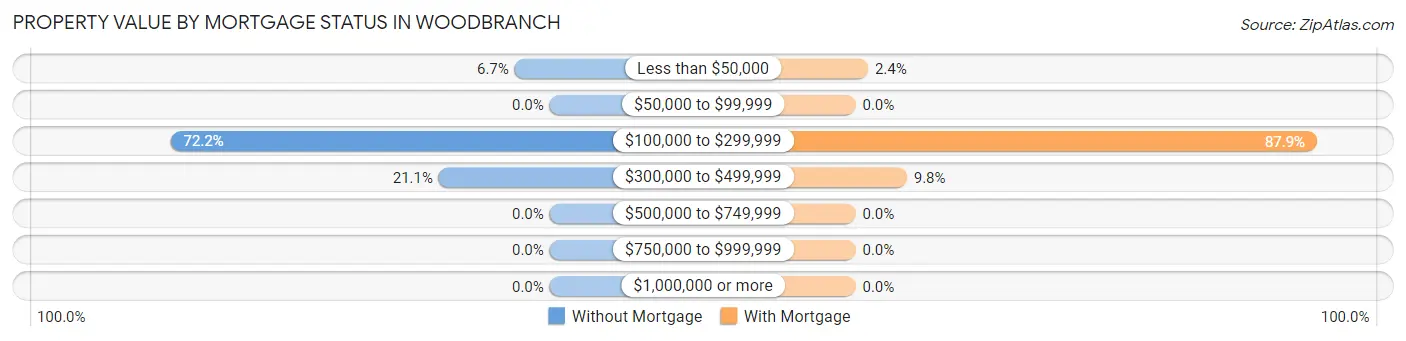
| Property Value | Without Mortgage | With Mortgage |
| Less than $50,000 | 12 (6.7%) | 7 (2.4%) |
| $50,000 to $99,999 | 0 (0.0%) | 0 (0.0%) |
| $100,000 to $299,999 | 130 (72.2%) | 261 (87.9%) |
| $300,000 to $499,999 | 38 (21.1%) | 29 (9.8%) |
| $500,000 to $749,999 | 0 (0.0%) | 0 (0.0%) |
| $750,000 to $999,999 | 0 (0.0%) | 0 (0.0%) |
| $1,000,000 or more | 0 (0.0%) | 0 (0.0%) |
| Total | 180 (100.0%) | 297 (100.0%) |
Household Income by Mortgage Status in Woodbranch
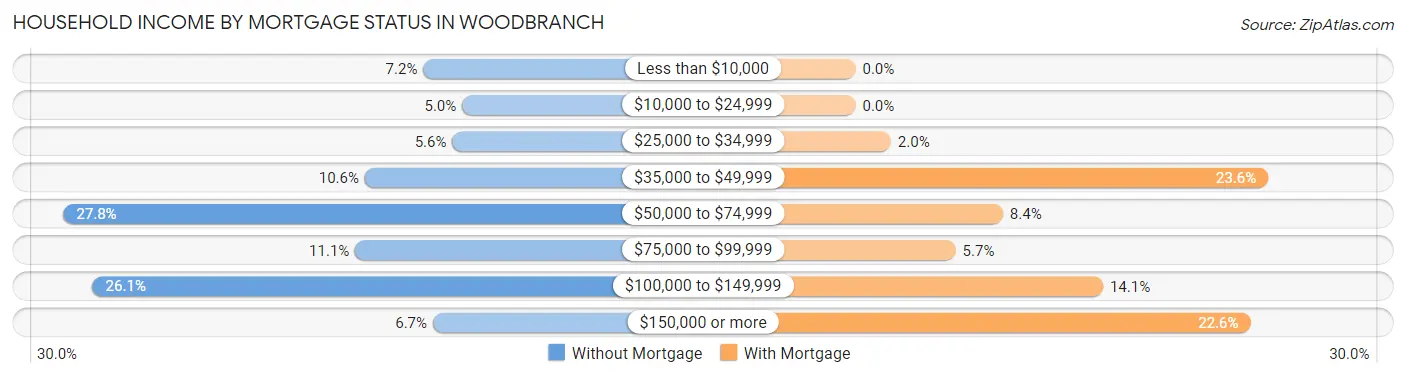
| Household Income | Without Mortgage | With Mortgage |
| Less than $10,000 | 13 (7.2%) | 0 (0.0%) |
| $10,000 to $24,999 | 9 (5.0%) | 0 (0.0%) |
| $25,000 to $34,999 | 10 (5.6%) | 6 (2.0%) |
| $35,000 to $49,999 | 19 (10.6%) | 70 (23.6%) |
| $50,000 to $74,999 | 50 (27.8%) | 25 (8.4%) |
| $75,000 to $99,999 | 20 (11.1%) | 17 (5.7%) |
| $100,000 to $149,999 | 47 (26.1%) | 42 (14.1%) |
| $150,000 or more | 12 (6.7%) | 67 (22.6%) |
| Total | 180 (100.0%) | 297 (100.0%) |
Property Value to Household Income Ratio in Woodbranch
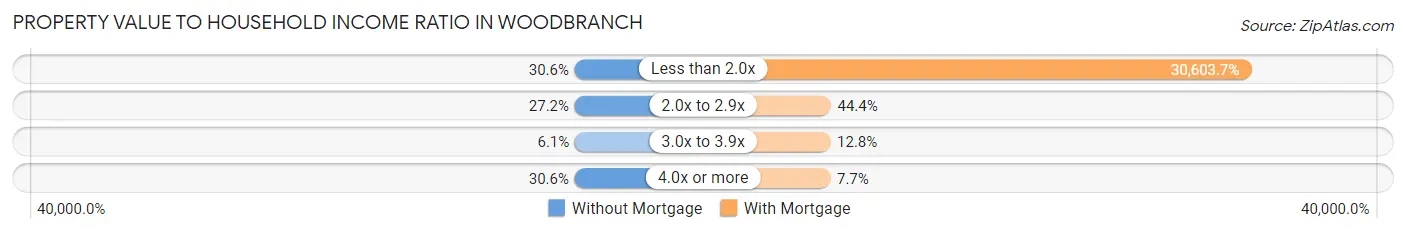
| Value-to-Income Ratio | Without Mortgage | With Mortgage |
| Less than 2.0x | 55 (30.6%) | 90,893 (30,603.7%) |
| 2.0x to 2.9x | 49 (27.2%) | 132 (44.4%) |
| 3.0x to 3.9x | 11 (6.1%) | 38 (12.8%) |
| 4.0x or more | 55 (30.6%) | 23 (7.7%) |
| Total | 180 (100.0%) | 297 (100.0%) |
Real Estate Taxes by Mortgage Status in Woodbranch
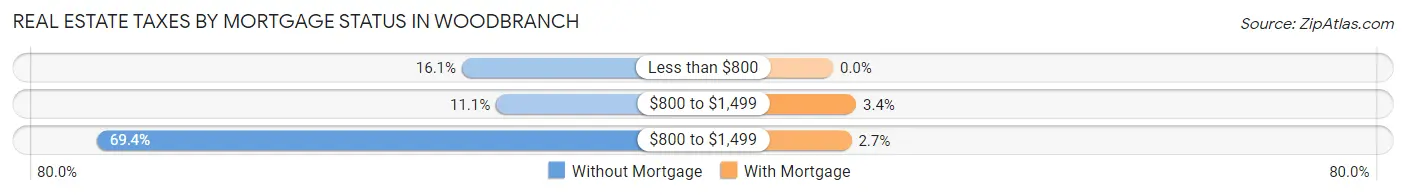
| Property Taxes | Without Mortgage | With Mortgage |
| Less than $800 | 29 (16.1%) | 0 (0.0%) |
| $800 to $1,499 | 20 (11.1%) | 10 (3.4%) |
| $800 to $1,499 | 125 (69.4%) | 8 (2.7%) |
| Total | 180 (100.0%) | 297 (100.0%) |
Health & Disability in Woodbranch
Health Insurance Coverage by Age in Woodbranch
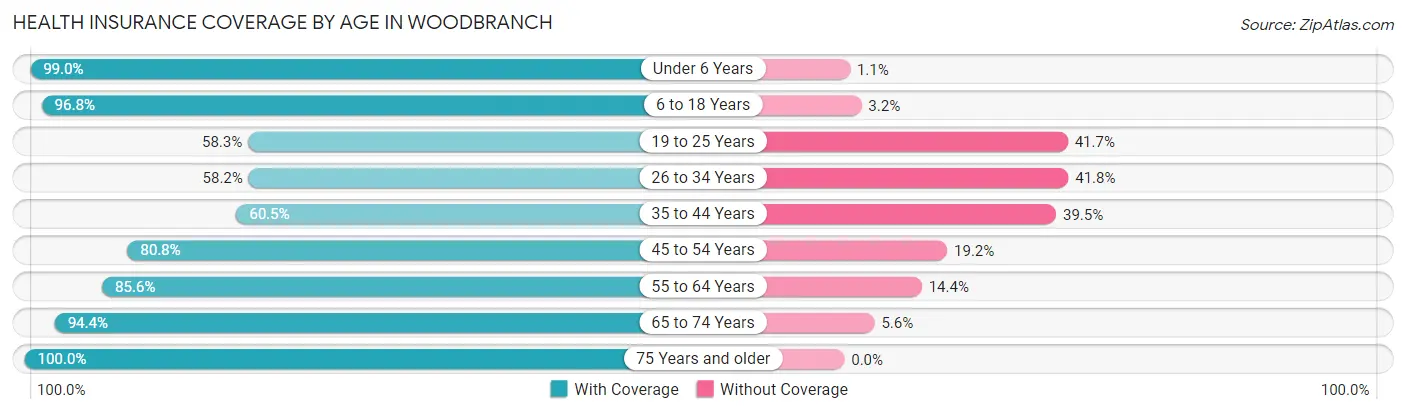
| Age Bracket | With Coverage | Without Coverage |
| Under 6 Years | 283 (99.0%) | 3 (1.1%) |
| 6 to 18 Years | 273 (96.8%) | 9 (3.2%) |
| 19 to 25 Years | 56 (58.3%) | 40 (41.7%) |
| 26 to 34 Years | 92 (58.2%) | 66 (41.8%) |
| 35 to 44 Years | 118 (60.5%) | 77 (39.5%) |
| 45 to 54 Years | 156 (80.8%) | 37 (19.2%) |
| 55 to 64 Years | 154 (85.6%) | 26 (14.4%) |
| 65 to 74 Years | 151 (94.4%) | 9 (5.6%) |
| 75 Years and older | 64 (100.0%) | 0 (0.0%) |
| Total | 1,347 (83.5%) | 267 (16.5%) |
Health Insurance Coverage by Citizenship Status in Woodbranch
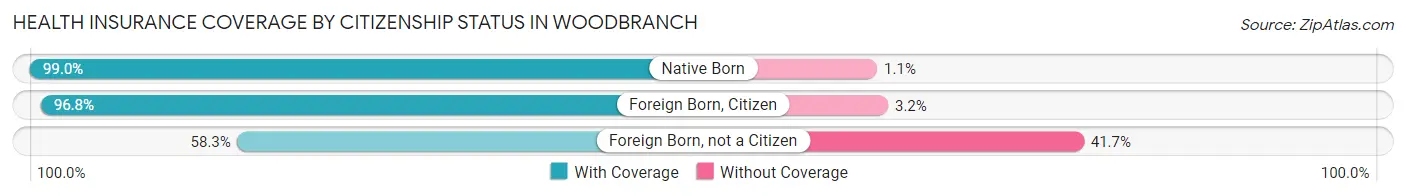
| Citizenship Status | With Coverage | Without Coverage |
| Native Born | 283 (99.0%) | 3 (1.1%) |
| Foreign Born, Citizen | 273 (96.8%) | 9 (3.2%) |
| Foreign Born, not a Citizen | 56 (58.3%) | 40 (41.7%) |
Health Insurance Coverage by Household Income in Woodbranch
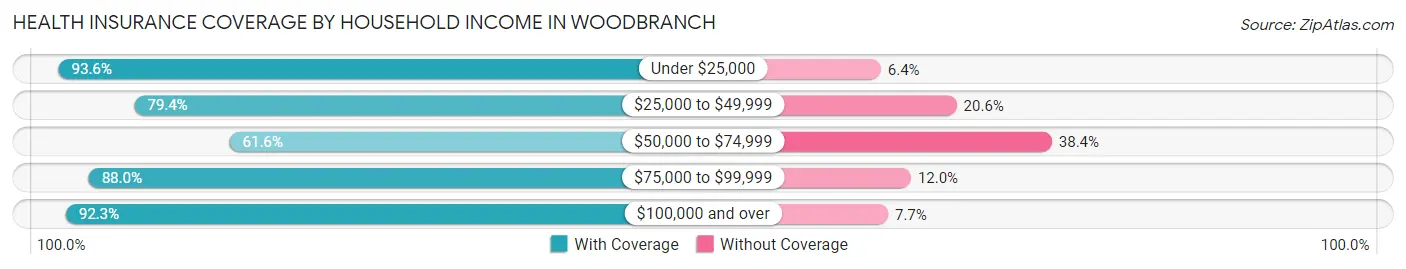
| Household Income | With Coverage | Without Coverage |
| Under $25,000 | 44 (93.6%) | 3 (6.4%) |
| $25,000 to $49,999 | 436 (79.4%) | 113 (20.6%) |
| $50,000 to $74,999 | 125 (61.6%) | 78 (38.4%) |
| $75,000 to $99,999 | 205 (88.0%) | 28 (12.0%) |
| $100,000 and over | 537 (92.3%) | 45 (7.7%) |
Public vs Private Health Insurance Coverage by Age in Woodbranch
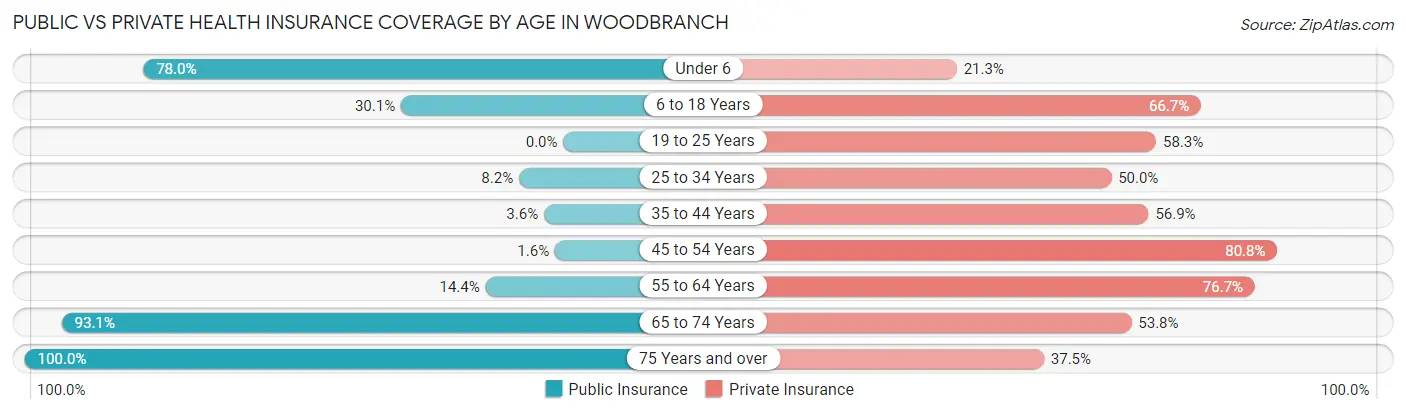
| Age Bracket | Public Insurance | Private Insurance |
| Under 6 | 223 (78.0%) | 61 (21.3%) |
| 6 to 18 Years | 85 (30.1%) | 188 (66.7%) |
| 19 to 25 Years | 0 (0.0%) | 56 (58.3%) |
| 25 to 34 Years | 13 (8.2%) | 79 (50.0%) |
| 35 to 44 Years | 7 (3.6%) | 111 (56.9%) |
| 45 to 54 Years | 3 (1.5%) | 156 (80.8%) |
| 55 to 64 Years | 26 (14.4%) | 138 (76.7%) |
| 65 to 74 Years | 149 (93.1%) | 86 (53.7%) |
| 75 Years and over | 64 (100.0%) | 24 (37.5%) |
| Total | 570 (35.3%) | 899 (55.7%) |
Disability Status by Sex by Age in Woodbranch
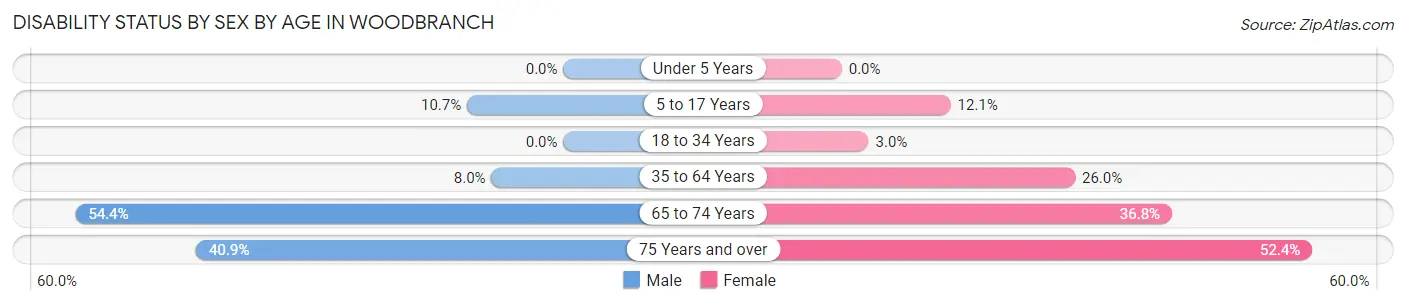
| Age Bracket | Male | Female |
| Under 5 Years | 0 (0.0%) | 0 (0.0%) |
| 5 to 17 Years | 19 (10.7%) | 16 (12.1%) |
| 18 to 34 Years | 0 (0.0%) | 5 (3.0%) |
| 35 to 64 Years | 23 (8.0%) | 73 (26.0%) |
| 65 to 74 Years | 50 (54.3%) | 25 (36.8%) |
| 75 Years and over | 9 (40.9%) | 22 (52.4%) |
Disability Class by Sex by Age in Woodbranch
Disability Class: Hearing Difficulty
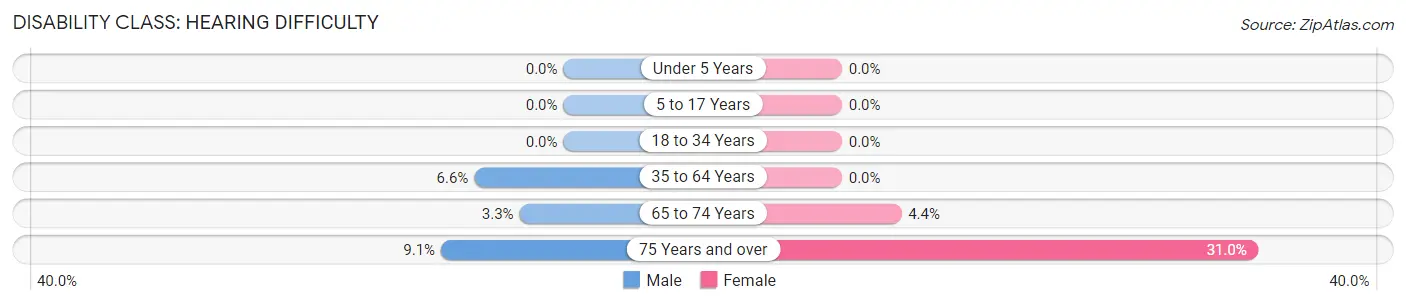
| Age Bracket | Male | Female |
| Under 5 Years | 0 (0.0%) | 0 (0.0%) |
| 5 to 17 Years | 0 (0.0%) | 0 (0.0%) |
| 18 to 34 Years | 0 (0.0%) | 0 (0.0%) |
| 35 to 64 Years | 19 (6.6%) | 0 (0.0%) |
| 65 to 74 Years | 3 (3.3%) | 3 (4.4%) |
| 75 Years and over | 2 (9.1%) | 13 (30.9%) |
Disability Class: Vision Difficulty
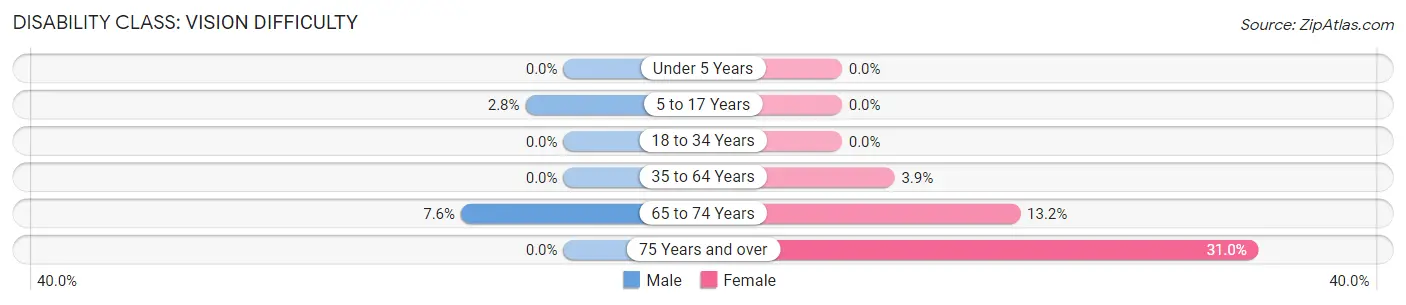
| Age Bracket | Male | Female |
| Under 5 Years | 0 (0.0%) | 0 (0.0%) |
| 5 to 17 Years | 5 (2.8%) | 0 (0.0%) |
| 18 to 34 Years | 0 (0.0%) | 0 (0.0%) |
| 35 to 64 Years | 0 (0.0%) | 11 (3.9%) |
| 65 to 74 Years | 7 (7.6%) | 9 (13.2%) |
| 75 Years and over | 0 (0.0%) | 13 (30.9%) |
Disability Class: Cognitive Difficulty
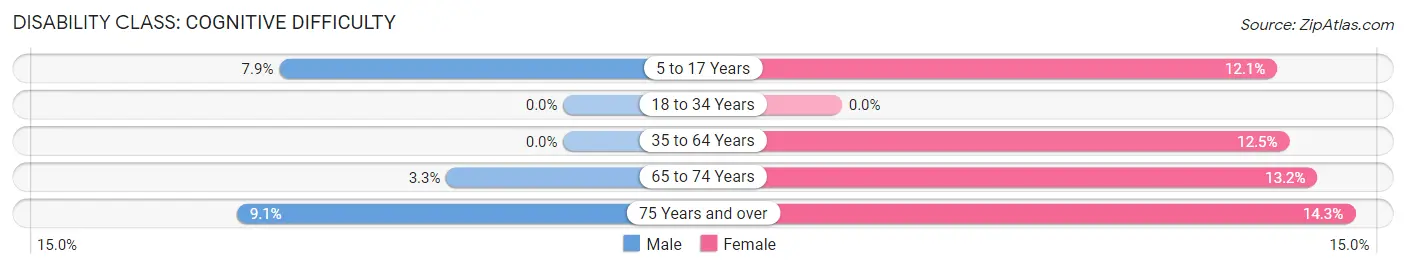
| Age Bracket | Male | Female |
| 5 to 17 Years | 14 (7.9%) | 16 (12.1%) |
| 18 to 34 Years | 0 (0.0%) | 0 (0.0%) |
| 35 to 64 Years | 0 (0.0%) | 35 (12.5%) |
| 65 to 74 Years | 3 (3.3%) | 9 (13.2%) |
| 75 Years and over | 2 (9.1%) | 6 (14.3%) |
Disability Class: Ambulatory Difficulty
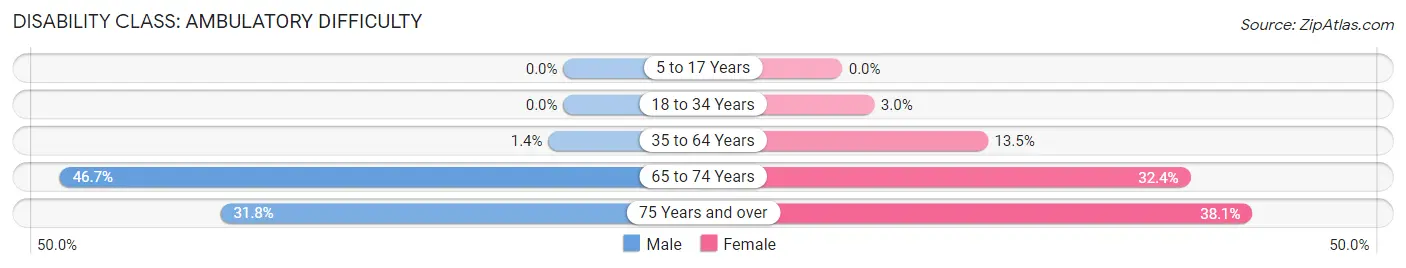
| Age Bracket | Male | Female |
| 5 to 17 Years | 0 (0.0%) | 0 (0.0%) |
| 18 to 34 Years | 0 (0.0%) | 5 (3.0%) |
| 35 to 64 Years | 4 (1.4%) | 38 (13.5%) |
| 65 to 74 Years | 43 (46.7%) | 22 (32.4%) |
| 75 Years and over | 7 (31.8%) | 16 (38.1%) |
Disability Class: Self-Care Difficulty
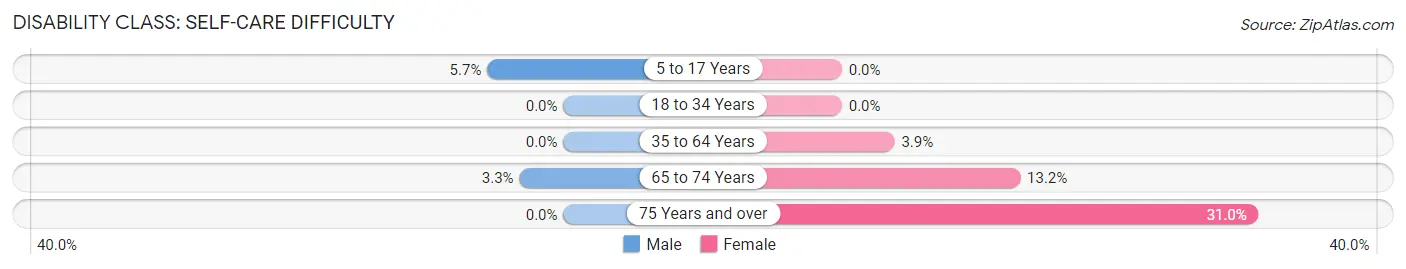
| Age Bracket | Male | Female |
| 5 to 17 Years | 10 (5.7%) | 0 (0.0%) |
| 18 to 34 Years | 0 (0.0%) | 0 (0.0%) |
| 35 to 64 Years | 0 (0.0%) | 11 (3.9%) |
| 65 to 74 Years | 3 (3.3%) | 9 (13.2%) |
| 75 Years and over | 0 (0.0%) | 13 (30.9%) |
Technology Access in Woodbranch
Computing Device Access in Woodbranch
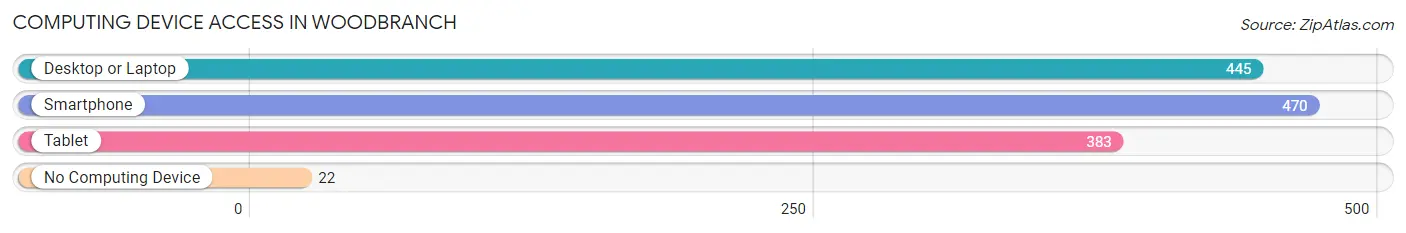
| Device Type | # Households | % Households |
| Desktop or Laptop | 445 | 85.9% |
| Smartphone | 470 | 90.7% |
| Tablet | 383 | 73.9% |
| No Computing Device | 22 | 4.3% |
| Total | 518 | 100.0% |
Internet Access in Woodbranch
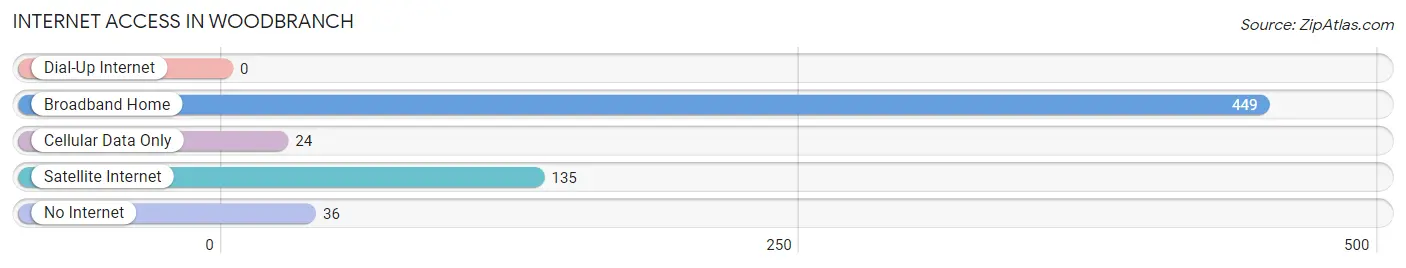
| Internet Type | # Households | % Households |
| Dial-Up Internet | 0 | 0.0% |
| Broadband Home | 449 | 86.7% |
| Cellular Data Only | 24 | 4.6% |
| Satellite Internet | 135 | 26.1% |
| No Internet | 36 | 7.0% |
| Total | 518 | 100.0% |
Woodbranch Summary
Woodbranch is a small city located in Montgomery County, Texas. It is situated about 30 miles north of Houston and is part of the Houston–The Woodlands–Sugar Land metropolitan area. The city has a population of approximately 1,500 people and covers an area of 1.2 square miles.
History
The area that is now Woodbranch was first settled in the early 1800s by a group of German immigrants. The settlement was originally known as “Woodbranch” after the nearby creek. The town was officially incorporated in 1891 and was named after the creek.
In the early 1900s, the town began to grow and develop. The first school was built in 1910 and the first post office was established in 1911. The town also had a general store, a blacksmith shop, and a cotton gin.
In the 1920s, the town began to experience a period of growth and prosperity. The population increased from around 200 people in 1920 to over 1,000 by 1930. During this time, the town also saw the construction of a new school, a bank, and a movie theater.
In the 1950s, the town experienced a period of decline as many of the businesses closed and the population decreased. However, in the late 1970s, the town began to experience a period of revitalization. The population began to increase and new businesses began to open.
Geography
Woodbranch is located in Montgomery County, Texas. It is situated about 30 miles north of Houston and is part of the Houston–The Woodlands–Sugar Land metropolitan area. The city has a total area of 1.2 square miles, all of which is land.
The city is located in the East Texas Piney Woods region and is surrounded by forests and rolling hills. The climate is humid subtropical, with hot summers and mild winters. The average annual temperature is around 70 degrees Fahrenheit.
Economy
The economy of Woodbranch is largely based on agriculture and light manufacturing. The city is home to several small businesses, including a lumber mill, a feed store, and a machine shop.
The city also has a small tourism industry, with several bed and breakfasts and a few restaurants. The city is also home to a small airport, which serves as a hub for private and corporate aircraft.
Demographics
As of the 2010 census, the population of Woodbranch was 1,500 people. The racial makeup of the city was 94.7% White, 1.3% African American, 0.7% Native American, 0.3% Asian, and 2.7% from other races.
The median household income in Woodbranch was $45,000, and the median family income was $50,000. The per capita income was $20,000. About 10.7% of the population was below the poverty line.
Woodbranch is a small city with a rich history and a diverse population. It is a great place to live and work, and it offers a variety of activities and attractions for visitors and residents alike.
Common Questions
What is Per Capita Income in Woodbranch?
Per Capita income in Woodbranch is $29,895.
What is the Median Family Income in Woodbranch?
Median Family Income in Woodbranch is $80,625.
What is the Median Household income in Woodbranch?
Median Household Income in Woodbranch is $79,375.
What is Income or Wage Gap in Woodbranch?
Income or Wage Gap in Woodbranch is 45.3%.
Women in Woodbranch earn 54.7 cents for every dollar earned by a man.
What is Inequality or Gini Index in Woodbranch?
Inequality or Gini Index in Woodbranch is 0.35.
What is the Total Population of Woodbranch?
Total Population of Woodbranch is 1,614.
What is the Total Male Population of Woodbranch?
Total Male Population of Woodbranch is 909.
What is the Total Female Population of Woodbranch?
Total Female Population of Woodbranch is 705.
What is the Ratio of Males per 100 Females in Woodbranch?
There are 128.94 Males per 100 Females in Woodbranch.
What is the Ratio of Females per 100 Males in Woodbranch?
There are 77.56 Females per 100 Males in Woodbranch.
What is the Median Population Age in Woodbranch?
Median Population Age in Woodbranch is 34.8 Years.
What is the Average Family Size in Woodbranch
Average Family Size in Woodbranch is 3.3 People.
What is the Average Household Size in Woodbranch
Average Household Size in Woodbranch is 3.1 People.
How Large is the Labor Force in Woodbranch?
There are 722 People in the Labor Forcein in Woodbranch.
What is the Percentage of People in the Labor Force in Woodbranch?
65.8% of People are in the Labor Force in Woodbranch.
What is the Unemployment Rate in Woodbranch?
Unemployment Rate in Woodbranch is 4.3%.