Westway, TX Map & Demographics
Westway Map
Westway Overview
$14,157
PER CAPITA INCOME
$34,260
AVG FAMILY INCOME
$31,279
AVG HOUSEHOLD INCOME
57.9%
WAGE / INCOME GAP [ % ]
42.1¢/ $1
WAGE / INCOME GAP [ $ ]
0.39
INEQUALITY / GINI INDEX
3,480
TOTAL POPULATION
1,691
MALE POPULATION
1,789
FEMALE POPULATION
94.52
MALES / 100 FEMALES
105.80
FEMALES / 100 MALES
46.6
MEDIAN AGE
3.4
AVG FAMILY SIZE
2.9
AVG HOUSEHOLD SIZE
1,291
LABOR FORCE [ PEOPLE ]
44.2%
PERCENT IN LABOR FORCE
5.3%
UNEMPLOYMENT RATE
Income in Westway
Income Overview in Westway
Per Capita Income in Westway is $14,157, while median incomes of families and households are $34,260 and $31,279 respectively.
| Characteristic | Number | Measure |
| Per Capita Income | 3,480 | $14,157 |
| Median Family Income | 929 | $34,260 |
| Mean Family Income | 929 | $40,780 |
| Median Household Income | 1,223 | $31,279 |
| Mean Household Income | 1,223 | $35,860 |
| Income Deficit | 929 | $0 |
| Wage / Income Gap (%) | 3,480 | 57.92% |
| Wage / Income Gap ($) | 3,480 | 42.08¢ per $1 |
| Gini / Inequality Index | 3,480 | 0.39 |
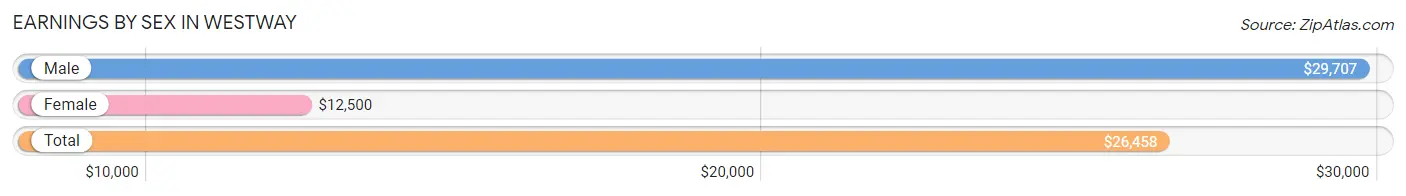
Earnings by Sex in Westway
Average Earnings in Westway are $26,458, $29,707 for men and $12,500 for women, a difference of 57.9%.
| Sex | Number | Average Earnings |
| Male | 945 (71.9%) | $29,707 |
| Female | 370 (28.1%) | $12,500 |
| Total | 1,315 (100.0%) | $26,458 |
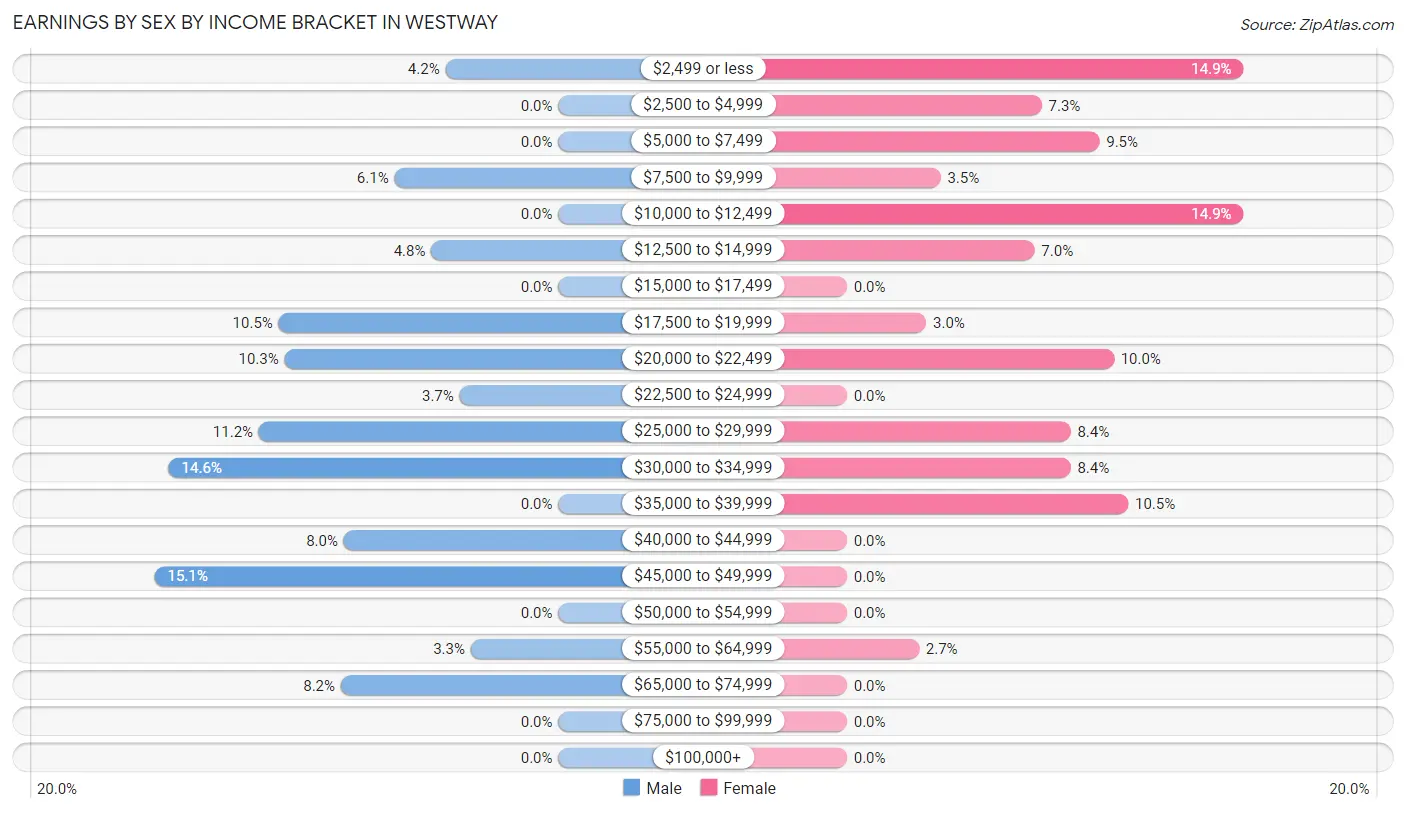
Earnings by Sex by Income Bracket in Westway
The most common earnings brackets in Westway are $45,000 to $49,999 for men (143 | 15.1%) and $2,499 or less for women (55 | 14.9%).
| Income | Male | Female |
| $2,499 or less | 40 (4.2%) | 55 (14.9%) |
| $2,500 to $4,999 | 0 (0.0%) | 27 (7.3%) |
| $5,000 to $7,499 | 0 (0.0%) | 35 (9.5%) |
| $7,500 to $9,999 | 58 (6.1%) | 13 (3.5%) |
| $10,000 to $12,499 | 0 (0.0%) | 55 (14.9%) |
| $12,500 to $14,999 | 45 (4.8%) | 26 (7.0%) |
| $15,000 to $17,499 | 0 (0.0%) | 0 (0.0%) |
| $17,500 to $19,999 | 99 (10.5%) | 11 (3.0%) |
| $20,000 to $22,499 | 97 (10.3%) | 37 (10.0%) |
| $22,500 to $24,999 | 35 (3.7%) | 0 (0.0%) |
| $25,000 to $29,999 | 106 (11.2%) | 31 (8.4%) |
| $30,000 to $34,999 | 138 (14.6%) | 31 (8.4%) |
| $35,000 to $39,999 | 0 (0.0%) | 39 (10.5%) |
| $40,000 to $44,999 | 76 (8.0%) | 0 (0.0%) |
| $45,000 to $49,999 | 143 (15.1%) | 0 (0.0%) |
| $50,000 to $54,999 | 0 (0.0%) | 0 (0.0%) |
| $55,000 to $64,999 | 31 (3.3%) | 10 (2.7%) |
| $65,000 to $74,999 | 77 (8.2%) | 0 (0.0%) |
| $75,000 to $99,999 | 0 (0.0%) | 0 (0.0%) |
| $100,000+ | 0 (0.0%) | 0 (0.0%) |
| Total | 945 (100.0%) | 370 (100.0%) |
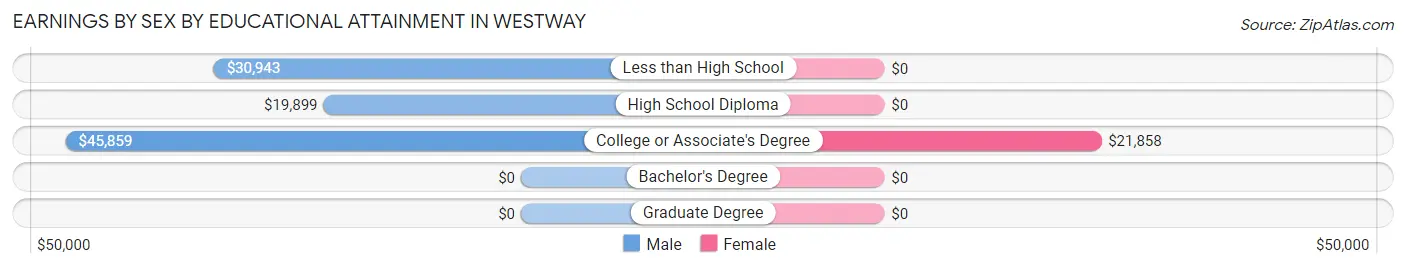
Earnings by Sex by Educational Attainment in Westway
Average earnings in Westway are $30,613 for men and $21,926 for women, a difference of 28.4%. Men with an educational attainment of college or associate's degree enjoy the highest average annual earnings of $45,859, while those with high school diploma education earn the least with $19,899. Women with an educational attainment of college or associate's degree earn the most with the average annual earnings of $21,858, while those with college or associate's degree education have the smallest earnings of $21,858.
| Educational Attainment | Male Income | Female Income |
| Less than High School | $30,943 | $0 |
| High School Diploma | $19,899 | $0 |
| College or Associate's Degree | $45,859 | $21,858 |
| Bachelor's Degree | - | - |
| Graduate Degree | - | - |
| Total | $30,613 | $21,926 |
Family Income in Westway
Family Income Brackets in Westway
According to the Westway family income data, there are 221 families falling into the $50,000 to $74,999 income range, which is the most common income bracket and makes up 23.8% of all families.
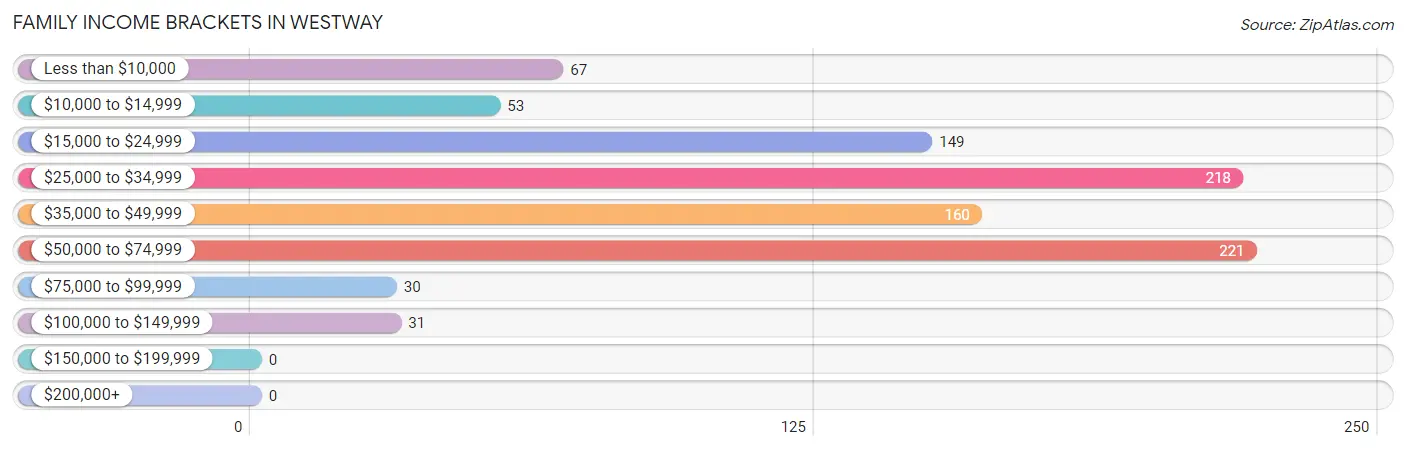
| Income Bracket | # Families | % Families |
| Less than $10,000 | 67 | 7.2% |
| $10,000 to $14,999 | 53 | 5.7% |
| $15,000 to $24,999 | 149 | 16.0% |
| $25,000 to $34,999 | 218 | 23.5% |
| $35,000 to $49,999 | 160 | 17.2% |
| $50,000 to $74,999 | 221 | 23.8% |
| $75,000 to $99,999 | 30 | 3.2% |
| $100,000 to $149,999 | 31 | 3.3% |
| $150,000 to $199,999 | 0 | 0.0% |
| $200,000+ | 0 | 0.0% |
Family Income by Famaliy Size in Westway
3-person families (351 | 37.8%) account for the highest median family income in Westway with $51,250 per family, while 3-person families (351 | 37.8%) have the highest median income of $17,083 per family member.
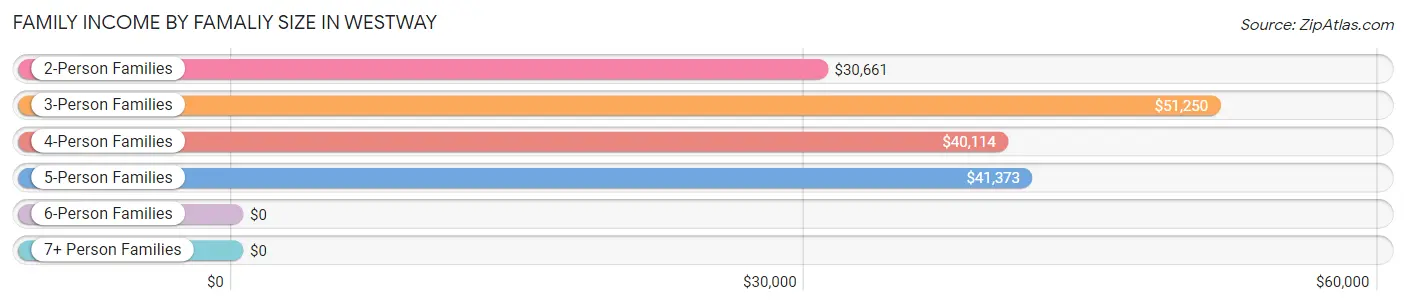
| Income Bracket | # Families | Median Income |
| 2-Person Families | 390 (42.0%) | $30,661 |
| 3-Person Families | 351 (37.8%) | $51,250 |
| 4-Person Families | 67 (7.2%) | $40,114 |
| 5-Person Families | 74 (8.0%) | $41,373 |
| 6-Person Families | 16 (1.7%) | $0 |
| 7+ Person Families | 31 (3.3%) | $0 |
| Total | 929 (100.0%) | $34,260 |
Family Income by Number of Earners in Westway
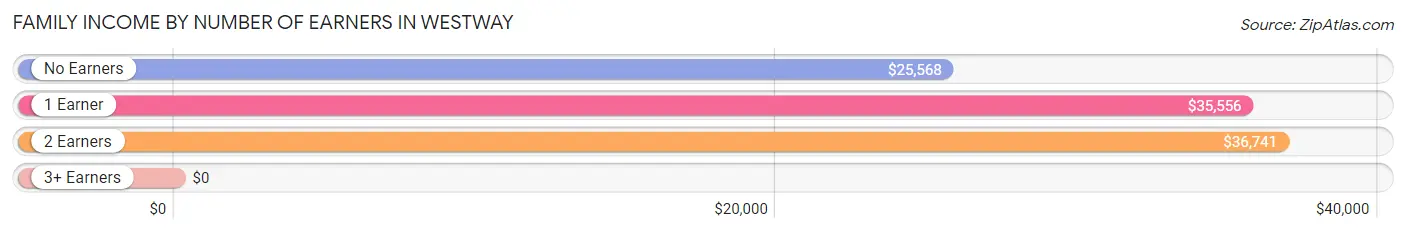
| Number of Earners | # Families | Median Income |
| No Earners | 144 (15.5%) | $25,568 |
| 1 Earner | 586 (63.1%) | $35,556 |
| 2 Earners | 185 (19.9%) | $36,741 |
| 3+ Earners | 14 (1.5%) | $0 |
| Total | 929 (100.0%) | $34,260 |
Household Income in Westway
Household Income Brackets in Westway
With 295 households falling in the category, the $25,000 to $34,999 income range is the most frequent in Westway, accounting for 24.1% of all households.
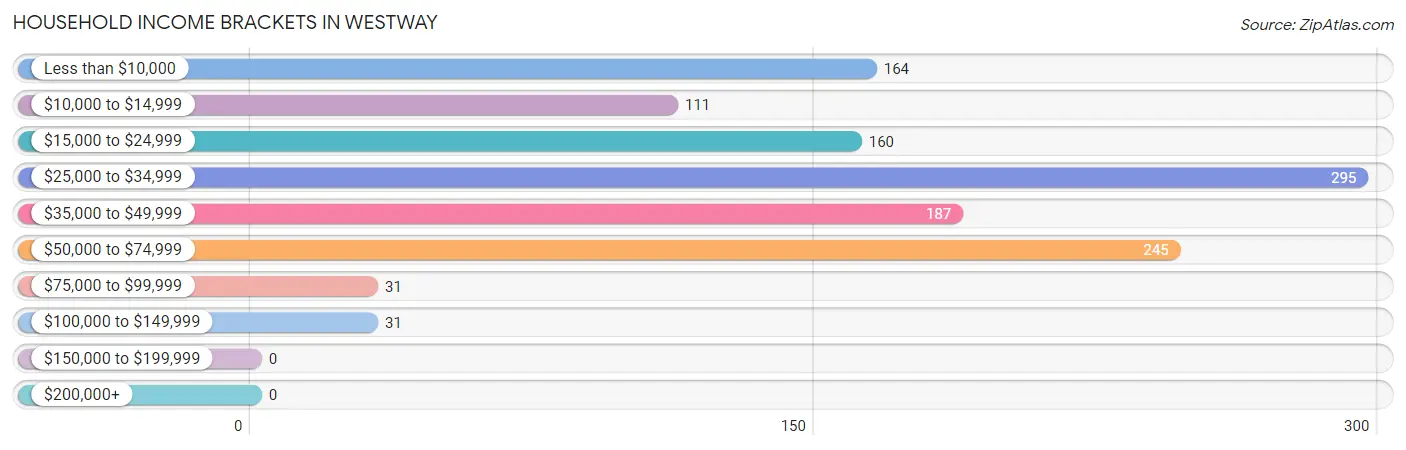
| Income Bracket | # Households | % Households |
| Less than $10,000 | 164 | 13.4% |
| $10,000 to $14,999 | 111 | 9.1% |
| $15,000 to $24,999 | 160 | 13.1% |
| $25,000 to $34,999 | 295 | 24.1% |
| $35,000 to $49,999 | 187 | 15.3% |
| $50,000 to $74,999 | 245 | 20.0% |
| $75,000 to $99,999 | 31 | 2.5% |
| $100,000 to $149,999 | 31 | 2.5% |
| $150,000 to $199,999 | 0 | 0.0% |
| $200,000+ | 0 | 0.0% |
Household Income by Householder Age in Westway
The median household income in Westway is $31,279, with the highest median household income of $41,397 found in the 25 to 44 years age bracket for the primary householder. A total of 181 households (14.8%) fall into this category. Meanwhile, the 15 to 24 years age bracket for the primary householder has the lowest median household income of $0, with 85 households (7.0%) in this group.
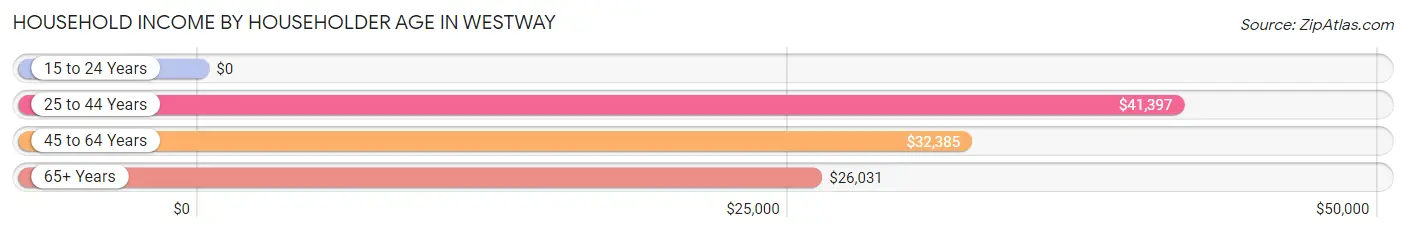
| Income Bracket | # Households | Median Income |
| 15 to 24 Years | 85 (7.0%) | $0 |
| 25 to 44 Years | 181 (14.8%) | $41,397 |
| 45 to 64 Years | 660 (54.0%) | $32,385 |
| 65+ Years | 297 (24.3%) | $26,031 |
| Total | 1,223 (100.0%) | $31,279 |
Poverty in Westway
Income Below Poverty by Sex and Age in Westway
With 26.2% poverty level for males and 39.9% for females among the residents of Westway, 15 year old males and 12 to 14 year old females are the most vulnerable to poverty, with 7 males (100.0%) and 22 females (100.0%) in their respective age groups living below the poverty level.
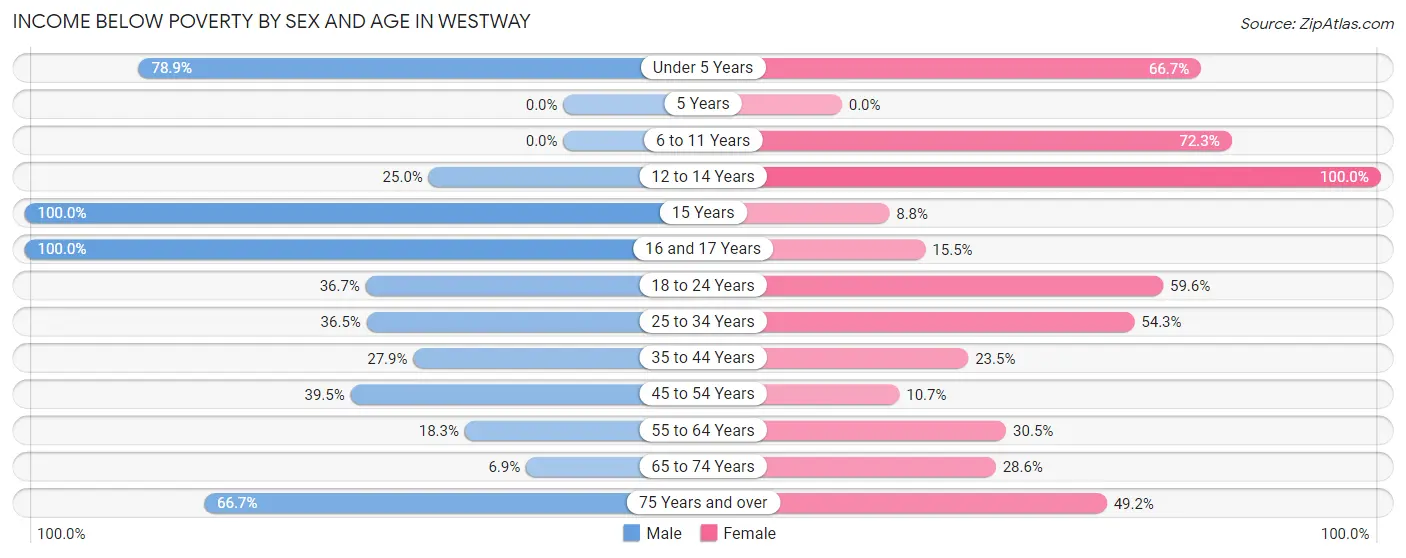
| Age Bracket | Male | Female |
| Under 5 Years | 41 (78.8%) | 144 (66.7%) |
| 5 Years | 0 (0.0%) | 0 (0.0%) |
| 6 to 11 Years | 0 (0.0%) | 34 (72.3%) |
| 12 to 14 Years | 9 (25.0%) | 22 (100.0%) |
| 15 Years | 7 (100.0%) | 9 (8.8%) |
| 16 and 17 Years | 37 (100.0%) | 9 (15.5%) |
| 18 to 24 Years | 51 (36.7%) | 96 (59.6%) |
| 25 to 34 Years | 46 (36.5%) | 101 (54.3%) |
| 35 to 44 Years | 95 (27.9%) | 23 (23.5%) |
| 45 to 54 Years | 47 (39.5%) | 16 (10.7%) |
| 55 to 64 Years | 58 (18.3%) | 137 (30.5%) |
| 65 to 74 Years | 28 (6.9%) | 34 (28.6%) |
| 75 Years and over | 24 (66.7%) | 89 (49.2%) |
| Total | 443 (26.2%) | 714 (39.9%) |
Income Above Poverty by Sex and Age in Westway
According to the poverty statistics in Westway, males aged 6 to 11 years and females aged 15 years are the age groups that are most secure financially, with 100.0% of males and 91.2% of females in these age groups living above the poverty line.
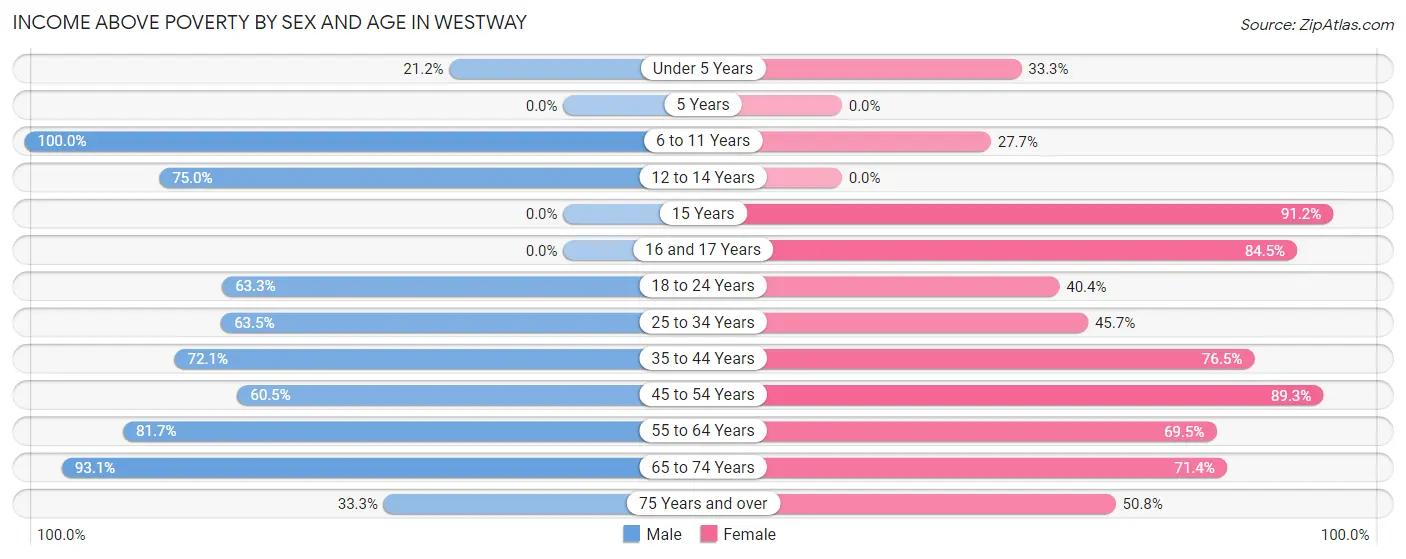
| Age Bracket | Male | Female |
| Under 5 Years | 11 (21.1%) | 72 (33.3%) |
| 5 Years | 0 (0.0%) | 0 (0.0%) |
| 6 to 11 Years | 77 (100.0%) | 13 (27.7%) |
| 12 to 14 Years | 27 (75.0%) | 0 (0.0%) |
| 15 Years | 0 (0.0%) | 93 (91.2%) |
| 16 and 17 Years | 0 (0.0%) | 49 (84.5%) |
| 18 to 24 Years | 88 (63.3%) | 65 (40.4%) |
| 25 to 34 Years | 80 (63.5%) | 85 (45.7%) |
| 35 to 44 Years | 246 (72.1%) | 75 (76.5%) |
| 45 to 54 Years | 72 (60.5%) | 134 (89.3%) |
| 55 to 64 Years | 259 (81.7%) | 312 (69.5%) |
| 65 to 74 Years | 376 (93.1%) | 85 (71.4%) |
| 75 Years and over | 12 (33.3%) | 92 (50.8%) |
| Total | 1,248 (73.8%) | 1,075 (60.1%) |
Income Below Poverty Among Married-Couple Families in Westway
The poverty statistics for married-couple families in Westway show that 19.4% or 139 of the total 717 families live below the poverty line. Families with 3 or 4 children have the highest poverty rate of 37.8%, comprising of 31 families. On the other hand, families with no children have the lowest poverty rate of 10.9%, which includes 52 families.
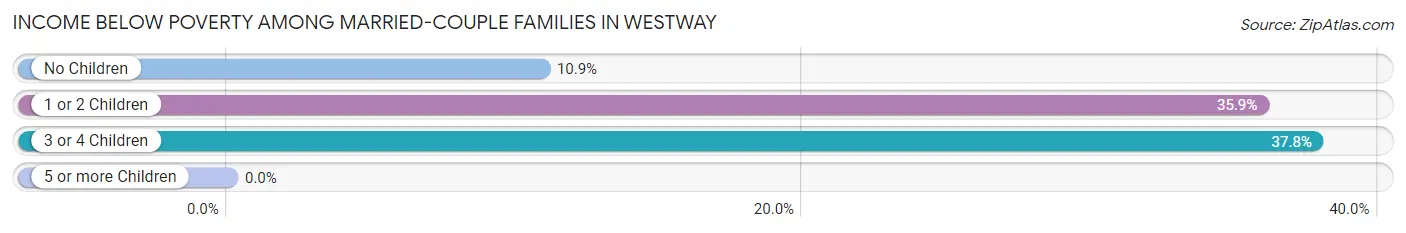
| Children | Above Poverty | Below Poverty |
| No Children | 427 (89.1%) | 52 (10.9%) |
| 1 or 2 Children | 100 (64.1%) | 56 (35.9%) |
| 3 or 4 Children | 51 (62.2%) | 31 (37.8%) |
| 5 or more Children | 0 (0.0%) | 0 (0.0%) |
| Total | 578 (80.6%) | 139 (19.4%) |
Income Below Poverty Among Single-Parent Households in Westway
According to the poverty data in Westway, 52.7% or 29 single-father households and 66.2% or 104 single-mother households are living below the poverty line. Among single-father households, those with 1 or 2 children have the highest poverty rate, with 29 households (100.0%) experiencing poverty. Likewise, among single-mother households, those with 1 or 2 children have the highest poverty rate, with 49 households (77.8%) falling below the poverty line.
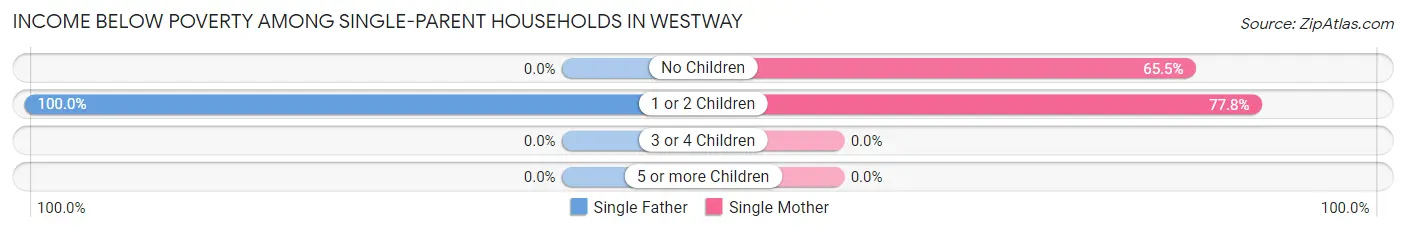
| Children | Single Father | Single Mother |
| No Children | 0 (0.0%) | 55 (65.5%) |
| 1 or 2 Children | 29 (100.0%) | 49 (77.8%) |
| 3 or 4 Children | 0 (0.0%) | 0 (0.0%) |
| 5 or more Children | 0 (0.0%) | 0 (0.0%) |
| Total | 29 (52.7%) | 104 (66.2%) |
Income Below Poverty Among Married-Couple vs Single-Parent Households in Westway
The poverty data for Westway shows that 139 of the married-couple family households (19.4%) and 133 of the single-parent households (62.7%) are living below the poverty level. Within the married-couple family households, those with 3 or 4 children have the highest poverty rate, with 31 households (37.8%) falling below the poverty line. Among the single-parent households, those with 1 or 2 children have the highest poverty rate, with 78 household (84.8%) living below poverty.
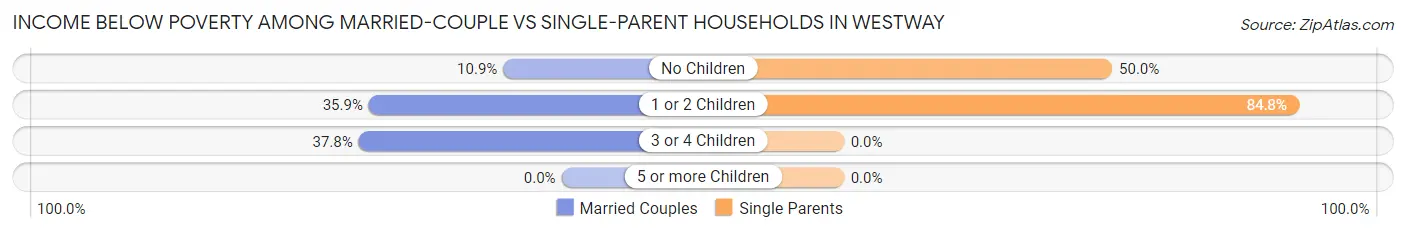
| Children | Married-Couple Families | Single-Parent Households |
| No Children | 52 (10.9%) | 55 (50.0%) |
| 1 or 2 Children | 56 (35.9%) | 78 (84.8%) |
| 3 or 4 Children | 31 (37.8%) | 0 (0.0%) |
| 5 or more Children | 0 (0.0%) | 0 (0.0%) |
| Total | 139 (19.4%) | 133 (62.7%) |
Race in Westway
The most populous races in Westway are Hispanic or Latino (3,429 | 98.5%), Some other Race (1,892 | 54.4%), and White / Caucasian (1,076 | 30.9%).
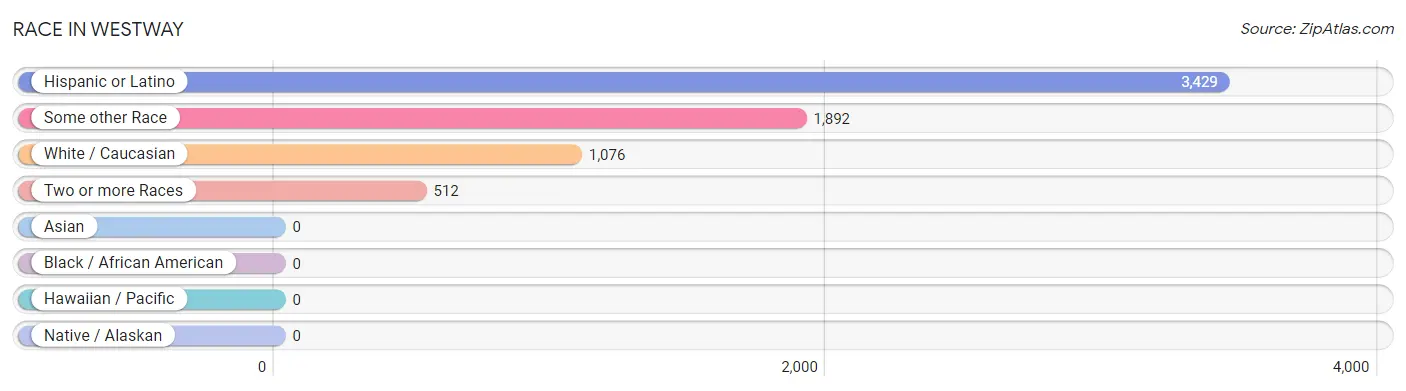
| Race | # Population | % Population |
| Asian | 0 | 0.0% |
| Black / African American | 0 | 0.0% |
| Hawaiian / Pacific | 0 | 0.0% |
| Hispanic or Latino | 3,429 | 98.5% |
| Native / Alaskan | 0 | 0.0% |
| White / Caucasian | 1,076 | 30.9% |
| Two or more Races | 512 | 14.7% |
| Some other Race | 1,892 | 54.4% |
| Total | 3,480 | 100.0% |
Ancestry in Westway
The most populous ancestries reported in Westway are Mexican (3,429 | 98.5%), English (35 | 1.0%), Portuguese (23 | 0.7%), and American (9 | 0.3%), together accounting for 100.5% of all Westway residents.
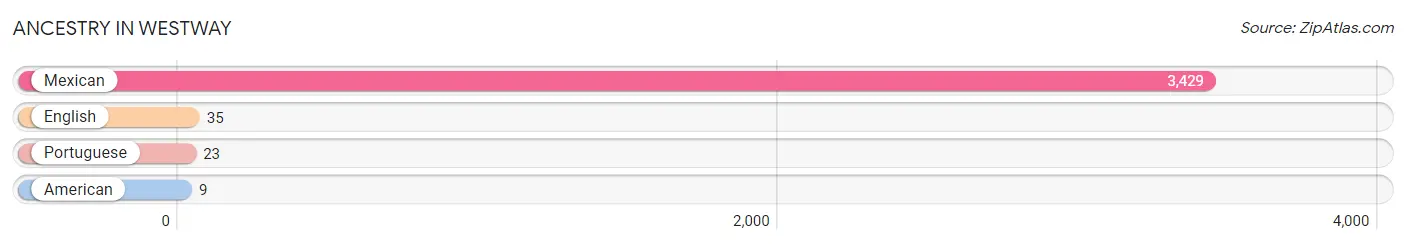
| Ancestry | # Population | % Population |
| American | 9 | 0.3% |
| English | 35 | 1.0% |
| Mexican | 3,429 | 98.5% |
| Portuguese | 23 | 0.7% | View All 4 Rows |
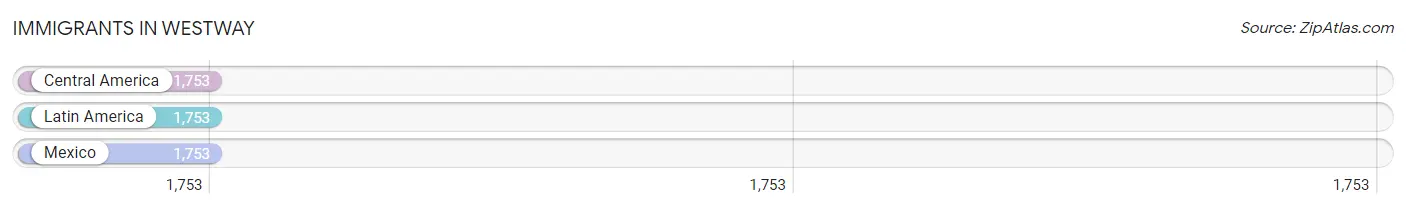
Immigrants in Westway
The most numerous immigrant groups reported in Westway came from Central America (1,753 | 50.4%), Latin America (1,753 | 50.4%), and Mexico (1,753 | 50.4%), together accounting for 151.1% of all Westway residents.
| Immigration Origin | # Population | % Population |
| Central America | 1,753 | 50.4% |
| Latin America | 1,753 | 50.4% |
| Mexico | 1,753 | 50.4% | View All 3 Rows |
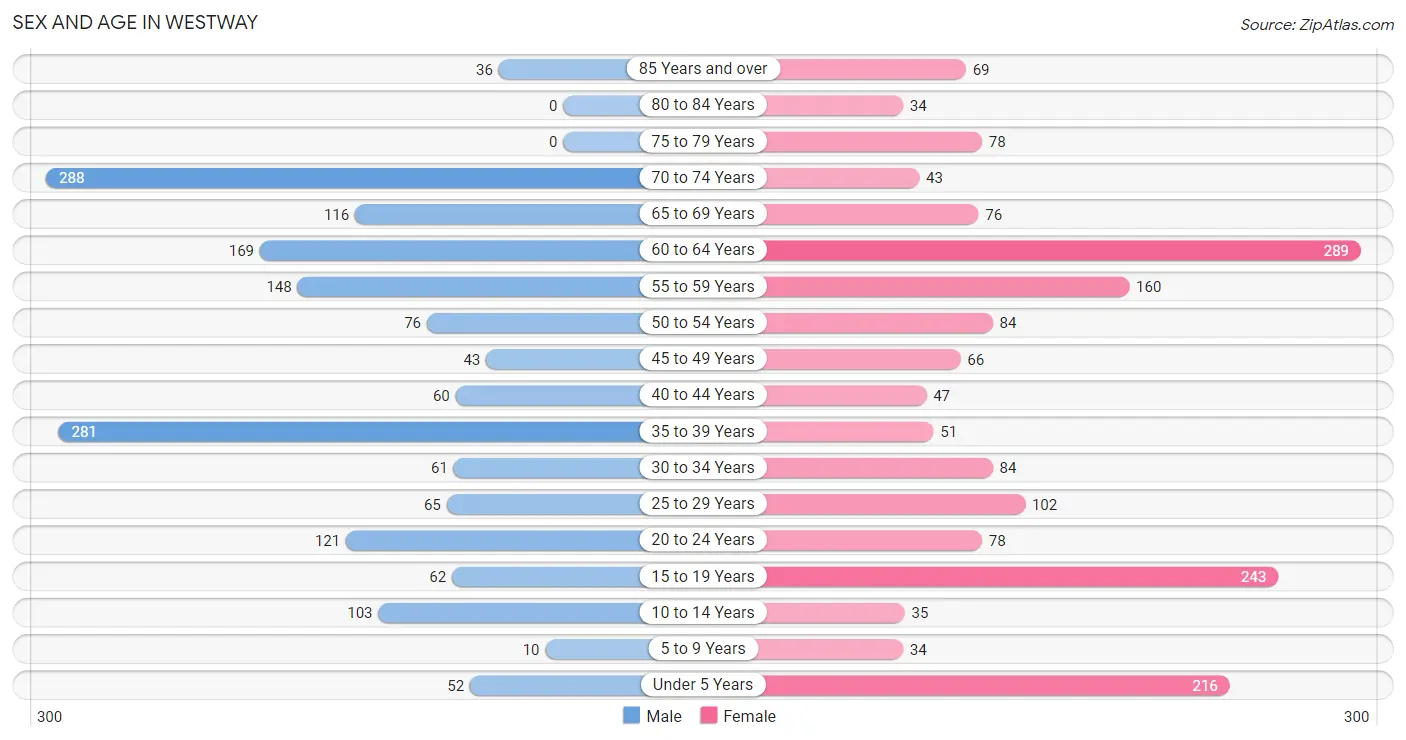
Sex and Age in Westway
Sex and Age in Westway
The most populous age groups in Westway are 70 to 74 Years (288 | 17.0%) for men and 60 to 64 Years (289 | 16.2%) for women.
| Age Bracket | Male | Female |
| Under 5 Years | 52 (3.1%) | 216 (12.1%) |
| 5 to 9 Years | 10 (0.6%) | 34 (1.9%) |
| 10 to 14 Years | 103 (6.1%) | 35 (2.0%) |
| 15 to 19 Years | 62 (3.7%) | 243 (13.6%) |
| 20 to 24 Years | 121 (7.2%) | 78 (4.4%) |
| 25 to 29 Years | 65 (3.8%) | 102 (5.7%) |
| 30 to 34 Years | 61 (3.6%) | 84 (4.7%) |
| 35 to 39 Years | 281 (16.6%) | 51 (2.9%) |
| 40 to 44 Years | 60 (3.5%) | 47 (2.6%) |
| 45 to 49 Years | 43 (2.5%) | 66 (3.7%) |
| 50 to 54 Years | 76 (4.5%) | 84 (4.7%) |
| 55 to 59 Years | 148 (8.7%) | 160 (8.9%) |
| 60 to 64 Years | 169 (10.0%) | 289 (16.2%) |
| 65 to 69 Years | 116 (6.9%) | 76 (4.3%) |
| 70 to 74 Years | 288 (17.0%) | 43 (2.4%) |
| 75 to 79 Years | 0 (0.0%) | 78 (4.4%) |
| 80 to 84 Years | 0 (0.0%) | 34 (1.9%) |
| 85 Years and over | 36 (2.1%) | 69 (3.9%) |
| Total | 1,691 (100.0%) | 1,789 (100.0%) |
Families and Households in Westway
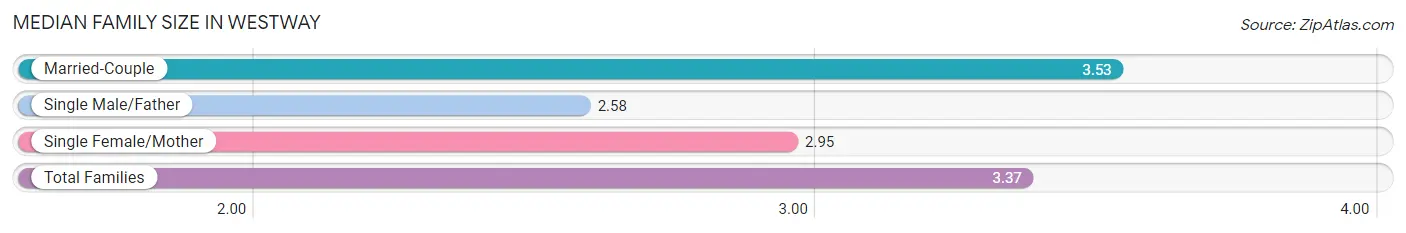
Median Family Size in Westway
The median family size in Westway is 3.37 persons per family, with married-couple families (717 | 77.2%) accounting for the largest median family size of 3.53 persons per family. On the other hand, single male/father families (55 | 5.9%) represent the smallest median family size with 2.58 persons per family.
| Family Type | # Families | Family Size |
| Married-Couple | 717 (77.2%) | 3.53 |
| Single Male/Father | 55 (5.9%) | 2.58 |
| Single Female/Mother | 157 (16.9%) | 2.95 |
| Total Families | 929 (100.0%) | 3.37 |
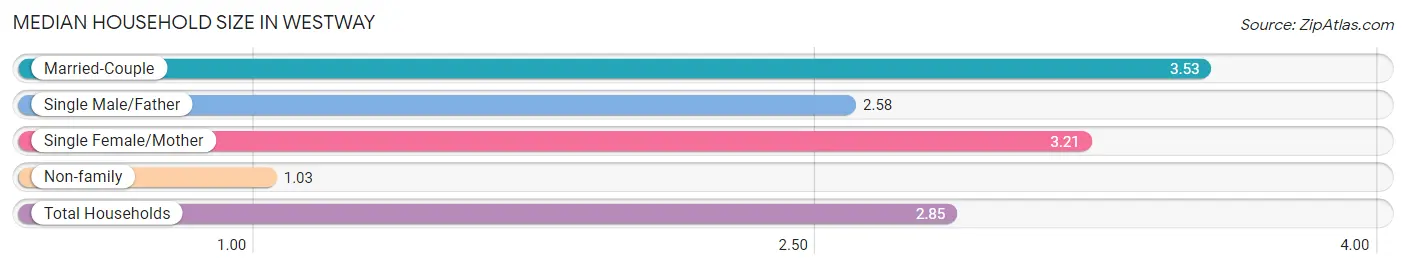
Median Household Size in Westway
The median household size in Westway is 2.85 persons per household, with married-couple households (717 | 58.6%) accounting for the largest median household size of 3.53 persons per household. non-family households (294 | 24.0%) represent the smallest median household size with 1.03 persons per household.
| Household Type | # Households | Household Size |
| Married-Couple | 717 (58.6%) | 3.53 |
| Single Male/Father | 55 (4.5%) | 2.58 |
| Single Female/Mother | 157 (12.8%) | 3.21 |
| Non-family | 294 (24.0%) | 1.03 |
| Total Households | 1,223 (100.0%) | 2.85 |
Household Size by Marriage Status in Westway
Out of a total of 1,223 households in Westway, 929 (76.0%) are family households, while 294 (24.0%) are nonfamily households. The most numerous type of family households are 3-person households, comprising 385, and the most common type of nonfamily households are 1-person households, comprising 285.
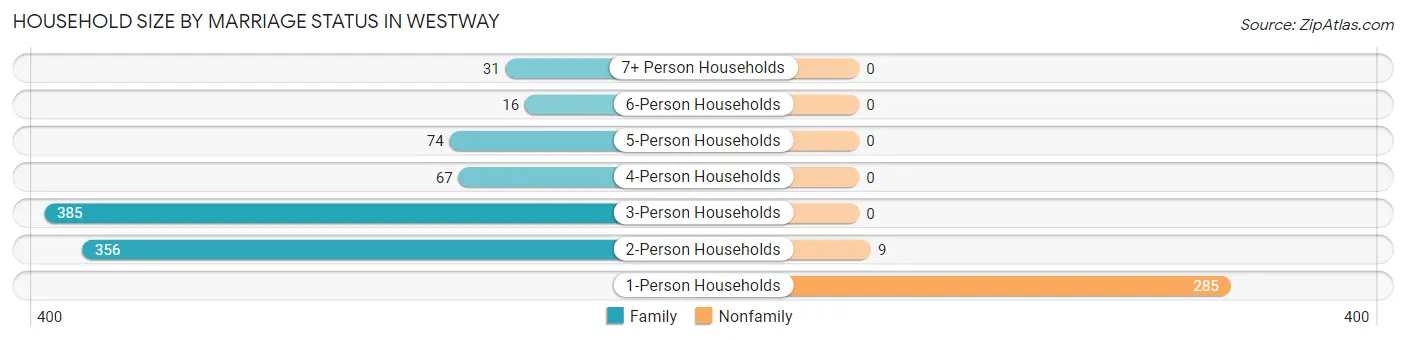
| Household Size | Family Households | Nonfamily Households |
| 1-Person Households | - | 285 (23.3%) |
| 2-Person Households | 356 (29.1%) | 9 (0.7%) |
| 3-Person Households | 385 (31.5%) | 0 (0.0%) |
| 4-Person Households | 67 (5.5%) | 0 (0.0%) |
| 5-Person Households | 74 (6.0%) | 0 (0.0%) |
| 6-Person Households | 16 (1.3%) | 0 (0.0%) |
| 7+ Person Households | 31 (2.5%) | 0 (0.0%) |
| Total | 929 (76.0%) | 294 (24.0%) |
Female Fertility in Westway
Fertility by Age in Westway
Average fertility rate in Westway is 200.0 births per 1,000 women. Women in the age bracket of 20 to 34 years have the highest fertility rate with 508.0 births per 1,000 women. Women in the age bracket of 20 to 34 years acount for 100.0% of all women with births.
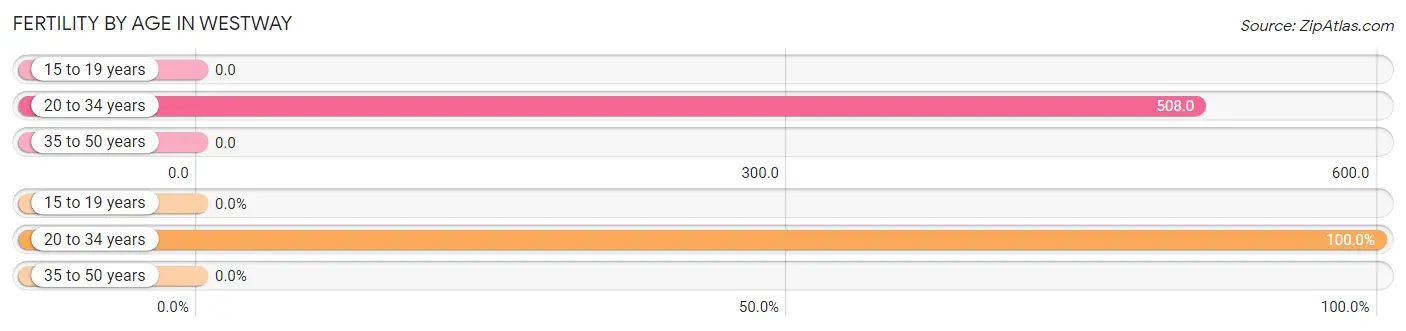
| Age Bracket | Women with Births | Births / 1,000 Women |
| 15 to 19 years | 0 (0.0%) | 0.0 |
| 20 to 34 years | 134 (100.0%) | 508.0 |
| 35 to 50 years | 0 (0.0%) | 0.0 |
| Total | 134 (100.0%) | 200.0 |
Fertility by Age by Marriage Status in Westway
72.4% of women with births (134) in Westway are married. The highest percentage of unmarried women with births falls into 20 to 34 years age bracket with 27.6% of them unmarried at the time of birth, while the lowest percentage of unmarried women with births belong to 20 to 34 years age bracket with 27.6% of them unmarried.
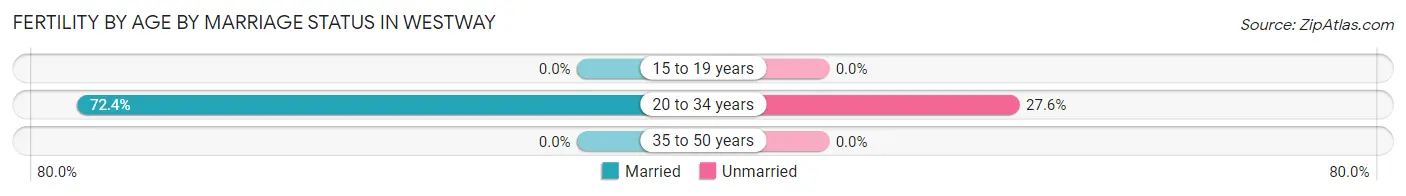
| Age Bracket | Married | Unmarried |
| 15 to 19 years | 0 (0.0%) | 0 (0.0%) |
| 20 to 34 years | 97 (72.4%) | 37 (27.6%) |
| 35 to 50 years | 0 (0.0%) | 0 (0.0%) |
| Total | 97 (72.4%) | 37 (27.6%) |
Fertility by Education in Westway
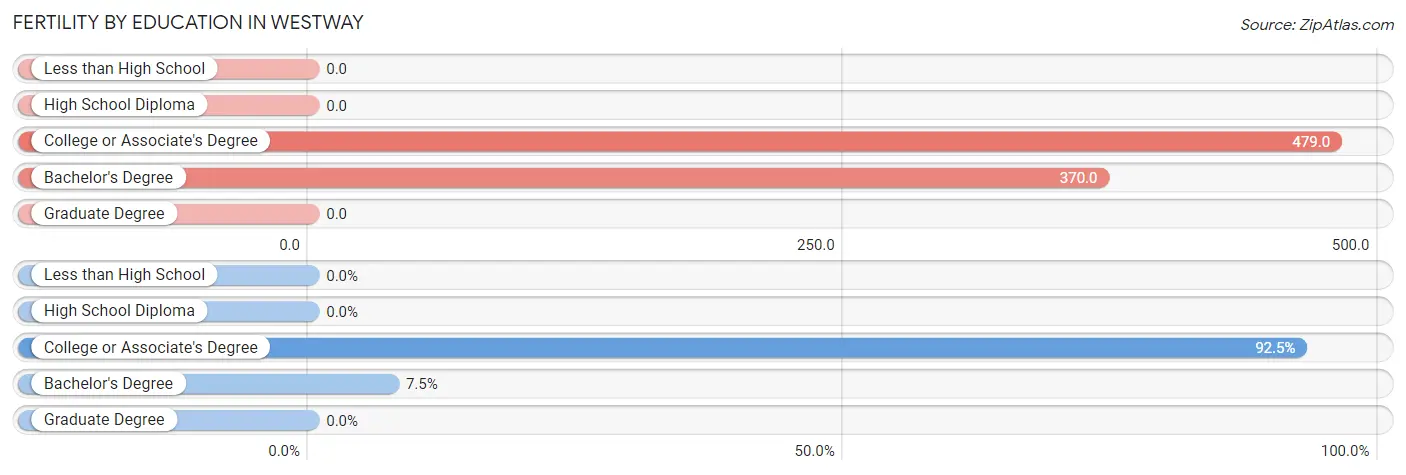
| Educational Attainment | Women with Births | Births / 1,000 Women |
| Less than High School | 0 (0.0%) | 0.0 |
| High School Diploma | 0 (0.0%) | 0.0 |
| College or Associate's Degree | 124 (92.5%) | 479.0 |
| Bachelor's Degree | 10 (7.5%) | 370.0 |
| Graduate Degree | 0 (0.0%) | 0.0 |
| Total | 134 (100.0%) | 200.0 |
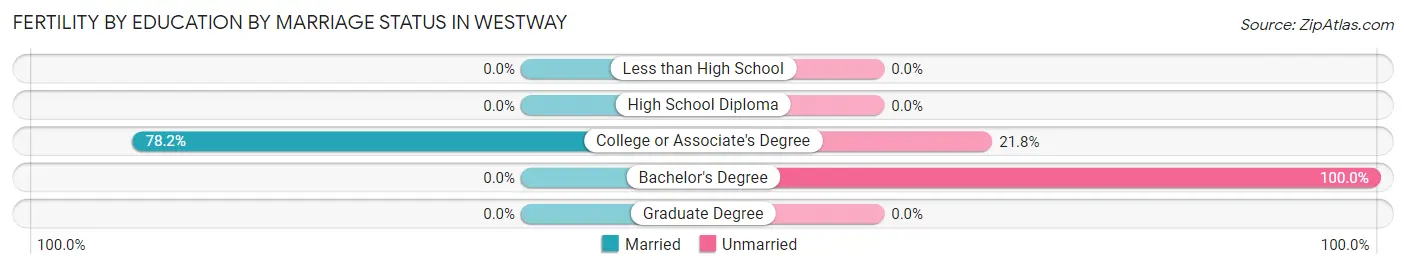
Fertility by Education by Marriage Status in Westway
27.6% of women with births in Westway are unmarried. Women with the educational attainment of college or associate's degree are most likely to be married with 78.2% of them married at childbirth, while women with the educational attainment of bachelor's degree are least likely to be married with 100.0% of them unmarried at childbirth.
| Educational Attainment | Married | Unmarried |
| Less than High School | 0 (0.0%) | 0 (0.0%) |
| High School Diploma | 0 (0.0%) | 0 (0.0%) |
| College or Associate's Degree | 97 (78.2%) | 27 (21.8%) |
| Bachelor's Degree | 0 (0.0%) | 10 (100.0%) |
| Graduate Degree | 0 (0.0%) | 0 (0.0%) |
| Total | 97 (72.4%) | 37 (27.6%) |
Employment Characteristics in Westway
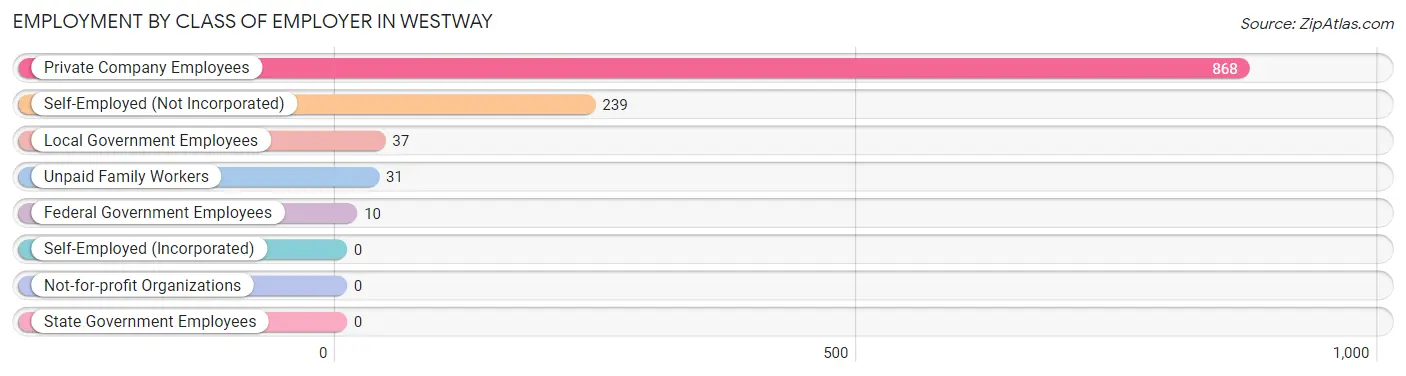
Employment by Class of Employer in Westway
Among the 1,185 employed individuals in Westway, private company employees (868 | 73.3%), self-employed (not incorporated) (239 | 20.2%), and local government employees (37 | 3.1%) make up the most common classes of employment.
| Employer Class | # Employees | % Employees |
| Private Company Employees | 868 | 73.3% |
| Self-Employed (Incorporated) | 0 | 0.0% |
| Self-Employed (Not Incorporated) | 239 | 20.2% |
| Not-for-profit Organizations | 0 | 0.0% |
| Local Government Employees | 37 | 3.1% |
| State Government Employees | 0 | 0.0% |
| Federal Government Employees | 10 | 0.8% |
| Unpaid Family Workers | 31 | 2.6% |
| Total | 1,185 | 100.0% |
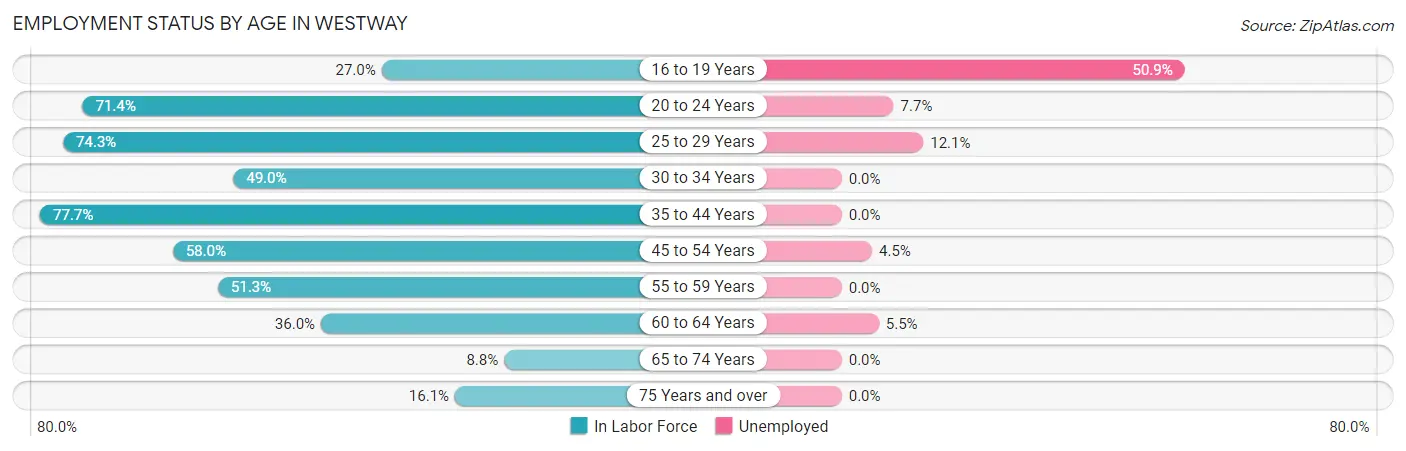
Employment Status by Age in Westway
According to the labor force statistics for Westway, out of the total population over 16 years of age (2,921), 44.2% or 1,291 individuals are in the labor force, with 5.3% or 68 of them unemployed. The age group with the highest labor force participation rate is 35 to 44 years, with 77.7% or 341 individuals in the labor force. Within the labor force, the 16 to 19 years age range has the highest percentage of unemployed individuals, with 50.9% or 27 of them being unemployed.
| Age Bracket | In Labor Force | Unemployed |
| 16 to 19 Years | 53 (27.0%) | 27 (50.9%) |
| 20 to 24 Years | 142 (71.4%) | 11 (7.7%) |
| 25 to 29 Years | 124 (74.3%) | 15 (12.1%) |
| 30 to 34 Years | 71 (49.0%) | 0 (0.0%) |
| 35 to 44 Years | 341 (77.7%) | 0 (0.0%) |
| 45 to 54 Years | 156 (58.0%) | 7 (4.5%) |
| 55 to 59 Years | 158 (51.3%) | 0 (0.0%) |
| 60 to 64 Years | 165 (36.0%) | 9 (5.5%) |
| 65 to 74 Years | 46 (8.8%) | 0 (0.0%) |
| 75 Years and over | 35 (16.1%) | 0 (0.0%) |
| Total | 1,291 (44.2%) | 68 (5.3%) |
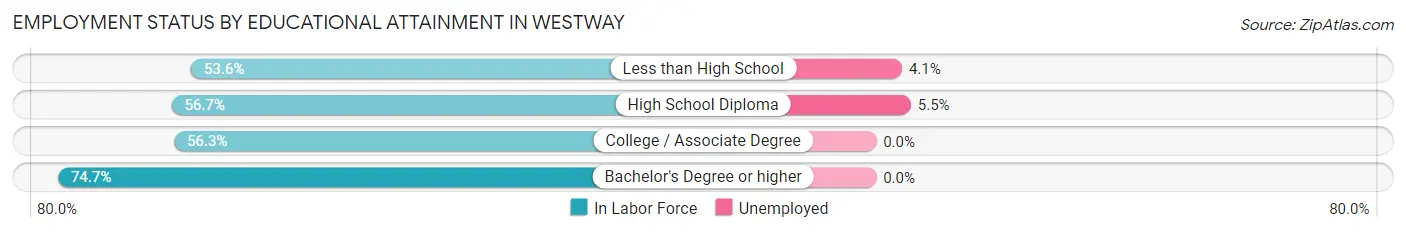
Employment Status by Educational Attainment in Westway
According to labor force statistics for Westway, 56.8% of individuals (1,014) out of the total population between 25 and 64 years of age (1,786) are in the labor force, with 3.1% or 31 of them being unemployed. The group with the highest labor force participation rate are those with the educational attainment of bachelor's degree or higher, with 74.7% or 112 individuals in the labor force. Within the labor force, individuals with high school diploma education have the highest percentage of unemployment, with 5.5% or 15 of them being unemployed.
| Educational Attainment | In Labor Force | Unemployed |
| Less than High School | 391 (53.6%) | 30 (4.1%) |
| High School Diploma | 272 (56.7%) | 26 (5.5%) |
| College / Associate Degree | 240 (56.3%) | 0 (0.0%) |
| Bachelor's Degree or higher | 112 (74.7%) | 0 (0.0%) |
| Total | 1,014 (56.8%) | 55 (3.1%) |
Employment Occupations by Sex in Westway
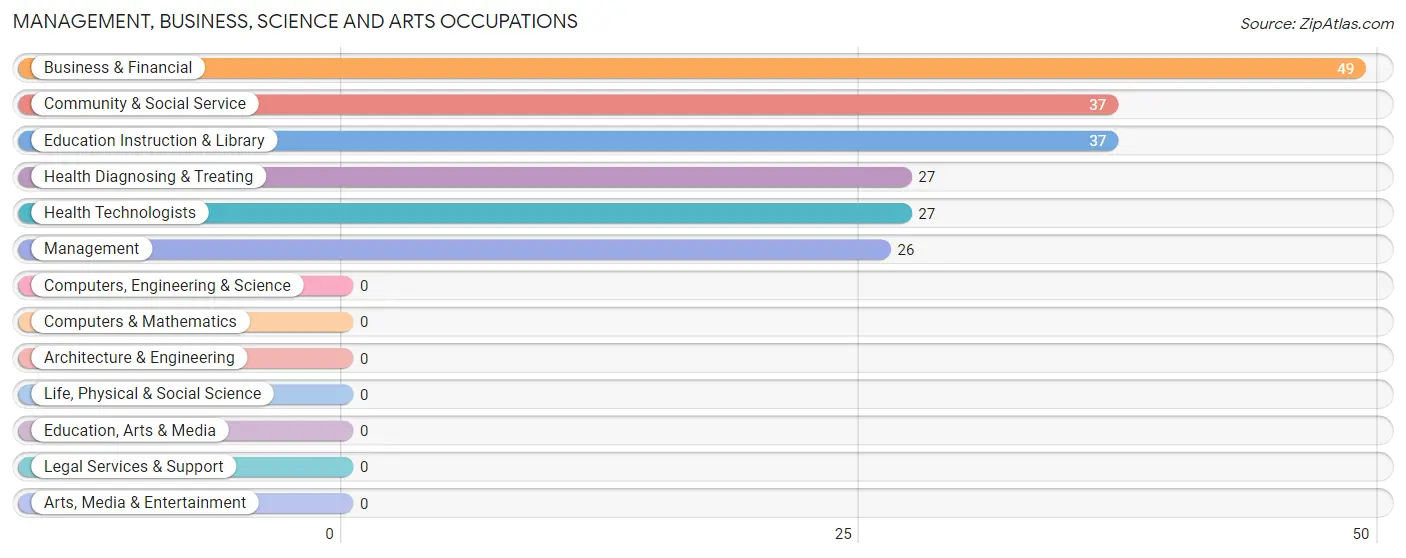
Management, Business, Science and Arts Occupations
The most common Management, Business, Science and Arts occupations in Westway are Business & Financial (49 | 4.0%), Community & Social Service (37 | 3.0%), Education Instruction & Library (37 | 3.0%), Health Diagnosing & Treating (27 | 2.2%), and Health Technologists (27 | 2.2%).
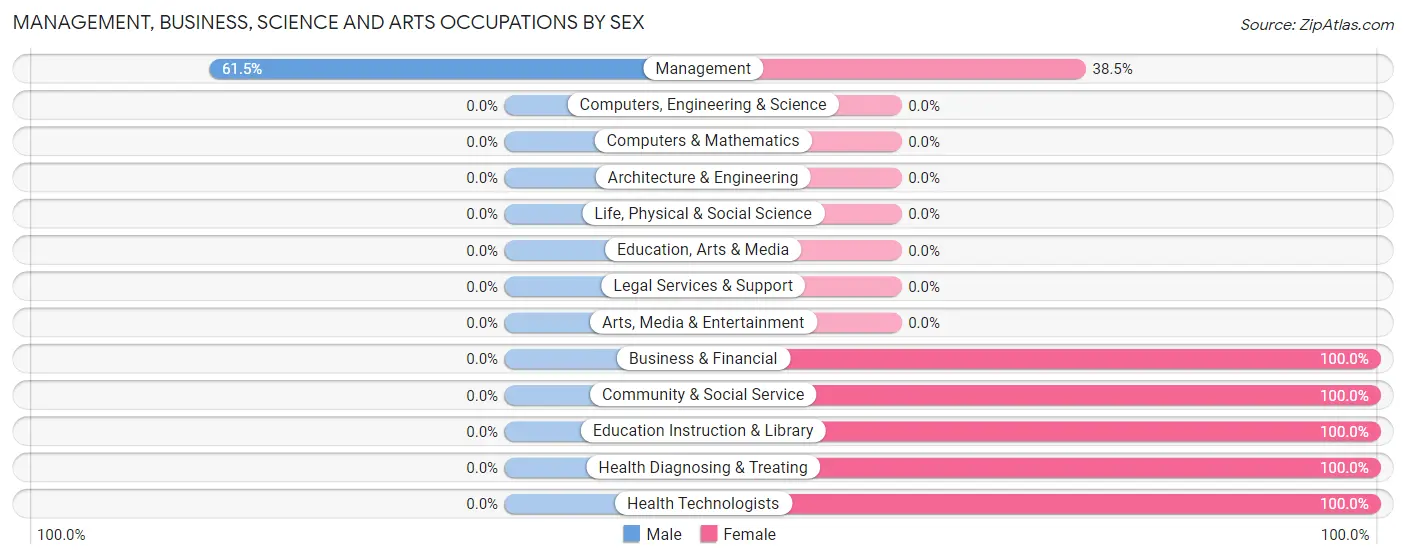
Management, Business, Science and Arts Occupations by Sex
| Occupation | Male | Female |
| Management | 16 (61.5%) | 10 (38.5%) |
| Business & Financial | 0 (0.0%) | 49 (100.0%) |
| Computers, Engineering & Science | 0 (0.0%) | 0 (0.0%) |
| Computers & Mathematics | 0 (0.0%) | 0 (0.0%) |
| Architecture & Engineering | 0 (0.0%) | 0 (0.0%) |
| Life, Physical & Social Science | 0 (0.0%) | 0 (0.0%) |
| Community & Social Service | 0 (0.0%) | 37 (100.0%) |
| Education, Arts & Media | 0 (0.0%) | 0 (0.0%) |
| Legal Services & Support | 0 (0.0%) | 0 (0.0%) |
| Education Instruction & Library | 0 (0.0%) | 37 (100.0%) |
| Arts, Media & Entertainment | 0 (0.0%) | 0 (0.0%) |
| Health Diagnosing & Treating | 0 (0.0%) | 27 (100.0%) |
| Health Technologists | 0 (0.0%) | 27 (100.0%) |
| Total (Category) | 16 (11.5%) | 123 (88.5%) |
| Total (Overall) | 934 (76.4%) | 288 (23.6%) |
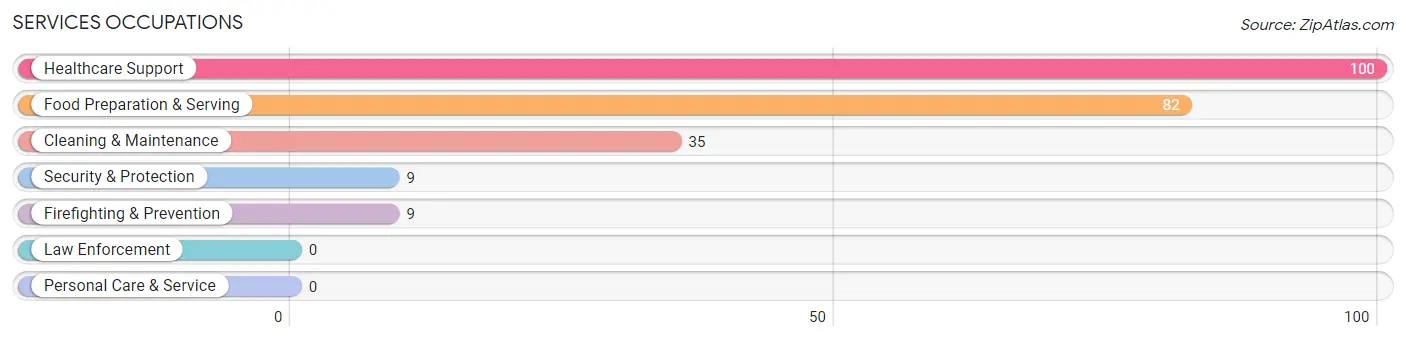
Services Occupations
The most common Services occupations in Westway are Healthcare Support (100 | 8.2%), Food Preparation & Serving (82 | 6.7%), Cleaning & Maintenance (35 | 2.9%), Security & Protection (9 | 0.7%), and Firefighting & Prevention (9 | 0.7%).
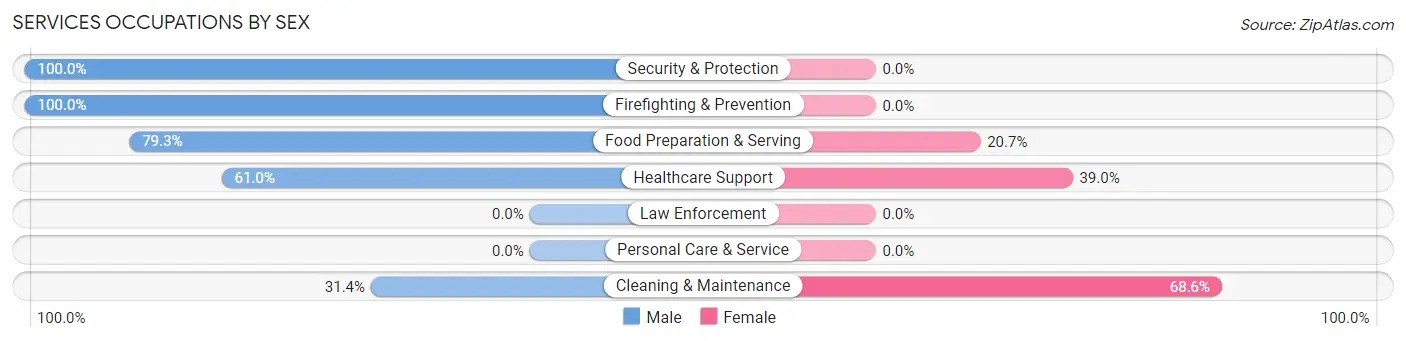
Services Occupations by Sex
Within the Services occupations in Westway, the most male-oriented occupations are Security & Protection (100.0%), Firefighting & Prevention (100.0%), and Food Preparation & Serving (79.3%), while the most female-oriented occupations are Cleaning & Maintenance (68.6%), Healthcare Support (39.0%), and Food Preparation & Serving (20.7%).
| Occupation | Male | Female |
| Healthcare Support | 61 (61.0%) | 39 (39.0%) |
| Security & Protection | 9 (100.0%) | 0 (0.0%) |
| Firefighting & Prevention | 9 (100.0%) | 0 (0.0%) |
| Law Enforcement | 0 (0.0%) | 0 (0.0%) |
| Food Preparation & Serving | 65 (79.3%) | 17 (20.7%) |
| Cleaning & Maintenance | 11 (31.4%) | 24 (68.6%) |
| Personal Care & Service | 0 (0.0%) | 0 (0.0%) |
| Total (Category) | 146 (64.6%) | 80 (35.4%) |
| Total (Overall) | 934 (76.4%) | 288 (23.6%) |
Sales and Office Occupations
The most common Sales and Office occupations in Westway are Sales & Related (237 | 19.4%), and Office & Administration (104 | 8.5%).

Sales and Office Occupations by Sex

| Occupation | Male | Female |
| Sales & Related | 152 (64.1%) | 85 (35.9%) |
| Office & Administration | 104 (100.0%) | 0 (0.0%) |
| Total (Category) | 256 (75.1%) | 85 (24.9%) |
| Total (Overall) | 934 (76.4%) | 288 (23.6%) |
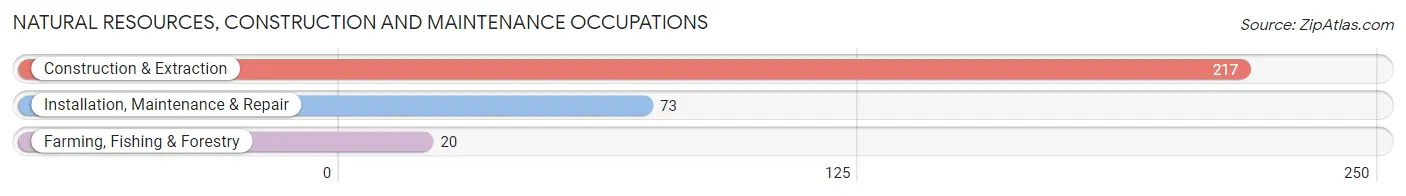
Natural Resources, Construction and Maintenance Occupations
The most common Natural Resources, Construction and Maintenance occupations in Westway are Construction & Extraction (217 | 17.8%), Installation, Maintenance & Repair (73 | 6.0%), and Farming, Fishing & Forestry (20 | 1.6%).
Natural Resources, Construction and Maintenance Occupations by Sex
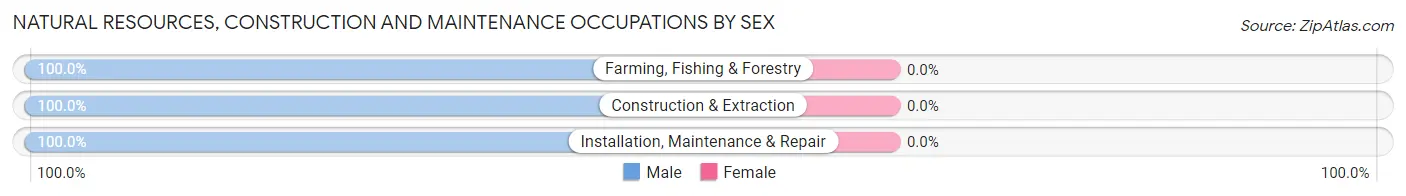
| Occupation | Male | Female |
| Farming, Fishing & Forestry | 20 (100.0%) | 0 (0.0%) |
| Construction & Extraction | 217 (100.0%) | 0 (0.0%) |
| Installation, Maintenance & Repair | 73 (100.0%) | 0 (0.0%) |
| Total (Category) | 310 (100.0%) | 0 (0.0%) |
| Total (Overall) | 934 (76.4%) | 288 (23.6%) |
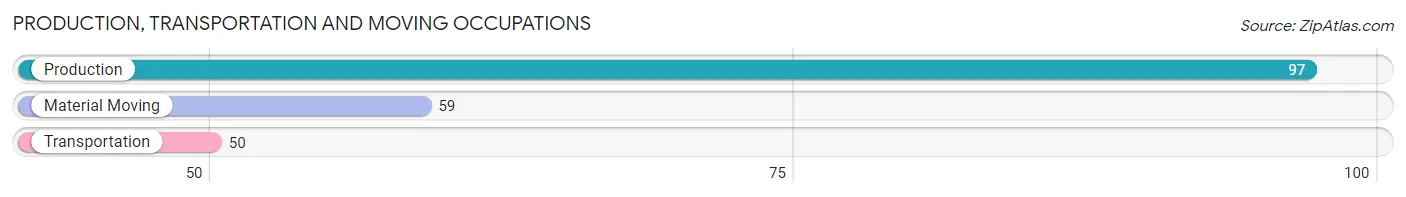
Production, Transportation and Moving Occupations
The most common Production, Transportation and Moving occupations in Westway are Production (97 | 7.9%), Material Moving (59 | 4.8%), and Transportation (50 | 4.1%).
Production, Transportation and Moving Occupations by Sex
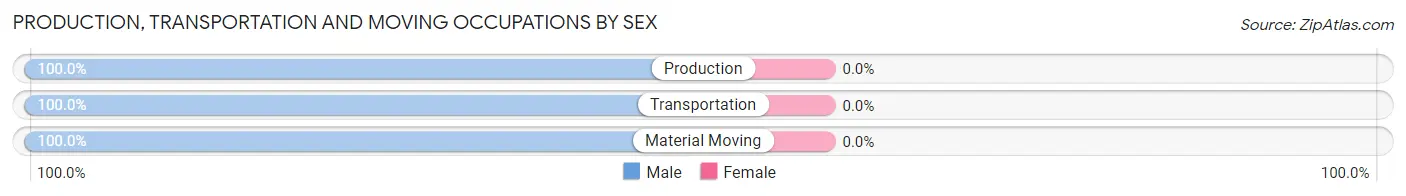
| Occupation | Male | Female |
| Production | 97 (100.0%) | 0 (0.0%) |
| Transportation | 50 (100.0%) | 0 (0.0%) |
| Material Moving | 59 (100.0%) | 0 (0.0%) |
| Total (Category) | 206 (100.0%) | 0 (0.0%) |
| Total (Overall) | 934 (76.4%) | 288 (23.6%) |
Employment Industries by Sex in Westway
Employment Industries in Westway
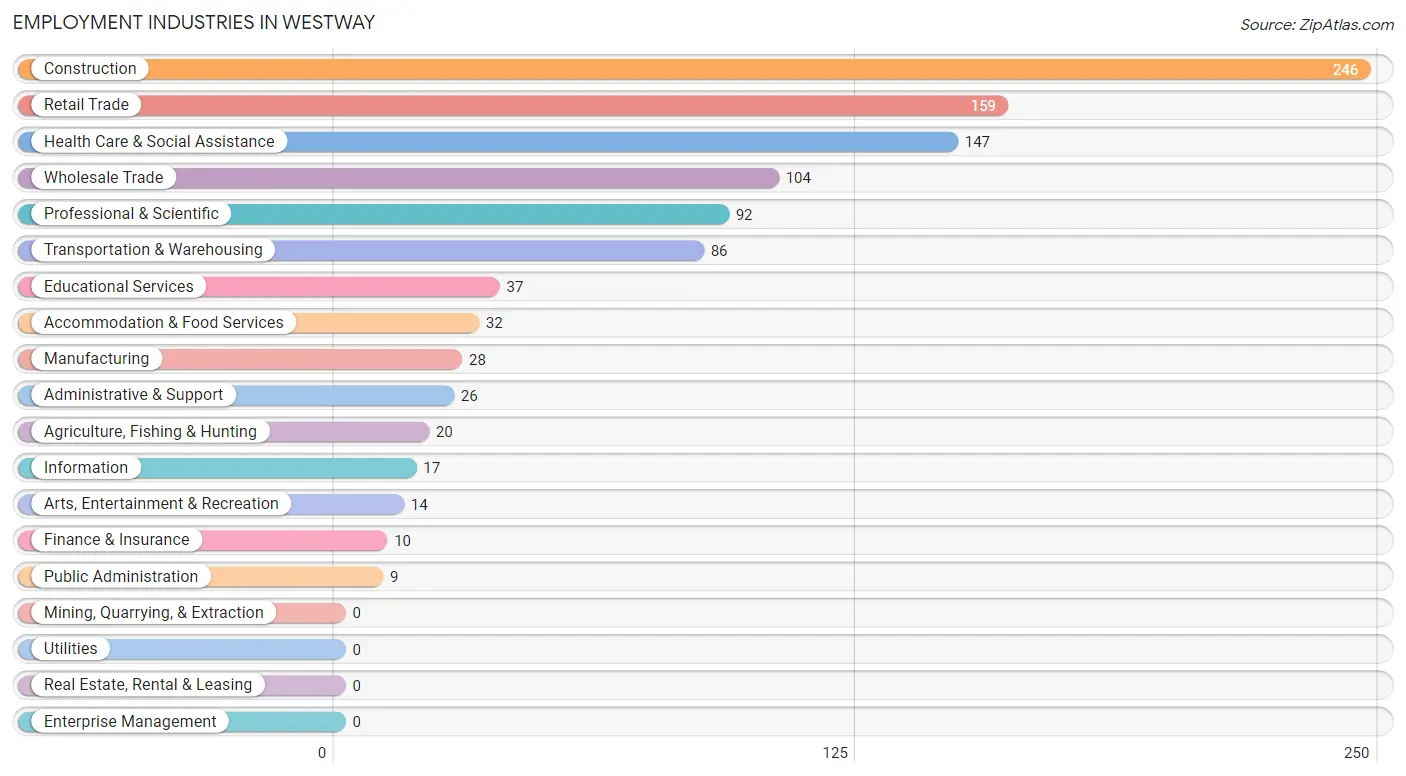
The major employment industries in Westway include Construction (246 | 20.1%), Retail Trade (159 | 13.0%), Health Care & Social Assistance (147 | 12.0%), Wholesale Trade (104 | 8.5%), and Professional & Scientific (92 | 7.5%).
Employment Industries by Sex in Westway
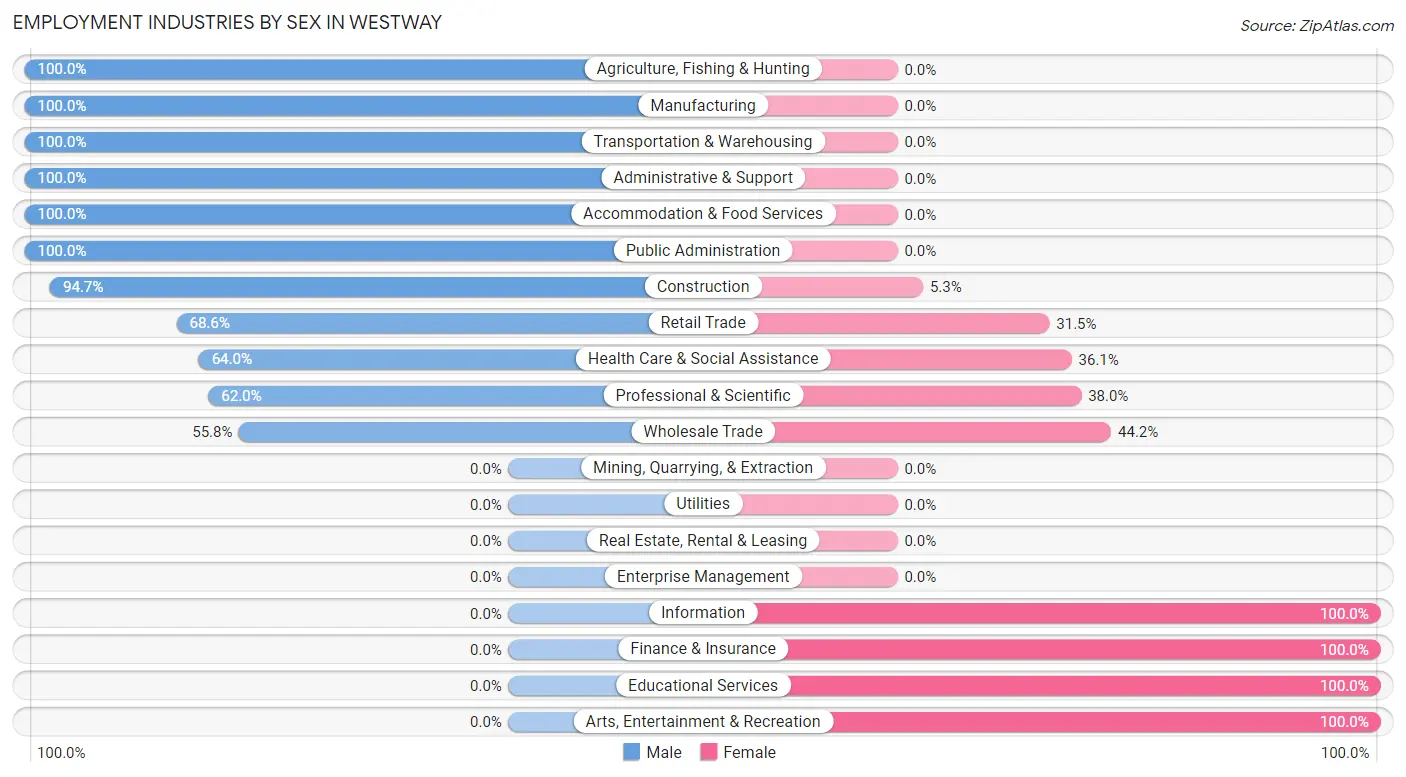
The Westway industries that see more men than women are Agriculture, Fishing & Hunting (100.0%), Manufacturing (100.0%), and Transportation & Warehousing (100.0%), whereas the industries that tend to have a higher number of women are Information (100.0%), Finance & Insurance (100.0%), and Educational Services (100.0%).
| Industry | Male | Female |
| Agriculture, Fishing & Hunting | 20 (100.0%) | 0 (0.0%) |
| Mining, Quarrying, & Extraction | 0 (0.0%) | 0 (0.0%) |
| Construction | 233 (94.7%) | 13 (5.3%) |
| Manufacturing | 28 (100.0%) | 0 (0.0%) |
| Wholesale Trade | 58 (55.8%) | 46 (44.2%) |
| Retail Trade | 109 (68.5%) | 50 (31.5%) |
| Transportation & Warehousing | 86 (100.0%) | 0 (0.0%) |
| Utilities | 0 (0.0%) | 0 (0.0%) |
| Information | 0 (0.0%) | 17 (100.0%) |
| Finance & Insurance | 0 (0.0%) | 10 (100.0%) |
| Real Estate, Rental & Leasing | 0 (0.0%) | 0 (0.0%) |
| Professional & Scientific | 57 (62.0%) | 35 (38.0%) |
| Enterprise Management | 0 (0.0%) | 0 (0.0%) |
| Administrative & Support | 26 (100.0%) | 0 (0.0%) |
| Educational Services | 0 (0.0%) | 37 (100.0%) |
| Health Care & Social Assistance | 94 (63.9%) | 53 (36.0%) |
| Arts, Entertainment & Recreation | 0 (0.0%) | 14 (100.0%) |
| Accommodation & Food Services | 32 (100.0%) | 0 (0.0%) |
| Public Administration | 9 (100.0%) | 0 (0.0%) |
| Total | 934 (76.4%) | 288 (23.6%) |
Education in Westway
School Enrollment in Westway
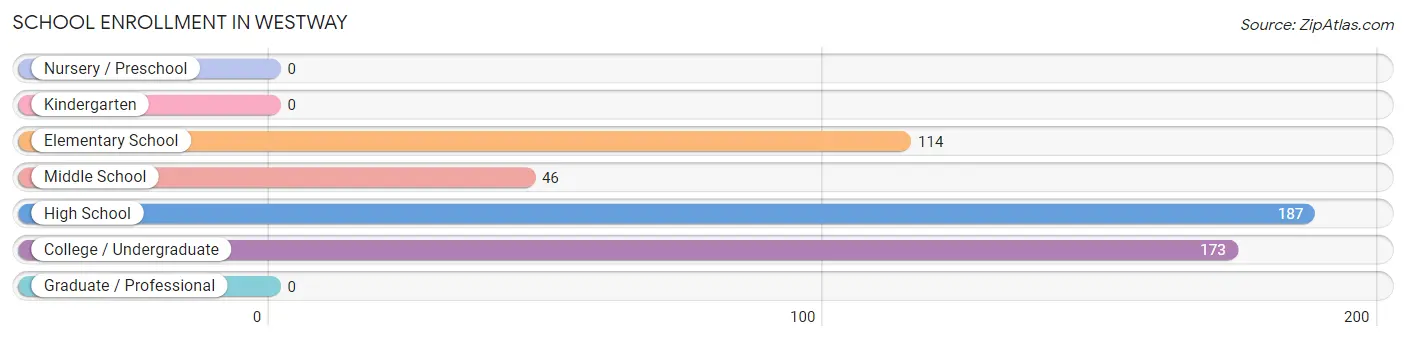
The most common levels of schooling among the 520 students in Westway are high school (187 | 36.0%), college / undergraduate (173 | 33.3%), and elementary school (114 | 21.9%).
| School Level | # Students | % Students |
| Nursery / Preschool | 0 | 0.0% |
| Kindergarten | 0 | 0.0% |
| Elementary School | 114 | 21.9% |
| Middle School | 46 | 8.8% |
| High School | 187 | 36.0% |
| College / Undergraduate | 173 | 33.3% |
| Graduate / Professional | 0 | 0.0% |
| Total | 520 | 100.0% |
School Enrollment by Age by Funding Source in Westway
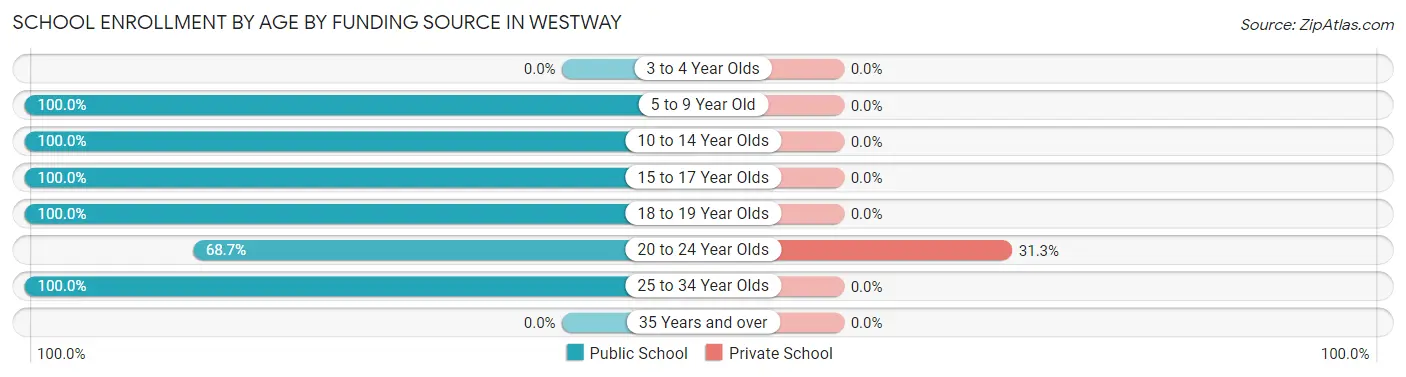
Out of a total of 520 students who are enrolled in schools in Westway, 26 (5.0%) attend a private institution, while the remaining 494 (95.0%) are enrolled in public schools. The age group of 20 to 24 year olds has the highest likelihood of being enrolled in private schools, with 26 (31.3% in the age bracket) enrolled. Conversely, the age group of 5 to 9 year old has the lowest likelihood of being enrolled in a private school, with 44 (100.0% in the age bracket) attending a public institution.
| Age Bracket | Public School | Private School |
| 3 to 4 Year Olds | 0 (0.0%) | 0 (0.0%) |
| 5 to 9 Year Old | 44 (100.0%) | 0 (0.0%) |
| 10 to 14 Year Olds | 138 (100.0%) | 0 (0.0%) |
| 15 to 17 Year Olds | 147 (100.0%) | 0 (0.0%) |
| 18 to 19 Year Olds | 88 (100.0%) | 0 (0.0%) |
| 20 to 24 Year Olds | 57 (68.7%) | 26 (31.3%) |
| 25 to 34 Year Olds | 20 (100.0%) | 0 (0.0%) |
| 35 Years and over | 0 (0.0%) | 0 (0.0%) |
| Total | 494 (95.0%) | 26 (5.0%) |
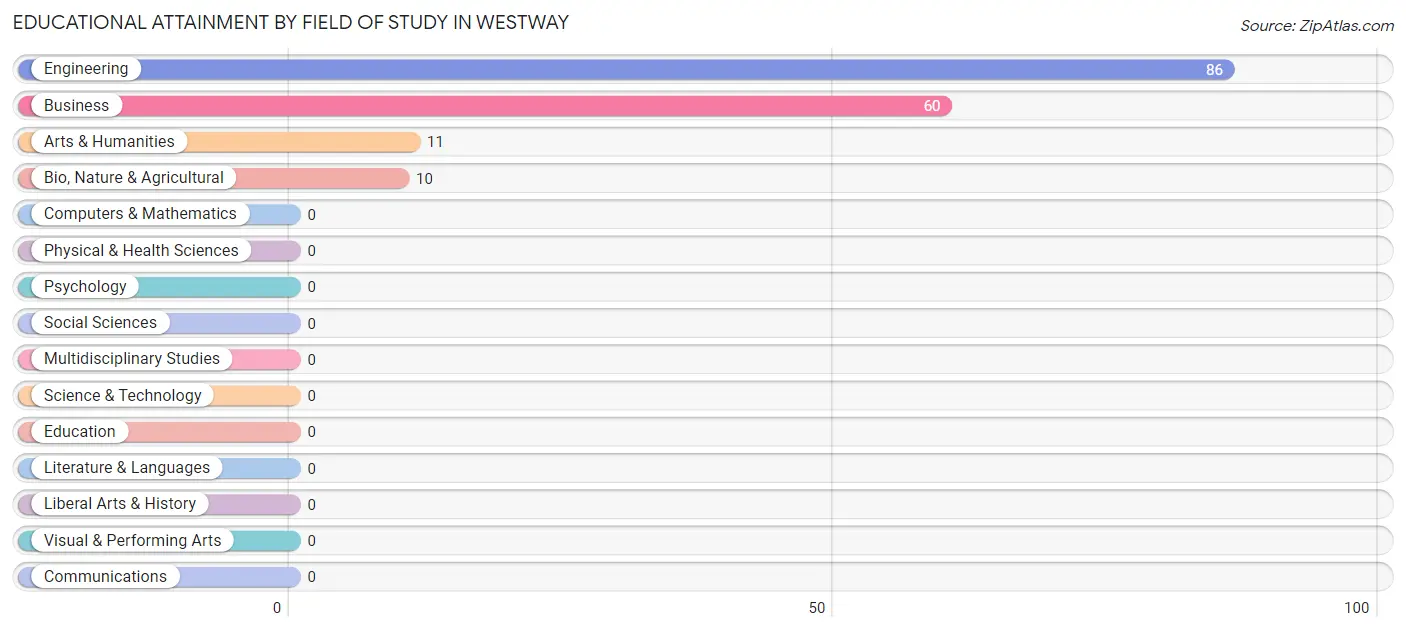
Educational Attainment by Field of Study in Westway
Engineering (86 | 51.5%), business (60 | 35.9%), arts & humanities (11 | 6.6%), and bio, nature & agricultural (10 | 6.0%) are the most common fields of study among 167 individuals in Westway who have obtained a bachelor's degree or higher.
| Field of Study | # Graduates | % Graduates |
| Computers & Mathematics | 0 | 0.0% |
| Bio, Nature & Agricultural | 10 | 6.0% |
| Physical & Health Sciences | 0 | 0.0% |
| Psychology | 0 | 0.0% |
| Social Sciences | 0 | 0.0% |
| Engineering | 86 | 51.5% |
| Multidisciplinary Studies | 0 | 0.0% |
| Science & Technology | 0 | 0.0% |
| Business | 60 | 35.9% |
| Education | 0 | 0.0% |
| Literature & Languages | 0 | 0.0% |
| Liberal Arts & History | 0 | 0.0% |
| Visual & Performing Arts | 0 | 0.0% |
| Communications | 0 | 0.0% |
| Arts & Humanities | 11 | 6.6% |
| Total | 167 | 100.0% |
Transportation & Commute in Westway
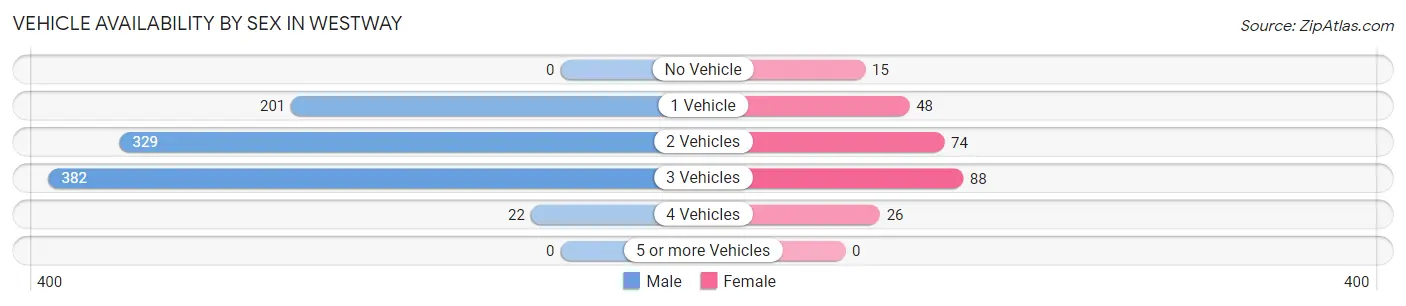
Vehicle Availability by Sex in Westway
The most prevalent vehicle ownership categories in Westway are males with 3 vehicles (382, accounting for 40.9%) and females with 3 vehicles (88, making up 152.2%).
| Vehicles Available | Male | Female |
| No Vehicle | 0 (0.0%) | 15 (6.0%) |
| 1 Vehicle | 201 (21.5%) | 48 (19.1%) |
| 2 Vehicles | 329 (35.2%) | 74 (29.5%) |
| 3 Vehicles | 382 (40.9%) | 88 (35.1%) |
| 4 Vehicles | 22 (2.4%) | 26 (10.4%) |
| 5 or more Vehicles | 0 (0.0%) | 0 (0.0%) |
| Total | 934 (100.0%) | 251 (100.0%) |
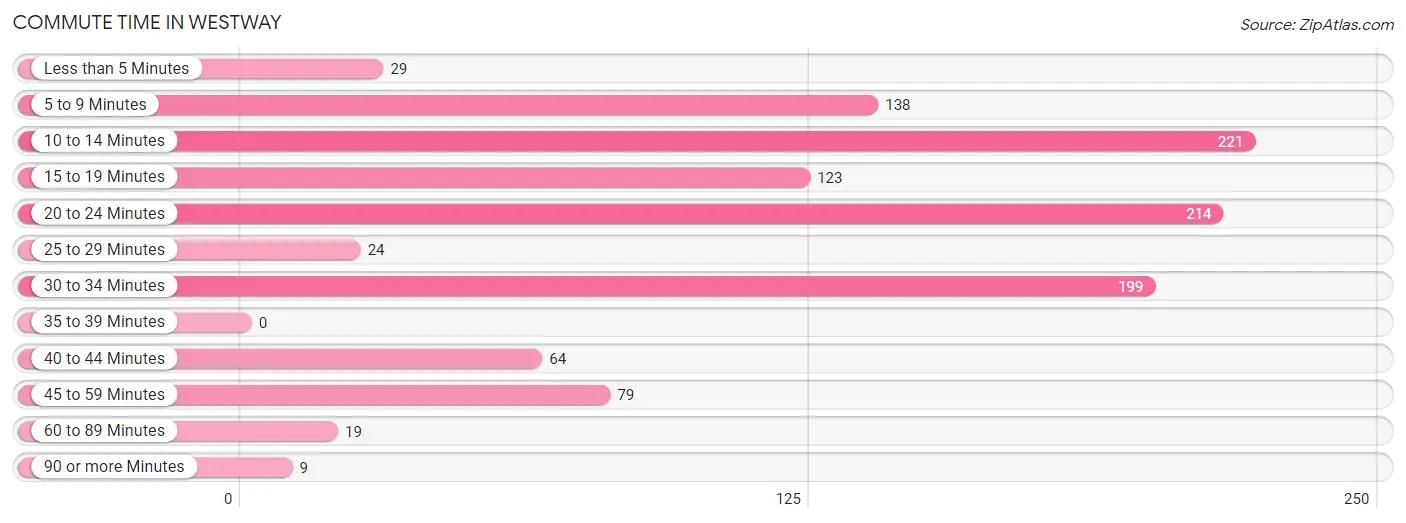
Commute Time in Westway
The most frequently occuring commute durations in Westway are 10 to 14 minutes (221 commuters, 19.8%), 20 to 24 minutes (214 commuters, 19.1%), and 30 to 34 minutes (199 commuters, 17.8%).
| Commute Time | # Commuters | % Commuters |
| Less than 5 Minutes | 29 | 2.6% |
| 5 to 9 Minutes | 138 | 12.3% |
| 10 to 14 Minutes | 221 | 19.8% |
| 15 to 19 Minutes | 123 | 11.0% |
| 20 to 24 Minutes | 214 | 19.1% |
| 25 to 29 Minutes | 24 | 2.1% |
| 30 to 34 Minutes | 199 | 17.8% |
| 35 to 39 Minutes | 0 | 0.0% |
| 40 to 44 Minutes | 64 | 5.7% |
| 45 to 59 Minutes | 79 | 7.1% |
| 60 to 89 Minutes | 19 | 1.7% |
| 90 or more Minutes | 9 | 0.8% |
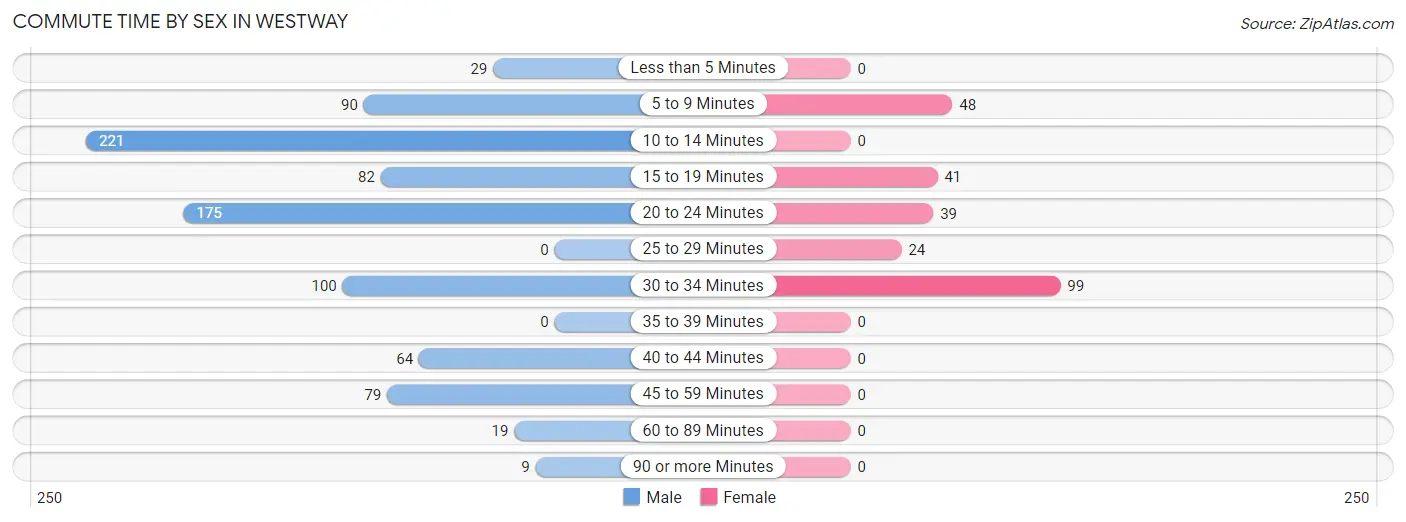
Commute Time by Sex in Westway
The most common commute times in Westway are 10 to 14 minutes (221 commuters, 25.5%) for males and 30 to 34 minutes (99 commuters, 39.4%) for females.
| Commute Time | Male | Female |
| Less than 5 Minutes | 29 (3.3%) | 0 (0.0%) |
| 5 to 9 Minutes | 90 (10.4%) | 48 (19.1%) |
| 10 to 14 Minutes | 221 (25.5%) | 0 (0.0%) |
| 15 to 19 Minutes | 82 (9.5%) | 41 (16.3%) |
| 20 to 24 Minutes | 175 (20.2%) | 39 (15.5%) |
| 25 to 29 Minutes | 0 (0.0%) | 24 (9.6%) |
| 30 to 34 Minutes | 100 (11.5%) | 99 (39.4%) |
| 35 to 39 Minutes | 0 (0.0%) | 0 (0.0%) |
| 40 to 44 Minutes | 64 (7.4%) | 0 (0.0%) |
| 45 to 59 Minutes | 79 (9.1%) | 0 (0.0%) |
| 60 to 89 Minutes | 19 (2.2%) | 0 (0.0%) |
| 90 or more Minutes | 9 (1.0%) | 0 (0.0%) |
Time of Departure to Work by Sex in Westway
The most frequent times of departure to work in Westway are 6:00 AM to 6:29 AM (266, 30.6%) for males and 7:00 AM to 7:29 AM (52, 20.7%) for females.
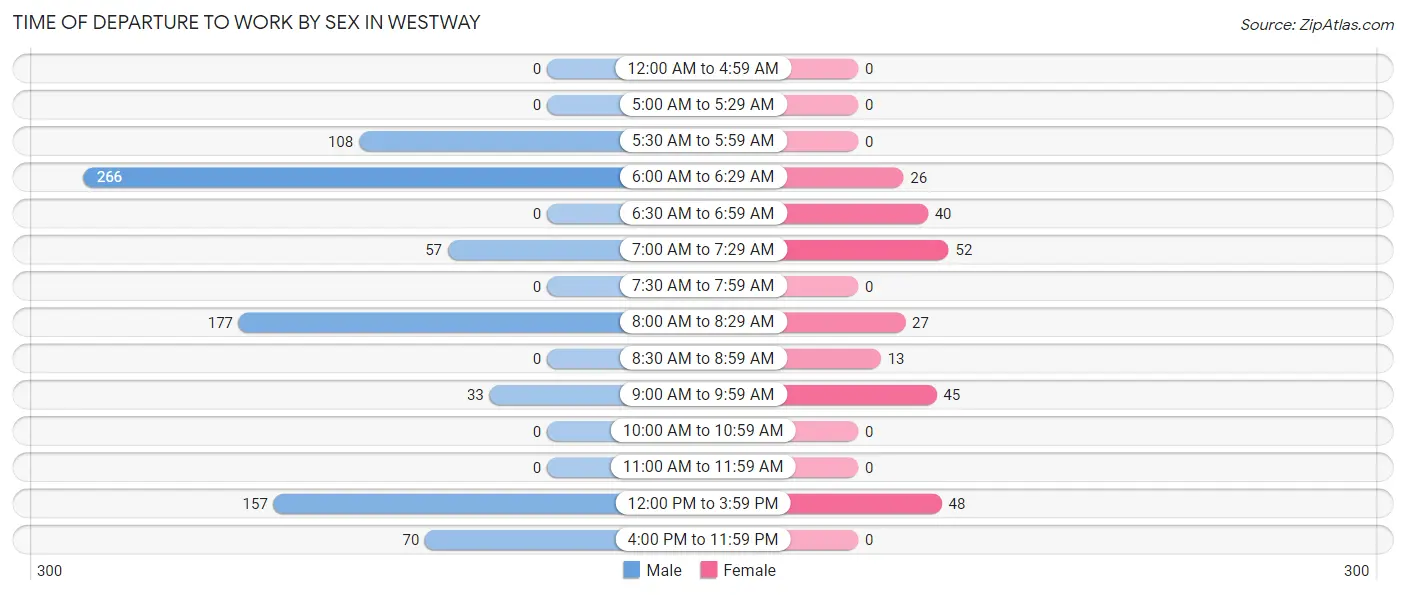
| Time of Departure | Male | Female |
| 12:00 AM to 4:59 AM | 0 (0.0%) | 0 (0.0%) |
| 5:00 AM to 5:29 AM | 0 (0.0%) | 0 (0.0%) |
| 5:30 AM to 5:59 AM | 108 (12.4%) | 0 (0.0%) |
| 6:00 AM to 6:29 AM | 266 (30.6%) | 26 (10.4%) |
| 6:30 AM to 6:59 AM | 0 (0.0%) | 40 (15.9%) |
| 7:00 AM to 7:29 AM | 57 (6.6%) | 52 (20.7%) |
| 7:30 AM to 7:59 AM | 0 (0.0%) | 0 (0.0%) |
| 8:00 AM to 8:29 AM | 177 (20.4%) | 27 (10.8%) |
| 8:30 AM to 8:59 AM | 0 (0.0%) | 13 (5.2%) |
| 9:00 AM to 9:59 AM | 33 (3.8%) | 45 (17.9%) |
| 10:00 AM to 10:59 AM | 0 (0.0%) | 0 (0.0%) |
| 11:00 AM to 11:59 AM | 0 (0.0%) | 0 (0.0%) |
| 12:00 PM to 3:59 PM | 157 (18.1%) | 48 (19.1%) |
| 4:00 PM to 11:59 PM | 70 (8.1%) | 0 (0.0%) |
| Total | 868 (100.0%) | 251 (100.0%) |
Housing Occupancy in Westway
Occupancy by Ownership in Westway
Of the total 1,223 dwellings in Westway, owner-occupied units account for 938 (76.7%), while renter-occupied units make up 285 (23.3%).
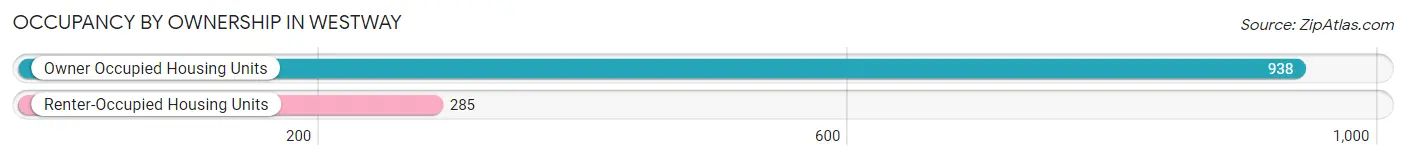
| Occupancy | # Housing Units | % Housing Units |
| Owner Occupied Housing Units | 938 | 76.7% |
| Renter-Occupied Housing Units | 285 | 23.3% |
| Total Occupied Housing Units | 1,223 | 100.0% |
Occupancy by Household Size in Westway
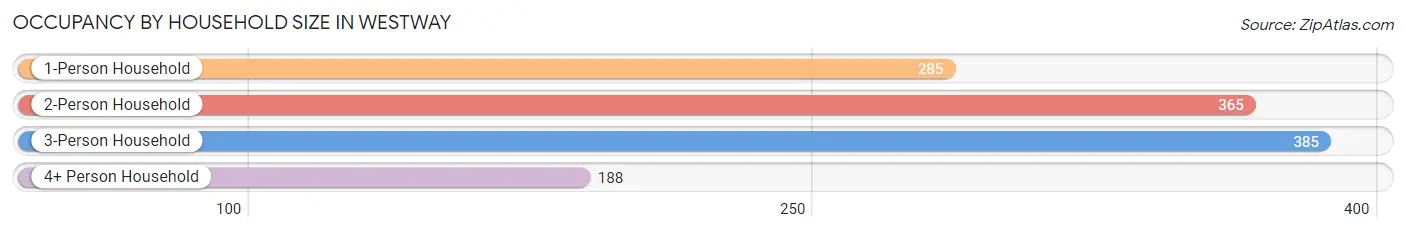
| Household Size | # Housing Units | % Housing Units |
| 1-Person Household | 285 | 23.3% |
| 2-Person Household | 365 | 29.8% |
| 3-Person Household | 385 | 31.5% |
| 4+ Person Household | 188 | 15.4% |
| Total Housing Units | 1,223 | 100.0% |
Occupancy by Ownership by Household Size in Westway
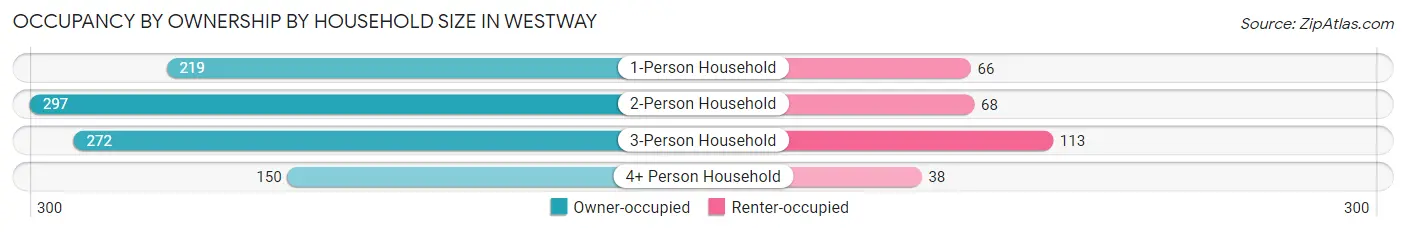
| Household Size | Owner-occupied | Renter-occupied |
| 1-Person Household | 219 (76.8%) | 66 (23.2%) |
| 2-Person Household | 297 (81.4%) | 68 (18.6%) |
| 3-Person Household | 272 (70.7%) | 113 (29.3%) |
| 4+ Person Household | 150 (79.8%) | 38 (20.2%) |
| Total Housing Units | 938 (76.7%) | 285 (23.3%) |
Occupancy by Educational Attainment in Westway
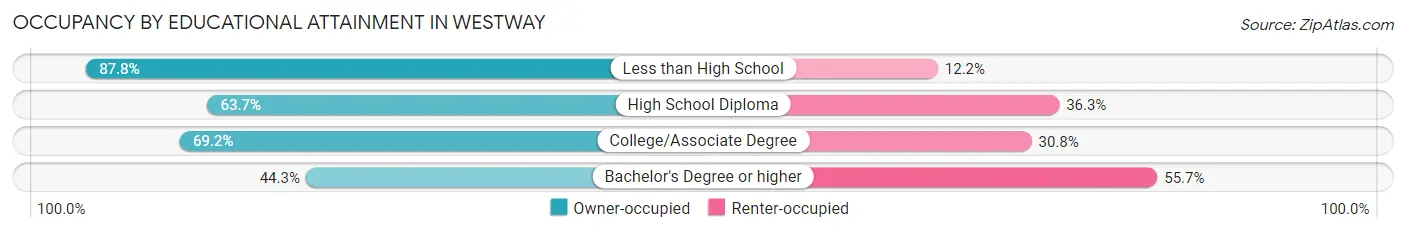
| Household Size | Owner-occupied | Renter-occupied |
| Less than High School | 567 (87.8%) | 79 (12.2%) |
| High School Diploma | 151 (63.7%) | 86 (36.3%) |
| College/Associate Degree | 193 (69.2%) | 86 (30.8%) |
| Bachelor's Degree or higher | 27 (44.3%) | 34 (55.7%) |
Occupancy by Age of Householder in Westway
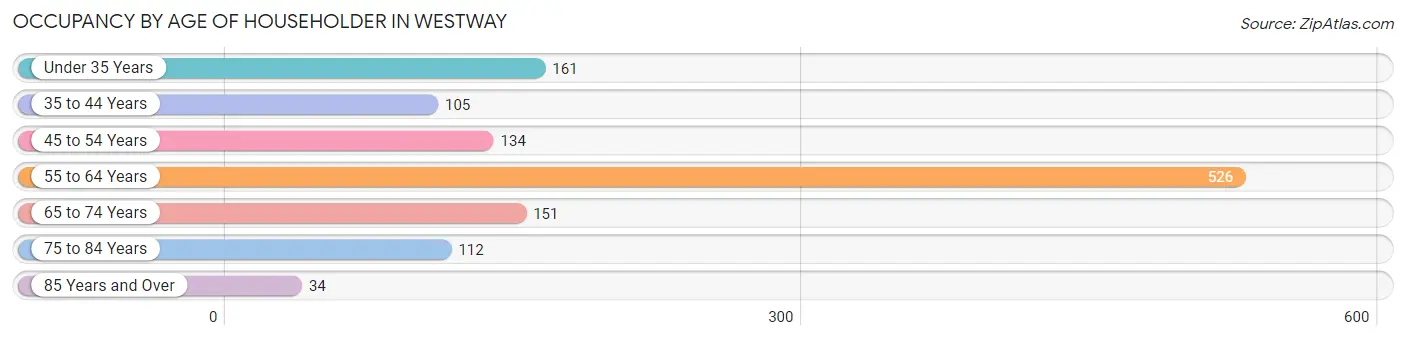
| Age Bracket | # Households | % Households |
| Under 35 Years | 161 | 13.2% |
| 35 to 44 Years | 105 | 8.6% |
| 45 to 54 Years | 134 | 11.0% |
| 55 to 64 Years | 526 | 43.0% |
| 65 to 74 Years | 151 | 12.3% |
| 75 to 84 Years | 112 | 9.2% |
| 85 Years and Over | 34 | 2.8% |
| Total | 1,223 | 100.0% |
Housing Finances in Westway
Median Income by Occupancy in Westway
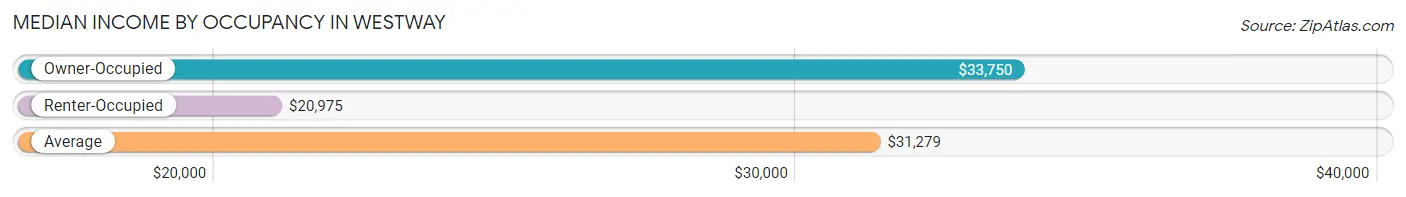
| Occupancy Type | # Households | Median Income |
| Owner-Occupied | 938 (76.7%) | $33,750 |
| Renter-Occupied | 285 (23.3%) | $20,975 |
| Average | 1,223 (100.0%) | $31,279 |
Occupancy by Householder Income Bracket in Westway
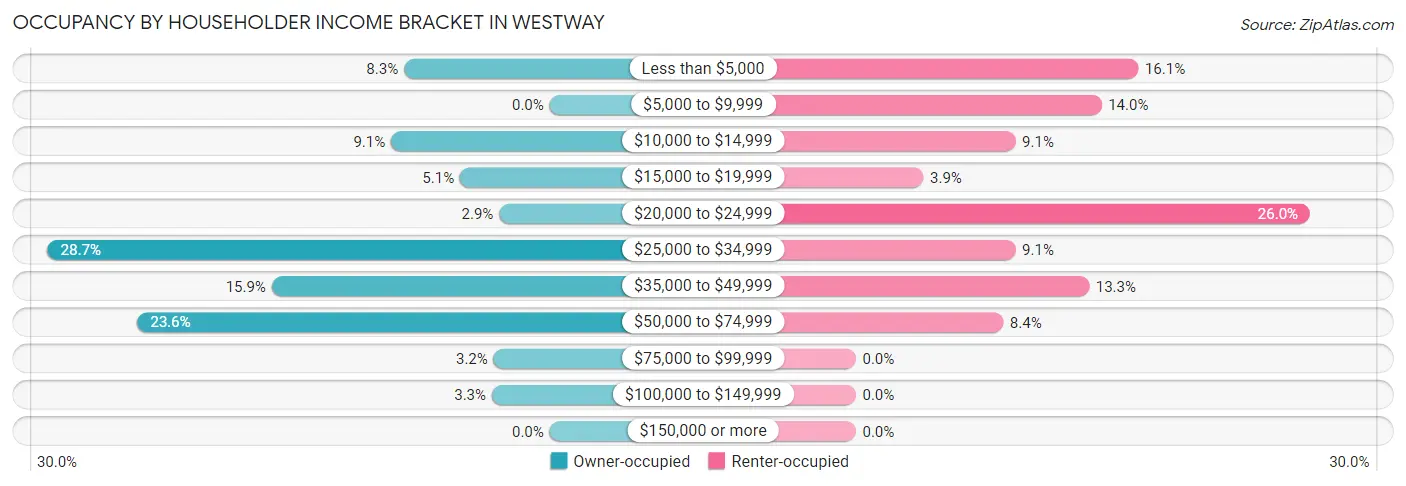
| Income Bracket | Owner-occupied | Renter-occupied |
| Less than $5,000 | 78 (8.3%) | 46 (16.1%) |
| $5,000 to $9,999 | 0 (0.0%) | 40 (14.0%) |
| $10,000 to $14,999 | 85 (9.1%) | 26 (9.1%) |
| $15,000 to $19,999 | 48 (5.1%) | 11 (3.9%) |
| $20,000 to $24,999 | 27 (2.9%) | 74 (26.0%) |
| $25,000 to $34,999 | 269 (28.7%) | 26 (9.1%) |
| $35,000 to $49,999 | 149 (15.9%) | 38 (13.3%) |
| $50,000 to $74,999 | 221 (23.6%) | 24 (8.4%) |
| $75,000 to $99,999 | 30 (3.2%) | 0 (0.0%) |
| $100,000 to $149,999 | 31 (3.3%) | 0 (0.0%) |
| $150,000 or more | 0 (0.0%) | 0 (0.0%) |
| Total | 938 (100.0%) | 285 (100.0%) |
Monthly Housing Cost Tiers in Westway
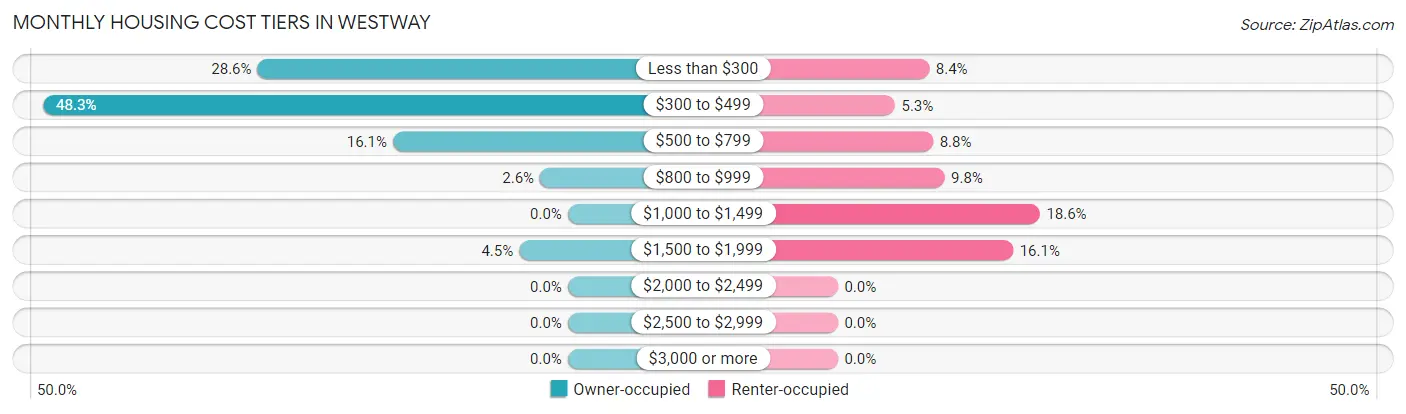
| Monthly Cost | Owner-occupied | Renter-occupied |
| Less than $300 | 268 (28.6%) | 24 (8.4%) |
| $300 to $499 | 453 (48.3%) | 15 (5.3%) |
| $500 to $799 | 151 (16.1%) | 25 (8.8%) |
| $800 to $999 | 24 (2.6%) | 28 (9.8%) |
| $1,000 to $1,499 | 0 (0.0%) | 53 (18.6%) |
| $1,500 to $1,999 | 42 (4.5%) | 46 (16.1%) |
| $2,000 to $2,499 | 0 (0.0%) | 0 (0.0%) |
| $2,500 to $2,999 | 0 (0.0%) | 0 (0.0%) |
| $3,000 or more | 0 (0.0%) | 0 (0.0%) |
| Total | 938 (100.0%) | 285 (100.0%) |
Physical Housing Characteristics in Westway
Housing Structures in Westway
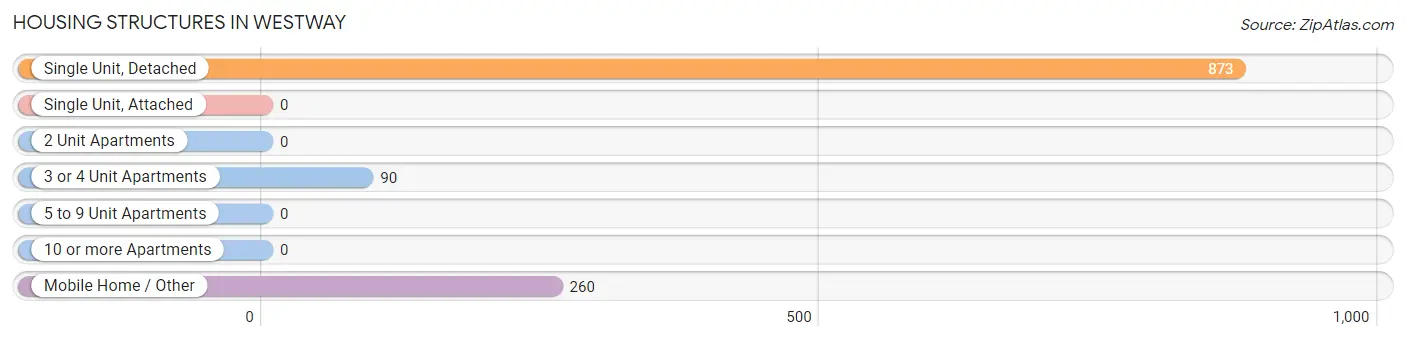
| Structure Type | # Housing Units | % Housing Units |
| Single Unit, Detached | 873 | 71.4% |
| Single Unit, Attached | 0 | 0.0% |
| 2 Unit Apartments | 0 | 0.0% |
| 3 or 4 Unit Apartments | 90 | 7.4% |
| 5 to 9 Unit Apartments | 0 | 0.0% |
| 10 or more Apartments | 0 | 0.0% |
| Mobile Home / Other | 260 | 21.3% |
| Total | 1,223 | 100.0% |
Housing Structures by Occupancy in Westway
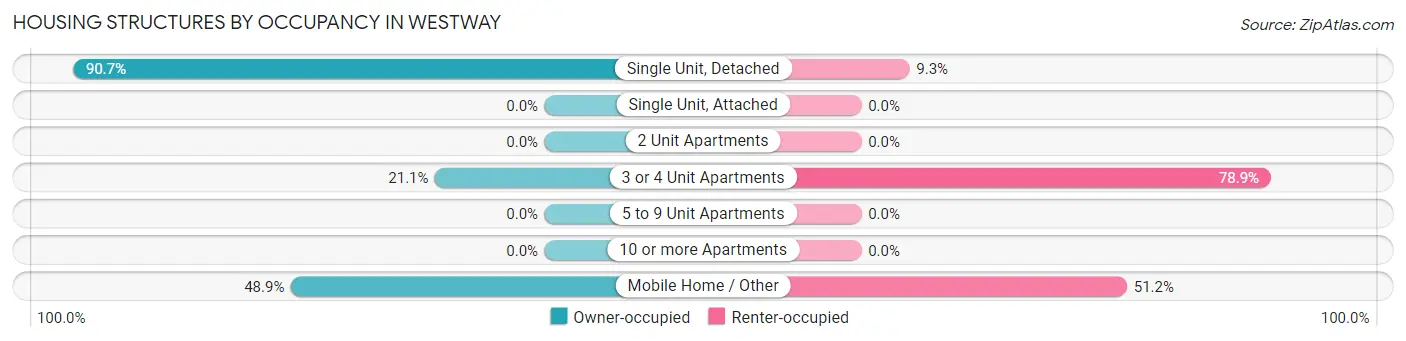
| Structure Type | Owner-occupied | Renter-occupied |
| Single Unit, Detached | 792 (90.7%) | 81 (9.3%) |
| Single Unit, Attached | 0 (0.0%) | 0 (0.0%) |
| 2 Unit Apartments | 0 (0.0%) | 0 (0.0%) |
| 3 or 4 Unit Apartments | 19 (21.1%) | 71 (78.9%) |
| 5 to 9 Unit Apartments | 0 (0.0%) | 0 (0.0%) |
| 10 or more Apartments | 0 (0.0%) | 0 (0.0%) |
| Mobile Home / Other | 127 (48.8%) | 133 (51.1%) |
| Total | 938 (76.7%) | 285 (23.3%) |
Housing Structures by Number of Rooms in Westway
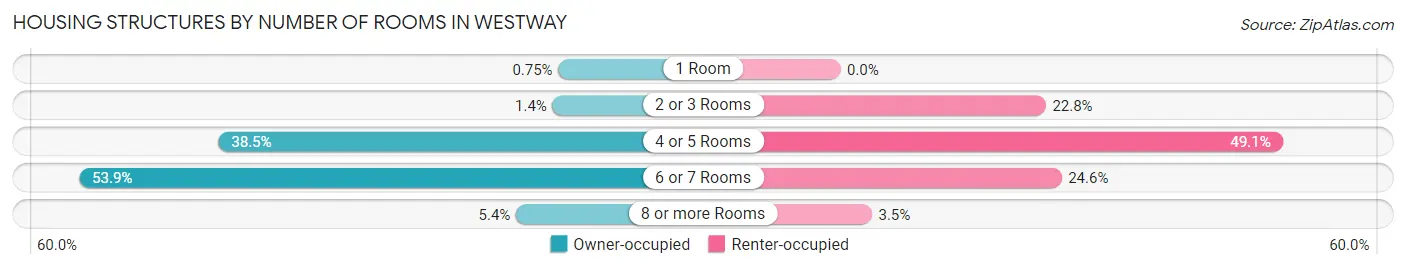
| Number of Rooms | Owner-occupied | Renter-occupied |
| 1 Room | 7 (0.7%) | 0 (0.0%) |
| 2 or 3 Rooms | 13 (1.4%) | 65 (22.8%) |
| 4 or 5 Rooms | 361 (38.5%) | 140 (49.1%) |
| 6 or 7 Rooms | 506 (53.9%) | 70 (24.6%) |
| 8 or more Rooms | 51 (5.4%) | 10 (3.5%) |
| Total | 938 (100.0%) | 285 (100.0%) |
Housing Structure by Heating Type in Westway
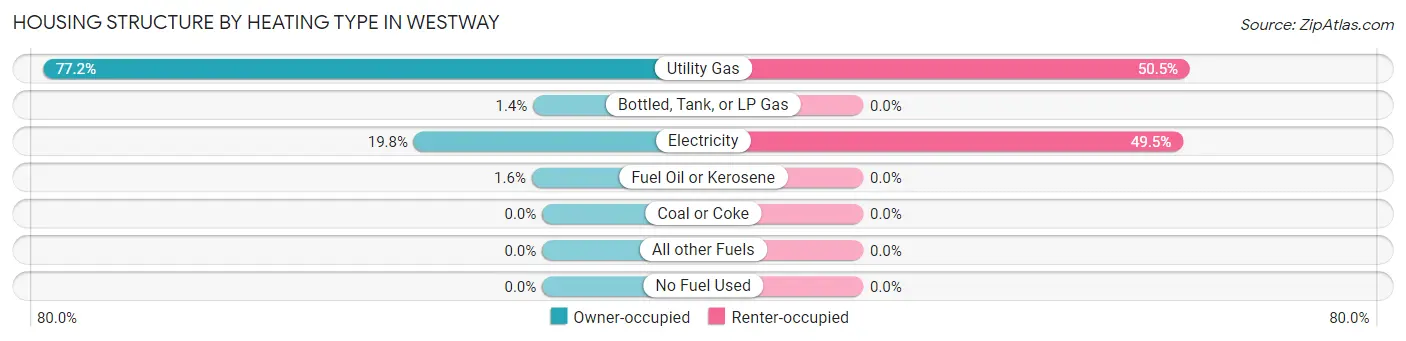
| Heating Type | Owner-occupied | Renter-occupied |
| Utility Gas | 724 (77.2%) | 144 (50.5%) |
| Bottled, Tank, or LP Gas | 13 (1.4%) | 0 (0.0%) |
| Electricity | 186 (19.8%) | 141 (49.5%) |
| Fuel Oil or Kerosene | 15 (1.6%) | 0 (0.0%) |
| Coal or Coke | 0 (0.0%) | 0 (0.0%) |
| All other Fuels | 0 (0.0%) | 0 (0.0%) |
| No Fuel Used | 0 (0.0%) | 0 (0.0%) |
| Total | 938 (100.0%) | 285 (100.0%) |
Household Vehicle Usage in Westway
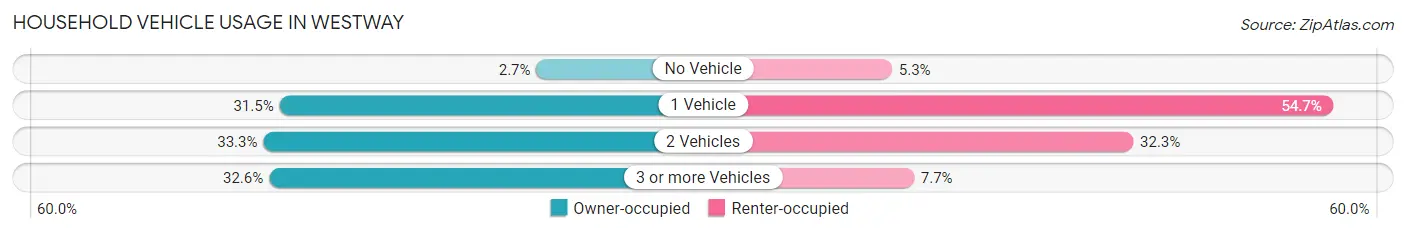
| Vehicles per Household | Owner-occupied | Renter-occupied |
| No Vehicle | 25 (2.7%) | 15 (5.3%) |
| 1 Vehicle | 295 (31.5%) | 156 (54.7%) |
| 2 Vehicles | 312 (33.3%) | 92 (32.3%) |
| 3 or more Vehicles | 306 (32.6%) | 22 (7.7%) |
| Total | 938 (100.0%) | 285 (100.0%) |
Real Estate & Mortgages in Westway
Real Estate and Mortgage Overview in Westway
| Characteristic | Without Mortgage | With Mortgage |
| Housing Units | 828 | 110 |
| Median Property Value | $70,700 | $126,300 |
| Median Household Income | $34,770 | $0 |
| Monthly Housing Costs | $354 | $0 |
| Real Estate Taxes | $1,427 | $0 |
Property Value by Mortgage Status in Westway
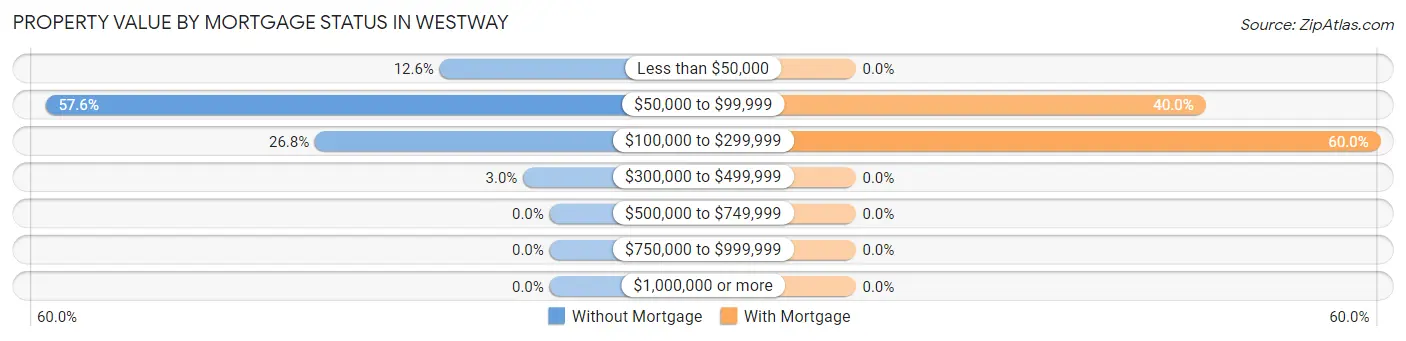
| Property Value | Without Mortgage | With Mortgage |
| Less than $50,000 | 104 (12.6%) | 0 (0.0%) |
| $50,000 to $99,999 | 477 (57.6%) | 44 (40.0%) |
| $100,000 to $299,999 | 222 (26.8%) | 66 (60.0%) |
| $300,000 to $499,999 | 25 (3.0%) | 0 (0.0%) |
| $500,000 to $749,999 | 0 (0.0%) | 0 (0.0%) |
| $750,000 to $999,999 | 0 (0.0%) | 0 (0.0%) |
| $1,000,000 or more | 0 (0.0%) | 0 (0.0%) |
| Total | 828 (100.0%) | 110 (100.0%) |
Household Income by Mortgage Status in Westway
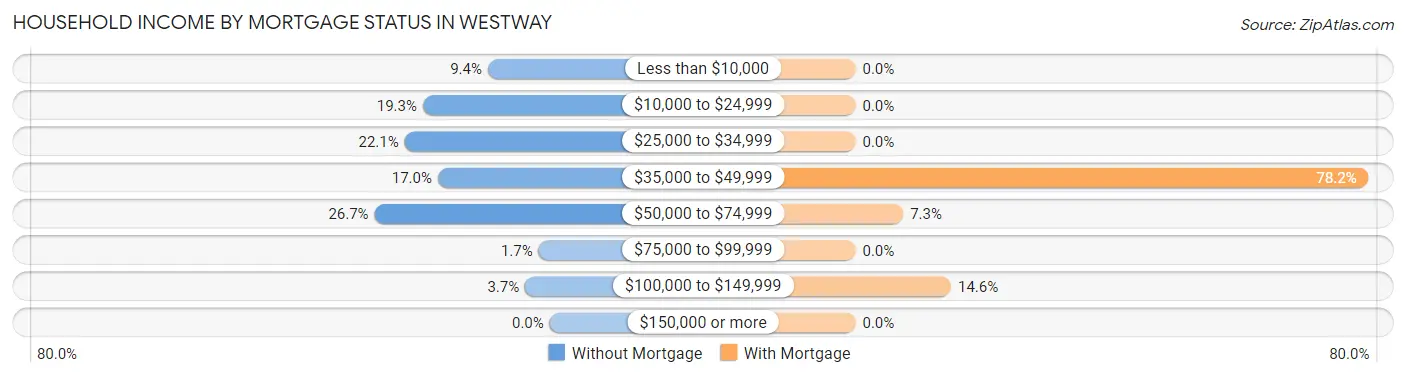
| Household Income | Without Mortgage | With Mortgage |
| Less than $10,000 | 78 (9.4%) | 0 (0.0%) |
| $10,000 to $24,999 | 160 (19.3%) | 0 (0.0%) |
| $25,000 to $34,999 | 183 (22.1%) | 0 (0.0%) |
| $35,000 to $49,999 | 141 (17.0%) | 86 (78.2%) |
| $50,000 to $74,999 | 221 (26.7%) | 8 (7.3%) |
| $75,000 to $99,999 | 14 (1.7%) | 0 (0.0%) |
| $100,000 to $149,999 | 31 (3.7%) | 16 (14.5%) |
| $150,000 or more | 0 (0.0%) | 0 (0.0%) |
| Total | 828 (100.0%) | 110 (100.0%) |
Property Value to Household Income Ratio in Westway
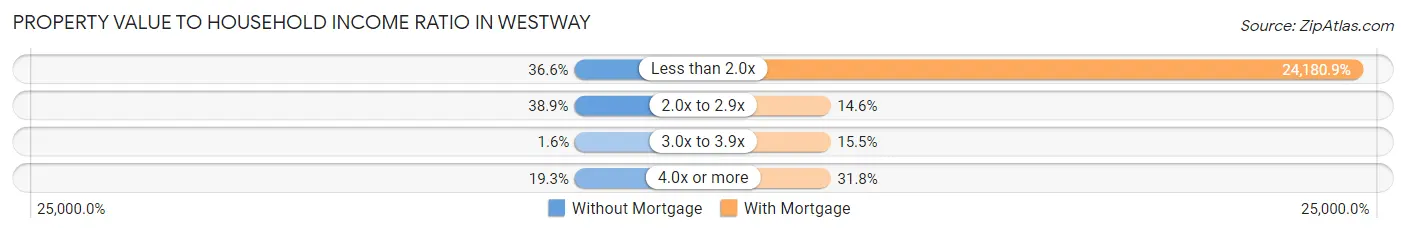
| Value-to-Income Ratio | Without Mortgage | With Mortgage |
| Less than 2.0x | 303 (36.6%) | 26,599 (24,180.9%) |
| 2.0x to 2.9x | 322 (38.9%) | 16 (14.5%) |
| 3.0x to 3.9x | 13 (1.6%) | 17 (15.4%) |
| 4.0x or more | 160 (19.3%) | 35 (31.8%) |
| Total | 828 (100.0%) | 110 (100.0%) |
Real Estate Taxes by Mortgage Status in Westway
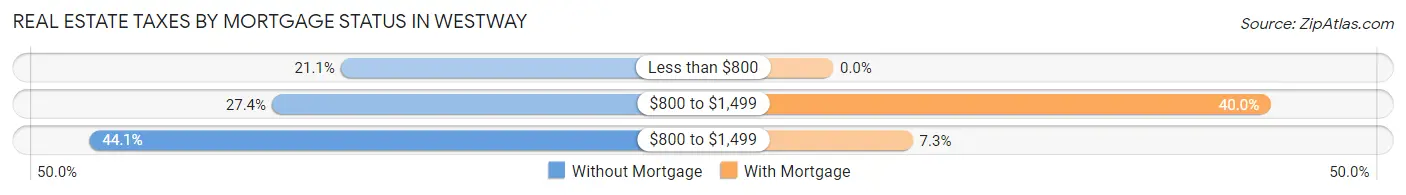
| Property Taxes | Without Mortgage | With Mortgage |
| Less than $800 | 175 (21.1%) | 0 (0.0%) |
| $800 to $1,499 | 227 (27.4%) | 44 (40.0%) |
| $800 to $1,499 | 365 (44.1%) | 8 (7.3%) |
| Total | 828 (100.0%) | 110 (100.0%) |
Health & Disability in Westway
Health Insurance Coverage by Age in Westway
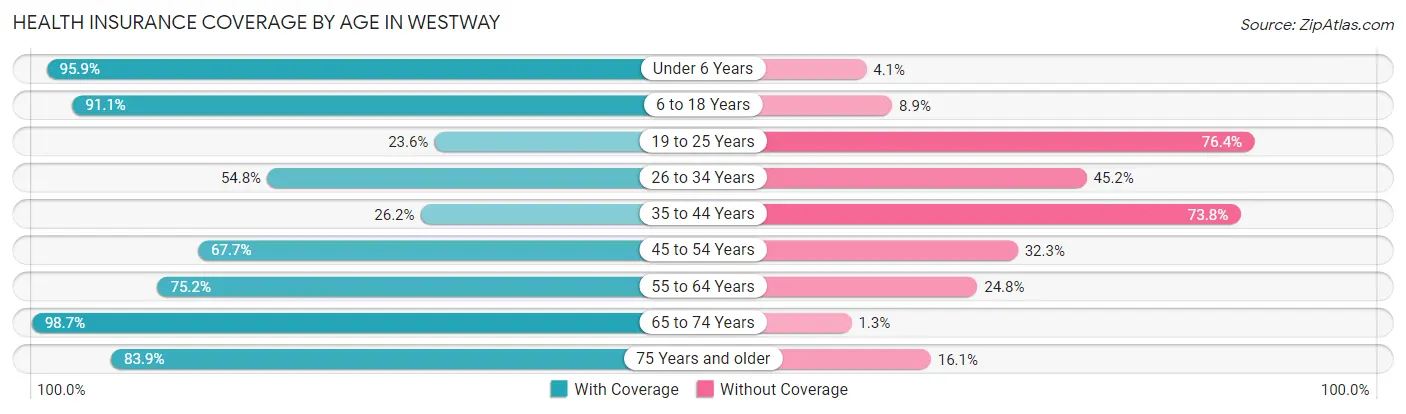
| Age Bracket | With Coverage | Without Coverage |
| Under 6 Years | 257 (95.9%) | 11 (4.1%) |
| 6 to 18 Years | 378 (91.1%) | 37 (8.9%) |
| 19 to 25 Years | 64 (23.6%) | 207 (76.4%) |
| 26 to 34 Years | 171 (54.8%) | 141 (45.2%) |
| 35 to 44 Years | 115 (26.2%) | 324 (73.8%) |
| 45 to 54 Years | 182 (67.7%) | 87 (32.3%) |
| 55 to 64 Years | 576 (75.2%) | 190 (24.8%) |
| 65 to 74 Years | 516 (98.7%) | 7 (1.3%) |
| 75 Years and older | 182 (83.9%) | 35 (16.1%) |
| Total | 2,441 (70.1%) | 1,039 (29.9%) |
Health Insurance Coverage by Citizenship Status in Westway
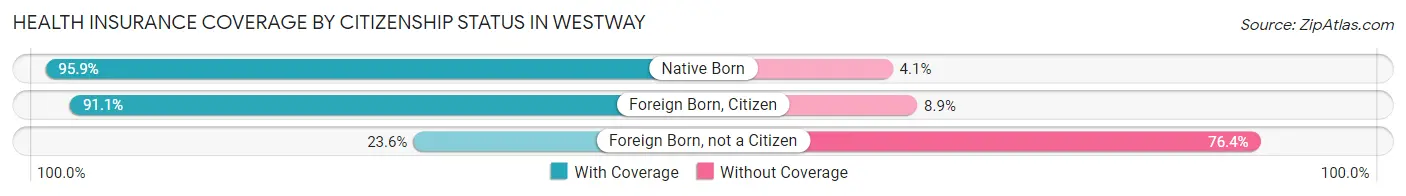
| Citizenship Status | With Coverage | Without Coverage |
| Native Born | 257 (95.9%) | 11 (4.1%) |
| Foreign Born, Citizen | 378 (91.1%) | 37 (8.9%) |
| Foreign Born, not a Citizen | 64 (23.6%) | 207 (76.4%) |
Health Insurance Coverage by Household Income in Westway
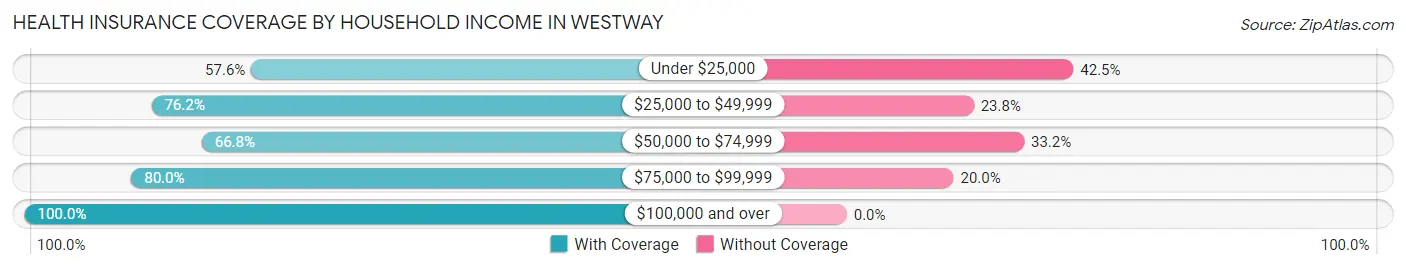
| Household Income | With Coverage | Without Coverage |
| Under $25,000 | 507 (57.6%) | 374 (42.4%) |
| $25,000 to $49,999 | 1,128 (76.2%) | 352 (23.8%) |
| $50,000 to $74,999 | 557 (66.8%) | 277 (33.2%) |
| $75,000 to $99,999 | 144 (80.0%) | 36 (20.0%) |
| $100,000 and over | 105 (100.0%) | 0 (0.0%) |
Public vs Private Health Insurance Coverage by Age in Westway
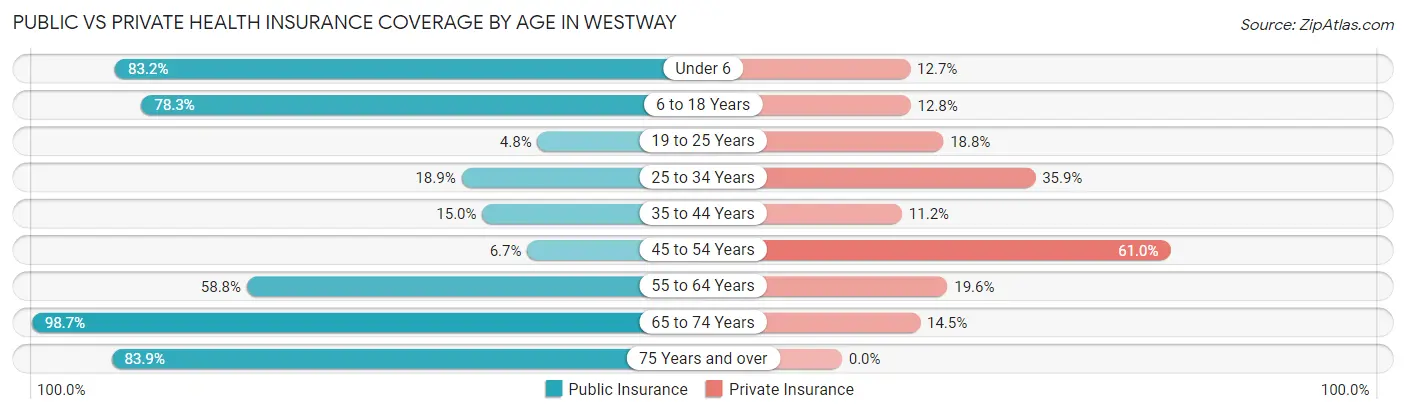
| Age Bracket | Public Insurance | Private Insurance |
| Under 6 | 223 (83.2%) | 34 (12.7%) |
| 6 to 18 Years | 325 (78.3%) | 53 (12.8%) |
| 19 to 25 Years | 13 (4.8%) | 51 (18.8%) |
| 25 to 34 Years | 59 (18.9%) | 112 (35.9%) |
| 35 to 44 Years | 66 (15.0%) | 49 (11.2%) |
| 45 to 54 Years | 18 (6.7%) | 164 (61.0%) |
| 55 to 64 Years | 450 (58.8%) | 150 (19.6%) |
| 65 to 74 Years | 516 (98.7%) | 76 (14.5%) |
| 75 Years and over | 182 (83.9%) | 0 (0.0%) |
| Total | 1,852 (53.2%) | 689 (19.8%) |
Disability Status by Sex by Age in Westway
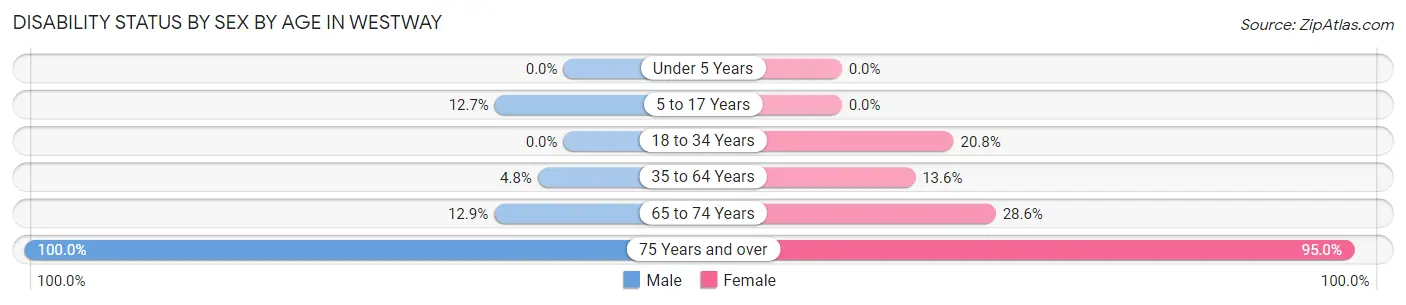
| Age Bracket | Male | Female |
| Under 5 Years | 0 (0.0%) | 0 (0.0%) |
| 5 to 17 Years | 20 (12.7%) | 0 (0.0%) |
| 18 to 34 Years | 0 (0.0%) | 72 (20.7%) |
| 35 to 64 Years | 37 (4.8%) | 95 (13.6%) |
| 65 to 74 Years | 52 (12.9%) | 34 (28.6%) |
| 75 Years and over | 36 (100.0%) | 172 (95.0%) |
Disability Class by Sex by Age in Westway
Disability Class: Hearing Difficulty
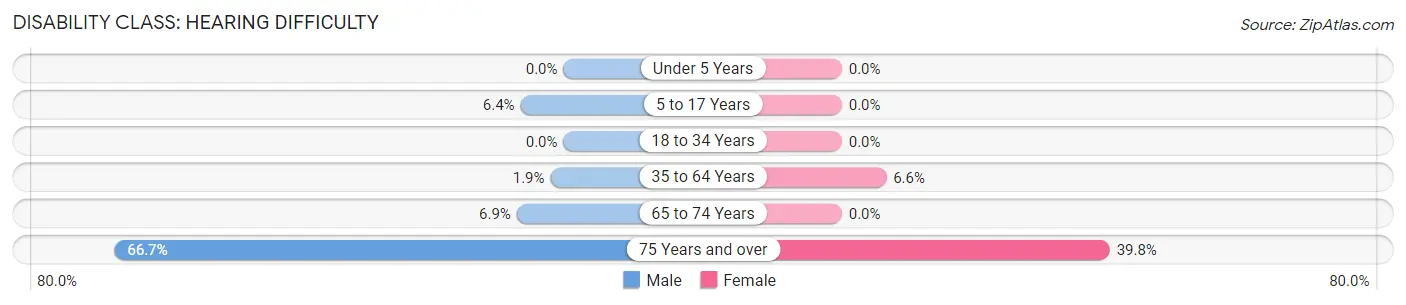
| Age Bracket | Male | Female |
| Under 5 Years | 0 (0.0%) | 0 (0.0%) |
| 5 to 17 Years | 10 (6.4%) | 0 (0.0%) |
| 18 to 34 Years | 0 (0.0%) | 0 (0.0%) |
| 35 to 64 Years | 15 (1.9%) | 46 (6.6%) |
| 65 to 74 Years | 28 (6.9%) | 0 (0.0%) |
| 75 Years and over | 24 (66.7%) | 72 (39.8%) |
Disability Class: Vision Difficulty
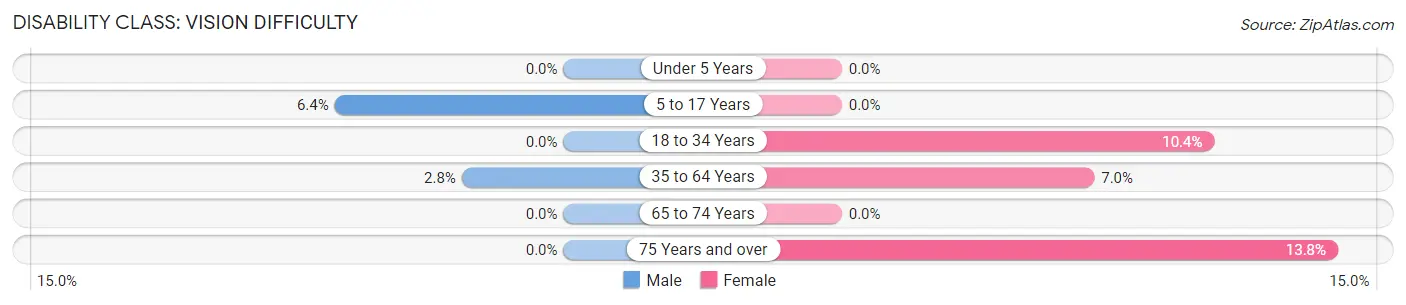
| Age Bracket | Male | Female |
| Under 5 Years | 0 (0.0%) | 0 (0.0%) |
| 5 to 17 Years | 10 (6.4%) | 0 (0.0%) |
| 18 to 34 Years | 0 (0.0%) | 36 (10.4%) |
| 35 to 64 Years | 22 (2.8%) | 49 (7.0%) |
| 65 to 74 Years | 0 (0.0%) | 0 (0.0%) |
| 75 Years and over | 0 (0.0%) | 25 (13.8%) |
Disability Class: Cognitive Difficulty
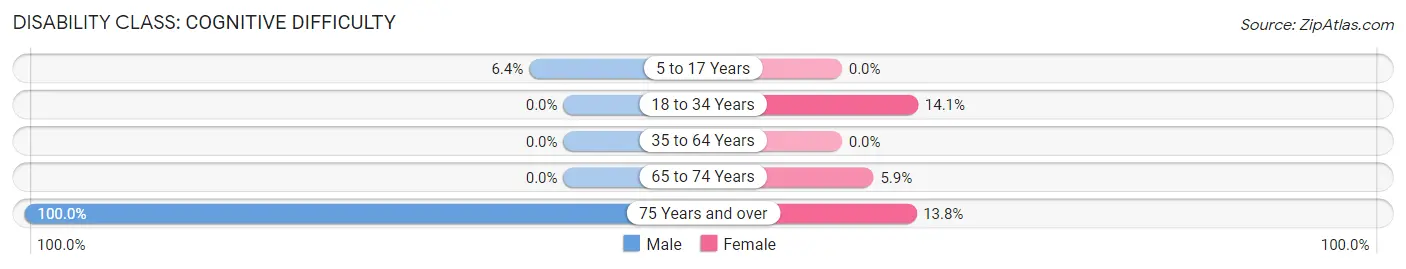
| Age Bracket | Male | Female |
| 5 to 17 Years | 10 (6.4%) | 0 (0.0%) |
| 18 to 34 Years | 0 (0.0%) | 49 (14.1%) |
| 35 to 64 Years | 0 (0.0%) | 0 (0.0%) |
| 65 to 74 Years | 0 (0.0%) | 7 (5.9%) |
| 75 Years and over | 36 (100.0%) | 25 (13.8%) |
Disability Class: Ambulatory Difficulty
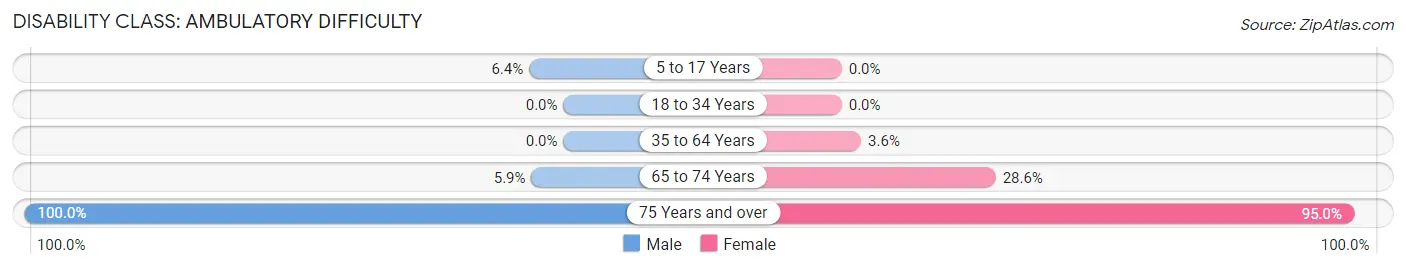
| Age Bracket | Male | Female |
| 5 to 17 Years | 10 (6.4%) | 0 (0.0%) |
| 18 to 34 Years | 0 (0.0%) | 0 (0.0%) |
| 35 to 64 Years | 0 (0.0%) | 25 (3.6%) |
| 65 to 74 Years | 24 (5.9%) | 34 (28.6%) |
| 75 Years and over | 36 (100.0%) | 172 (95.0%) |
Disability Class: Self-Care Difficulty
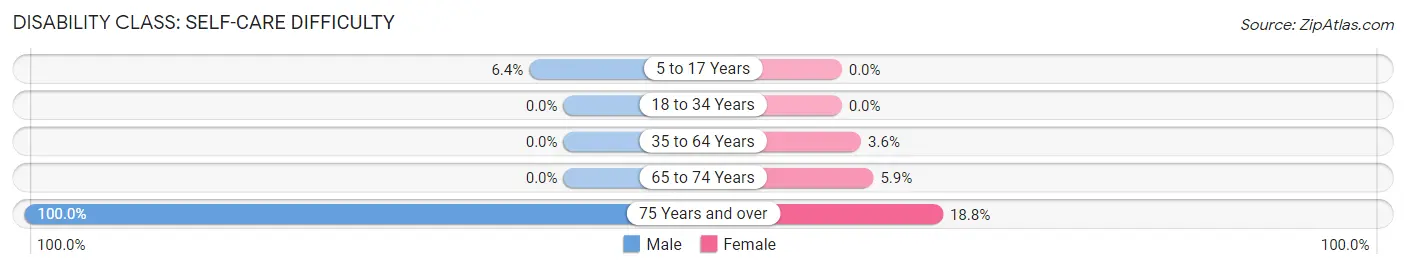
| Age Bracket | Male | Female |
| 5 to 17 Years | 10 (6.4%) | 0 (0.0%) |
| 18 to 34 Years | 0 (0.0%) | 0 (0.0%) |
| 35 to 64 Years | 0 (0.0%) | 25 (3.6%) |
| 65 to 74 Years | 0 (0.0%) | 7 (5.9%) |
| 75 Years and over | 36 (100.0%) | 34 (18.8%) |
Technology Access in Westway
Computing Device Access in Westway
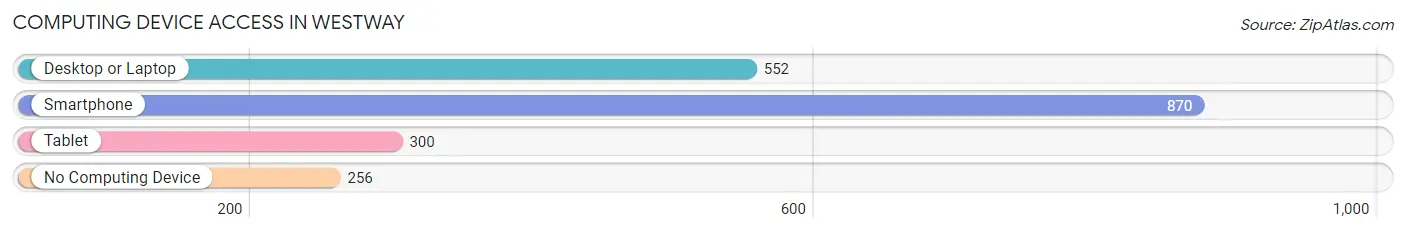
| Device Type | # Households | % Households |
| Desktop or Laptop | 552 | 45.1% |
| Smartphone | 870 | 71.1% |
| Tablet | 300 | 24.5% |
| No Computing Device | 256 | 20.9% |
| Total | 1,223 | 100.0% |
Internet Access in Westway
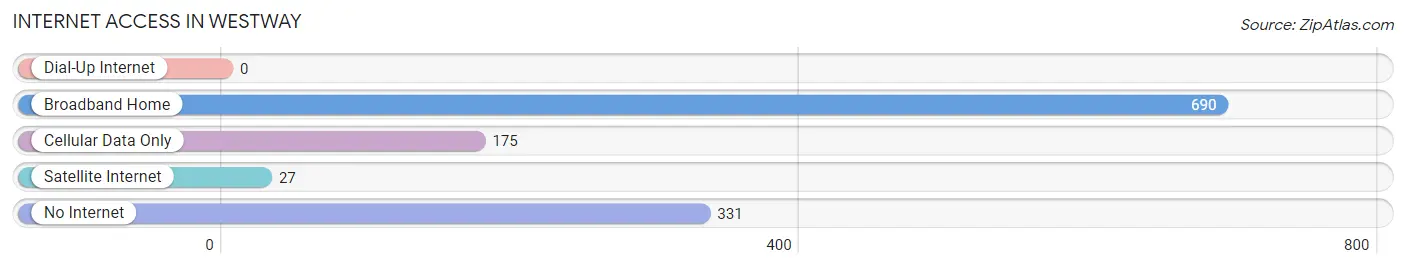
| Internet Type | # Households | % Households |
| Dial-Up Internet | 0 | 0.0% |
| Broadband Home | 690 | 56.4% |
| Cellular Data Only | 175 | 14.3% |
| Satellite Internet | 27 | 2.2% |
| No Internet | 331 | 27.1% |
| Total | 1,223 | 100.0% |
Westway Summary
Westway, Texas is a small town located in the western part of the state, about 25 miles from the city of El Paso. It is situated in El Paso County, and is part of the El Paso Metropolitan Statistical Area. The town has a population of about 1,000 people, and is known for its rural charm and friendly atmosphere.
History
Westway was founded in 1881 by a group of settlers from the nearby town of Ysleta. The settlers were looking for a place to settle and start a new life, and they chose the area that is now Westway. The town was originally called Westway Station, and it was a stop on the Southern Pacific Railroad. The town was officially incorporated in 1891, and the name was changed to Westway.
The town grew slowly over the years, and by the early 1900s it had become a thriving agricultural community. The town was home to several cotton gins, and the local economy was largely based on cotton production. The town also had a few stores, a post office, and a school.
In the 1950s, the town began to experience a decline in population as people moved away to larger cities. The town was also affected by the construction of Interstate 10, which bypassed the town and caused a decrease in traffic. Despite this, the town has managed to remain relatively stable over the years, and it continues to be a small, rural community.
Geography
Westway is located in the western part of El Paso County, about 25 miles from the city of El Paso. The town is situated in the Chihuahuan Desert, and the terrain is mostly flat and dry. The town is located at an elevation of 3,845 feet, and the climate is arid and semi-arid. The average annual temperature is around 70 degrees Fahrenheit, and the average annual precipitation is around 8 inches.
The town is surrounded by several small towns and communities, including Ysleta, Fabens, and Tornillo. The town is also close to the Franklin Mountains State Park, which is a popular destination for outdoor activities such as hiking, camping, and rock climbing.
Economy
The economy of Westway is largely based on agriculture. The town is home to several cotton gins, and cotton is still the main crop grown in the area. Other crops grown in the area include alfalfa, wheat, and sorghum. The town also has a few small businesses, including a grocery store, a hardware store, and a few restaurants.
The town is also home to a few manufacturing companies, including a furniture factory and a plastics factory. The town is also home to a few oil and gas companies, and there are several oil and gas wells in the area.
Demographics
As of the 2010 census, the population of Westway was 1,000 people. The racial makeup of the town was 94.2% White, 0.7% African American, 0.3% Native American, 0.3% Asian, 0.1% Pacific Islander, and 4.5% from other races. The median household income was $30,000, and the median age was 37 years.
Conclusion
Westway, Texas is a small town located in the western part of the state, about 25 miles from the city of El Paso. It is situated in El Paso County, and is part of the El Paso Metropolitan Statistical Area. The town has a population of about 1,000 people, and is known for its rural charm and friendly atmosphere. The economy of Westway is largely based on agriculture, and the town is also home to a few manufacturing companies and oil and gas companies. The racial makeup of the town is mostly White, with a small percentage of African American, Native American, Asian, and Pacific Islander residents.
Common Questions
What is Per Capita Income in Westway?
Per Capita income in Westway is $14,157.
What is the Median Family Income in Westway?
Median Family Income in Westway is $34,260.
What is the Median Household income in Westway?
Median Household Income in Westway is $31,279.
What is Income or Wage Gap in Westway?
Income or Wage Gap in Westway is 57.9%.
Women in Westway earn 42.1 cents for every dollar earned by a man.
What is Inequality or Gini Index in Westway?
Inequality or Gini Index in Westway is 0.39.
What is the Total Population of Westway?
Total Population of Westway is 3,480.
What is the Total Male Population of Westway?
Total Male Population of Westway is 1,691.
What is the Total Female Population of Westway?
Total Female Population of Westway is 1,789.
What is the Ratio of Males per 100 Females in Westway?
There are 94.52 Males per 100 Females in Westway.
What is the Ratio of Females per 100 Males in Westway?
There are 105.80 Females per 100 Males in Westway.
What is the Median Population Age in Westway?
Median Population Age in Westway is 46.6 Years.
What is the Average Family Size in Westway
Average Family Size in Westway is 3.4 People.
What is the Average Household Size in Westway
Average Household Size in Westway is 2.9 People.
How Large is the Labor Force in Westway?
There are 1,291 People in the Labor Forcein in Westway.
What is the Percentage of People in the Labor Force in Westway?
44.2% of People are in the Labor Force in Westway.
What is the Unemployment Rate in Westway?
Unemployment Rate in Westway is 5.3%.