Mobile City, TX Map & Demographics
Mobile City Map
Mobile City Overview
$16,629
PER CAPITA INCOME
$10,574
FAMILY INCOME DEFICIT
0.37
INEQUALITY / GINI INDEX
277
TOTAL POPULATION
109
MALE POPULATION
168
FEMALE POPULATION
64.88
MALES / 100 FEMALES
154.13
FEMALES / 100 MALES
22.4
MEDIAN AGE
2.4
AVG FAMILY SIZE
2.4
AVG HOUSEHOLD SIZE
100
LABOR FORCE [ PEOPLE ]
65.8%
PERCENT IN LABOR FORCE
1.0%
UNEMPLOYMENT RATE
Income in Mobile City
Income Overview in Mobile City
| Characteristic | Number | Measure |
| Per Capita Income | 277 | $16,629 |
| Median Family Income | 106 | $0 |
| Mean Family Income | 106 | $38,705 |
| Median Household Income | 118 | $0 |
| Mean Household Income | 118 | $40,520 |
| Income Deficit | 106 | $10,574 |
| Wage / Income Gap (%) | 277 | 0.00% |
| Wage / Income Gap ($) | 277 | 100.00¢ per $1 |
| Gini / Inequality Index | 277 | 0.37 |
Earnings by Sex in Mobile City
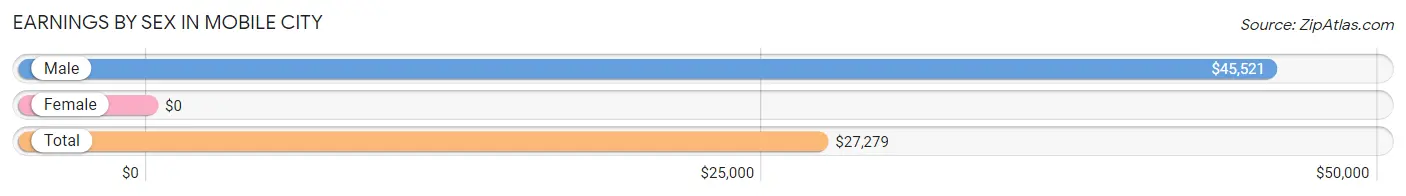
| Sex | Number | Average Earnings |
| Male | 43 (29.2%) | $45,521 |
| Female | 104 (70.8%) | $0 |
| Total | 147 (100.0%) | $27,279 |
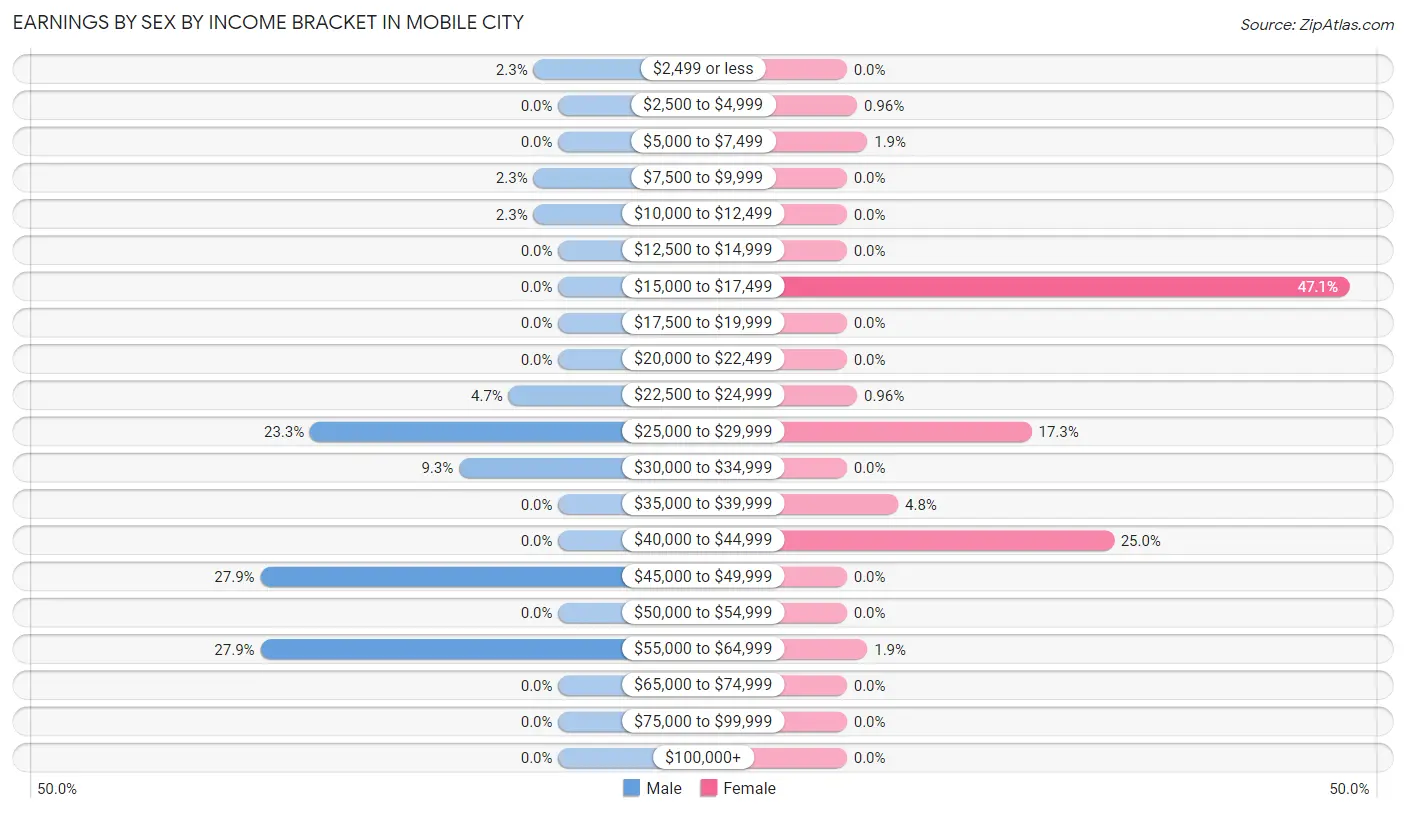
Earnings by Sex by Income Bracket in Mobile City
The most common earnings brackets in Mobile City are $45,000 to $49,999 for men (12 | 27.9%) and $15,000 to $17,499 for women (49 | 47.1%).
| Income | Male | Female |
| $2,499 or less | 1 (2.3%) | 0 (0.0%) |
| $2,500 to $4,999 | 0 (0.0%) | 1 (1.0%) |
| $5,000 to $7,499 | 0 (0.0%) | 2 (1.9%) |
| $7,500 to $9,999 | 1 (2.3%) | 0 (0.0%) |
| $10,000 to $12,499 | 1 (2.3%) | 0 (0.0%) |
| $12,500 to $14,999 | 0 (0.0%) | 0 (0.0%) |
| $15,000 to $17,499 | 0 (0.0%) | 49 (47.1%) |
| $17,500 to $19,999 | 0 (0.0%) | 0 (0.0%) |
| $20,000 to $22,499 | 0 (0.0%) | 0 (0.0%) |
| $22,500 to $24,999 | 2 (4.6%) | 1 (1.0%) |
| $25,000 to $29,999 | 10 (23.3%) | 18 (17.3%) |
| $30,000 to $34,999 | 4 (9.3%) | 0 (0.0%) |
| $35,000 to $39,999 | 0 (0.0%) | 5 (4.8%) |
| $40,000 to $44,999 | 0 (0.0%) | 26 (25.0%) |
| $45,000 to $49,999 | 12 (27.9%) | 0 (0.0%) |
| $50,000 to $54,999 | 0 (0.0%) | 0 (0.0%) |
| $55,000 to $64,999 | 12 (27.9%) | 2 (1.9%) |
| $65,000 to $74,999 | 0 (0.0%) | 0 (0.0%) |
| $75,000 to $99,999 | 0 (0.0%) | 0 (0.0%) |
| $100,000+ | 0 (0.0%) | 0 (0.0%) |
| Total | 43 (100.0%) | 104 (100.0%) |
Earnings by Sex by Educational Attainment in Mobile City
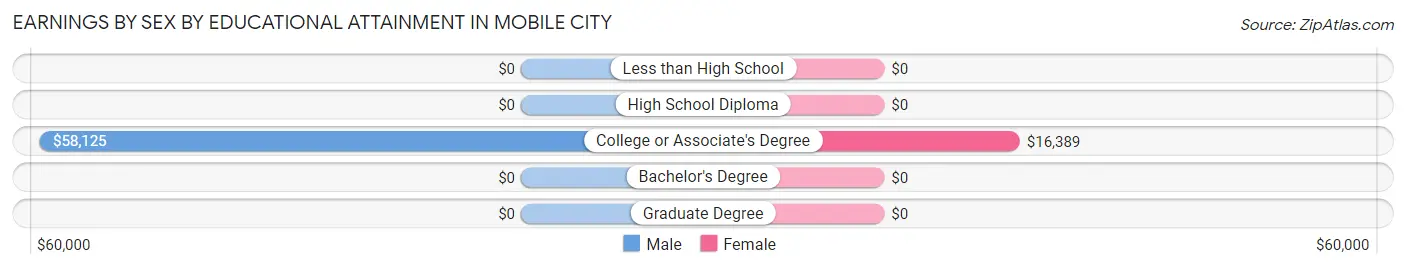
| Educational Attainment | Male Income | Female Income |
| Less than High School | - | - |
| High School Diploma | - | - |
| College or Associate's Degree | $58,125 | $16,389 |
| Bachelor's Degree | - | - |
| Graduate Degree | - | - |
| Total | $46,042 | $0 |
Family Income in Mobile City
Family Income Brackets in Mobile City
According to the Mobile City family income data, there are 49 families falling into the $15,000 to $24,999 income range, which is the most common income bracket and makes up 46.2% of all families.
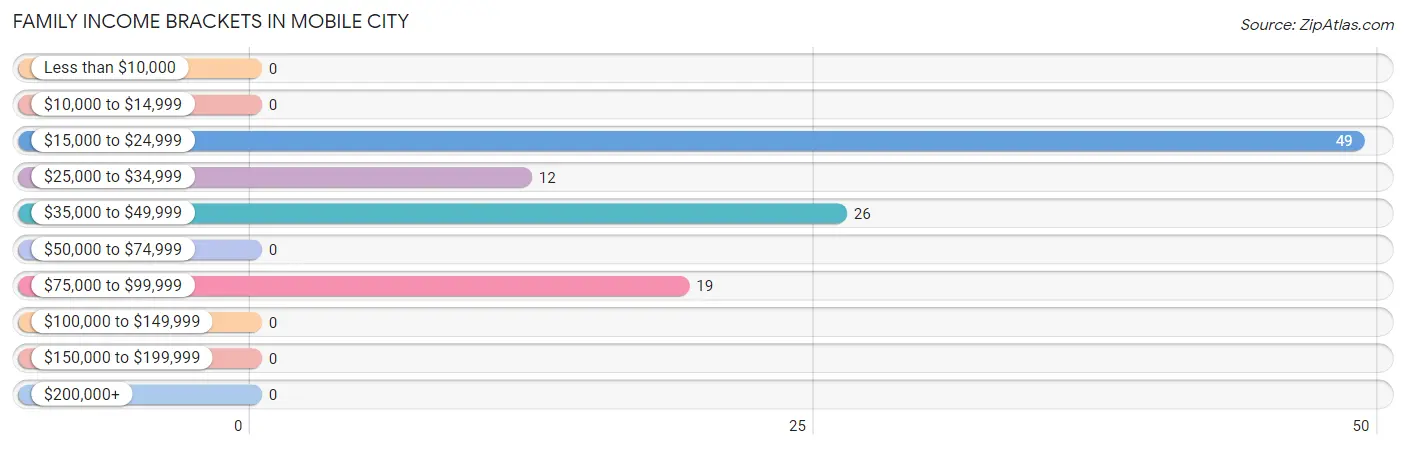
| Income Bracket | # Families | % Families |
| Less than $10,000 | 0 | 0.0% |
| $10,000 to $14,999 | 0 | 0.0% |
| $15,000 to $24,999 | 49 | 46.2% |
| $25,000 to $34,999 | 12 | 11.3% |
| $35,000 to $49,999 | 26 | 24.5% |
| $50,000 to $74,999 | 0 | 0.0% |
| $75,000 to $99,999 | 19 | 17.9% |
| $100,000 to $149,999 | 0 | 0.0% |
| $150,000 to $199,999 | 0 | 0.0% |
| $200,000+ | 0 | 0.0% |
Family Income by Famaliy Size in Mobile City
2-person families (13 | 12.3%) account for the highest median family income in Mobile City with $92,679 per family, while 2-person families (13 | 12.3%) have the highest median income of $46,340 per family member.
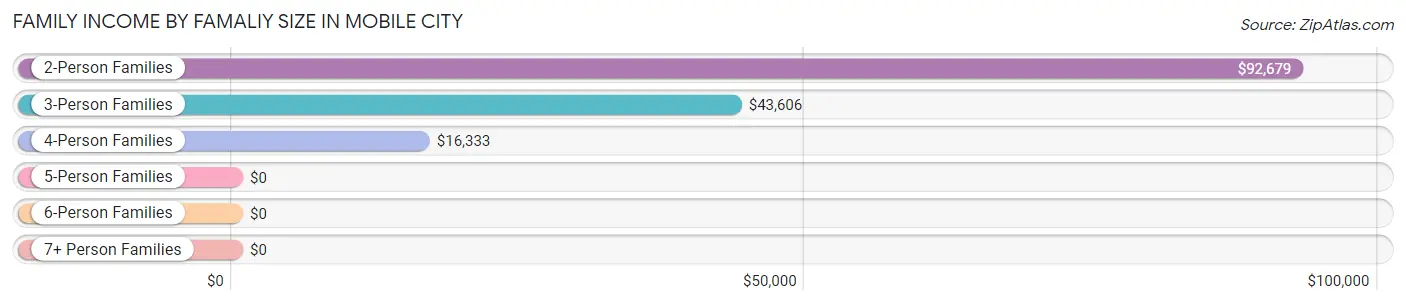
| Income Bracket | # Families | Median Income |
| 2-Person Families | 13 (12.3%) | $92,679 |
| 3-Person Families | 45 (42.4%) | $43,606 |
| 4-Person Families | 48 (45.3%) | $16,333 |
| 5-Person Families | 0 (0.0%) | $0 |
| 6-Person Families | 0 (0.0%) | $0 |
| 7+ Person Families | 0 (0.0%) | $0 |
| Total | 106 (100.0%) | $0 |
Family Income by Number of Earners in Mobile City
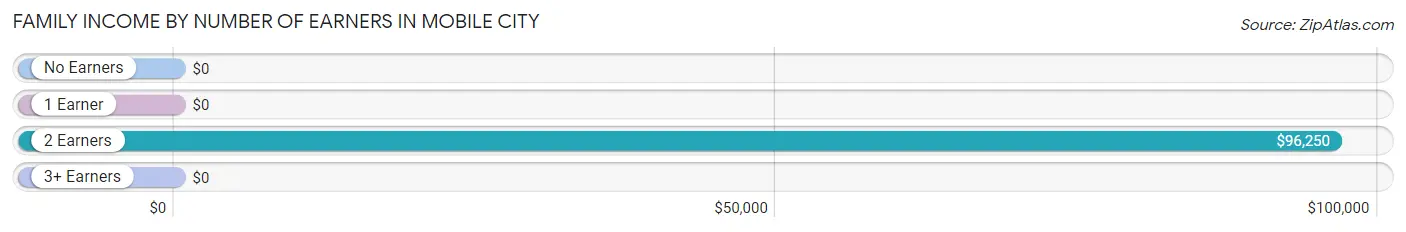
| Number of Earners | # Families | Median Income |
| No Earners | 0 (0.0%) | $0 |
| 1 Earner | 88 (83.0%) | $0 |
| 2 Earners | 16 (15.1%) | $96,250 |
| 3+ Earners | 2 (1.9%) | $0 |
| Total | 106 (100.0%) | $0 |
Household Income in Mobile City
Household Income Brackets in Mobile City
With 49 households falling in the category, the $15,000 to $24,999 income range is the most frequent in Mobile City, accounting for 41.5% of all households.
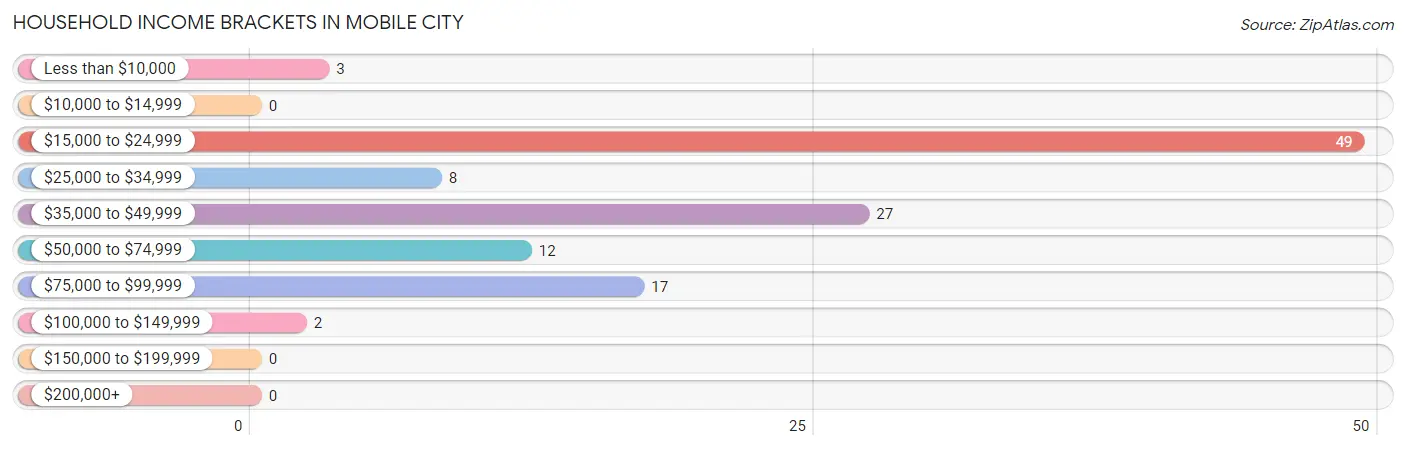
| Income Bracket | # Households | % Households |
| Less than $10,000 | 3 | 2.5% |
| $10,000 to $14,999 | 0 | 0.0% |
| $15,000 to $24,999 | 49 | 41.5% |
| $25,000 to $34,999 | 8 | 6.8% |
| $35,000 to $49,999 | 27 | 22.9% |
| $50,000 to $74,999 | 12 | 10.2% |
| $75,000 to $99,999 | 17 | 14.4% |
| $100,000 to $149,999 | 2 | 1.7% |
| $150,000 to $199,999 | 0 | 0.0% |
| $200,000+ | 0 | 0.0% |
Household Income by Householder Age in Mobile City
The median household income in Mobile City is $0, with the highest median household income of $43,750 found in the 45 to 64 years age bracket for the primary householder. A total of 30 households (25.4%) fall into this category. Meanwhile, the 15 to 24 years age bracket for the primary householder has the lowest median household income of $0, with 7 households (5.9%) in this group.
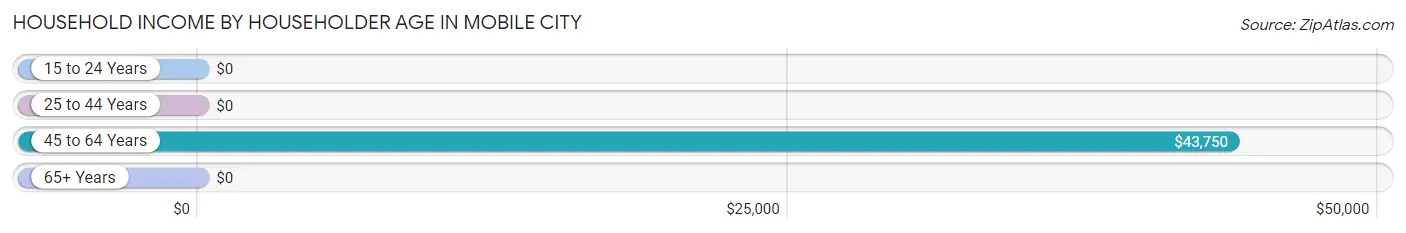
| Income Bracket | # Households | Median Income |
| 15 to 24 Years | 7 (5.9%) | $0 |
| 25 to 44 Years | 80 (67.8%) | $0 |
| 45 to 64 Years | 30 (25.4%) | $43,750 |
| 65+ Years | 1 (0.9%) | $0 |
| Total | 118 (100.0%) | $0 |
Poverty in Mobile City
Income Below Poverty by Sex and Age in Mobile City
With 38.5% poverty level for males and 60.7% for females among the residents of Mobile City, 6 to 11 year old males and under 5 year old females are the most vulnerable to poverty, with 40 males (100.0%) and 46 females (100.0%) in their respective age groups living below the poverty level.
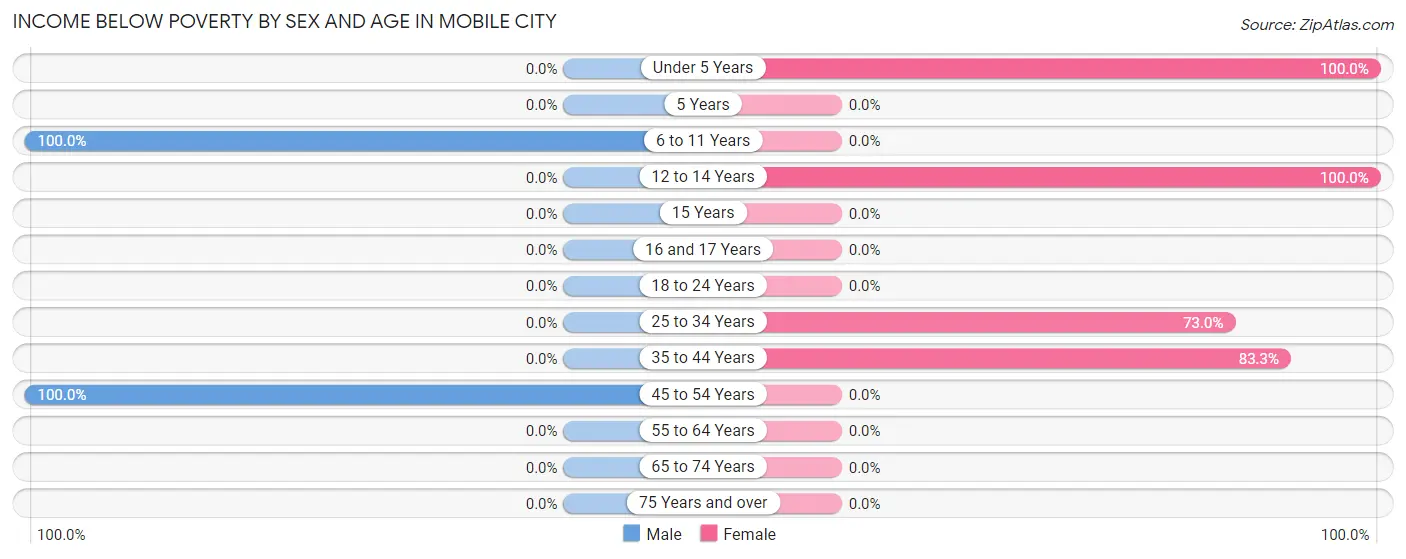
| Age Bracket | Male | Female |
| Under 5 Years | 0 (0.0%) | 46 (100.0%) |
| 5 Years | 0 (0.0%) | 0 (0.0%) |
| 6 to 11 Years | 40 (100.0%) | 0 (0.0%) |
| 12 to 14 Years | 0 (0.0%) | 5 (100.0%) |
| 15 Years | 0 (0.0%) | 0 (0.0%) |
| 16 and 17 Years | 0 (0.0%) | 0 (0.0%) |
| 18 to 24 Years | 0 (0.0%) | 0 (0.0%) |
| 25 to 34 Years | 0 (0.0%) | 46 (73.0%) |
| 35 to 44 Years | 0 (0.0%) | 5 (83.3%) |
| 45 to 54 Years | 2 (100.0%) | 0 (0.0%) |
| 55 to 64 Years | 0 (0.0%) | 0 (0.0%) |
| 65 to 74 Years | 0 (0.0%) | 0 (0.0%) |
| 75 Years and over | 0 (0.0%) | 0 (0.0%) |
| Total | 42 (38.5%) | 102 (60.7%) |
Income Above Poverty by Sex and Age in Mobile City
According to the poverty statistics in Mobile City, males aged 12 to 14 years and females aged 5 years are the age groups that are most secure financially, with 100.0% of males and 100.0% of females in these age groups living above the poverty line.
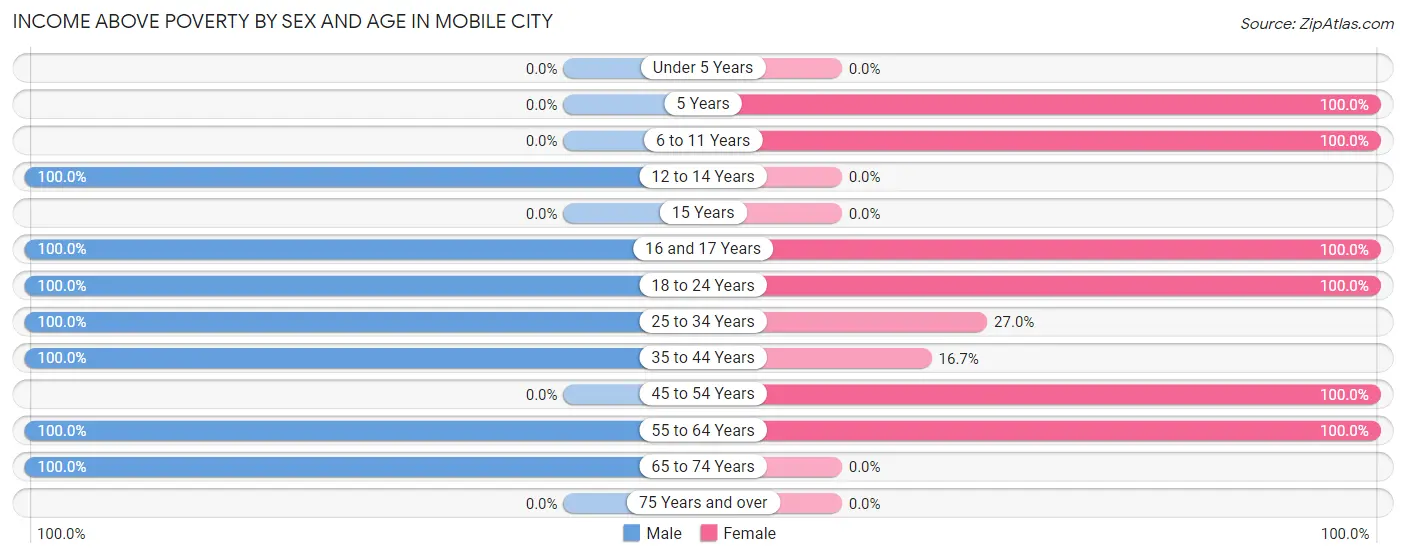
| Age Bracket | Male | Female |
| Under 5 Years | 0 (0.0%) | 0 (0.0%) |
| 5 Years | 0 (0.0%) | 3 (100.0%) |
| 6 to 11 Years | 0 (0.0%) | 7 (100.0%) |
| 12 to 14 Years | 24 (100.0%) | 0 (0.0%) |
| 15 Years | 0 (0.0%) | 0 (0.0%) |
| 16 and 17 Years | 1 (100.0%) | 2 (100.0%) |
| 18 to 24 Years | 4 (100.0%) | 9 (100.0%) |
| 25 to 34 Years | 15 (100.0%) | 17 (27.0%) |
| 35 to 44 Years | 20 (100.0%) | 1 (16.7%) |
| 45 to 54 Years | 0 (0.0%) | 26 (100.0%) |
| 55 to 64 Years | 2 (100.0%) | 1 (100.0%) |
| 65 to 74 Years | 1 (100.0%) | 0 (0.0%) |
| 75 Years and over | 0 (0.0%) | 0 (0.0%) |
| Total | 67 (61.5%) | 66 (39.3%) |
Income Below Poverty Among Married-Couple Families in Mobile City
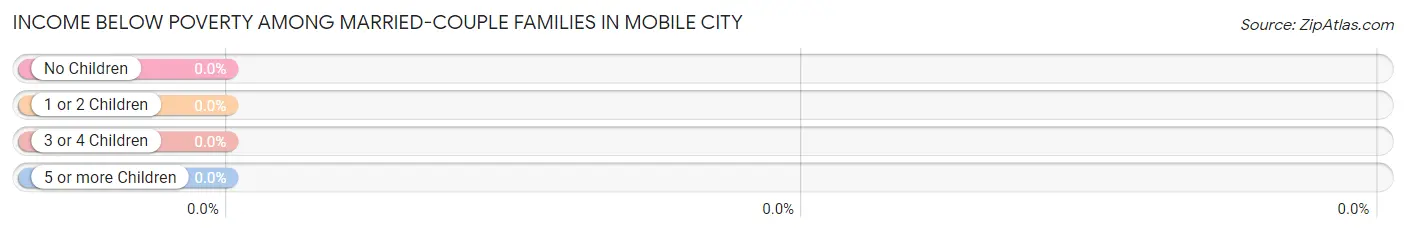
| Children | Above Poverty | Below Poverty |
| No Children | 0 (0.0%) | 0 (0.0%) |
| 1 or 2 Children | 10 (100.0%) | 0 (0.0%) |
| 3 or 4 Children | 0 (0.0%) | 0 (0.0%) |
| 5 or more Children | 0 (0.0%) | 0 (0.0%) |
| Total | 10 (100.0%) | 0 (0.0%) |
Income Below Poverty Among Single-Parent Households in Mobile City
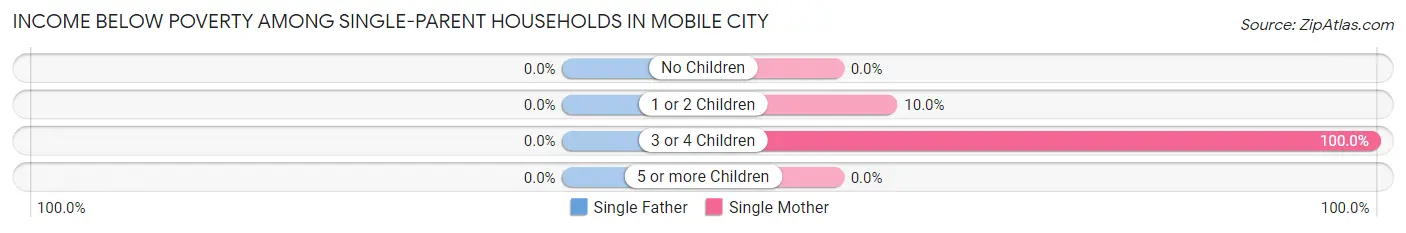
| Children | Single Father | Single Mother |
| No Children | 0 (0.0%) | 0 (0.0%) |
| 1 or 2 Children | 0 (0.0%) | 4 (10.0%) |
| 3 or 4 Children | 0 (0.0%) | 46 (100.0%) |
| 5 or more Children | 0 (0.0%) | 0 (0.0%) |
| Total | 0 (0.0%) | 50 (56.8%) |
Income Below Poverty Among Married-Couple vs Single-Parent Households in Mobile City
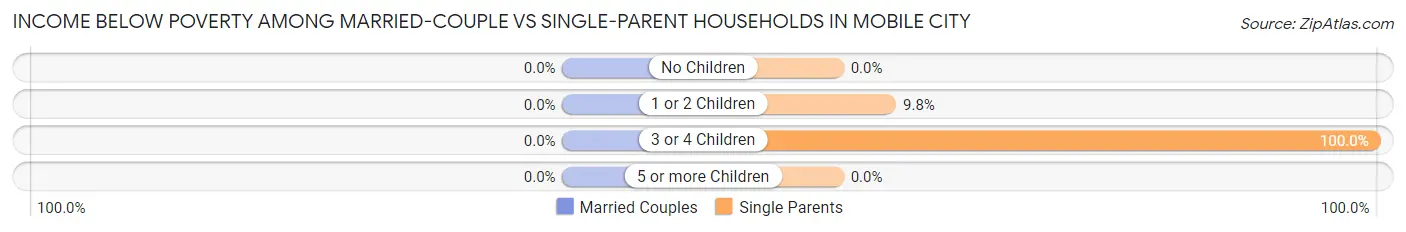
| Children | Married-Couple Families | Single-Parent Households |
| No Children | 0 (0.0%) | 0 (0.0%) |
| 1 or 2 Children | 0 (0.0%) | 4 (9.8%) |
| 3 or 4 Children | 0 (0.0%) | 46 (100.0%) |
| 5 or more Children | 0 (0.0%) | 0 (0.0%) |
| Total | 0 (0.0%) | 50 (52.1%) |
Race in Mobile City
The most populous races in Mobile City are Hispanic or Latino (259 | 93.5%), Two or more Races (201 | 72.6%), and White / Caucasian (69 | 24.9%).
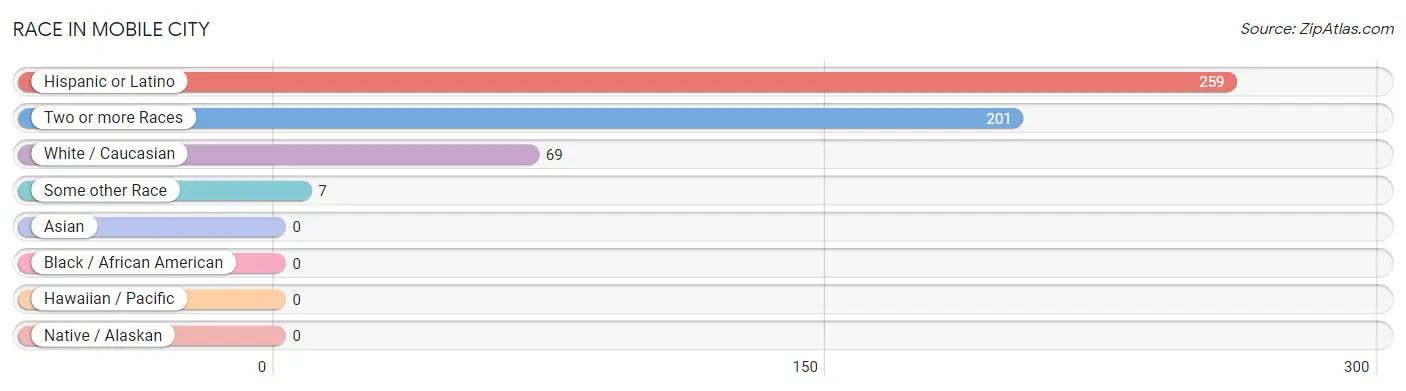
| Race | # Population | % Population |
| Asian | 0 | 0.0% |
| Black / African American | 0 | 0.0% |
| Hawaiian / Pacific | 0 | 0.0% |
| Hispanic or Latino | 259 | 93.5% |
| Native / Alaskan | 0 | 0.0% |
| White / Caucasian | 69 | 24.9% |
| Two or more Races | 201 | 72.6% |
| Some other Race | 7 | 2.5% |
| Total | 277 | 100.0% |
Ancestry in Mobile City
The most populous ancestries reported in Mobile City are Mexican (231 | 83.4%), Central American (27 | 9.8%), Salvadoran (27 | 9.8%), and Mexican American Indian (12 | 4.3%), together accounting for 107.2% of all Mobile City residents.

| Ancestry | # Population | % Population |
| Central American | 27 | 9.8% |
| Mexican | 231 | 83.4% |
| Mexican American Indian | 12 | 4.3% |
| Salvadoran | 27 | 9.8% | View All 4 Rows |
Immigrants in Mobile City
The most numerous immigrant groups reported in Mobile City came from Central America (65 | 23.5%), Latin America (65 | 23.5%), Mexico (45 | 16.3%), and El Salvador (20 | 7.2%), together accounting for 70.4% of all Mobile City residents.
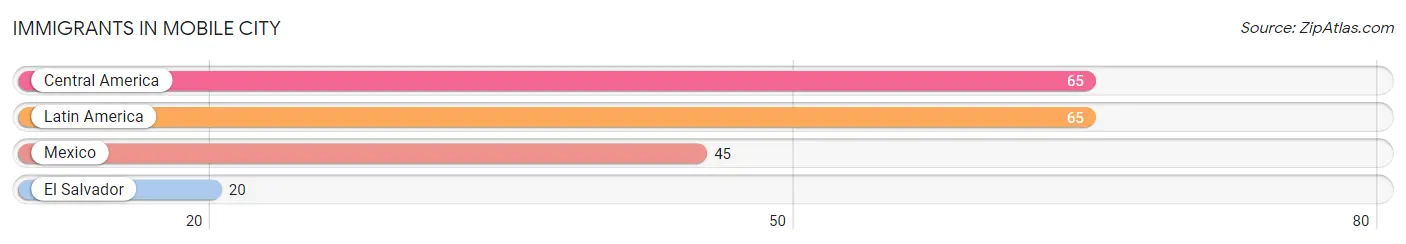
| Immigration Origin | # Population | % Population |
| Central America | 65 | 23.5% |
| El Salvador | 20 | 7.2% |
| Latin America | 65 | 23.5% |
| Mexico | 45 | 16.3% | View All 4 Rows |
Sex and Age in Mobile City
Sex and Age in Mobile City
The most populous age groups in Mobile City are 5 to 9 Years (38 | 34.9%) for men and 25 to 29 Years (63 | 37.5%) for women.
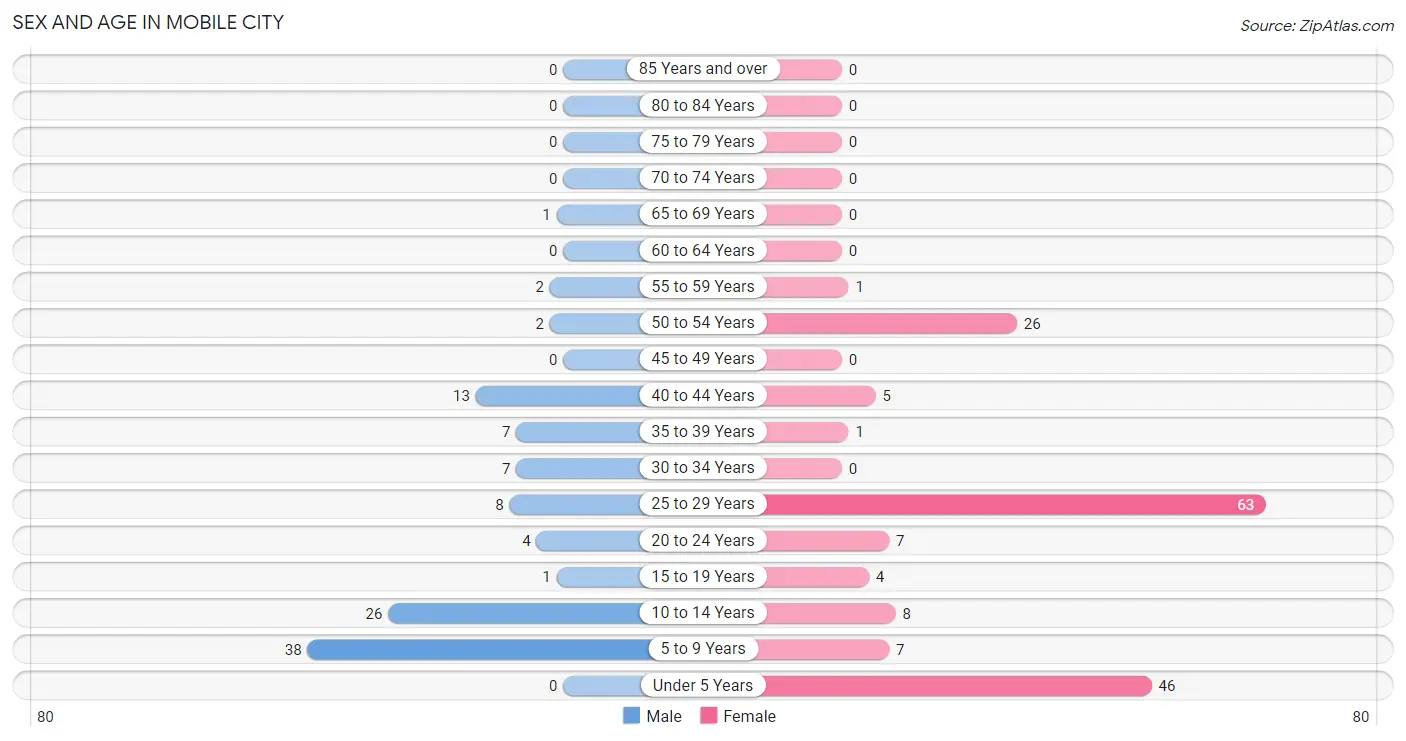
| Age Bracket | Male | Female |
| Under 5 Years | 0 (0.0%) | 46 (27.4%) |
| 5 to 9 Years | 38 (34.9%) | 7 (4.2%) |
| 10 to 14 Years | 26 (23.8%) | 8 (4.8%) |
| 15 to 19 Years | 1 (0.9%) | 4 (2.4%) |
| 20 to 24 Years | 4 (3.7%) | 7 (4.2%) |
| 25 to 29 Years | 8 (7.3%) | 63 (37.5%) |
| 30 to 34 Years | 7 (6.4%) | 0 (0.0%) |
| 35 to 39 Years | 7 (6.4%) | 1 (0.6%) |
| 40 to 44 Years | 13 (11.9%) | 5 (3.0%) |
| 45 to 49 Years | 0 (0.0%) | 0 (0.0%) |
| 50 to 54 Years | 2 (1.8%) | 26 (15.5%) |
| 55 to 59 Years | 2 (1.8%) | 1 (0.6%) |
| 60 to 64 Years | 0 (0.0%) | 0 (0.0%) |
| 65 to 69 Years | 1 (0.9%) | 0 (0.0%) |
| 70 to 74 Years | 0 (0.0%) | 0 (0.0%) |
| 75 to 79 Years | 0 (0.0%) | 0 (0.0%) |
| 80 to 84 Years | 0 (0.0%) | 0 (0.0%) |
| 85 Years and over | 0 (0.0%) | 0 (0.0%) |
| Total | 109 (100.0%) | 168 (100.0%) |
Families and Households in Mobile City
Median Family Size in Mobile City
The median family size in Mobile City is 2.35 persons per family, with single female/mother families (88 | 83.0%) accounting for the largest median family size of 2.4 persons per family. On the other hand, single male/father families (8 | 7.5%) represent the smallest median family size with 2.00 persons per family.
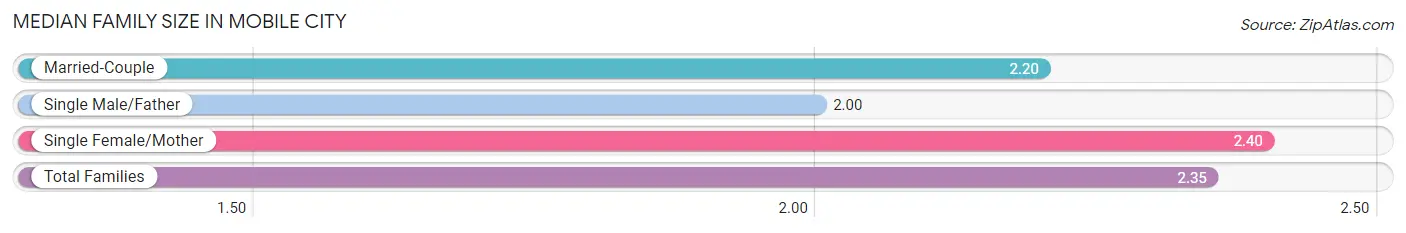
| Family Type | # Families | Family Size |
| Married-Couple | 10 (9.4%) | 2.20 |
| Single Male/Father | 8 (7.5%) | 2.00 |
| Single Female/Mother | 88 (83.0%) | 2.40 |
| Total Families | 106 (100.0%) | 2.35 |
Median Household Size in Mobile City
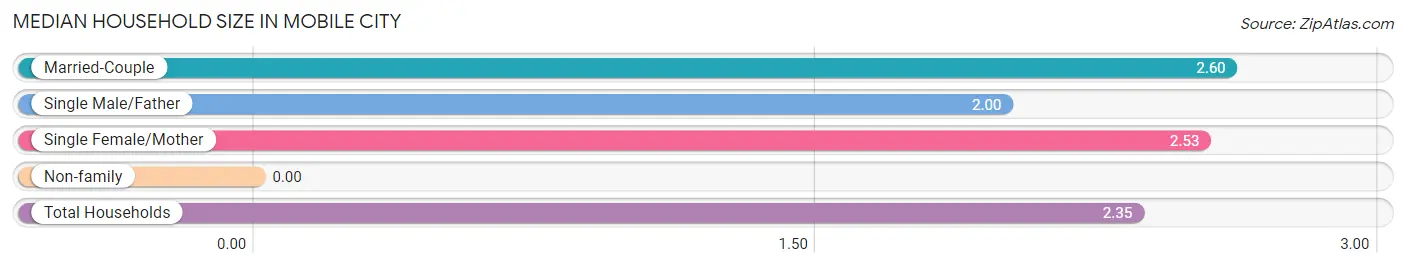
| Household Type | # Households | Household Size |
| Married-Couple | 10 (8.5%) | 2.60 |
| Single Male/Father | 8 (6.8%) | 2.00 |
| Single Female/Mother | 88 (74.6%) | 2.53 |
| Non-family | 12 (10.2%) | - |
| Total Households | 118 (100.0%) | 2.35 |
Household Size by Marriage Status in Mobile City
Out of a total of 118 households in Mobile City, 106 (89.8%) are family households, while 12 (10.2%) are nonfamily households. The most numerous type of family households are 4-person households, comprising 55, and the most common type of nonfamily households are 1-person households, comprising 12.
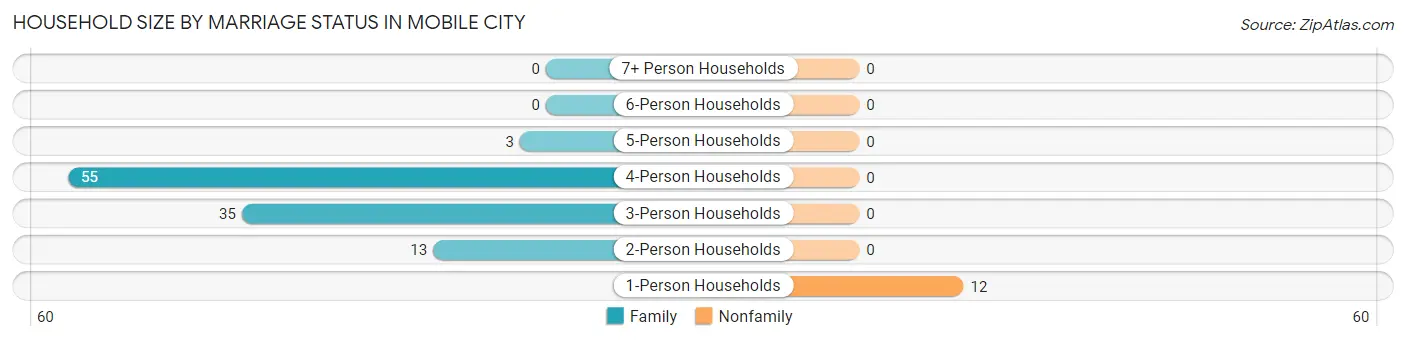
| Household Size | Family Households | Nonfamily Households |
| 1-Person Households | - | 12 (10.2%) |
| 2-Person Households | 13 (11.0%) | 0 (0.0%) |
| 3-Person Households | 35 (29.7%) | 0 (0.0%) |
| 4-Person Households | 55 (46.6%) | 0 (0.0%) |
| 5-Person Households | 3 (2.5%) | 0 (0.0%) |
| 6-Person Households | 0 (0.0%) | 0 (0.0%) |
| 7+ Person Households | 0 (0.0%) | 0 (0.0%) |
| Total | 106 (89.8%) | 12 (10.2%) |
Female Fertility in Mobile City
Fertility by Age in Mobile City
Average fertility rate in Mobile City is 13.0 births per 1,000 women. Women in the age bracket of 20 to 34 years have the highest fertility rate with 14.0 births per 1,000 women. Women in the age bracket of 20 to 34 years acount for 100.0% of all women with births.
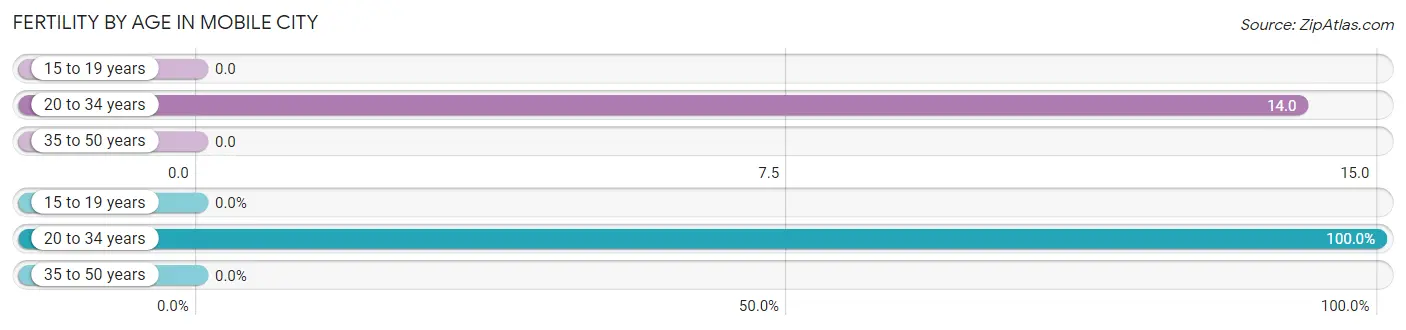
| Age Bracket | Women with Births | Births / 1,000 Women |
| 15 to 19 years | 0 (0.0%) | 0.0 |
| 20 to 34 years | 1 (100.0%) | 14.0 |
| 35 to 50 years | 0 (0.0%) | 0.0 |
| Total | 1 (100.0%) | 13.0 |
Fertility by Age by Marriage Status in Mobile City
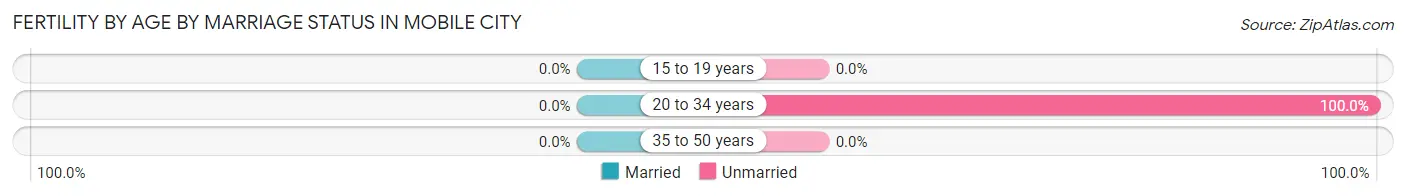
| Age Bracket | Married | Unmarried |
| 15 to 19 years | 0 (0.0%) | 0 (0.0%) |
| 20 to 34 years | 0 (0.0%) | 1 (100.0%) |
| 35 to 50 years | 0 (0.0%) | 0 (0.0%) |
| Total | 0 (0.0%) | 1 (100.0%) |
Fertility by Education in Mobile City
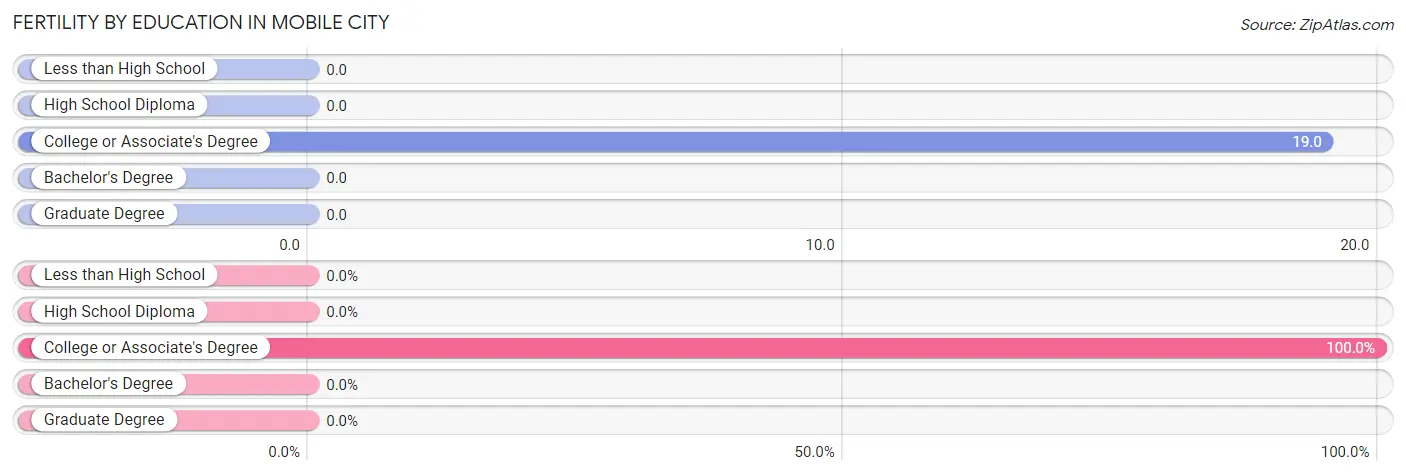
| Educational Attainment | Women with Births | Births / 1,000 Women |
| Less than High School | 0 (0.0%) | 0.0 |
| High School Diploma | 0 (0.0%) | 0.0 |
| College or Associate's Degree | 1 (100.0%) | 19.0 |
| Bachelor's Degree | 0 (0.0%) | 0.0 |
| Graduate Degree | 0 (0.0%) | 0.0 |
| Total | 1 (100.0%) | 13.0 |
Fertility by Education by Marriage Status in Mobile City
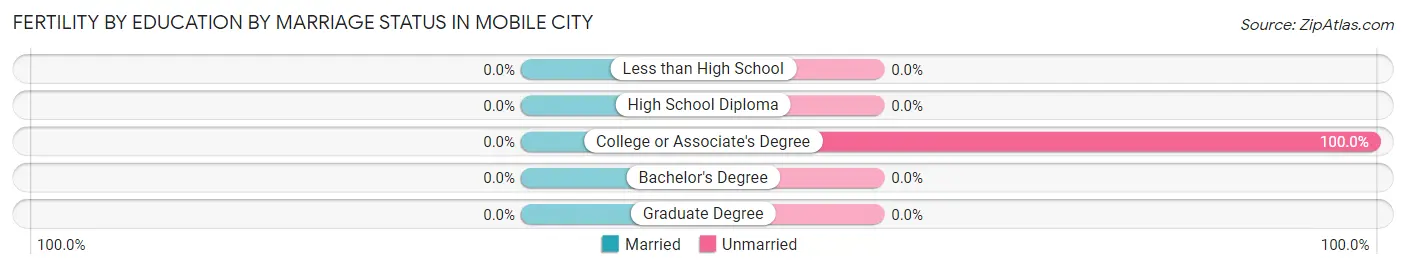
| Educational Attainment | Married | Unmarried |
| Less than High School | 0 (0.0%) | 0 (0.0%) |
| High School Diploma | 0 (0.0%) | 0 (0.0%) |
| College or Associate's Degree | 0 (0.0%) | 1 (100.0%) |
| Bachelor's Degree | 0 (0.0%) | 0 (0.0%) |
| Graduate Degree | 0 (0.0%) | 0 (0.0%) |
| Total | 0 (0.0%) | 1 (100.0%) |
Employment Characteristics in Mobile City
Employment by Class of Employer in Mobile City
Among the 99 employed individuals in Mobile City, private company employees (92 | 92.9%), and not-for-profit organizations (7 | 7.1%) make up the most common classes of employment.
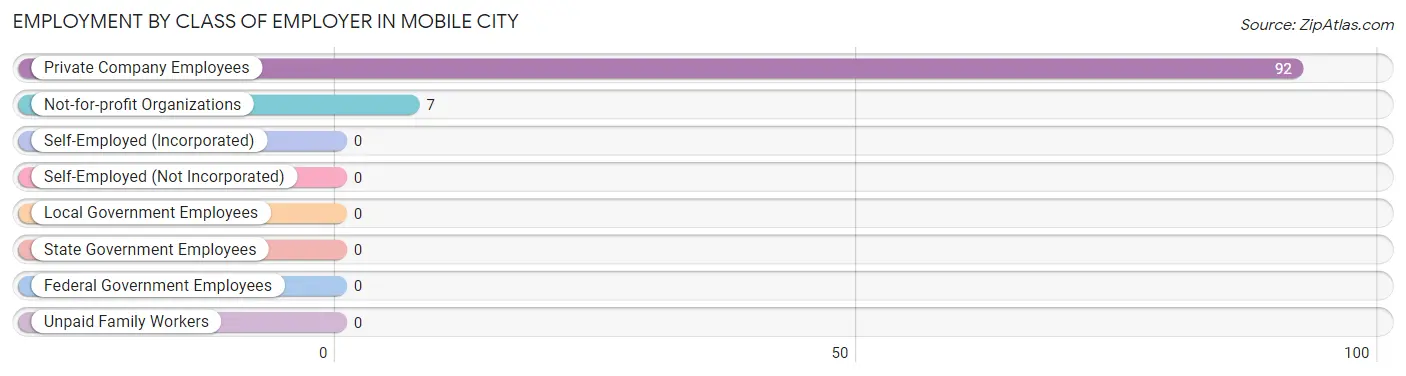
| Employer Class | # Employees | % Employees |
| Private Company Employees | 92 | 92.9% |
| Self-Employed (Incorporated) | 0 | 0.0% |
| Self-Employed (Not Incorporated) | 0 | 0.0% |
| Not-for-profit Organizations | 7 | 7.1% |
| Local Government Employees | 0 | 0.0% |
| State Government Employees | 0 | 0.0% |
| Federal Government Employees | 0 | 0.0% |
| Unpaid Family Workers | 0 | 0.0% |
| Total | 99 | 100.0% |
Employment Status by Age in Mobile City
According to the labor force statistics for Mobile City, out of the total population over 16 years of age (152), 65.8% or 100 individuals are in the labor force, with 1.0% or 1 of them unemployed. The age group with the highest labor force participation rate is 20 to 24 years, with 100.0% or 11 individuals in the labor force. Within the labor force, the 35 to 44 years age range has the highest percentage of unemployed individuals, with 4.0% or 1 of them being unemployed.
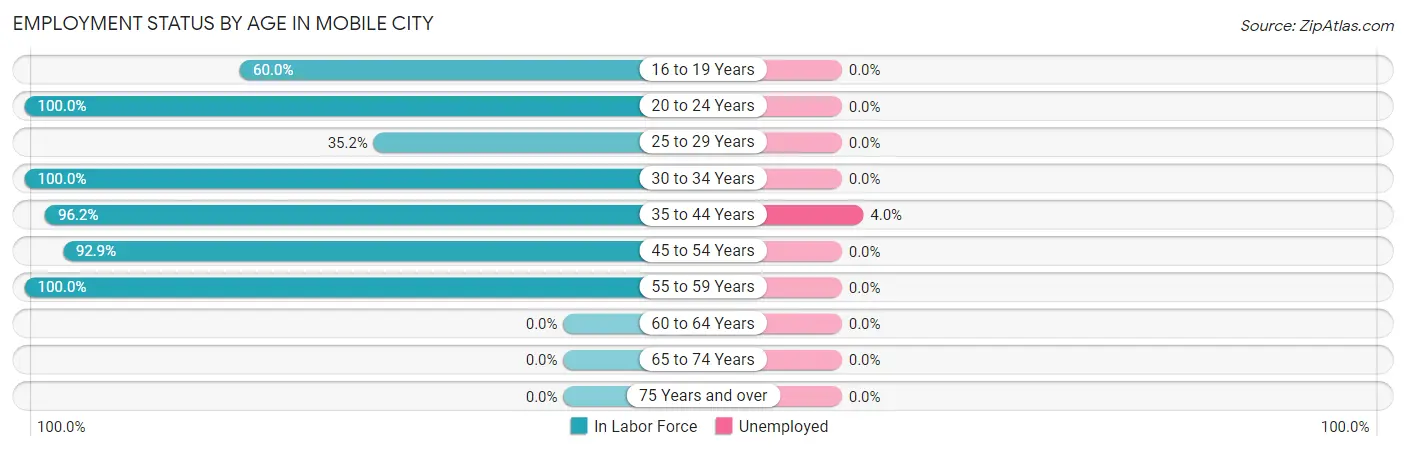
| Age Bracket | In Labor Force | Unemployed |
| 16 to 19 Years | 3 (60.0%) | 0 (0.0%) |
| 20 to 24 Years | 11 (100.0%) | 0 (0.0%) |
| 25 to 29 Years | 25 (35.2%) | 0 (0.0%) |
| 30 to 34 Years | 7 (100.0%) | 0 (0.0%) |
| 35 to 44 Years | 25 (96.2%) | 1 (4.0%) |
| 45 to 54 Years | 26 (92.9%) | 0 (0.0%) |
| 55 to 59 Years | 3 (100.0%) | 0 (0.0%) |
| 60 to 64 Years | 0 (0.0%) | 0 (0.0%) |
| 65 to 74 Years | 0 (0.0%) | 0 (0.0%) |
| 75 Years and over | 0 (0.0%) | 0 (0.0%) |
| Total | 100 (65.8%) | 1 (1.0%) |
Employment Status by Educational Attainment in Mobile City
According to labor force statistics for Mobile City, 63.7% of individuals (86) out of the total population between 25 and 64 years of age (135) are in the labor force, with 1.2% or 1 of them being unemployed. The group with the highest labor force participation rate are those with the educational attainment of less than high school, with 100.0% or 10 individuals in the labor force. Within the labor force, individuals with high school diploma education have the highest percentage of unemployment, with 1.8% or 1 of them being unemployed.
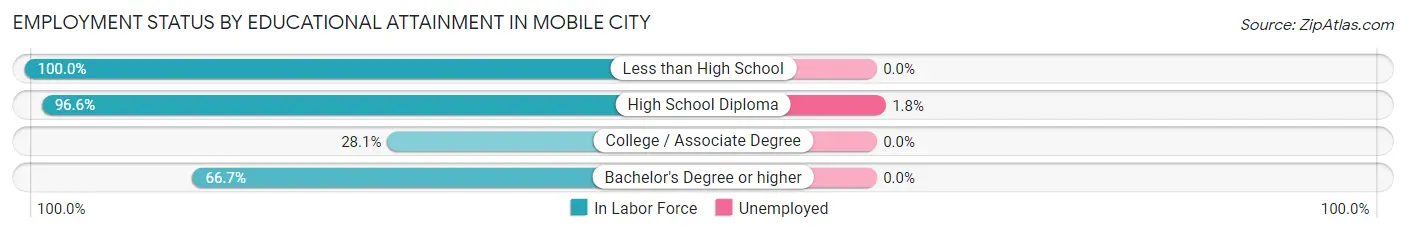
| Educational Attainment | In Labor Force | Unemployed |
| Less than High School | 10 (100.0%) | 0 (0.0%) |
| High School Diploma | 56 (96.6%) | 1 (1.8%) |
| College / Associate Degree | 18 (28.1%) | 0 (0.0%) |
| Bachelor's Degree or higher | 2 (66.7%) | 0 (0.0%) |
| Total | 86 (63.7%) | 2 (1.2%) |
Employment Occupations by Sex in Mobile City
Management, Business, Science and Arts Occupations
The most common Management, Business, Science and Arts occupations in Mobile City are , and Management (4 | 4.0%).
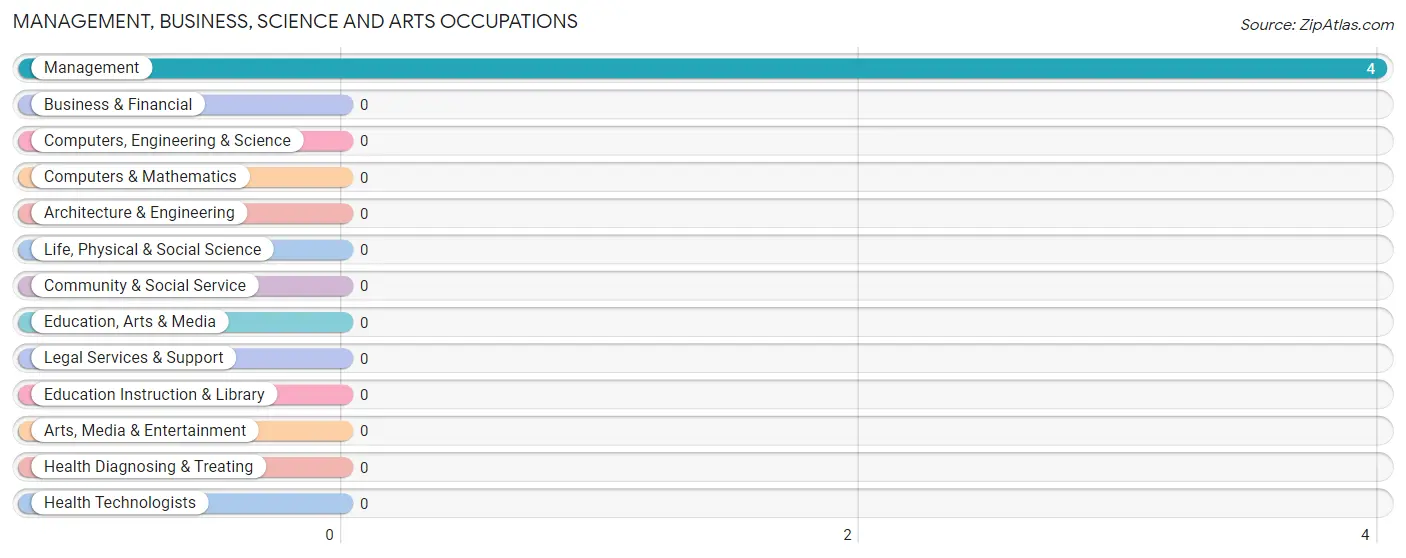
Management, Business, Science and Arts Occupations by Sex
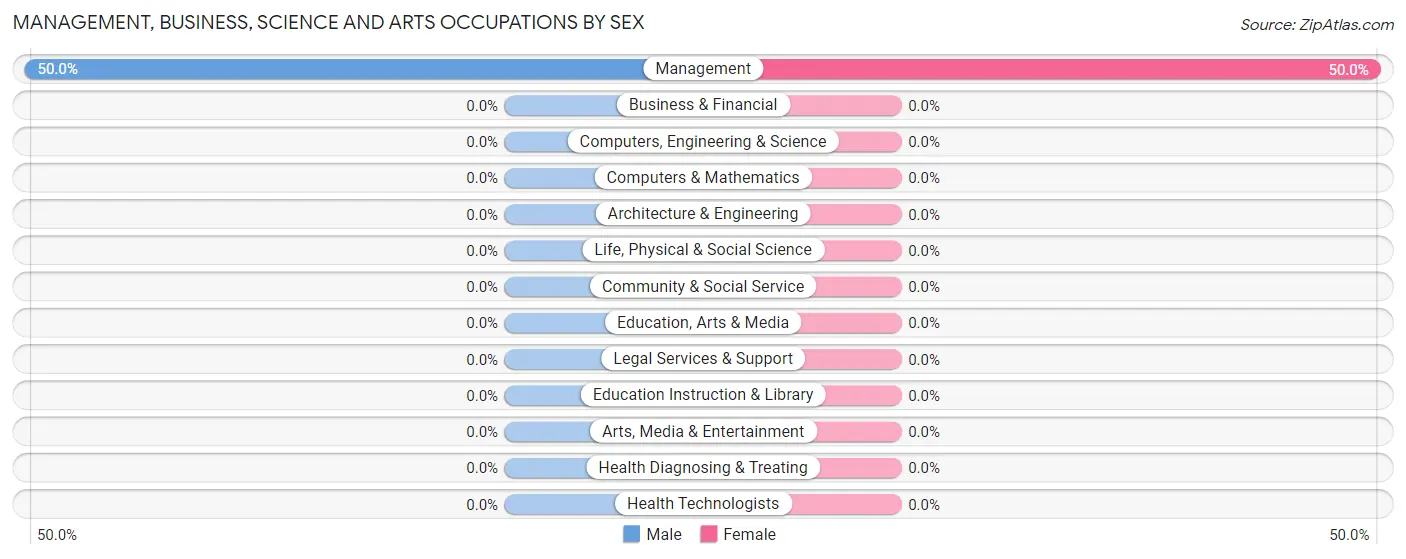
| Occupation | Male | Female |
| Management | 2 (50.0%) | 2 (50.0%) |
| Business & Financial | 0 (0.0%) | 0 (0.0%) |
| Computers, Engineering & Science | 0 (0.0%) | 0 (0.0%) |
| Computers & Mathematics | 0 (0.0%) | 0 (0.0%) |
| Architecture & Engineering | 0 (0.0%) | 0 (0.0%) |
| Life, Physical & Social Science | 0 (0.0%) | 0 (0.0%) |
| Community & Social Service | 0 (0.0%) | 0 (0.0%) |
| Education, Arts & Media | 0 (0.0%) | 0 (0.0%) |
| Legal Services & Support | 0 (0.0%) | 0 (0.0%) |
| Education Instruction & Library | 0 (0.0%) | 0 (0.0%) |
| Arts, Media & Entertainment | 0 (0.0%) | 0 (0.0%) |
| Health Diagnosing & Treating | 0 (0.0%) | 0 (0.0%) |
| Health Technologists | 0 (0.0%) | 0 (0.0%) |
| Total (Category) | 2 (50.0%) | 2 (50.0%) |
| Total (Overall) | 41 (41.4%) | 58 (58.6%) |
Services Occupations
The most common Services occupations in Mobile City are Cleaning & Maintenance (10 | 10.1%), Healthcare Support (7 | 7.1%), and Food Preparation & Serving (5 | 5.1%).
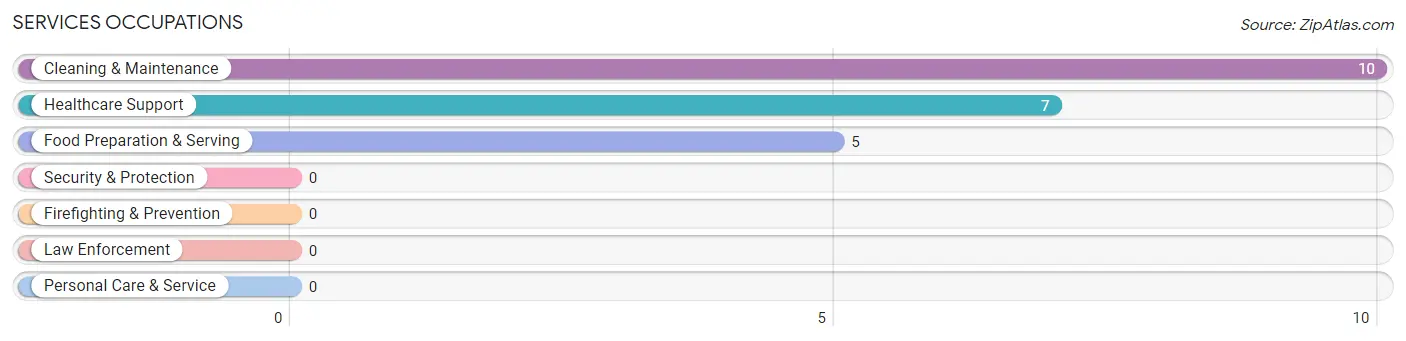
Services Occupations by Sex
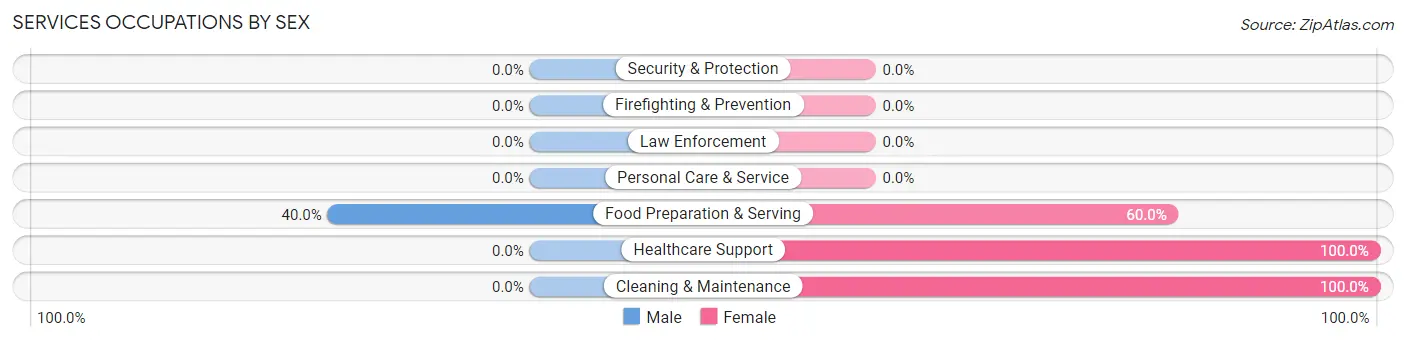
| Occupation | Male | Female |
| Healthcare Support | 0 (0.0%) | 7 (100.0%) |
| Security & Protection | 0 (0.0%) | 0 (0.0%) |
| Firefighting & Prevention | 0 (0.0%) | 0 (0.0%) |
| Law Enforcement | 0 (0.0%) | 0 (0.0%) |
| Food Preparation & Serving | 2 (40.0%) | 3 (60.0%) |
| Cleaning & Maintenance | 0 (0.0%) | 10 (100.0%) |
| Personal Care & Service | 0 (0.0%) | 0 (0.0%) |
| Total (Category) | 2 (9.1%) | 20 (90.9%) |
| Total (Overall) | 41 (41.4%) | 58 (58.6%) |
Sales and Office Occupations
The most common Sales and Office occupations in Mobile City are Office & Administration (5 | 5.1%), and Sales & Related (4 | 4.0%).
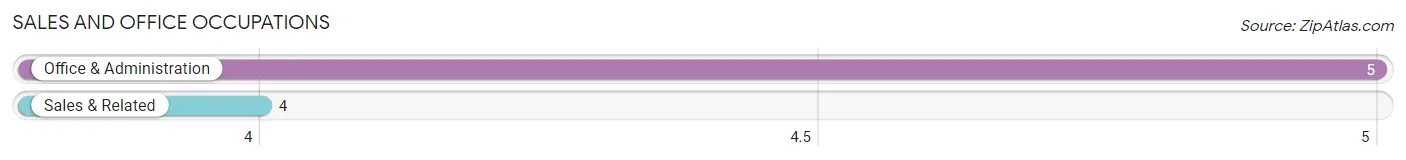
Sales and Office Occupations by Sex

| Occupation | Male | Female |
| Sales & Related | 4 (100.0%) | 0 (0.0%) |
| Office & Administration | 0 (0.0%) | 5 (100.0%) |
| Total (Category) | 4 (44.4%) | 5 (55.6%) |
| Total (Overall) | 41 (41.4%) | 58 (58.6%) |
Natural Resources, Construction and Maintenance Occupations
The most common Natural Resources, Construction and Maintenance occupations in Mobile City are Construction & Extraction (26 | 26.3%), and Installation, Maintenance & Repair (3 | 3.0%).
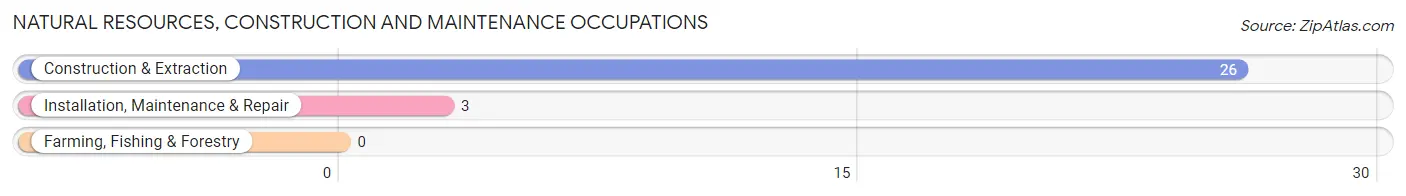
Natural Resources, Construction and Maintenance Occupations by Sex

| Occupation | Male | Female |
| Farming, Fishing & Forestry | 0 (0.0%) | 0 (0.0%) |
| Construction & Extraction | 22 (84.6%) | 4 (15.4%) |
| Installation, Maintenance & Repair | 3 (100.0%) | 0 (0.0%) |
| Total (Category) | 25 (86.2%) | 4 (13.8%) |
| Total (Overall) | 41 (41.4%) | 58 (58.6%) |
Production, Transportation and Moving Occupations
The most common Production, Transportation and Moving occupations in Mobile City are Production (27 | 27.3%), and Material Moving (8 | 8.1%).
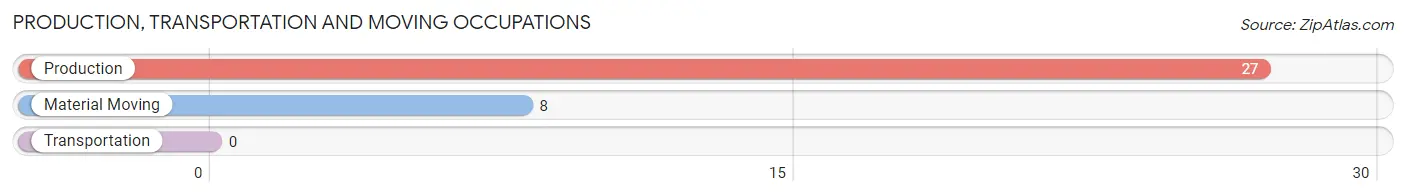
Production, Transportation and Moving Occupations by Sex
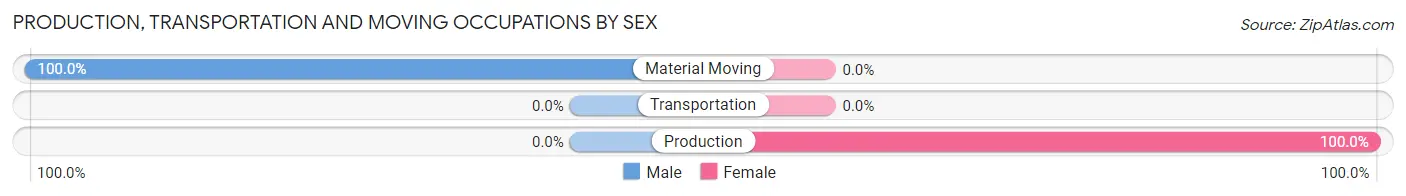
| Occupation | Male | Female |
| Production | 0 (0.0%) | 27 (100.0%) |
| Transportation | 0 (0.0%) | 0 (0.0%) |
| Material Moving | 8 (100.0%) | 0 (0.0%) |
| Total (Category) | 8 (22.9%) | 27 (77.1%) |
| Total (Overall) | 41 (41.4%) | 58 (58.6%) |
Employment Industries by Sex in Mobile City
Employment Industries in Mobile City
The major employment industries in Mobile City include Manufacturing (27 | 27.3%), Construction (26 | 26.3%), Educational Services (12 | 12.1%), Health Care & Social Assistance (12 | 12.1%), and Transportation & Warehousing (8 | 8.1%).
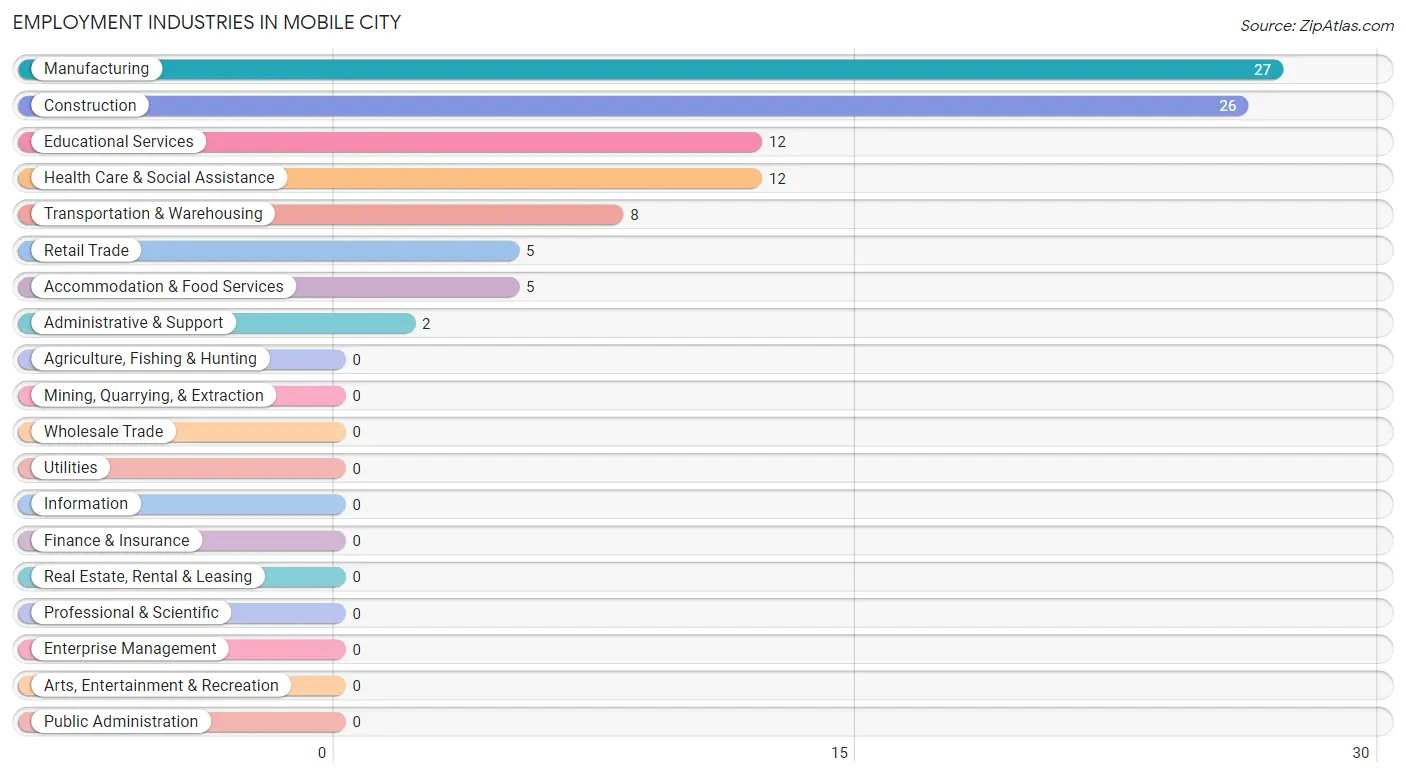
Employment Industries by Sex in Mobile City
The Mobile City industries that see more men than women are Retail Trade (100.0%), Transportation & Warehousing (100.0%), and Administrative & Support (100.0%), whereas the industries that tend to have a higher number of women are Manufacturing (100.0%), Educational Services (100.0%), and Health Care & Social Assistance (100.0%).
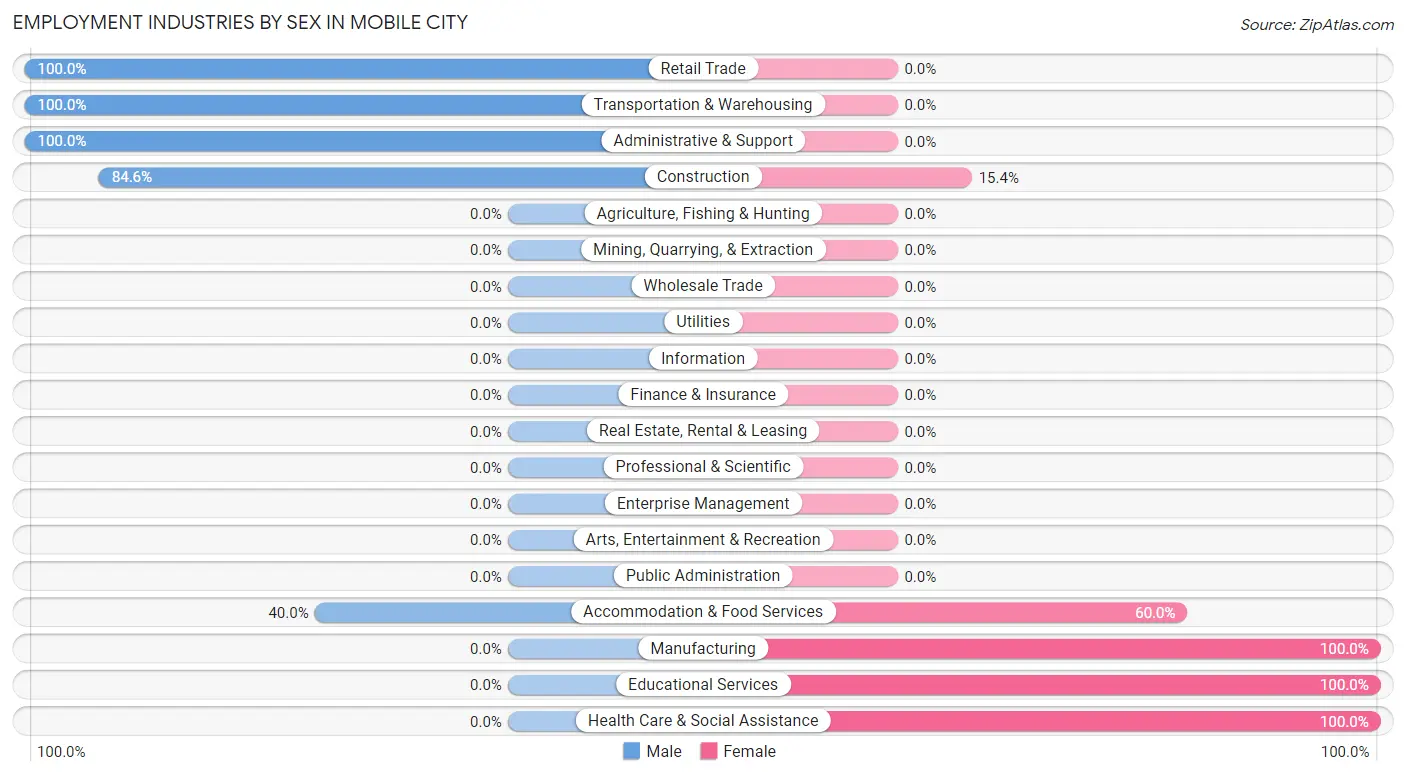
| Industry | Male | Female |
| Agriculture, Fishing & Hunting | 0 (0.0%) | 0 (0.0%) |
| Mining, Quarrying, & Extraction | 0 (0.0%) | 0 (0.0%) |
| Construction | 22 (84.6%) | 4 (15.4%) |
| Manufacturing | 0 (0.0%) | 27 (100.0%) |
| Wholesale Trade | 0 (0.0%) | 0 (0.0%) |
| Retail Trade | 5 (100.0%) | 0 (0.0%) |
| Transportation & Warehousing | 8 (100.0%) | 0 (0.0%) |
| Utilities | 0 (0.0%) | 0 (0.0%) |
| Information | 0 (0.0%) | 0 (0.0%) |
| Finance & Insurance | 0 (0.0%) | 0 (0.0%) |
| Real Estate, Rental & Leasing | 0 (0.0%) | 0 (0.0%) |
| Professional & Scientific | 0 (0.0%) | 0 (0.0%) |
| Enterprise Management | 0 (0.0%) | 0 (0.0%) |
| Administrative & Support | 2 (100.0%) | 0 (0.0%) |
| Educational Services | 0 (0.0%) | 12 (100.0%) |
| Health Care & Social Assistance | 0 (0.0%) | 12 (100.0%) |
| Arts, Entertainment & Recreation | 0 (0.0%) | 0 (0.0%) |
| Accommodation & Food Services | 2 (40.0%) | 3 (60.0%) |
| Public Administration | 0 (0.0%) | 0 (0.0%) |
| Total | 41 (41.4%) | 58 (58.6%) |
Education in Mobile City
School Enrollment in Mobile City
The most common levels of schooling among the 175 students in Mobile City are college / undergraduate (48 | 27.4%), nursery / preschool (45 | 25.7%), and elementary school (45 | 25.7%).
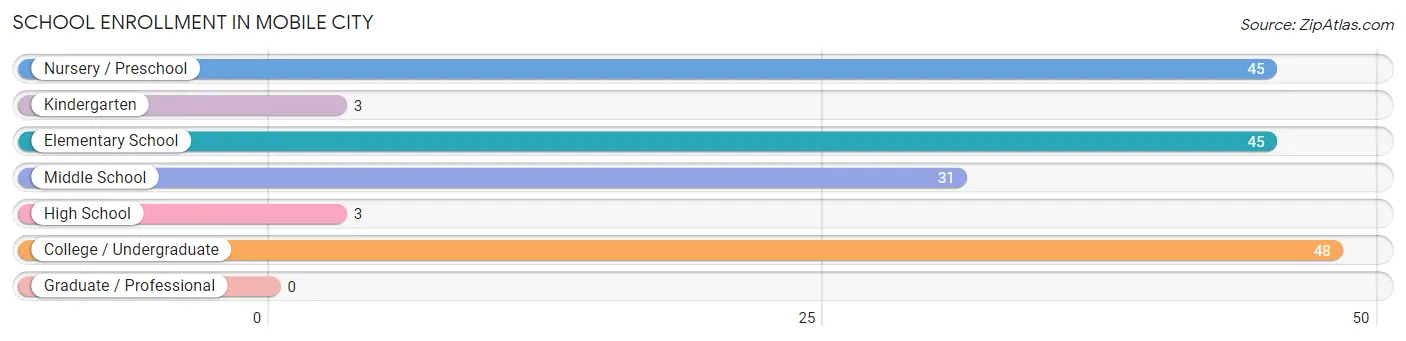
| School Level | # Students | % Students |
| Nursery / Preschool | 45 | 25.7% |
| Kindergarten | 3 | 1.7% |
| Elementary School | 45 | 25.7% |
| Middle School | 31 | 17.7% |
| High School | 3 | 1.7% |
| College / Undergraduate | 48 | 27.4% |
| Graduate / Professional | 0 | 0.0% |
| Total | 175 | 100.0% |
School Enrollment by Age by Funding Source in Mobile City
Out of a total of 175 students who are enrolled in schools in Mobile City, 3 (1.7%) attend a private institution, while the remaining 172 (98.3%) are enrolled in public schools. The age group of 15 to 17 year olds has the highest likelihood of being enrolled in private schools, with 3 (100.0% in the age bracket) enrolled. Conversely, the age group of 3 to 4 year olds has the lowest likelihood of being enrolled in a private school, with 45 (100.0% in the age bracket) attending a public institution.
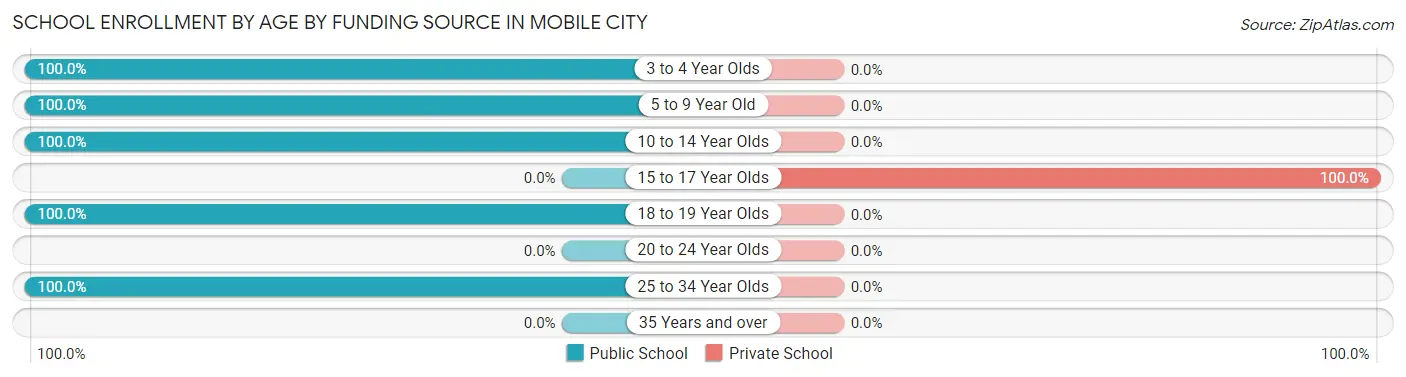
| Age Bracket | Public School | Private School |
| 3 to 4 Year Olds | 45 (100.0%) | 0 (0.0%) |
| 5 to 9 Year Old | 45 (100.0%) | 0 (0.0%) |
| 10 to 14 Year Olds | 34 (100.0%) | 0 (0.0%) |
| 15 to 17 Year Olds | 0 (0.0%) | 3 (100.0%) |
| 18 to 19 Year Olds | 2 (100.0%) | 0 (0.0%) |
| 20 to 24 Year Olds | 0 (0.0%) | 0 (0.0%) |
| 25 to 34 Year Olds | 46 (100.0%) | 0 (0.0%) |
| 35 Years and over | 0 (0.0%) | 0 (0.0%) |
| Total | 172 (98.3%) | 3 (1.7%) |
Educational Attainment by Field of Study in Mobile City
Science & technology (2 | 66.7%), and psychology (1 | 33.3%) are the most common fields of study among 3 individuals in Mobile City who have obtained a bachelor's degree or higher.
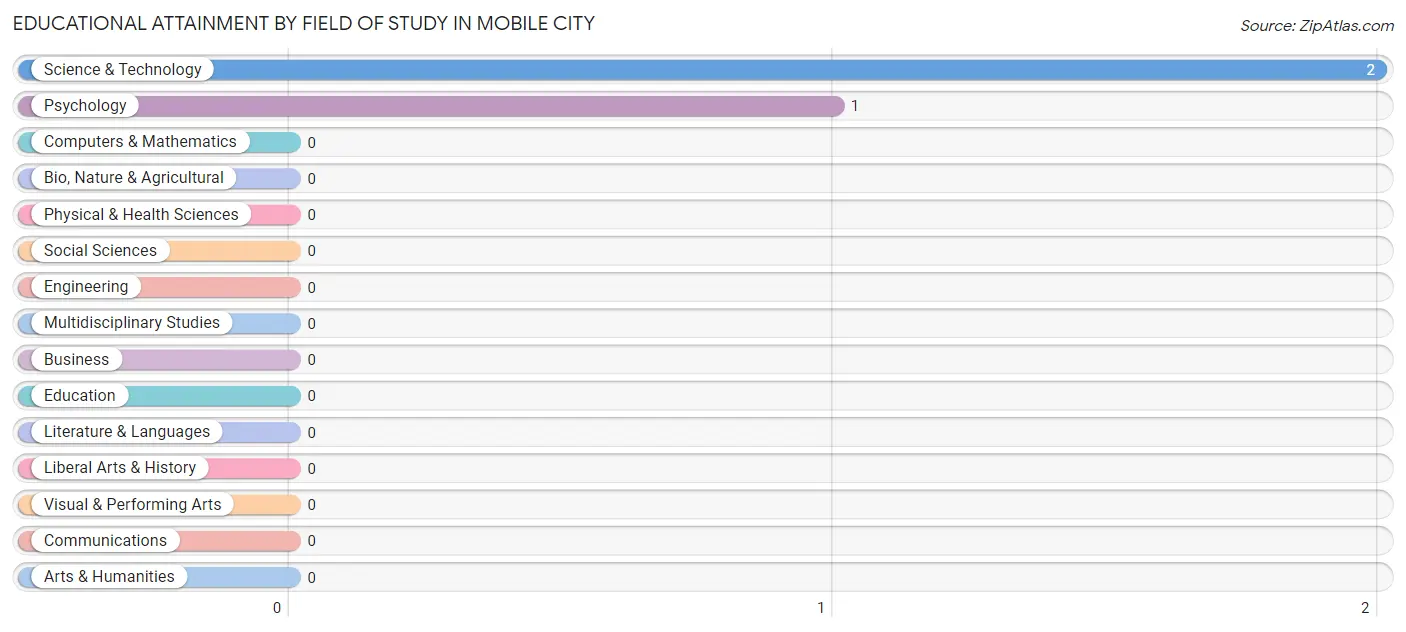
| Field of Study | # Graduates | % Graduates |
| Computers & Mathematics | 0 | 0.0% |
| Bio, Nature & Agricultural | 0 | 0.0% |
| Physical & Health Sciences | 0 | 0.0% |
| Psychology | 1 | 33.3% |
| Social Sciences | 0 | 0.0% |
| Engineering | 0 | 0.0% |
| Multidisciplinary Studies | 0 | 0.0% |
| Science & Technology | 2 | 66.7% |
| Business | 0 | 0.0% |
| Education | 0 | 0.0% |
| Literature & Languages | 0 | 0.0% |
| Liberal Arts & History | 0 | 0.0% |
| Visual & Performing Arts | 0 | 0.0% |
| Communications | 0 | 0.0% |
| Arts & Humanities | 0 | 0.0% |
| Total | 3 | 100.0% |
Transportation & Commute in Mobile City
Vehicle Availability by Sex in Mobile City
The most prevalent vehicle ownership categories in Mobile City are males with 1 vehicle (31, accounting for 75.6%) and females with 1 vehicle (53, making up 53.4%).
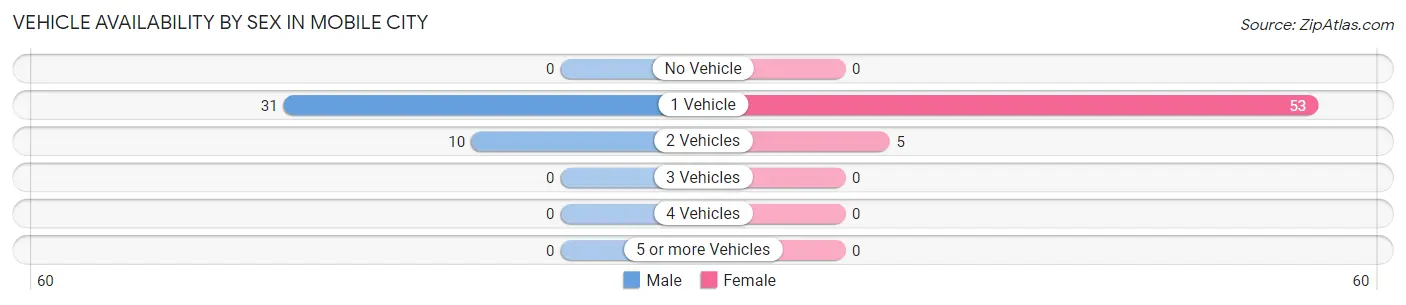
| Vehicles Available | Male | Female |
| No Vehicle | 0 (0.0%) | 0 (0.0%) |
| 1 Vehicle | 31 (75.6%) | 53 (91.4%) |
| 2 Vehicles | 10 (24.4%) | 5 (8.6%) |
| 3 Vehicles | 0 (0.0%) | 0 (0.0%) |
| 4 Vehicles | 0 (0.0%) | 0 (0.0%) |
| 5 or more Vehicles | 0 (0.0%) | 0 (0.0%) |
| Total | 41 (100.0%) | 58 (100.0%) |
Commute Time in Mobile City
The most frequently occuring commute durations in Mobile City are 5 to 9 minutes (36 commuters, 37.1%), 30 to 34 minutes (18 commuters, 18.6%), and 15 to 19 minutes (12 commuters, 12.4%).
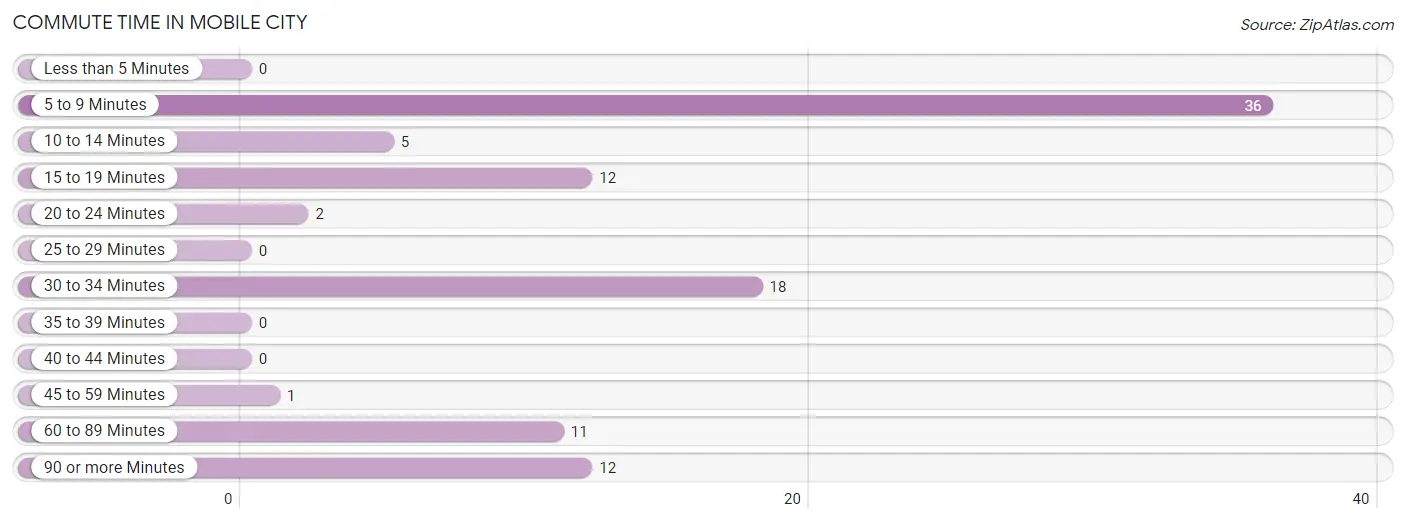
| Commute Time | # Commuters | % Commuters |
| Less than 5 Minutes | 0 | 0.0% |
| 5 to 9 Minutes | 36 | 37.1% |
| 10 to 14 Minutes | 5 | 5.1% |
| 15 to 19 Minutes | 12 | 12.4% |
| 20 to 24 Minutes | 2 | 2.1% |
| 25 to 29 Minutes | 0 | 0.0% |
| 30 to 34 Minutes | 18 | 18.6% |
| 35 to 39 Minutes | 0 | 0.0% |
| 40 to 44 Minutes | 0 | 0.0% |
| 45 to 59 Minutes | 1 | 1.0% |
| 60 to 89 Minutes | 11 | 11.3% |
| 90 or more Minutes | 12 | 12.4% |
Commute Time by Sex in Mobile City
The most common commute times in Mobile City are 90 or more minutes (12 commuters, 29.3%) for males and 5 to 9 minutes (26 commuters, 46.4%) for females.
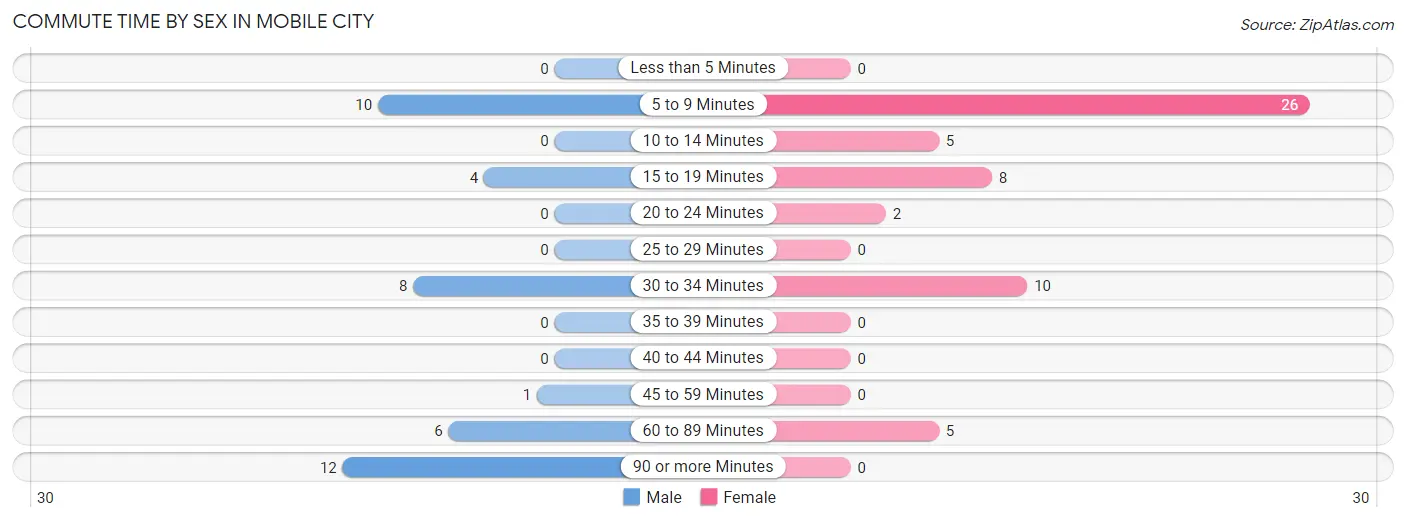
| Commute Time | Male | Female |
| Less than 5 Minutes | 0 (0.0%) | 0 (0.0%) |
| 5 to 9 Minutes | 10 (24.4%) | 26 (46.4%) |
| 10 to 14 Minutes | 0 (0.0%) | 5 (8.9%) |
| 15 to 19 Minutes | 4 (9.8%) | 8 (14.3%) |
| 20 to 24 Minutes | 0 (0.0%) | 2 (3.6%) |
| 25 to 29 Minutes | 0 (0.0%) | 0 (0.0%) |
| 30 to 34 Minutes | 8 (19.5%) | 10 (17.9%) |
| 35 to 39 Minutes | 0 (0.0%) | 0 (0.0%) |
| 40 to 44 Minutes | 0 (0.0%) | 0 (0.0%) |
| 45 to 59 Minutes | 1 (2.4%) | 0 (0.0%) |
| 60 to 89 Minutes | 6 (14.6%) | 5 (8.9%) |
| 90 or more Minutes | 12 (29.3%) | 0 (0.0%) |
Time of Departure to Work by Sex in Mobile City
The most frequent times of departure to work in Mobile City are 12:00 AM to 4:59 AM (16, 39.0%) for males and 6:30 AM to 6:59 AM (26, 46.4%) for females.
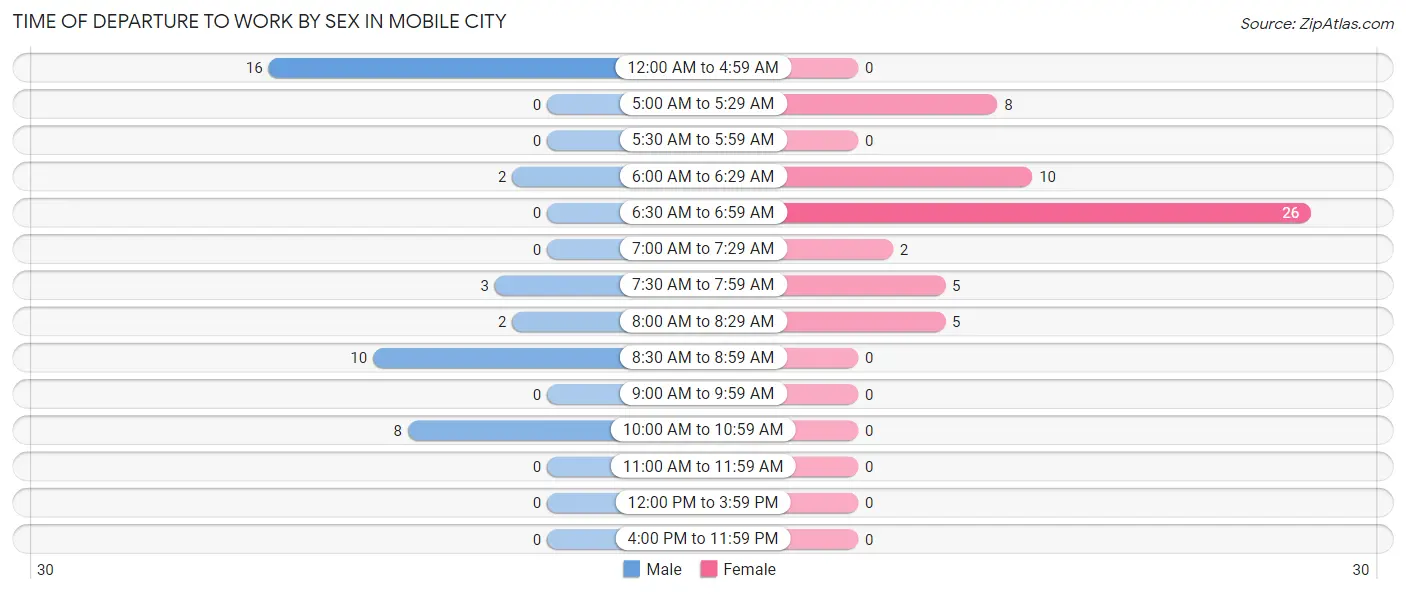
| Time of Departure | Male | Female |
| 12:00 AM to 4:59 AM | 16 (39.0%) | 0 (0.0%) |
| 5:00 AM to 5:29 AM | 0 (0.0%) | 8 (14.3%) |
| 5:30 AM to 5:59 AM | 0 (0.0%) | 0 (0.0%) |
| 6:00 AM to 6:29 AM | 2 (4.9%) | 10 (17.9%) |
| 6:30 AM to 6:59 AM | 0 (0.0%) | 26 (46.4%) |
| 7:00 AM to 7:29 AM | 0 (0.0%) | 2 (3.6%) |
| 7:30 AM to 7:59 AM | 3 (7.3%) | 5 (8.9%) |
| 8:00 AM to 8:29 AM | 2 (4.9%) | 5 (8.9%) |
| 8:30 AM to 8:59 AM | 10 (24.4%) | 0 (0.0%) |
| 9:00 AM to 9:59 AM | 0 (0.0%) | 0 (0.0%) |
| 10:00 AM to 10:59 AM | 8 (19.5%) | 0 (0.0%) |
| 11:00 AM to 11:59 AM | 0 (0.0%) | 0 (0.0%) |
| 12:00 PM to 3:59 PM | 0 (0.0%) | 0 (0.0%) |
| 4:00 PM to 11:59 PM | 0 (0.0%) | 0 (0.0%) |
| Total | 41 (100.0%) | 56 (100.0%) |
Housing Occupancy in Mobile City
Occupancy by Ownership in Mobile City
Of the total 118 dwellings in Mobile City, owner-occupied units account for 35 (29.7%), while renter-occupied units make up 83 (70.3%).
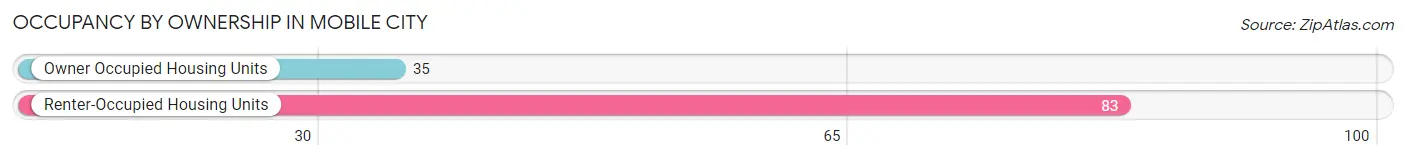
| Occupancy | # Housing Units | % Housing Units |
| Owner Occupied Housing Units | 35 | 29.7% |
| Renter-Occupied Housing Units | 83 | 70.3% |
| Total Occupied Housing Units | 118 | 100.0% |
Occupancy by Household Size in Mobile City
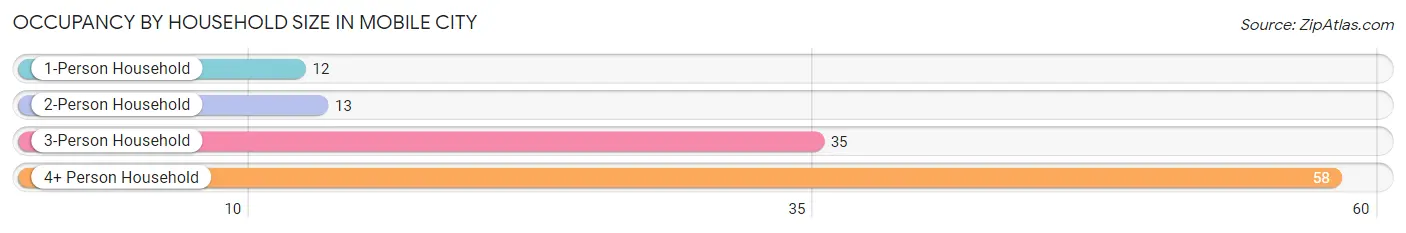
| Household Size | # Housing Units | % Housing Units |
| 1-Person Household | 12 | 10.2% |
| 2-Person Household | 13 | 11.0% |
| 3-Person Household | 35 | 29.7% |
| 4+ Person Household | 58 | 49.1% |
| Total Housing Units | 118 | 100.0% |
Occupancy by Ownership by Household Size in Mobile City
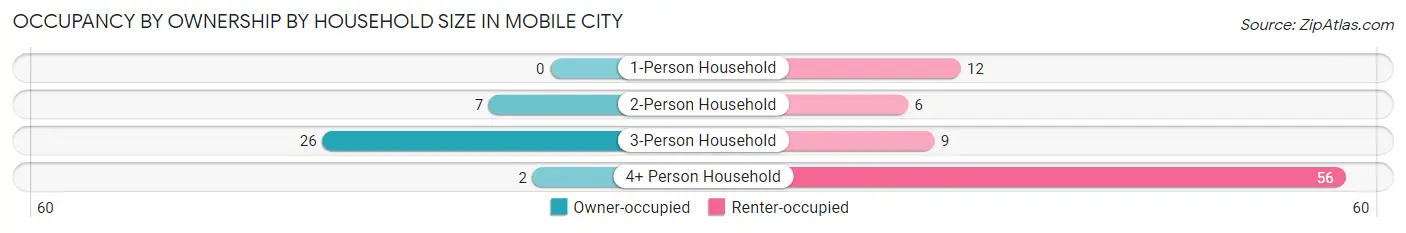
| Household Size | Owner-occupied | Renter-occupied |
| 1-Person Household | 0 (0.0%) | 12 (100.0%) |
| 2-Person Household | 7 (53.8%) | 6 (46.2%) |
| 3-Person Household | 26 (74.3%) | 9 (25.7%) |
| 4+ Person Household | 2 (3.5%) | 56 (96.6%) |
| Total Housing Units | 35 (29.7%) | 83 (70.3%) |
Occupancy by Educational Attainment in Mobile City
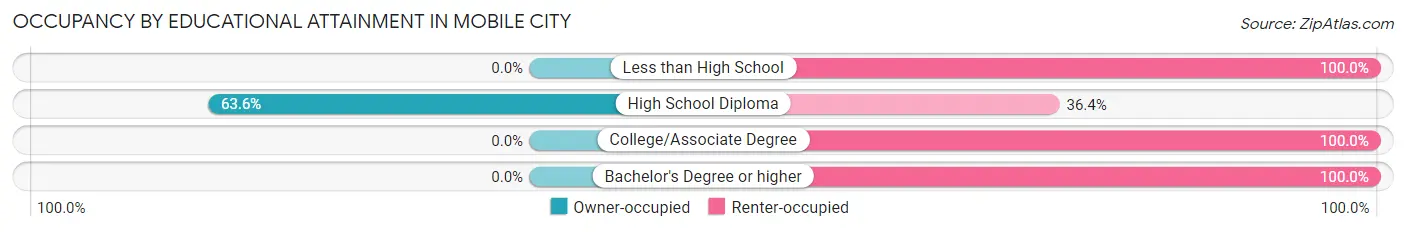
| Household Size | Owner-occupied | Renter-occupied |
| Less than High School | 0 (0.0%) | 4 (100.0%) |
| High School Diploma | 35 (63.6%) | 20 (36.4%) |
| College/Associate Degree | 0 (0.0%) | 57 (100.0%) |
| Bachelor's Degree or higher | 0 (0.0%) | 2 (100.0%) |
Occupancy by Age of Householder in Mobile City
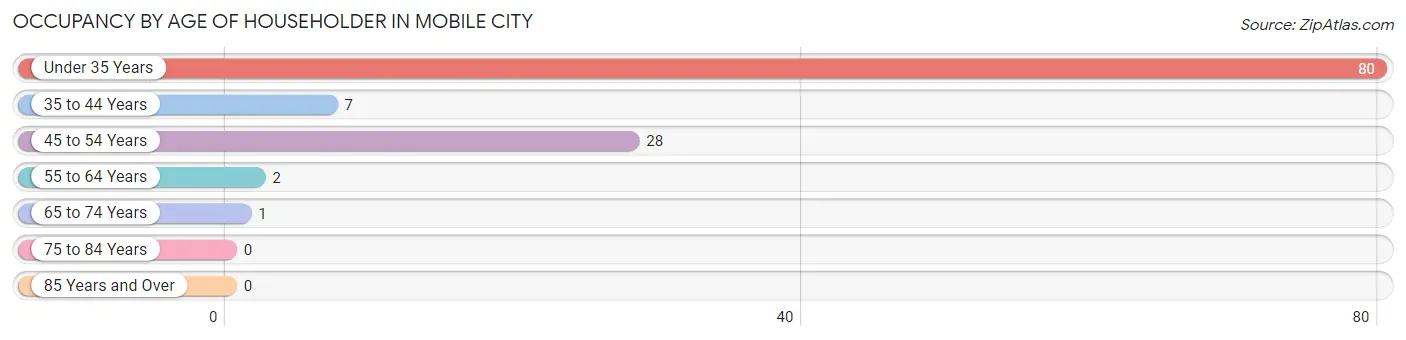
| Age Bracket | # Households | % Households |
| Under 35 Years | 80 | 67.8% |
| 35 to 44 Years | 7 | 5.9% |
| 45 to 54 Years | 28 | 23.7% |
| 55 to 64 Years | 2 | 1.7% |
| 65 to 74 Years | 1 | 0.9% |
| 75 to 84 Years | 0 | 0.0% |
| 85 Years and Over | 0 | 0.0% |
| Total | 118 | 100.0% |
Housing Finances in Mobile City
Median Income by Occupancy in Mobile City
| Occupancy Type | # Households | Median Income |
| Owner-Occupied | 35 (29.7%) | $0 |
| Renter-Occupied | 83 (70.3%) | $0 |
| Average | 118 (100.0%) | $0 |
Occupancy by Householder Income Bracket in Mobile City
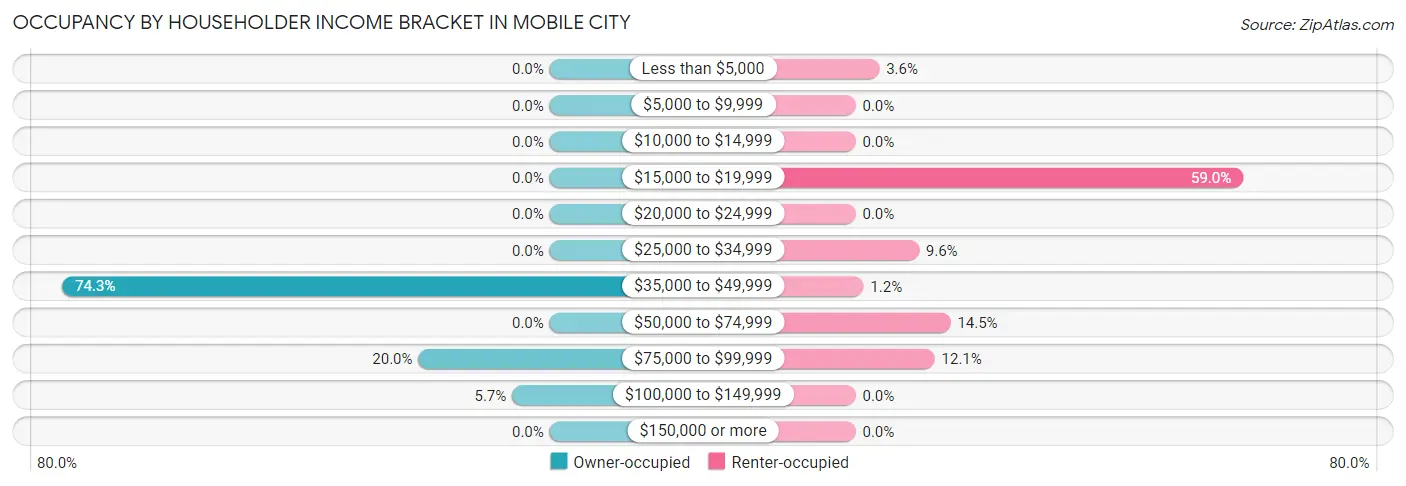
| Income Bracket | Owner-occupied | Renter-occupied |
| Less than $5,000 | 0 (0.0%) | 3 (3.6%) |
| $5,000 to $9,999 | 0 (0.0%) | 0 (0.0%) |
| $10,000 to $14,999 | 0 (0.0%) | 0 (0.0%) |
| $15,000 to $19,999 | 0 (0.0%) | 49 (59.0%) |
| $20,000 to $24,999 | 0 (0.0%) | 0 (0.0%) |
| $25,000 to $34,999 | 0 (0.0%) | 8 (9.6%) |
| $35,000 to $49,999 | 26 (74.3%) | 1 (1.2%) |
| $50,000 to $74,999 | 0 (0.0%) | 12 (14.5%) |
| $75,000 to $99,999 | 7 (20.0%) | 10 (12.0%) |
| $100,000 to $149,999 | 2 (5.7%) | 0 (0.0%) |
| $150,000 or more | 0 (0.0%) | 0 (0.0%) |
| Total | 35 (100.0%) | 83 (100.0%) |
Monthly Housing Cost Tiers in Mobile City
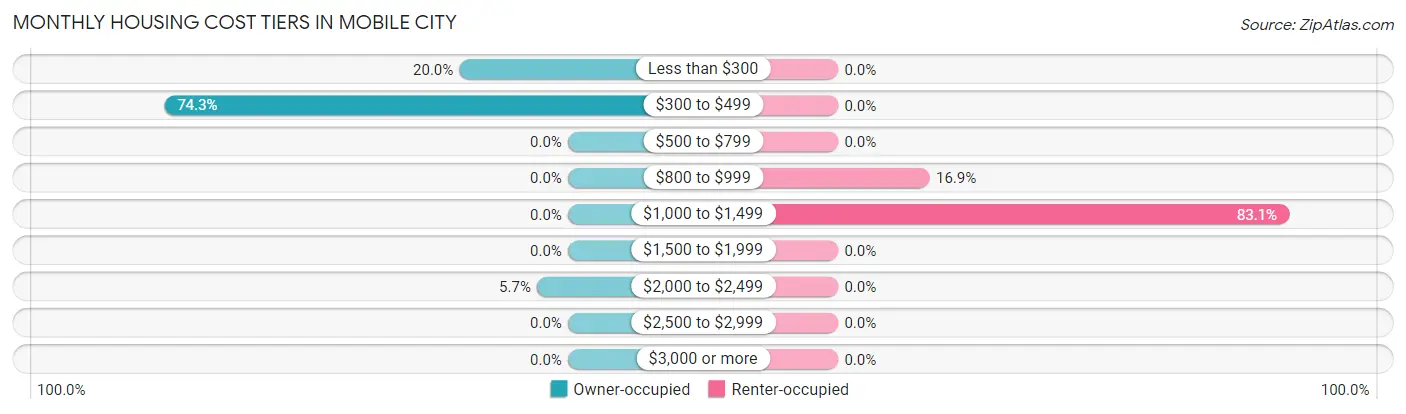
| Monthly Cost | Owner-occupied | Renter-occupied |
| Less than $300 | 7 (20.0%) | 0 (0.0%) |
| $300 to $499 | 26 (74.3%) | 0 (0.0%) |
| $500 to $799 | 0 (0.0%) | 0 (0.0%) |
| $800 to $999 | 0 (0.0%) | 14 (16.9%) |
| $1,000 to $1,499 | 0 (0.0%) | 69 (83.1%) |
| $1,500 to $1,999 | 0 (0.0%) | 0 (0.0%) |
| $2,000 to $2,499 | 2 (5.7%) | 0 (0.0%) |
| $2,500 to $2,999 | 0 (0.0%) | 0 (0.0%) |
| $3,000 or more | 0 (0.0%) | 0 (0.0%) |
| Total | 35 (100.0%) | 83 (100.0%) |
Physical Housing Characteristics in Mobile City
Housing Structures in Mobile City
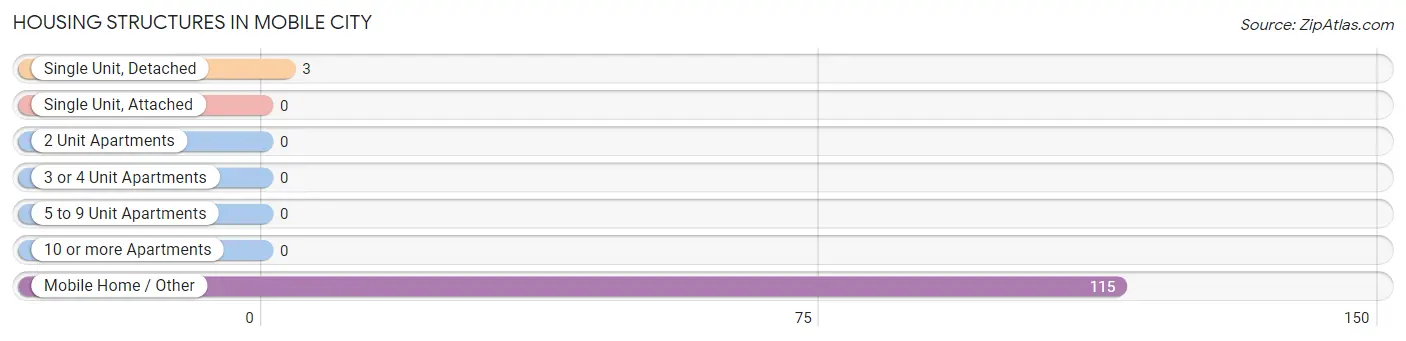
| Structure Type | # Housing Units | % Housing Units |
| Single Unit, Detached | 3 | 2.5% |
| Single Unit, Attached | 0 | 0.0% |
| 2 Unit Apartments | 0 | 0.0% |
| 3 or 4 Unit Apartments | 0 | 0.0% |
| 5 to 9 Unit Apartments | 0 | 0.0% |
| 10 or more Apartments | 0 | 0.0% |
| Mobile Home / Other | 115 | 97.5% |
| Total | 118 | 100.0% |
Housing Structures by Occupancy in Mobile City
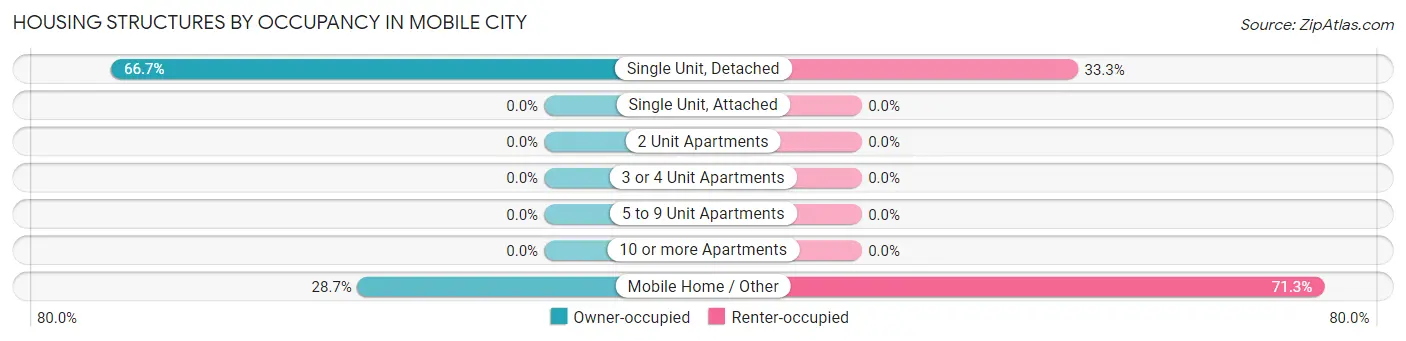
| Structure Type | Owner-occupied | Renter-occupied |
| Single Unit, Detached | 2 (66.7%) | 1 (33.3%) |
| Single Unit, Attached | 0 (0.0%) | 0 (0.0%) |
| 2 Unit Apartments | 0 (0.0%) | 0 (0.0%) |
| 3 or 4 Unit Apartments | 0 (0.0%) | 0 (0.0%) |
| 5 to 9 Unit Apartments | 0 (0.0%) | 0 (0.0%) |
| 10 or more Apartments | 0 (0.0%) | 0 (0.0%) |
| Mobile Home / Other | 33 (28.7%) | 82 (71.3%) |
| Total | 35 (29.7%) | 83 (70.3%) |
Housing Structures by Number of Rooms in Mobile City
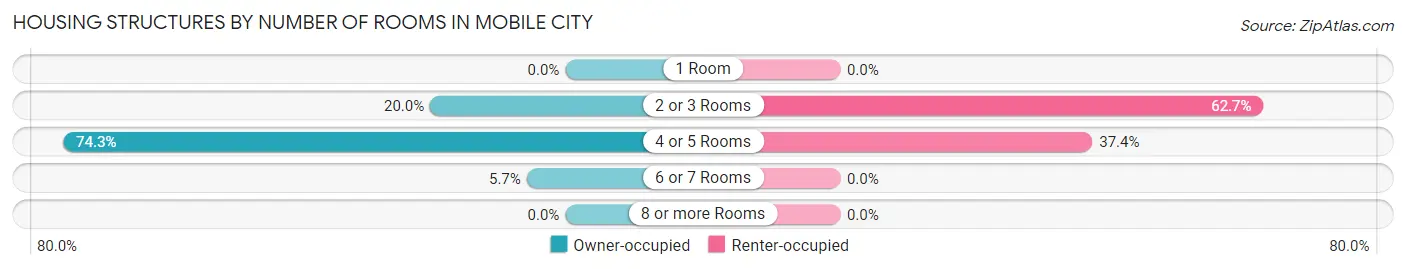
| Number of Rooms | Owner-occupied | Renter-occupied |
| 1 Room | 0 (0.0%) | 0 (0.0%) |
| 2 or 3 Rooms | 7 (20.0%) | 52 (62.6%) |
| 4 or 5 Rooms | 26 (74.3%) | 31 (37.3%) |
| 6 or 7 Rooms | 2 (5.7%) | 0 (0.0%) |
| 8 or more Rooms | 0 (0.0%) | 0 (0.0%) |
| Total | 35 (100.0%) | 83 (100.0%) |
Housing Structure by Heating Type in Mobile City
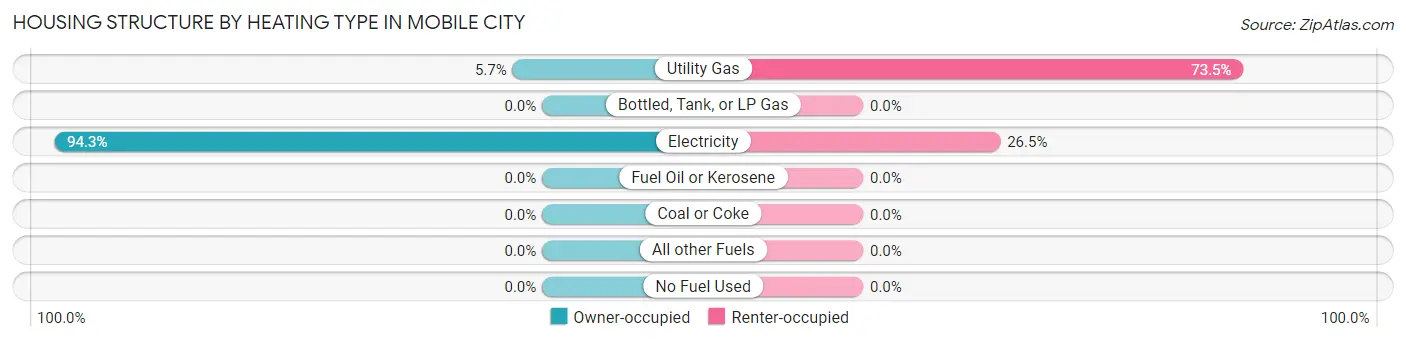
| Heating Type | Owner-occupied | Renter-occupied |
| Utility Gas | 2 (5.7%) | 61 (73.5%) |
| Bottled, Tank, or LP Gas | 0 (0.0%) | 0 (0.0%) |
| Electricity | 33 (94.3%) | 22 (26.5%) |
| Fuel Oil or Kerosene | 0 (0.0%) | 0 (0.0%) |
| Coal or Coke | 0 (0.0%) | 0 (0.0%) |
| All other Fuels | 0 (0.0%) | 0 (0.0%) |
| No Fuel Used | 0 (0.0%) | 0 (0.0%) |
| Total | 35 (100.0%) | 83 (100.0%) |
Household Vehicle Usage in Mobile City
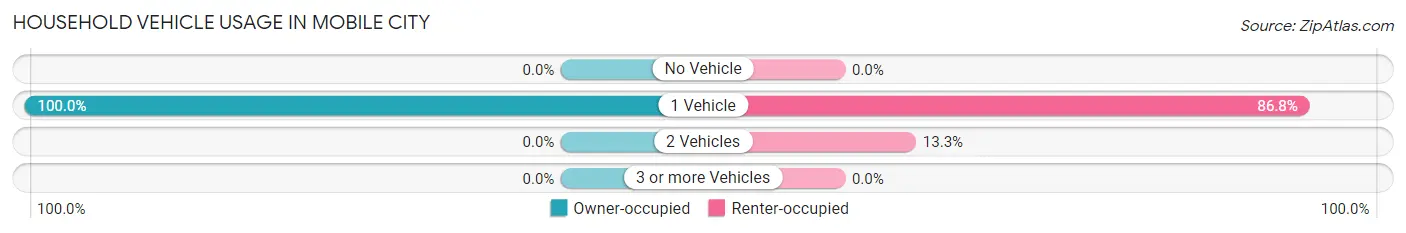
| Vehicles per Household | Owner-occupied | Renter-occupied |
| No Vehicle | 0 (0.0%) | 0 (0.0%) |
| 1 Vehicle | 35 (100.0%) | 72 (86.8%) |
| 2 Vehicles | 0 (0.0%) | 11 (13.3%) |
| 3 or more Vehicles | 0 (0.0%) | 0 (0.0%) |
| Total | 35 (100.0%) | 83 (100.0%) |
Real Estate & Mortgages in Mobile City
Real Estate and Mortgage Overview in Mobile City
| Characteristic | Without Mortgage | With Mortgage |
| Housing Units | 33 | 2 |
| Median Property Value | - | - |
| Median Household Income | - | - |
| Monthly Housing Costs | - | - |
| Real Estate Taxes | - | - |
Property Value by Mortgage Status in Mobile City
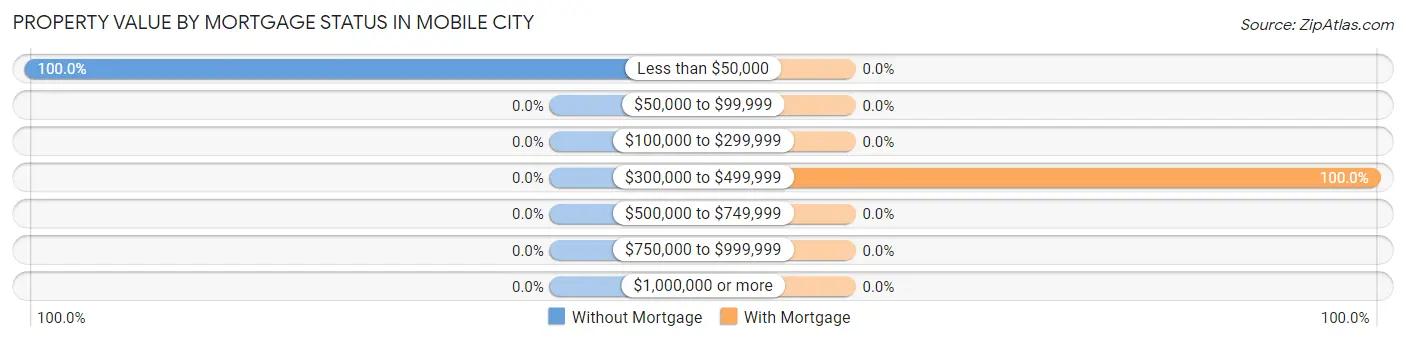
| Property Value | Without Mortgage | With Mortgage |
| Less than $50,000 | 33 (100.0%) | 0 (0.0%) |
| $50,000 to $99,999 | 0 (0.0%) | 0 (0.0%) |
| $100,000 to $299,999 | 0 (0.0%) | 0 (0.0%) |
| $300,000 to $499,999 | 0 (0.0%) | 2 (100.0%) |
| $500,000 to $749,999 | 0 (0.0%) | 0 (0.0%) |
| $750,000 to $999,999 | 0 (0.0%) | 0 (0.0%) |
| $1,000,000 or more | 0 (0.0%) | 0 (0.0%) |
| Total | 33 (100.0%) | 2 (100.0%) |
Household Income by Mortgage Status in Mobile City
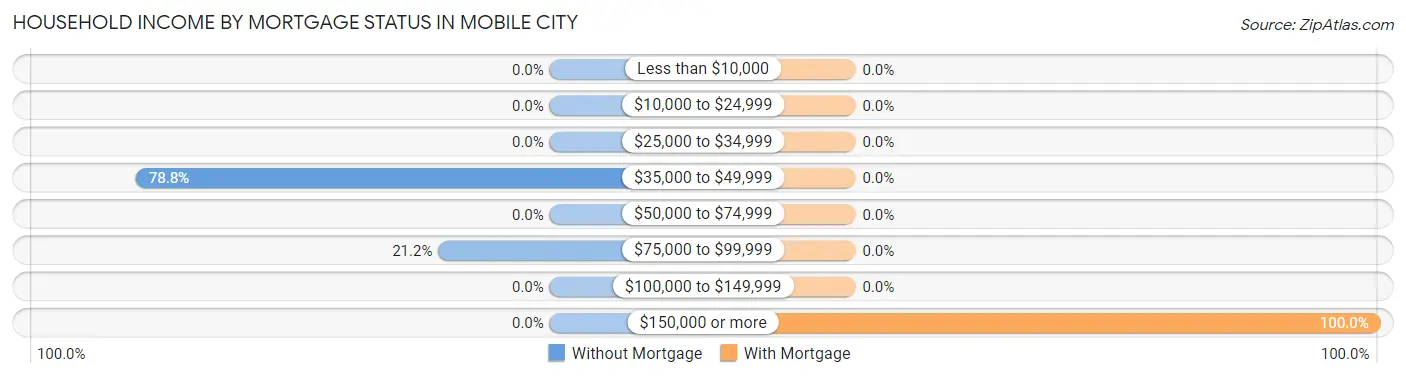
| Household Income | Without Mortgage | With Mortgage |
| Less than $10,000 | 0 (0.0%) | 0 (0.0%) |
| $10,000 to $24,999 | 0 (0.0%) | 0 (0.0%) |
| $25,000 to $34,999 | 0 (0.0%) | 0 (0.0%) |
| $35,000 to $49,999 | 26 (78.8%) | 0 (0.0%) |
| $50,000 to $74,999 | 0 (0.0%) | 0 (0.0%) |
| $75,000 to $99,999 | 7 (21.2%) | 0 (0.0%) |
| $100,000 to $149,999 | 0 (0.0%) | 0 (0.0%) |
| $150,000 or more | 0 (0.0%) | 2 (100.0%) |
| Total | 33 (100.0%) | 2 (100.0%) |
Property Value to Household Income Ratio in Mobile City
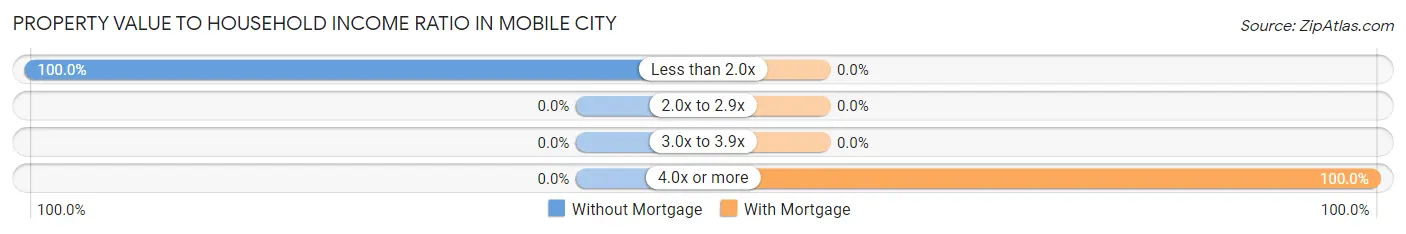
| Value-to-Income Ratio | Without Mortgage | With Mortgage |
| Less than 2.0x | 33 (100.0%) | 0 (0.0%) |
| 2.0x to 2.9x | 0 (0.0%) | 0 (0.0%) |
| 3.0x to 3.9x | 0 (0.0%) | 0 (0.0%) |
| 4.0x or more | 0 (0.0%) | 2 (100.0%) |
| Total | 33 (100.0%) | 2 (100.0%) |
Real Estate Taxes by Mortgage Status in Mobile City
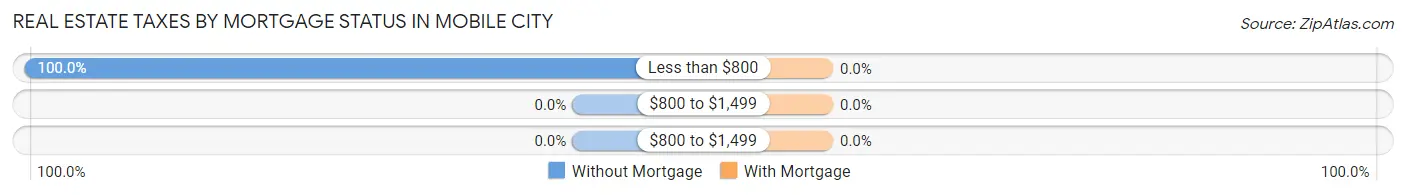
| Property Taxes | Without Mortgage | With Mortgage |
| Less than $800 | 33 (100.0%) | 0 (0.0%) |
| $800 to $1,499 | 0 (0.0%) | 0 (0.0%) |
| $800 to $1,499 | 0 (0.0%) | 0 (0.0%) |
| Total | 33 (100.0%) | 2 (100.0%) |
Health & Disability in Mobile City
Health Insurance Coverage by Age in Mobile City
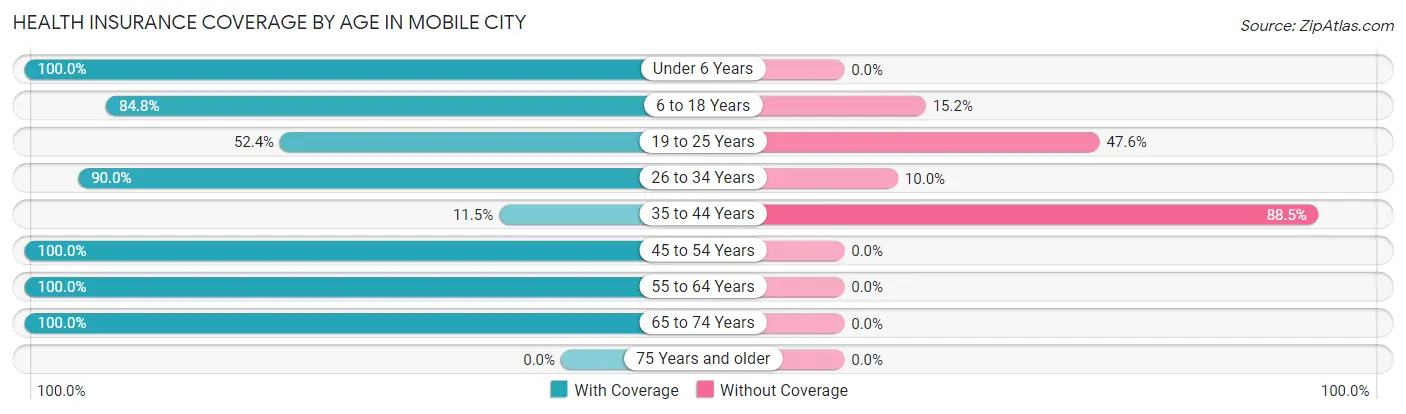
| Age Bracket | With Coverage | Without Coverage |
| Under 6 Years | 49 (100.0%) | 0 (0.0%) |
| 6 to 18 Years | 67 (84.8%) | 12 (15.2%) |
| 19 to 25 Years | 11 (52.4%) | 10 (47.6%) |
| 26 to 34 Years | 63 (90.0%) | 7 (10.0%) |
| 35 to 44 Years | 3 (11.5%) | 23 (88.5%) |
| 45 to 54 Years | 28 (100.0%) | 0 (0.0%) |
| 55 to 64 Years | 3 (100.0%) | 0 (0.0%) |
| 65 to 74 Years | 1 (100.0%) | 0 (0.0%) |
| 75 Years and older | 0 (0.0%) | 0 (0.0%) |
| Total | 225 (81.2%) | 52 (18.8%) |
Health Insurance Coverage by Citizenship Status in Mobile City
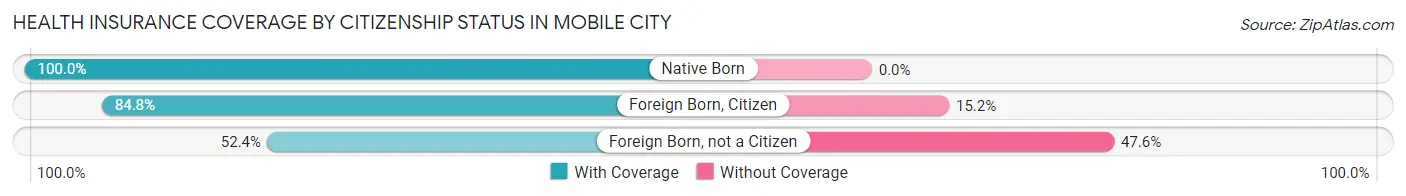
| Citizenship Status | With Coverage | Without Coverage |
| Native Born | 49 (100.0%) | 0 (0.0%) |
| Foreign Born, Citizen | 67 (84.8%) | 12 (15.2%) |
| Foreign Born, not a Citizen | 11 (52.4%) | 10 (47.6%) |
Health Insurance Coverage by Household Income in Mobile City
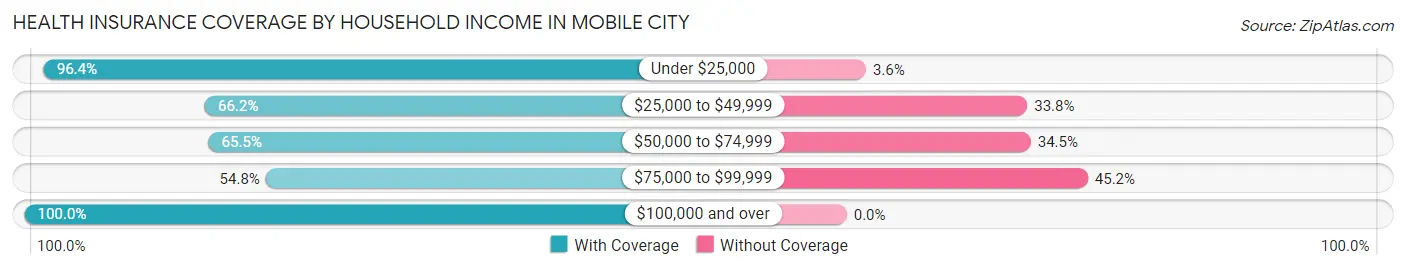
| Household Income | With Coverage | Without Coverage |
| Under $25,000 | 134 (96.4%) | 5 (3.6%) |
| $25,000 to $49,999 | 45 (66.2%) | 23 (33.8%) |
| $50,000 to $74,999 | 19 (65.5%) | 10 (34.5%) |
| $75,000 to $99,999 | 17 (54.8%) | 14 (45.2%) |
| $100,000 and over | 10 (100.0%) | 0 (0.0%) |
Public vs Private Health Insurance Coverage by Age in Mobile City
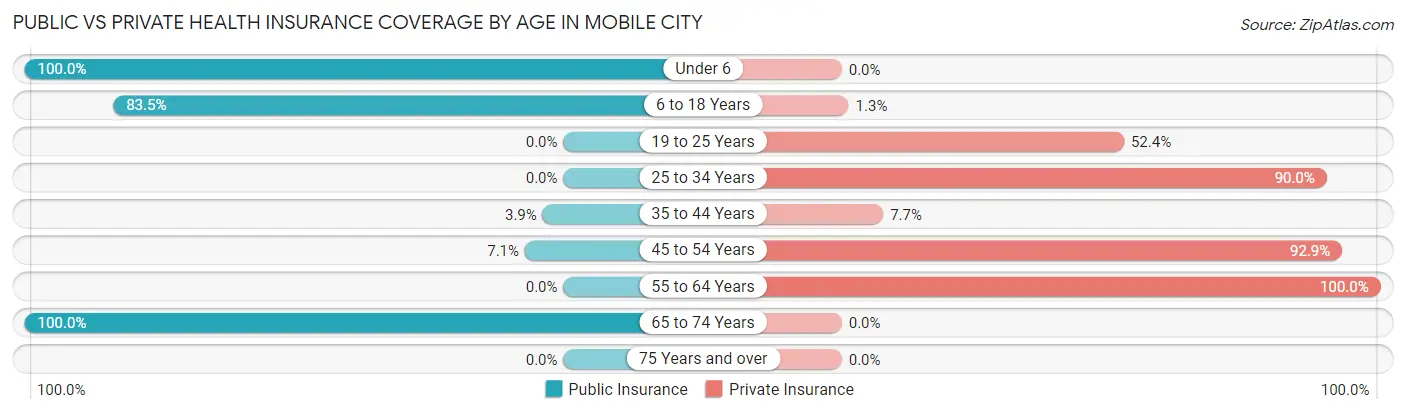
| Age Bracket | Public Insurance | Private Insurance |
| Under 6 | 49 (100.0%) | 0 (0.0%) |
| 6 to 18 Years | 66 (83.5%) | 1 (1.3%) |
| 19 to 25 Years | 0 (0.0%) | 11 (52.4%) |
| 25 to 34 Years | 0 (0.0%) | 63 (90.0%) |
| 35 to 44 Years | 1 (3.8%) | 2 (7.7%) |
| 45 to 54 Years | 2 (7.1%) | 26 (92.9%) |
| 55 to 64 Years | 0 (0.0%) | 3 (100.0%) |
| 65 to 74 Years | 1 (100.0%) | 0 (0.0%) |
| 75 Years and over | 0 (0.0%) | 0 (0.0%) |
| Total | 119 (43.0%) | 106 (38.3%) |
Disability Status by Sex by Age in Mobile City
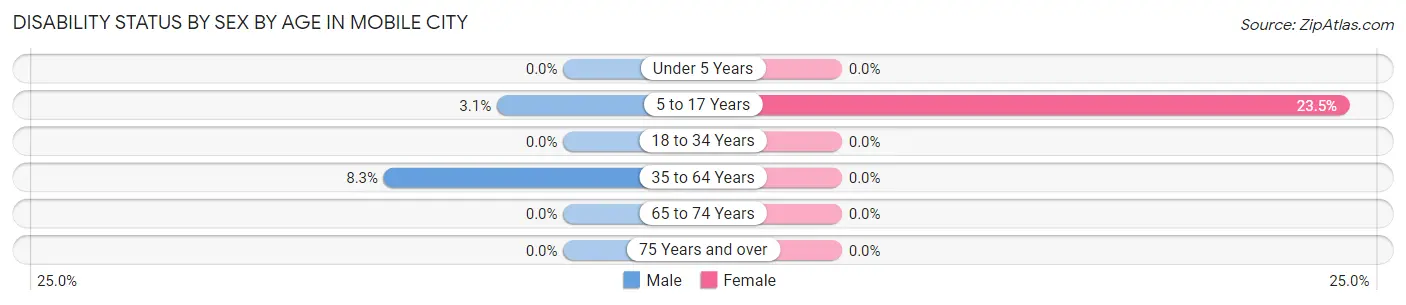
| Age Bracket | Male | Female |
| Under 5 Years | 0 (0.0%) | 0 (0.0%) |
| 5 to 17 Years | 2 (3.1%) | 4 (23.5%) |
| 18 to 34 Years | 0 (0.0%) | 0 (0.0%) |
| 35 to 64 Years | 2 (8.3%) | 0 (0.0%) |
| 65 to 74 Years | 0 (0.0%) | 0 (0.0%) |
| 75 Years and over | 0 (0.0%) | 0 (0.0%) |
Disability Class by Sex by Age in Mobile City
Disability Class: Hearing Difficulty
| Age Bracket | Male | Female |
| Under 5 Years | 0 (0.0%) | 0 (0.0%) |
| 5 to 17 Years | 0 (0.0%) | 0 (0.0%) |
| 18 to 34 Years | 0 (0.0%) | 0 (0.0%) |
| 35 to 64 Years | 0 (0.0%) | 0 (0.0%) |
| 65 to 74 Years | 0 (0.0%) | 0 (0.0%) |
| 75 Years and over | 0 (0.0%) | 0 (0.0%) |
Disability Class: Vision Difficulty
| Age Bracket | Male | Female |
| Under 5 Years | 0 (0.0%) | 0 (0.0%) |
| 5 to 17 Years | 0 (0.0%) | 0 (0.0%) |
| 18 to 34 Years | 0 (0.0%) | 0 (0.0%) |
| 35 to 64 Years | 0 (0.0%) | 0 (0.0%) |
| 65 to 74 Years | 0 (0.0%) | 0 (0.0%) |
| 75 Years and over | 0 (0.0%) | 0 (0.0%) |
Disability Class: Cognitive Difficulty
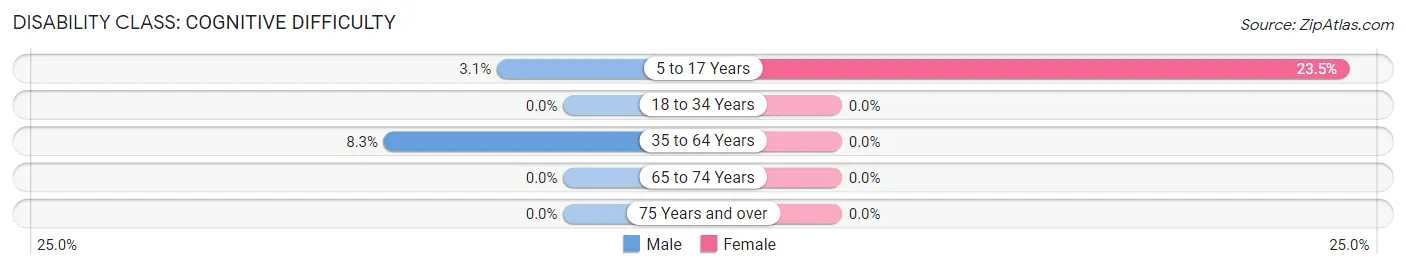
| Age Bracket | Male | Female |
| 5 to 17 Years | 2 (3.1%) | 4 (23.5%) |
| 18 to 34 Years | 0 (0.0%) | 0 (0.0%) |
| 35 to 64 Years | 2 (8.3%) | 0 (0.0%) |
| 65 to 74 Years | 0 (0.0%) | 0 (0.0%) |
| 75 Years and over | 0 (0.0%) | 0 (0.0%) |
Disability Class: Ambulatory Difficulty
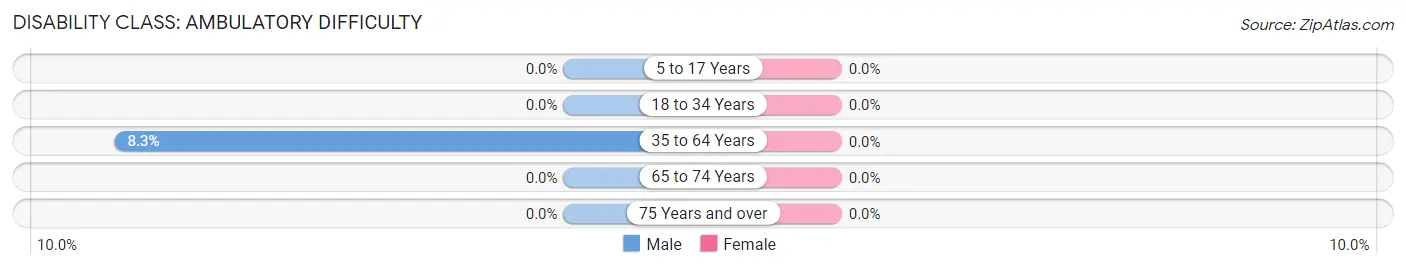
| Age Bracket | Male | Female |
| 5 to 17 Years | 0 (0.0%) | 0 (0.0%) |
| 18 to 34 Years | 0 (0.0%) | 0 (0.0%) |
| 35 to 64 Years | 2 (8.3%) | 0 (0.0%) |
| 65 to 74 Years | 0 (0.0%) | 0 (0.0%) |
| 75 Years and over | 0 (0.0%) | 0 (0.0%) |
Disability Class: Self-Care Difficulty
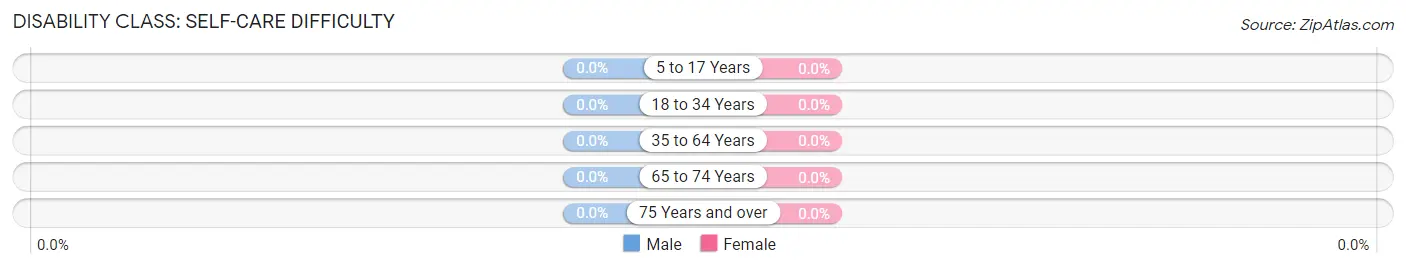
| Age Bracket | Male | Female |
| 5 to 17 Years | 0 (0.0%) | 0 (0.0%) |
| 18 to 34 Years | 0 (0.0%) | 0 (0.0%) |
| 35 to 64 Years | 0 (0.0%) | 0 (0.0%) |
| 65 to 74 Years | 0 (0.0%) | 0 (0.0%) |
| 75 Years and over | 0 (0.0%) | 0 (0.0%) |
Technology Access in Mobile City
Computing Device Access in Mobile City
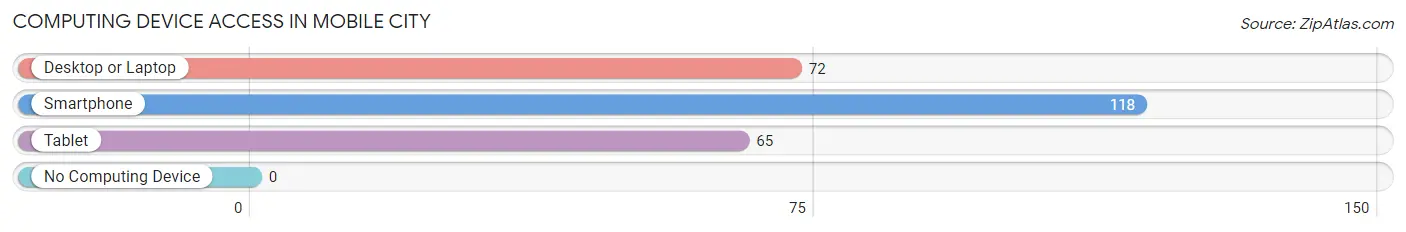
| Device Type | # Households | % Households |
| Desktop or Laptop | 72 | 61.0% |
| Smartphone | 118 | 100.0% |
| Tablet | 65 | 55.1% |
| No Computing Device | 0 | 0.0% |
| Total | 118 | 100.0% |
Internet Access in Mobile City
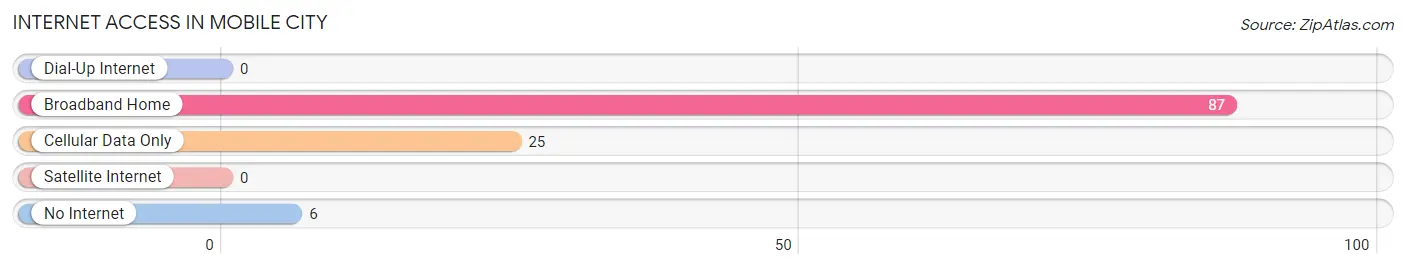
| Internet Type | # Households | % Households |
| Dial-Up Internet | 0 | 0.0% |
| Broadband Home | 87 | 73.7% |
| Cellular Data Only | 25 | 21.2% |
| Satellite Internet | 0 | 0.0% |
| No Internet | 6 | 5.1% |
| Total | 118 | 100.0% |
Mobile City Summary
City of Mobile Texas
Introduction
The City of Mobile, Texas is located in the southeastern corner of Texas, in the county of Nueces. It is a small city with a population of just over 5,000 people. The city is known for its rich history, diverse geography, and vibrant economy. This paper will explore the history, geography, economy, and demographics of Mobile, Texas in 2000 words.
History
The City of Mobile was founded in 1845 by a group of settlers from the Republic of Texas. The city was named after the Mobile Indians, who were the original inhabitants of the area. The city was originally a small farming community, but it quickly grew into a bustling port town. The port was used to transport goods from the Gulf of Mexico to the rest of the state.
In the late 19th century, the city experienced a period of rapid growth. This was due to the discovery of oil in the area, which led to an influx of new businesses and residents. The city also became a popular tourist destination, as it was close to the Gulf of Mexico and had a variety of attractions.
In the early 20th century, the city experienced a period of decline. This was due to the Great Depression and World War II, which caused many businesses to close and residents to leave. However, the city was able to recover and experienced a period of growth in the 1950s and 1960s.
Geography
The City of Mobile is located in the southeastern corner of Texas, in the county of Nueces. It is situated on the Gulf of Mexico, and is bordered by the cities of Corpus Christi and Port Aransas. The city is located on a flat coastal plain, and is surrounded by wetlands and marshlands. The climate is subtropical, with hot summers and mild winters.
The city is divided into four distinct neighborhoods: Downtown, Eastside, Westside, and Southside. Downtown is the commercial and cultural center of the city, and is home to many businesses, restaurants, and attractions. Eastside is a residential area, and is home to many single-family homes and apartment complexes. Westside is a predominantly industrial area, and is home to many factories and warehouses. Southside is a residential area, and is home to many single-family homes and apartment complexes.
Economy
The City of Mobile has a diverse economy, with a variety of industries. The city is home to many manufacturing companies, such as oil refineries, chemical plants, and food processing plants. The city is also home to many service-based businesses, such as restaurants, hotels, and retail stores. The city is also home to many government offices, such as the Nueces County Courthouse and the Mobile County Courthouse.
The city is also home to many educational institutions, such as the University of Texas at Corpus Christi and Texas A&M University-Corpus Christi. The city is also home to many healthcare facilities, such as the Corpus Christi Medical Center and the Driscoll Children’s Hospital.
Demographics
The City of Mobile has a population of just over 5,000 people. The population is predominantly Hispanic, with a large percentage of African-Americans and a small percentage of other ethnicities. The median age of the population is 33.5 years, and the median household income is $37,000.
Conclusion
The City of Mobile, Texas is a small city with a rich history, diverse geography, and vibrant economy. The city is home to many businesses, educational institutions, and healthcare facilities. The population is predominantly Hispanic, with a large percentage of African-Americans and a small percentage of other ethnicities. The median age of the population is 33.5 years, and the median household income is $37,000.
Common Questions
What is Per Capita Income in Mobile City?
Per Capita income in Mobile City is $16,629.
What is Family Income Deficit in Mobile City?
Family Income Deficit in Mobile City is $10,574.
Families that are below poverty line in Mobile City earn $10,574 less on average than the poverty threshold level.
What is Inequality or Gini Index in Mobile City?
Inequality or Gini Index in Mobile City is 0.37.
What is the Total Population of Mobile City?
Total Population of Mobile City is 277.
What is the Total Male Population of Mobile City?
Total Male Population of Mobile City is 109.
What is the Total Female Population of Mobile City?
Total Female Population of Mobile City is 168.
What is the Ratio of Males per 100 Females in Mobile City?
There are 64.88 Males per 100 Females in Mobile City.
What is the Ratio of Females per 100 Males in Mobile City?
There are 154.13 Females per 100 Males in Mobile City.
What is the Median Population Age in Mobile City?
Median Population Age in Mobile City is 22.4 Years.
What is the Average Family Size in Mobile City
Average Family Size in Mobile City is 2.4 People.
What is the Average Household Size in Mobile City
Average Household Size in Mobile City is 2.4 People.
How Large is the Labor Force in Mobile City?
There are 100 People in the Labor Forcein in Mobile City.
What is the Percentage of People in the Labor Force in Mobile City?
65.8% of People are in the Labor Force in Mobile City.
What is the Unemployment Rate in Mobile City?
Unemployment Rate in Mobile City is 1.0%.