India Hook, SC Map & Demographics
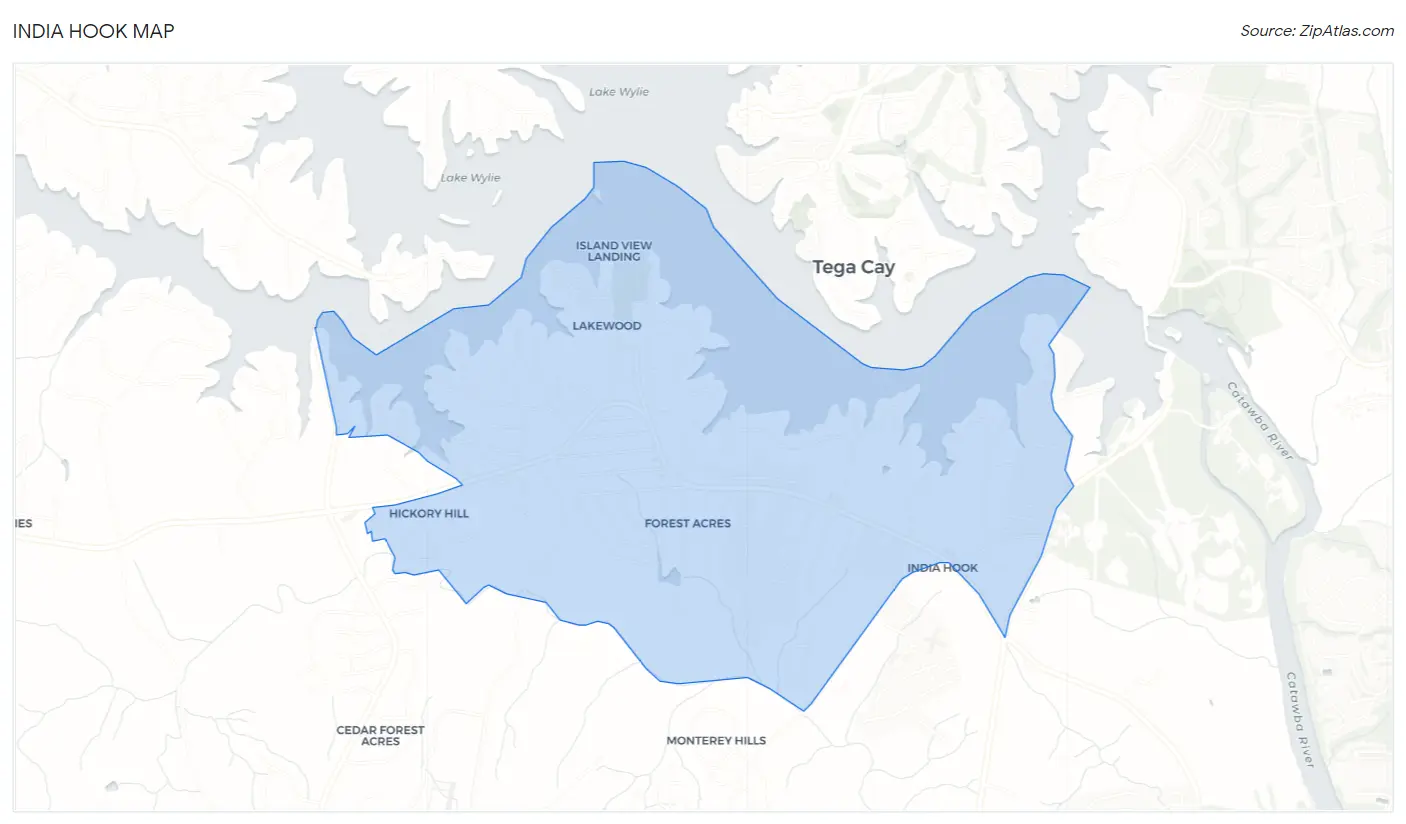
India Hook Map
India Hook Overview
$51,515
PER CAPITA INCOME
$115,962
AVG FAMILY INCOME
$101,616
AVG HOUSEHOLD INCOME
26.5%
WAGE / INCOME GAP [ % ]
73.5¢/ $1
WAGE / INCOME GAP [ $ ]
0.36
INEQUALITY / GINI INDEX
4,385
TOTAL POPULATION
2,007
MALE POPULATION
2,378
FEMALE POPULATION
84.40
MALES / 100 FEMALES
118.49
FEMALES / 100 MALES
39.0
MEDIAN AGE
2.7
AVG FAMILY SIZE
2.4
AVG HOUSEHOLD SIZE
2,705
LABOR FORCE [ PEOPLE ]
70.8%
PERCENT IN LABOR FORCE
5.3%
UNEMPLOYMENT RATE
Income in India Hook
Income Overview in India Hook
Per Capita Income in India Hook is $51,515, while median incomes of families and households are $115,962 and $101,616 respectively.
| Characteristic | Number | Measure |
| Per Capita Income | 4,385 | $51,515 |
| Median Family Income | 1,422 | $115,962 |
| Mean Family Income | 1,422 | $136,661 |
| Median Household Income | 1,852 | $101,616 |
| Mean Household Income | 1,852 | $120,518 |
| Income Deficit | 1,422 | $0 |
| Wage / Income Gap (%) | 4,385 | 26.54% |
| Wage / Income Gap ($) | 4,385 | 73.46¢ per $1 |
| Gini / Inequality Index | 4,385 | 0.36 |
Earnings by Sex in India Hook
Average Earnings in India Hook are $48,250, $55,798 for men and $40,992 for women, a difference of 26.5%.
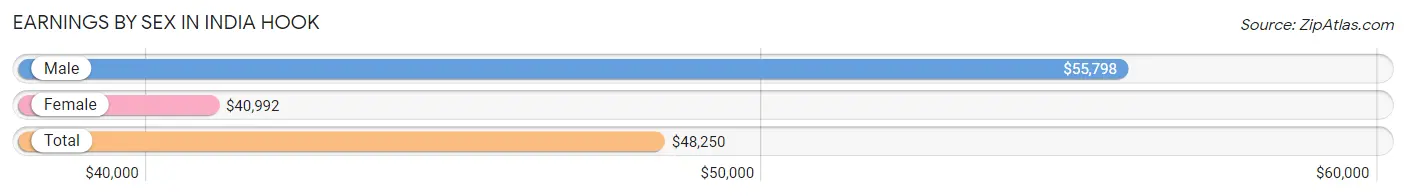
| Sex | Number | Average Earnings |
| Male | 1,371 (50.9%) | $55,798 |
| Female | 1,324 (49.1%) | $40,992 |
| Total | 2,695 (100.0%) | $48,250 |
Earnings by Sex by Income Bracket in India Hook
The most common earnings brackets in India Hook are $100,000+ for men (341 | 24.9%) and $75,000 to $99,999 for women (252 | 19.0%).
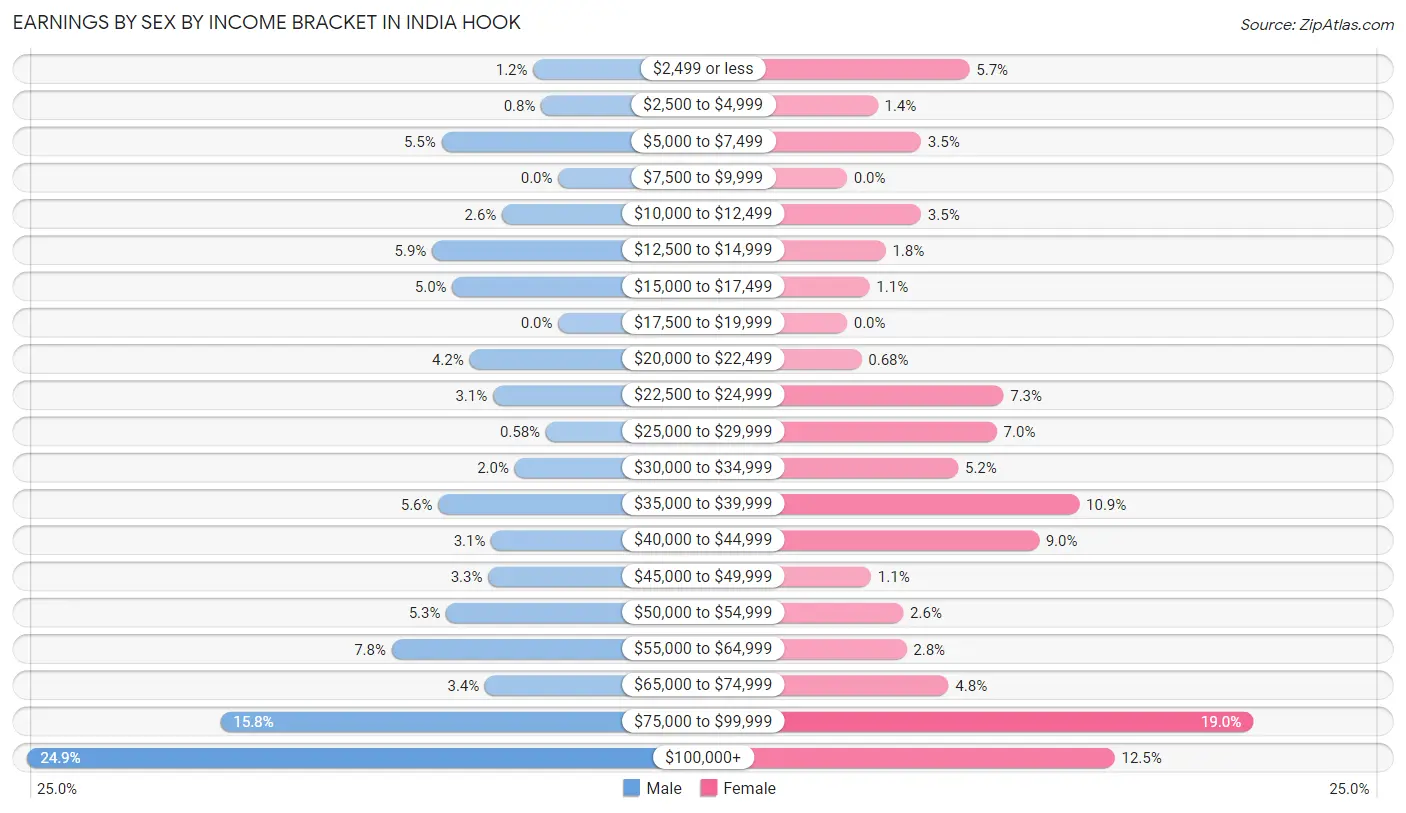
| Income | Male | Female |
| $2,499 or less | 16 (1.2%) | 76 (5.7%) |
| $2,500 to $4,999 | 11 (0.8%) | 19 (1.4%) |
| $5,000 to $7,499 | 75 (5.5%) | 46 (3.5%) |
| $7,500 to $9,999 | 0 (0.0%) | 0 (0.0%) |
| $10,000 to $12,499 | 36 (2.6%) | 46 (3.5%) |
| $12,500 to $14,999 | 81 (5.9%) | 24 (1.8%) |
| $15,000 to $17,499 | 68 (5.0%) | 14 (1.1%) |
| $17,500 to $19,999 | 0 (0.0%) | 0 (0.0%) |
| $20,000 to $22,499 | 57 (4.2%) | 9 (0.7%) |
| $22,500 to $24,999 | 42 (3.1%) | 97 (7.3%) |
| $25,000 to $29,999 | 8 (0.6%) | 93 (7.0%) |
| $30,000 to $34,999 | 28 (2.0%) | 69 (5.2%) |
| $35,000 to $39,999 | 77 (5.6%) | 144 (10.9%) |
| $40,000 to $44,999 | 43 (3.1%) | 119 (9.0%) |
| $45,000 to $49,999 | 45 (3.3%) | 15 (1.1%) |
| $50,000 to $54,999 | 72 (5.2%) | 35 (2.6%) |
| $55,000 to $64,999 | 107 (7.8%) | 37 (2.8%) |
| $65,000 to $74,999 | 47 (3.4%) | 63 (4.8%) |
| $75,000 to $99,999 | 217 (15.8%) | 252 (19.0%) |
| $100,000+ | 341 (24.9%) | 166 (12.5%) |
| Total | 1,371 (100.0%) | 1,324 (100.0%) |
Earnings by Sex by Educational Attainment in India Hook
Average earnings in India Hook are $61,071 for men and $43,884 for women, a difference of 28.1%. Men with an educational attainment of graduate degree enjoy the highest average annual earnings of $138,086, while those with college or associate's degree education earn the least with $50,769. Women with an educational attainment of bachelor's degree earn the most with the average annual earnings of $55,893, while those with high school diploma education have the smallest earnings of $24,566.
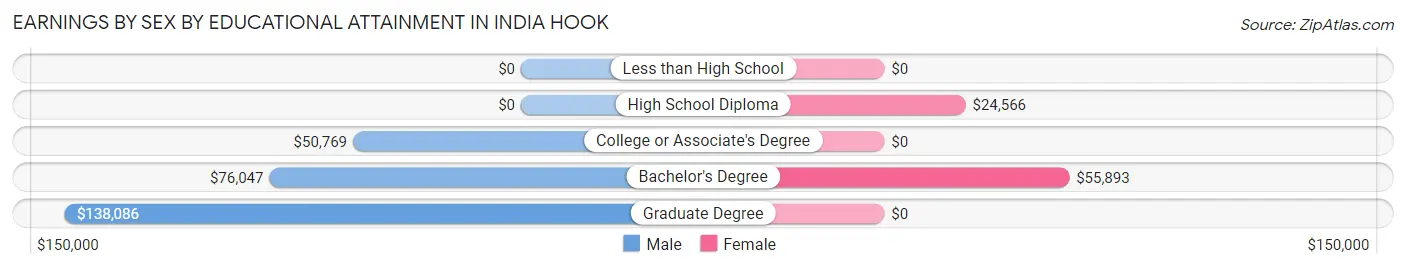
| Educational Attainment | Male Income | Female Income |
| Less than High School | - | - |
| High School Diploma | - | - |
| College or Associate's Degree | $50,769 | $0 |
| Bachelor's Degree | $76,047 | $55,893 |
| Graduate Degree | $138,086 | $0 |
| Total | $61,071 | $43,884 |
Family Income in India Hook
Family Income Brackets in India Hook
According to the India Hook family income data, there are 449 families falling into the $100,000 to $149,999 income range, which is the most common income bracket and makes up 31.6% of all families.
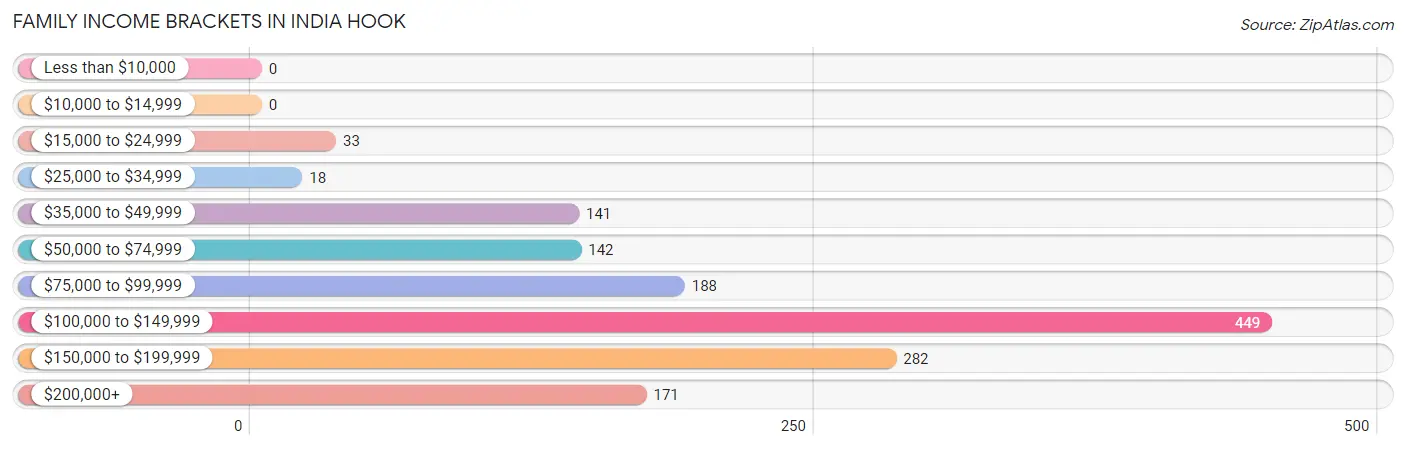
| Income Bracket | # Families | % Families |
| Less than $10,000 | 0 | 0.0% |
| $10,000 to $14,999 | 0 | 0.0% |
| $15,000 to $24,999 | 33 | 2.3% |
| $25,000 to $34,999 | 18 | 1.3% |
| $35,000 to $49,999 | 141 | 9.9% |
| $50,000 to $74,999 | 142 | 10.0% |
| $75,000 to $99,999 | 188 | 13.2% |
| $100,000 to $149,999 | 449 | 31.6% |
| $150,000 to $199,999 | 282 | 19.8% |
| $200,000+ | 171 | 12.0% |
Family Income by Famaliy Size in India Hook
5-person families (37 | 2.6%) account for the highest median family income in India Hook with $250,001 per family, while 5-person families (37 | 2.6%) have the highest median income of $50,000 per family member.
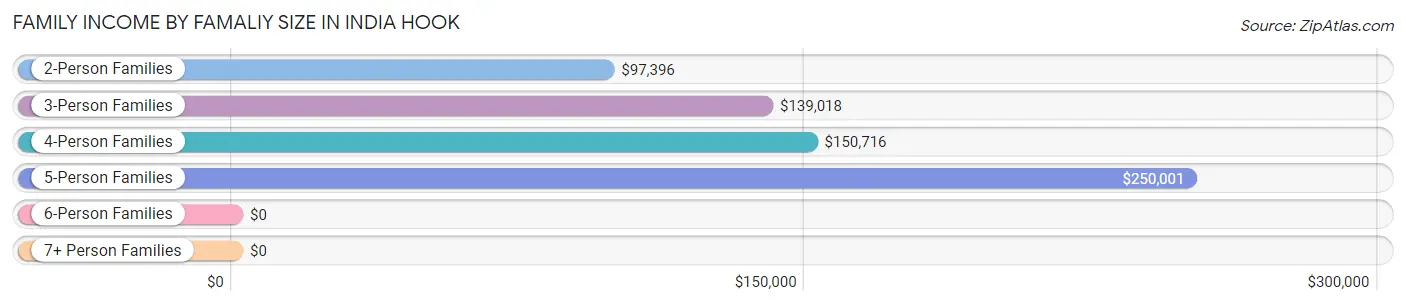
| Income Bracket | # Families | Median Income |
| 2-Person Families | 893 (62.8%) | $97,396 |
| 3-Person Families | 281 (19.8%) | $139,018 |
| 4-Person Families | 177 (12.4%) | $150,716 |
| 5-Person Families | 37 (2.6%) | $250,001 |
| 6-Person Families | 34 (2.4%) | $0 |
| 7+ Person Families | 0 (0.0%) | $0 |
| Total | 1,422 (100.0%) | $115,962 |
Family Income by Number of Earners in India Hook
The median family income in India Hook is $115,962, with families comprising 3+ earners (193) having the highest median family income of $160,092, while families with 1 earner (502) have the lowest median family income of $106,500, accounting for 13.6% and 35.3% of families, respectively.
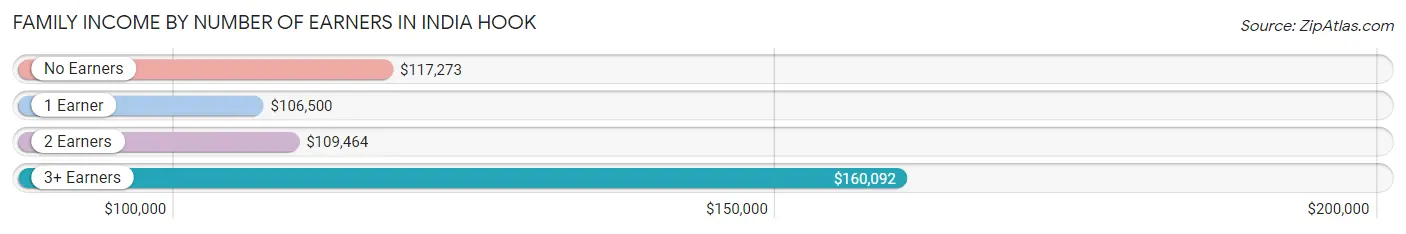
| Number of Earners | # Families | Median Income |
| No Earners | 150 (10.5%) | $117,273 |
| 1 Earner | 502 (35.3%) | $106,500 |
| 2 Earners | 577 (40.6%) | $109,464 |
| 3+ Earners | 193 (13.6%) | $160,092 |
| Total | 1,422 (100.0%) | $115,962 |
Household Income in India Hook
Household Income Brackets in India Hook
With 517 households falling in the category, the $100,000 to $149,999 income range is the most frequent in India Hook, accounting for 27.9% of all households.
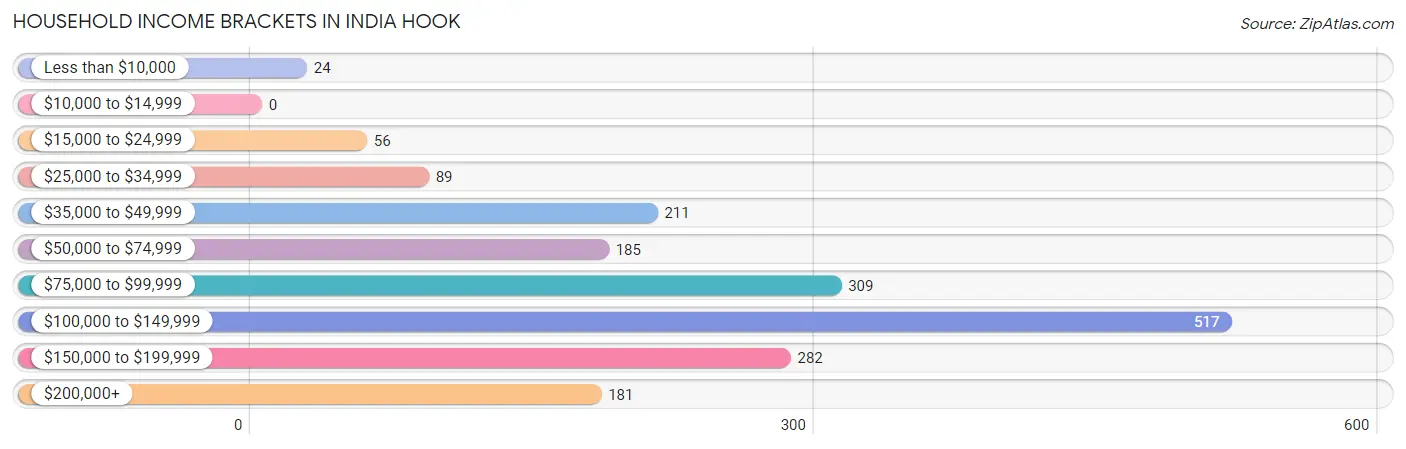
| Income Bracket | # Households | % Households |
| Less than $10,000 | 24 | 1.3% |
| $10,000 to $14,999 | 0 | 0.0% |
| $15,000 to $24,999 | 56 | 3.0% |
| $25,000 to $34,999 | 89 | 4.8% |
| $35,000 to $49,999 | 211 | 11.4% |
| $50,000 to $74,999 | 185 | 10.0% |
| $75,000 to $99,999 | 309 | 16.7% |
| $100,000 to $149,999 | 517 | 27.9% |
| $150,000 to $199,999 | 282 | 15.2% |
| $200,000+ | 181 | 9.8% |
Household Income by Householder Age in India Hook
The median household income in India Hook is $101,616, with the highest median household income of $114,643 found in the 45 to 64 years age bracket for the primary householder. A total of 686 households (37.0%) fall into this category.
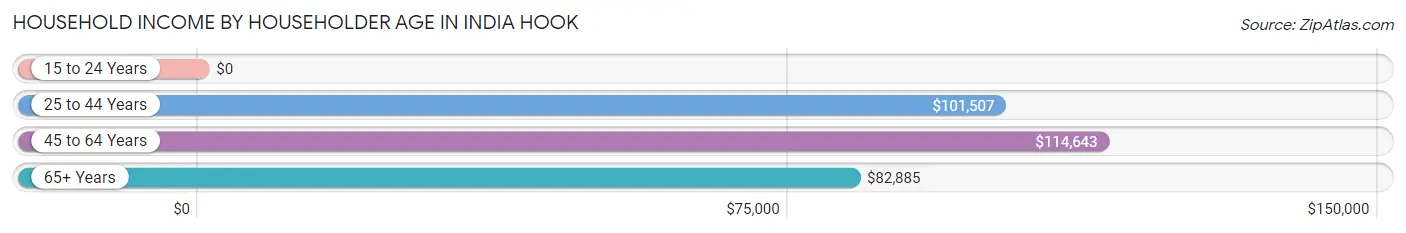
| Income Bracket | # Households | Median Income |
| 15 to 24 Years | 0 (0.0%) | $0 |
| 25 to 44 Years | 720 (38.9%) | $101,507 |
| 45 to 64 Years | 686 (37.0%) | $114,643 |
| 65+ Years | 446 (24.1%) | $82,885 |
| Total | 1,852 (100.0%) | $101,616 |
Poverty in India Hook
Income Below Poverty by Sex and Age in India Hook
With 1.4% poverty level for males and 3.0% for females among the residents of India Hook, 12 to 14 year old males and 12 to 14 year old females are the most vulnerable to poverty, with 13 males (6.5%) and 15 females (20.0%) in their respective age groups living below the poverty level.
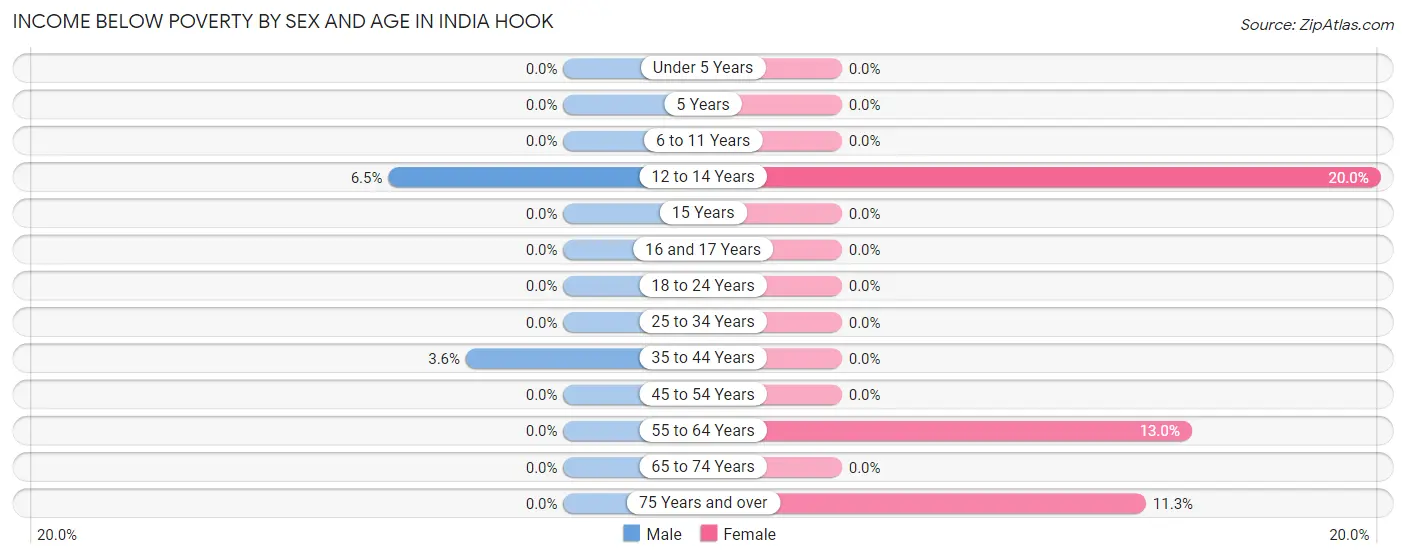
| Age Bracket | Male | Female |
| Under 5 Years | 0 (0.0%) | 0 (0.0%) |
| 5 Years | 0 (0.0%) | 0 (0.0%) |
| 6 to 11 Years | 0 (0.0%) | 0 (0.0%) |
| 12 to 14 Years | 13 (6.5%) | 15 (20.0%) |
| 15 Years | 0 (0.0%) | 0 (0.0%) |
| 16 and 17 Years | 0 (0.0%) | 0 (0.0%) |
| 18 to 24 Years | 0 (0.0%) | 0 (0.0%) |
| 25 to 34 Years | 0 (0.0%) | 0 (0.0%) |
| 35 to 44 Years | 16 (3.6%) | 0 (0.0%) |
| 45 to 54 Years | 0 (0.0%) | 0 (0.0%) |
| 55 to 64 Years | 0 (0.0%) | 43 (13.0%) |
| 65 to 74 Years | 0 (0.0%) | 0 (0.0%) |
| 75 Years and over | 0 (0.0%) | 14 (11.3%) |
| Total | 29 (1.4%) | 72 (3.0%) |
Income Above Poverty by Sex and Age in India Hook
According to the poverty statistics in India Hook, males aged under 5 years and females aged under 5 years are the age groups that are most secure financially, with 100.0% of males and 100.0% of females in these age groups living above the poverty line.
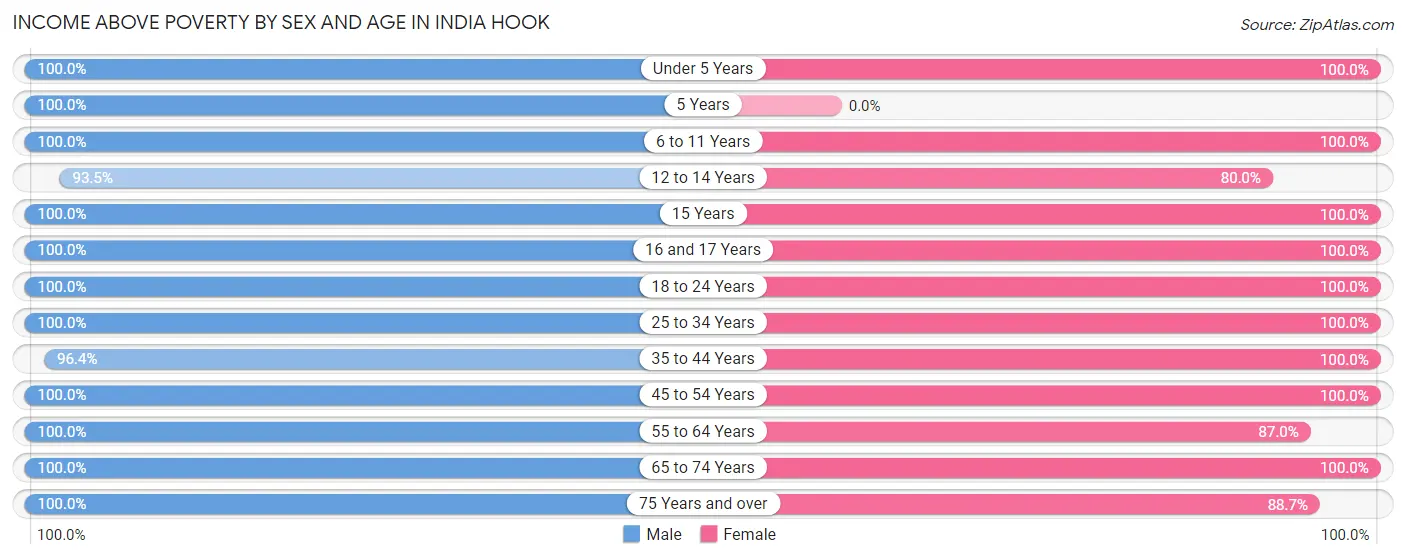
| Age Bracket | Male | Female |
| Under 5 Years | 13 (100.0%) | 132 (100.0%) |
| 5 Years | 28 (100.0%) | 0 (0.0%) |
| 6 to 11 Years | 35 (100.0%) | 56 (100.0%) |
| 12 to 14 Years | 187 (93.5%) | 60 (80.0%) |
| 15 Years | 18 (100.0%) | 8 (100.0%) |
| 16 and 17 Years | 10 (100.0%) | 238 (100.0%) |
| 18 to 24 Years | 125 (100.0%) | 134 (100.0%) |
| 25 to 34 Years | 278 (100.0%) | 386 (100.0%) |
| 35 to 44 Years | 426 (96.4%) | 446 (100.0%) |
| 45 to 54 Years | 149 (100.0%) | 252 (100.0%) |
| 55 to 64 Years | 389 (100.0%) | 288 (87.0%) |
| 65 to 74 Years | 257 (100.0%) | 196 (100.0%) |
| 75 Years and over | 63 (100.0%) | 110 (88.7%) |
| Total | 1,978 (98.6%) | 2,306 (97.0%) |
Income Below Poverty Among Married-Couple Families in India Hook
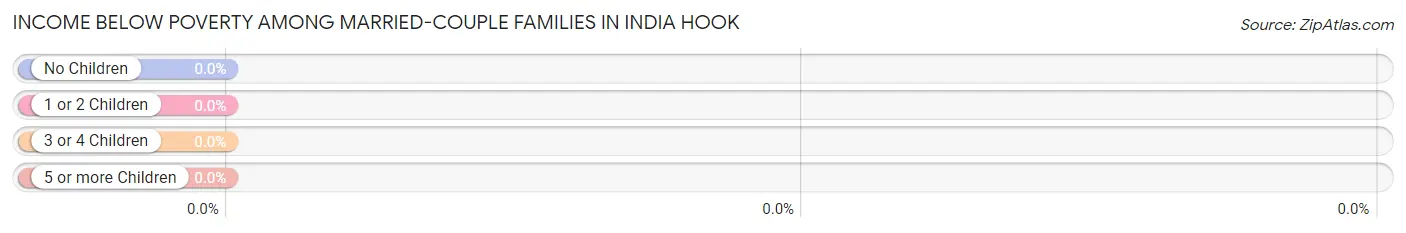
| Children | Above Poverty | Below Poverty |
| No Children | 763 (100.0%) | 0 (0.0%) |
| 1 or 2 Children | 244 (100.0%) | 0 (0.0%) |
| 3 or 4 Children | 50 (100.0%) | 0 (0.0%) |
| 5 or more Children | 0 (0.0%) | 0 (0.0%) |
| Total | 1,057 (100.0%) | 0 (0.0%) |
Income Below Poverty Among Single-Parent Households in India Hook
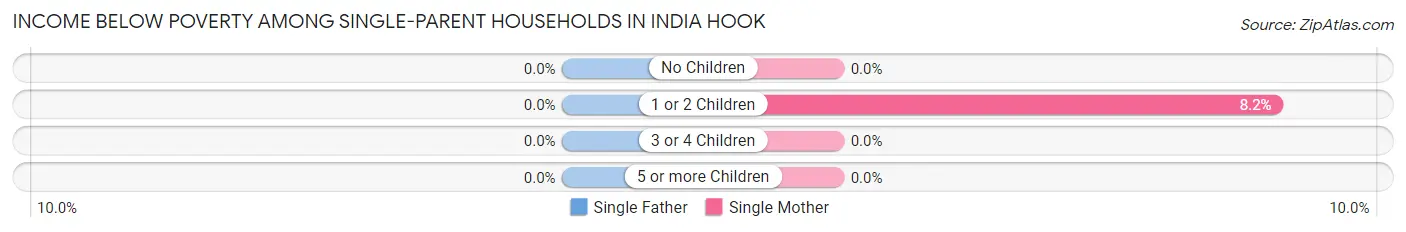
| Children | Single Father | Single Mother |
| No Children | 0 (0.0%) | 0 (0.0%) |
| 1 or 2 Children | 0 (0.0%) | 14 (8.2%) |
| 3 or 4 Children | 0 (0.0%) | 0 (0.0%) |
| 5 or more Children | 0 (0.0%) | 0 (0.0%) |
| Total | 0 (0.0%) | 14 (5.0%) |
Income Below Poverty Among Married-Couple vs Single-Parent Households in India Hook
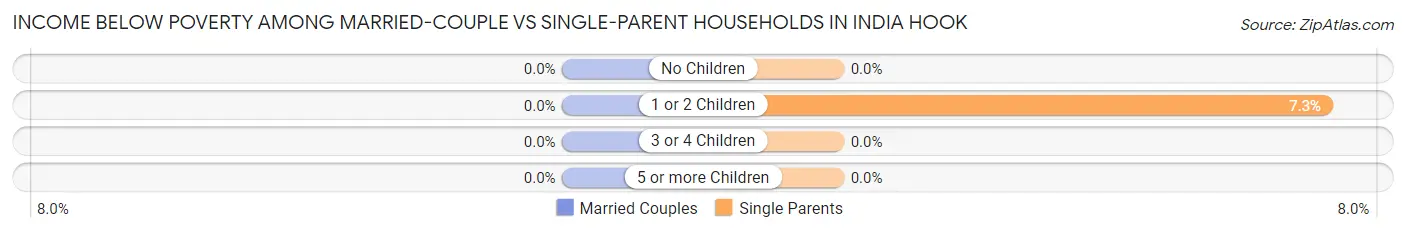
| Children | Married-Couple Families | Single-Parent Households |
| No Children | 0 (0.0%) | 0 (0.0%) |
| 1 or 2 Children | 0 (0.0%) | 14 (7.3%) |
| 3 or 4 Children | 0 (0.0%) | 0 (0.0%) |
| 5 or more Children | 0 (0.0%) | 0 (0.0%) |
| Total | 0 (0.0%) | 14 (3.8%) |
Race in India Hook
The most populous races in India Hook are White / Caucasian (3,605 | 82.2%), Black / African American (553 | 12.6%), and Hispanic or Latino (188 | 4.3%).
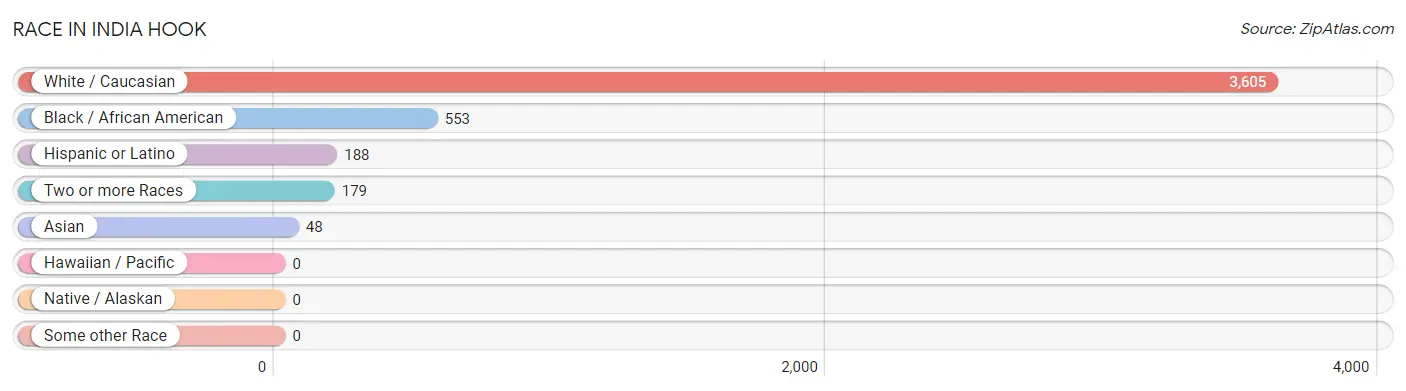
| Race | # Population | % Population |
| Asian | 48 | 1.1% |
| Black / African American | 553 | 12.6% |
| Hawaiian / Pacific | 0 | 0.0% |
| Hispanic or Latino | 188 | 4.3% |
| Native / Alaskan | 0 | 0.0% |
| White / Caucasian | 3,605 | 82.2% |
| Two or more Races | 179 | 4.1% |
| Some other Race | 0 | 0.0% |
| Total | 4,385 | 100.0% |
Ancestry in India Hook
The most populous ancestries reported in India Hook are American (853 | 19.5%), Irish (538 | 12.3%), German (518 | 11.8%), Scotch-Irish (327 | 7.5%), and English (305 | 7.0%), together accounting for 58.0% of all India Hook residents.
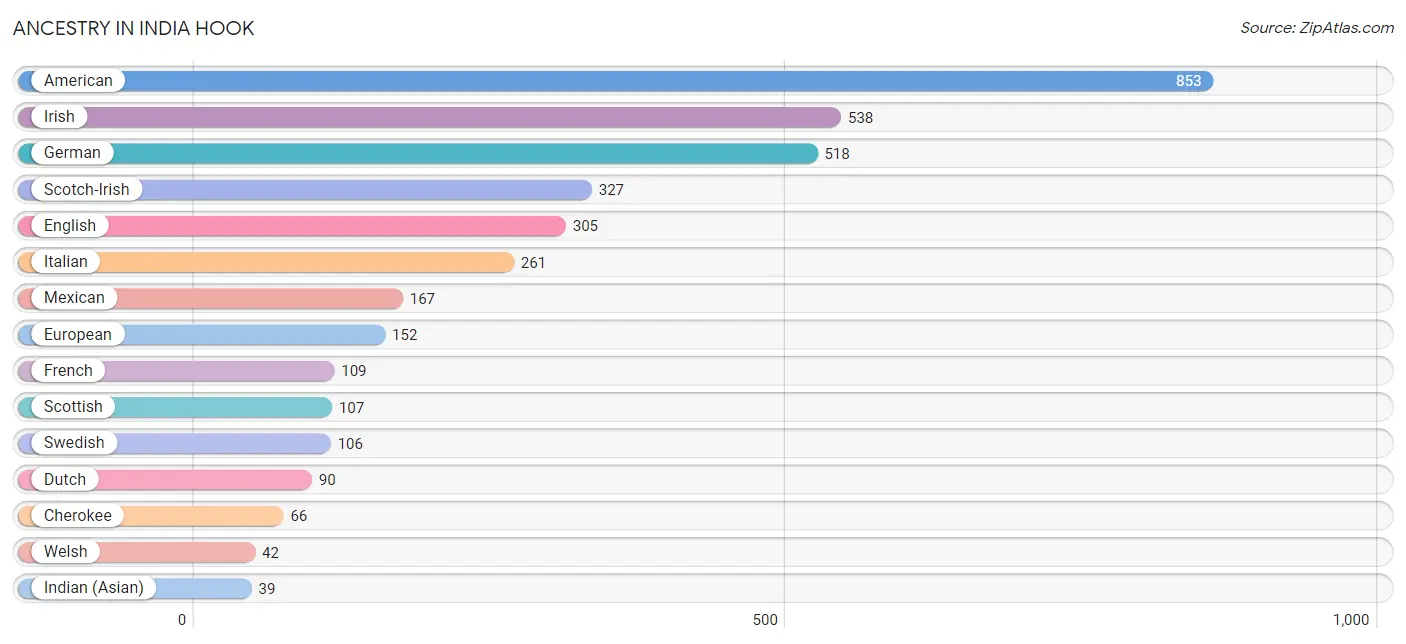
| Ancestry | # Population | % Population |
| American | 853 | 19.5% |
| Bhutanese | 9 | 0.2% |
| British | 18 | 0.4% |
| Central American | 13 | 0.3% |
| Cherokee | 66 | 1.5% |
| Dominican | 8 | 0.2% |
| Dutch | 90 | 2.1% |
| English | 305 | 7.0% |
| European | 152 | 3.5% |
| French | 109 | 2.5% |
| French Canadian | 13 | 0.3% |
| German | 518 | 11.8% |
| Hungarian | 18 | 0.4% |
| Indian (Asian) | 39 | 0.9% |
| Irish | 538 | 12.3% |
| Italian | 261 | 5.9% |
| Jamaican | 32 | 0.7% |
| Mexican | 167 | 3.8% |
| Norwegian | 13 | 0.3% |
| Panamanian | 13 | 0.3% |
| Polish | 24 | 0.5% |
| Portuguese | 20 | 0.5% |
| Scandinavian | 32 | 0.7% |
| Scotch-Irish | 327 | 7.5% |
| Scottish | 107 | 2.4% |
| Swedish | 106 | 2.4% |
| Welsh | 42 | 1.0% | View All 27 Rows |
Immigrants in India Hook
The most numerous immigrant groups reported in India Hook came from Latin America (58 | 1.3%), Asia (48 | 1.1%), Eastern Asia (48 | 1.1%), Caribbean (32 | 0.7%), and Jamaica (32 | 0.7%), together accounting for 5.0% of all India Hook residents.
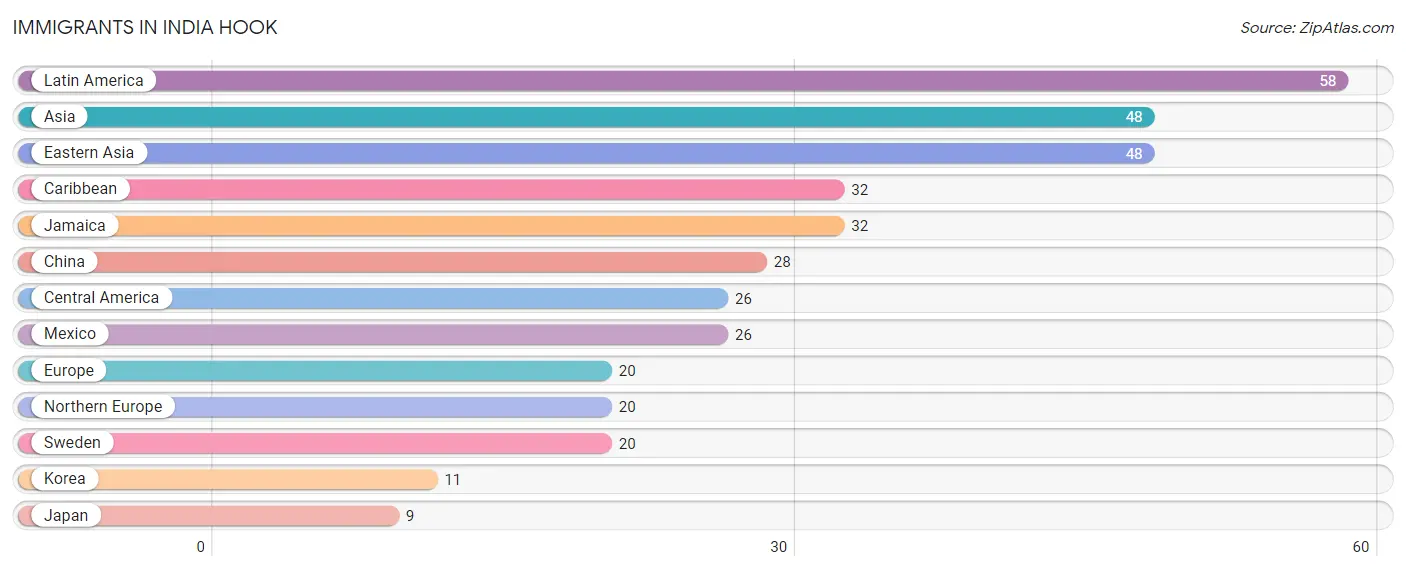
| Immigration Origin | # Population | % Population |
| Asia | 48 | 1.1% |
| Caribbean | 32 | 0.7% |
| Central America | 26 | 0.6% |
| China | 28 | 0.6% |
| Eastern Asia | 48 | 1.1% |
| Europe | 20 | 0.5% |
| Jamaica | 32 | 0.7% |
| Japan | 9 | 0.2% |
| Korea | 11 | 0.3% |
| Latin America | 58 | 1.3% |
| Mexico | 26 | 0.6% |
| Northern Europe | 20 | 0.5% |
| Sweden | 20 | 0.5% | View All 13 Rows |
Sex and Age in India Hook
Sex and Age in India Hook
The most populous age groups in India Hook are 35 to 39 Years (293 | 14.6%) for men and 35 to 39 Years (341 | 14.3%) for women.
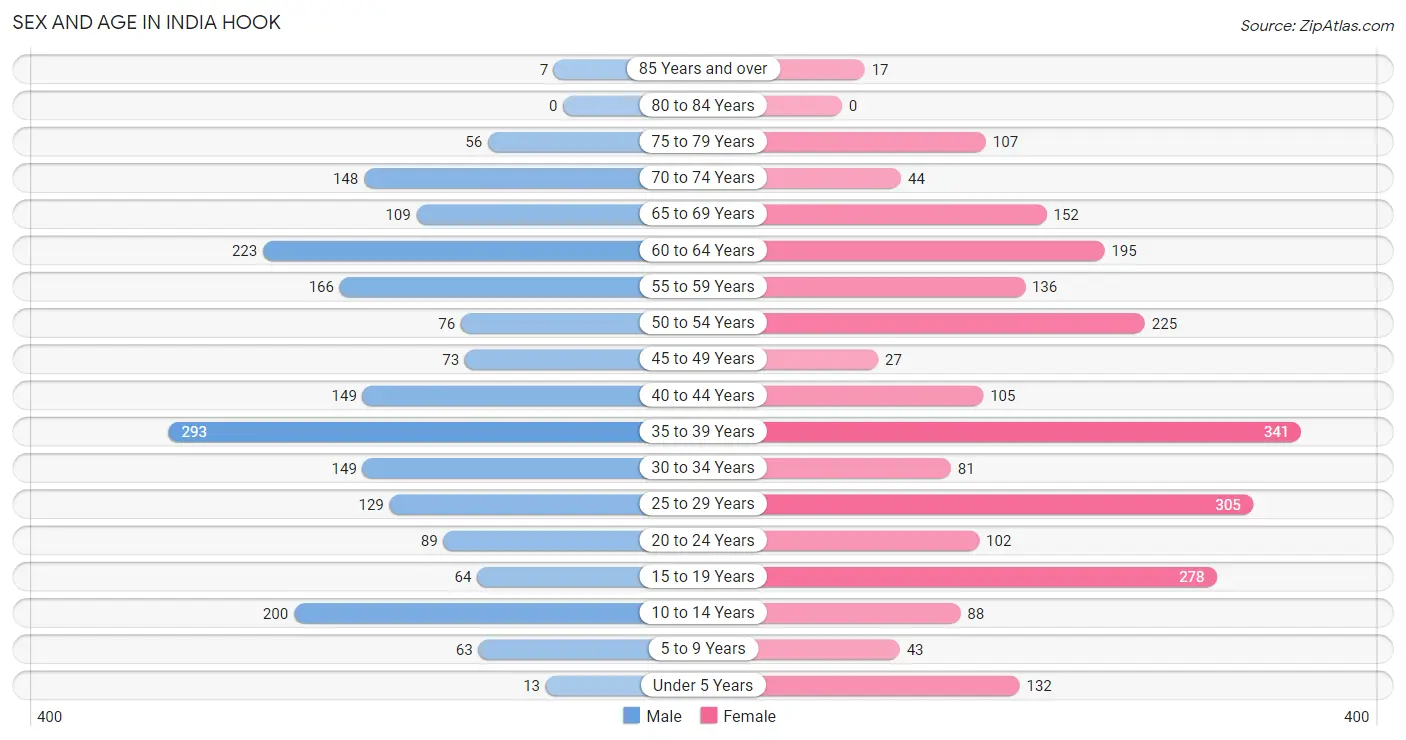
| Age Bracket | Male | Female |
| Under 5 Years | 13 (0.6%) | 132 (5.6%) |
| 5 to 9 Years | 63 (3.1%) | 43 (1.8%) |
| 10 to 14 Years | 200 (10.0%) | 88 (3.7%) |
| 15 to 19 Years | 64 (3.2%) | 278 (11.7%) |
| 20 to 24 Years | 89 (4.4%) | 102 (4.3%) |
| 25 to 29 Years | 129 (6.4%) | 305 (12.8%) |
| 30 to 34 Years | 149 (7.4%) | 81 (3.4%) |
| 35 to 39 Years | 293 (14.6%) | 341 (14.3%) |
| 40 to 44 Years | 149 (7.4%) | 105 (4.4%) |
| 45 to 49 Years | 73 (3.6%) | 27 (1.1%) |
| 50 to 54 Years | 76 (3.8%) | 225 (9.5%) |
| 55 to 59 Years | 166 (8.3%) | 136 (5.7%) |
| 60 to 64 Years | 223 (11.1%) | 195 (8.2%) |
| 65 to 69 Years | 109 (5.4%) | 152 (6.4%) |
| 70 to 74 Years | 148 (7.4%) | 44 (1.8%) |
| 75 to 79 Years | 56 (2.8%) | 107 (4.5%) |
| 80 to 84 Years | 0 (0.0%) | 0 (0.0%) |
| 85 Years and over | 7 (0.4%) | 17 (0.7%) |
| Total | 2,007 (100.0%) | 2,378 (100.0%) |
Families and Households in India Hook
Median Family Size in India Hook
The median family size in India Hook is 2.69 persons per family, with married-couple families (1,057 | 74.3%) accounting for the largest median family size of 2.78 persons per family. On the other hand, single male/father families (85 | 6.0%) represent the smallest median family size with 2.11 persons per family.
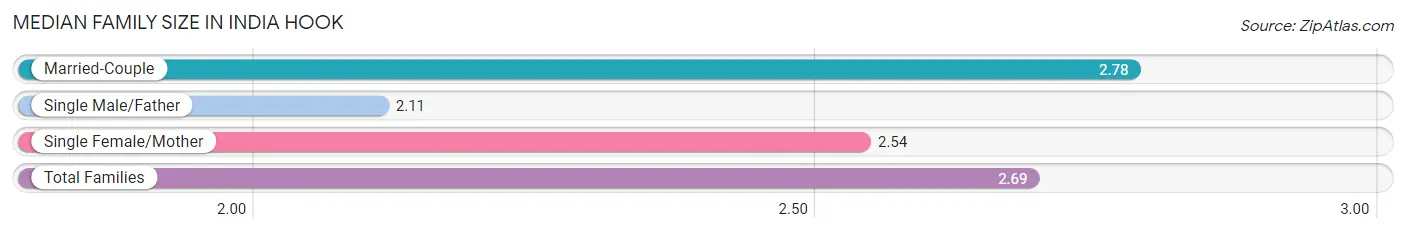
| Family Type | # Families | Family Size |
| Married-Couple | 1,057 (74.3%) | 2.78 |
| Single Male/Father | 85 (6.0%) | 2.11 |
| Single Female/Mother | 280 (19.7%) | 2.54 |
| Total Families | 1,422 (100.0%) | 2.69 |
Median Household Size in India Hook
The median household size in India Hook is 2.37 persons per household, with married-couple households (1,057 | 57.1%) accounting for the largest median household size of 2.78 persons per household. non-family households (430 | 23.2%) represent the smallest median household size with 1.20 persons per household.
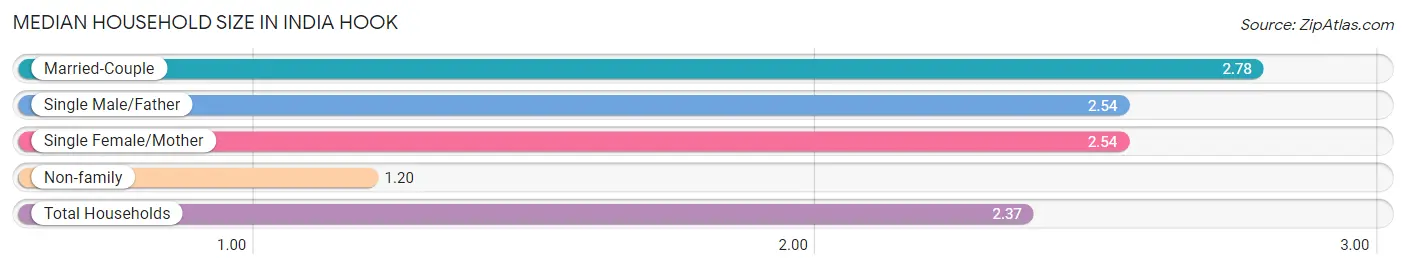
| Household Type | # Households | Household Size |
| Married-Couple | 1,057 (57.1%) | 2.78 |
| Single Male/Father | 85 (4.6%) | 2.54 |
| Single Female/Mother | 280 (15.1%) | 2.54 |
| Non-family | 430 (23.2%) | 1.20 |
| Total Households | 1,852 (100.0%) | 2.37 |
Household Size by Marriage Status in India Hook
Out of a total of 1,852 households in India Hook, 1,422 (76.8%) are family households, while 430 (23.2%) are nonfamily households. The most numerous type of family households are 2-person households, comprising 851, and the most common type of nonfamily households are 1-person households, comprising 351.
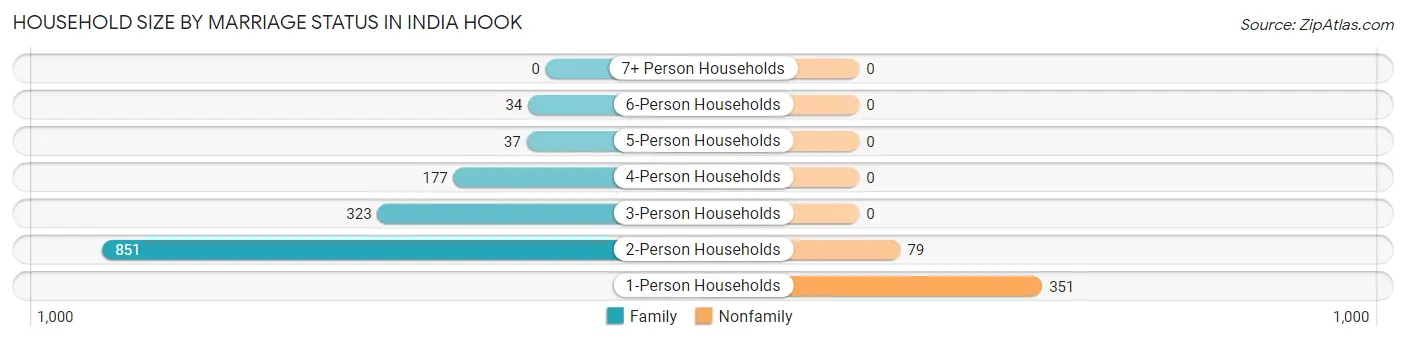
| Household Size | Family Households | Nonfamily Households |
| 1-Person Households | - | 351 (19.0%) |
| 2-Person Households | 851 (46.0%) | 79 (4.3%) |
| 3-Person Households | 323 (17.4%) | 0 (0.0%) |
| 4-Person Households | 177 (9.6%) | 0 (0.0%) |
| 5-Person Households | 37 (2.0%) | 0 (0.0%) |
| 6-Person Households | 34 (1.8%) | 0 (0.0%) |
| 7+ Person Households | 0 (0.0%) | 0 (0.0%) |
| Total | 1,422 (76.8%) | 430 (23.2%) |
Female Fertility in India Hook
Fertility by Age in India Hook
Average fertility rate in India Hook is 4.0 births per 1,000 women. Women in the age bracket of 20 to 34 years have the highest fertility rate with 10.0 births per 1,000 women. Women in the age bracket of 20 to 34 years acount for 100.0% of all women with births.
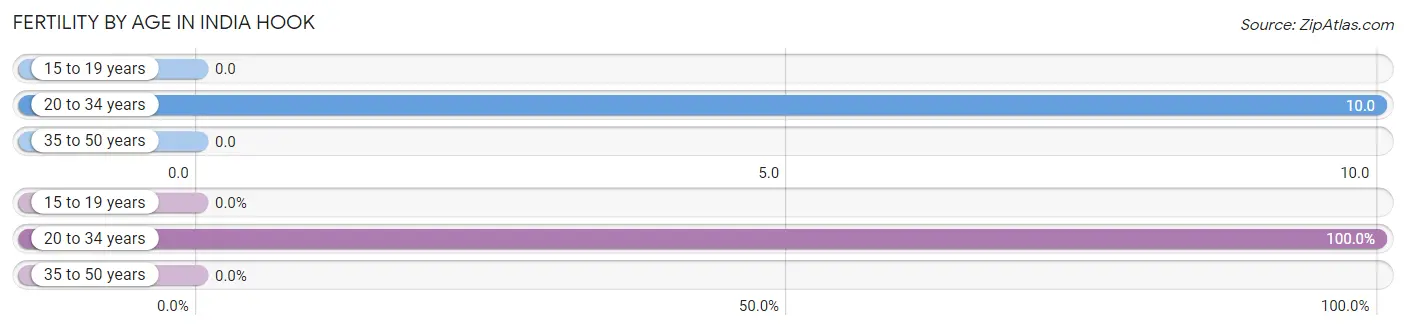
| Age Bracket | Women with Births | Births / 1,000 Women |
| 15 to 19 years | 0 (0.0%) | 0.0 |
| 20 to 34 years | 5 (100.0%) | 10.0 |
| 35 to 50 years | 0 (0.0%) | 0.0 |
| Total | 5 (100.0%) | 4.0 |
Fertility by Age by Marriage Status in India Hook
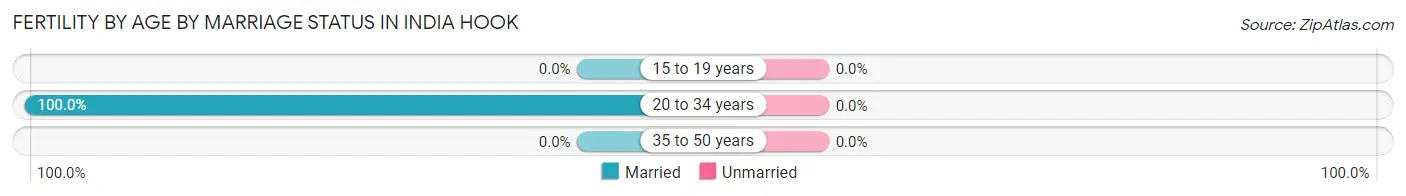
| Age Bracket | Married | Unmarried |
| 15 to 19 years | 0 (0.0%) | 0 (0.0%) |
| 20 to 34 years | 5 (100.0%) | 0 (0.0%) |
| 35 to 50 years | 0 (0.0%) | 0 (0.0%) |
| Total | 5 (100.0%) | 0 (0.0%) |
Fertility by Education in India Hook
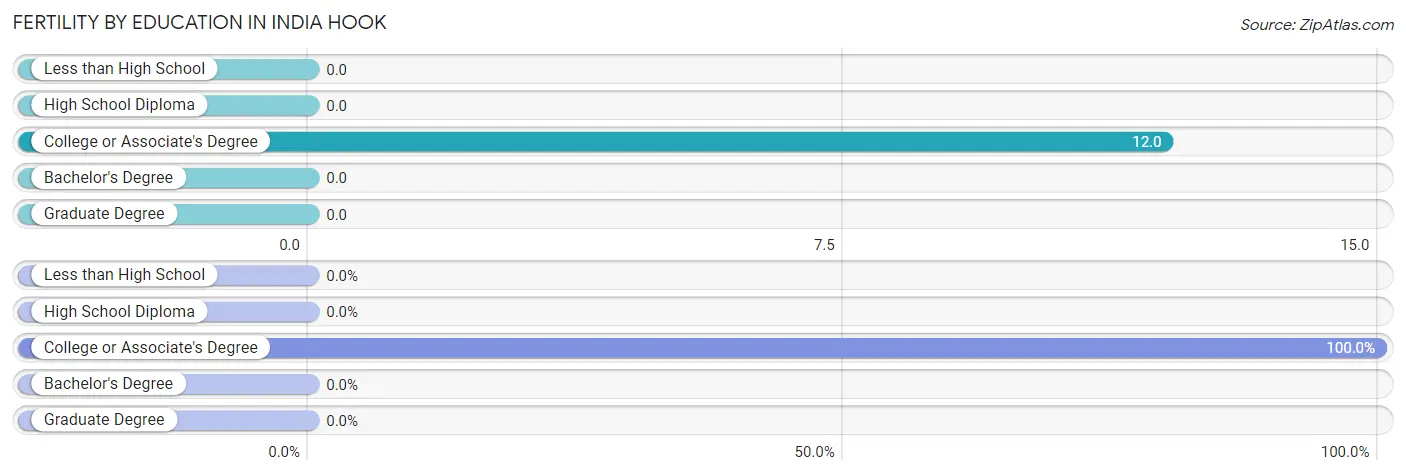
| Educational Attainment | Women with Births | Births / 1,000 Women |
| Less than High School | 0 (0.0%) | 0.0 |
| High School Diploma | 0 (0.0%) | 0.0 |
| College or Associate's Degree | 5 (100.0%) | 12.0 |
| Bachelor's Degree | 0 (0.0%) | 0.0 |
| Graduate Degree | 0 (0.0%) | 0.0 |
| Total | 5 (100.0%) | 4.0 |
Fertility by Education by Marriage Status in India Hook
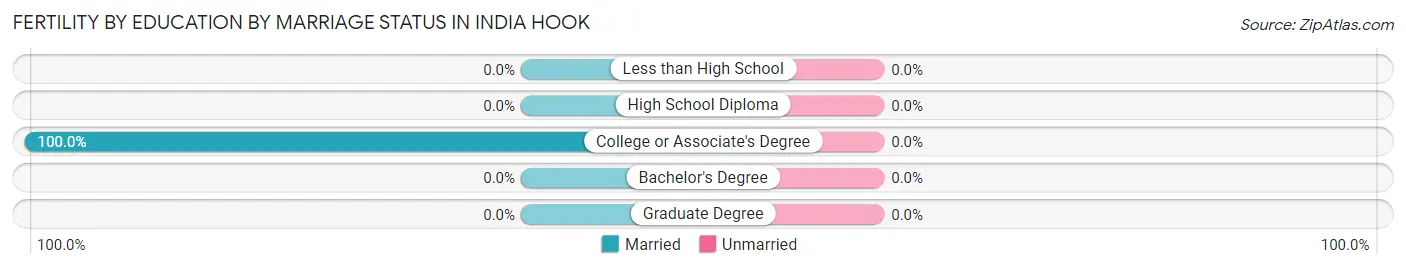
| Educational Attainment | Married | Unmarried |
| Less than High School | 0 (0.0%) | 0 (0.0%) |
| High School Diploma | 0 (0.0%) | 0 (0.0%) |
| College or Associate's Degree | 5 (100.0%) | 0 (0.0%) |
| Bachelor's Degree | 0 (0.0%) | 0 (0.0%) |
| Graduate Degree | 0 (0.0%) | 0 (0.0%) |
| Total | 5 (100.0%) | 0 (0.0%) |
Employment Characteristics in India Hook
Employment by Class of Employer in India Hook
Among the 2,538 employed individuals in India Hook, private company employees (1,913 | 75.4%), not-for-profit organizations (160 | 6.3%), and state government employees (142 | 5.6%) make up the most common classes of employment.
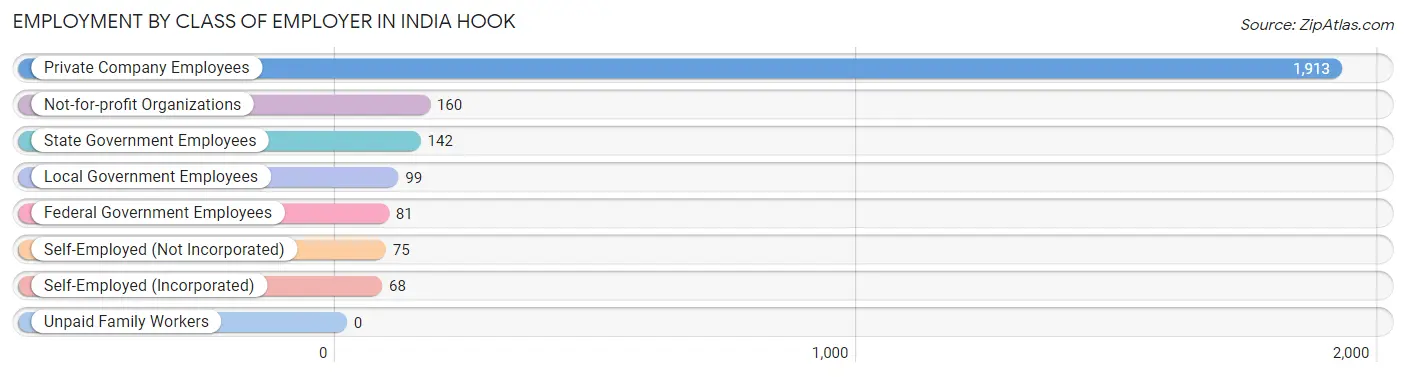
| Employer Class | # Employees | % Employees |
| Private Company Employees | 1,913 | 75.4% |
| Self-Employed (Incorporated) | 68 | 2.7% |
| Self-Employed (Not Incorporated) | 75 | 3.0% |
| Not-for-profit Organizations | 160 | 6.3% |
| Local Government Employees | 99 | 3.9% |
| State Government Employees | 142 | 5.6% |
| Federal Government Employees | 81 | 3.2% |
| Unpaid Family Workers | 0 | 0.0% |
| Total | 2,538 | 100.0% |
Employment Status by Age in India Hook
According to the labor force statistics for India Hook, out of the total population over 16 years of age (3,820), 70.8% or 2,705 individuals are in the labor force, with 5.3% or 143 of them unemployed. The age group with the highest labor force participation rate is 20 to 24 years, with 100.0% or 191 individuals in the labor force. Within the labor force, the 65 to 74 years age range has the highest percentage of unemployed individuals, with 30.3% or 70 of them being unemployed.
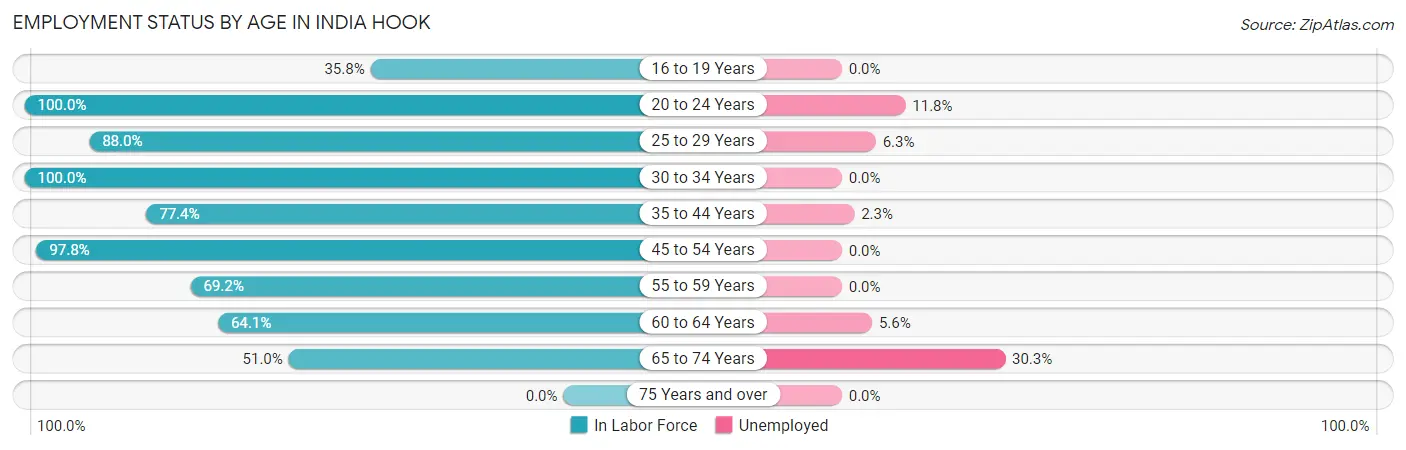
| Age Bracket | In Labor Force | Unemployed |
| 16 to 19 Years | 113 (35.8%) | 0 (0.0%) |
| 20 to 24 Years | 191 (100.0%) | 23 (11.8%) |
| 25 to 29 Years | 382 (88.0%) | 24 (6.3%) |
| 30 to 34 Years | 230 (100.0%) | 0 (0.0%) |
| 35 to 44 Years | 687 (77.4%) | 16 (2.3%) |
| 45 to 54 Years | 392 (97.8%) | 0 (0.0%) |
| 55 to 59 Years | 209 (69.2%) | 0 (0.0%) |
| 60 to 64 Years | 268 (64.1%) | 15 (5.6%) |
| 65 to 74 Years | 231 (51.0%) | 70 (30.3%) |
| 75 Years and over | 0 (0.0%) | 0 (0.0%) |
| Total | 2,705 (70.8%) | 143 (5.3%) |
Employment Status by Educational Attainment in India Hook
According to labor force statistics for India Hook, 81.1% of individuals (2,168) out of the total population between 25 and 64 years of age (2,673) are in the labor force, with 2.5% or 54 of them being unemployed. The group with the highest labor force participation rate are those with the educational attainment of college / associate degree, with 92.2% or 916 individuals in the labor force. Within the labor force, individuals with high school diploma education have the highest percentage of unemployment, with 12.0% or 24 of them being unemployed.
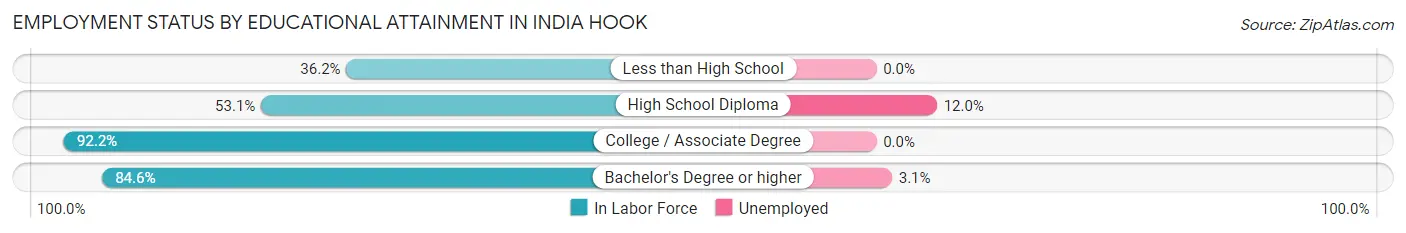
| Educational Attainment | In Labor Force | Unemployed |
| Less than High School | 38 (36.2%) | 0 (0.0%) |
| High School Diploma | 200 (53.1%) | 45 (12.0%) |
| College / Associate Degree | 916 (92.2%) | 0 (0.0%) |
| Bachelor's Degree or higher | 1,014 (84.6%) | 37 (3.1%) |
| Total | 2,168 (81.1%) | 67 (2.5%) |
Employment Occupations by Sex in India Hook
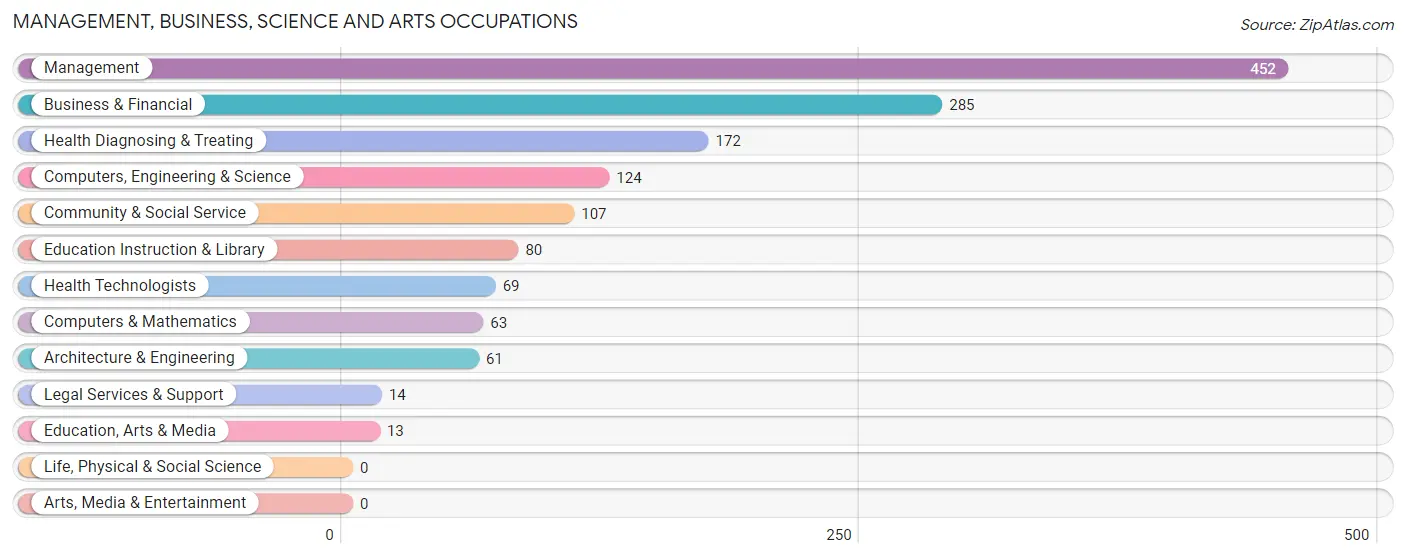
Management, Business, Science and Arts Occupations
The most common Management, Business, Science and Arts occupations in India Hook are Management (452 | 18.2%), Business & Financial (285 | 11.5%), Health Diagnosing & Treating (172 | 6.9%), Computers, Engineering & Science (124 | 5.0%), and Community & Social Service (107 | 4.3%).
Management, Business, Science and Arts Occupations by Sex
Within the Management, Business, Science and Arts occupations in India Hook, the most male-oriented occupations are Computers, Engineering & Science (100.0%), Computers & Mathematics (100.0%), and Architecture & Engineering (100.0%), while the most female-oriented occupations are Legal Services & Support (100.0%), Business & Financial (81.4%), and Education Instruction & Library (75.0%).
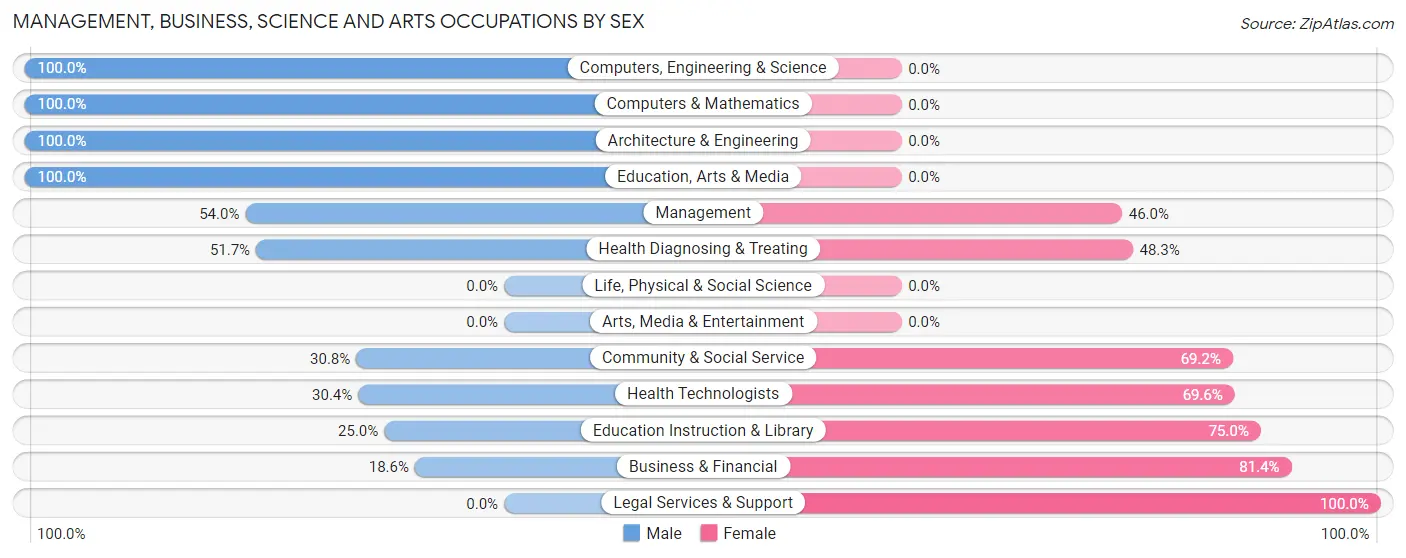
| Occupation | Male | Female |
| Management | 244 (54.0%) | 208 (46.0%) |
| Business & Financial | 53 (18.6%) | 232 (81.4%) |
| Computers, Engineering & Science | 124 (100.0%) | 0 (0.0%) |
| Computers & Mathematics | 63 (100.0%) | 0 (0.0%) |
| Architecture & Engineering | 61 (100.0%) | 0 (0.0%) |
| Life, Physical & Social Science | 0 (0.0%) | 0 (0.0%) |
| Community & Social Service | 33 (30.8%) | 74 (69.2%) |
| Education, Arts & Media | 13 (100.0%) | 0 (0.0%) |
| Legal Services & Support | 0 (0.0%) | 14 (100.0%) |
| Education Instruction & Library | 20 (25.0%) | 60 (75.0%) |
| Arts, Media & Entertainment | 0 (0.0%) | 0 (0.0%) |
| Health Diagnosing & Treating | 89 (51.7%) | 83 (48.3%) |
| Health Technologists | 21 (30.4%) | 48 (69.6%) |
| Total (Category) | 543 (47.6%) | 597 (52.4%) |
| Total (Overall) | 1,226 (49.4%) | 1,258 (50.6%) |
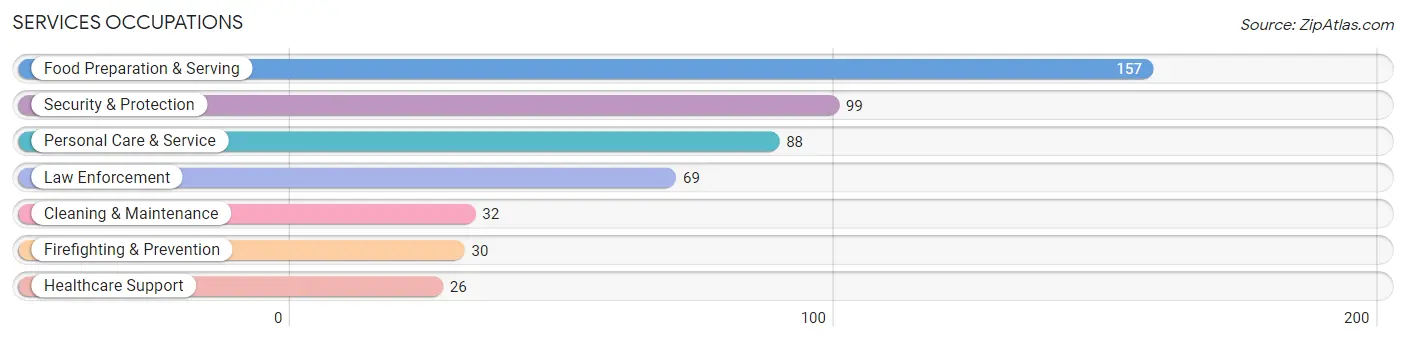
Services Occupations
The most common Services occupations in India Hook are Food Preparation & Serving (157 | 6.3%), Security & Protection (99 | 4.0%), Personal Care & Service (88 | 3.5%), Law Enforcement (69 | 2.8%), and Cleaning & Maintenance (32 | 1.3%).
Services Occupations by Sex
Within the Services occupations in India Hook, the most male-oriented occupations are Security & Protection (100.0%), Firefighting & Prevention (100.0%), and Law Enforcement (100.0%), while the most female-oriented occupations are Healthcare Support (100.0%), Personal Care & Service (65.9%), and Food Preparation & Serving (38.9%).
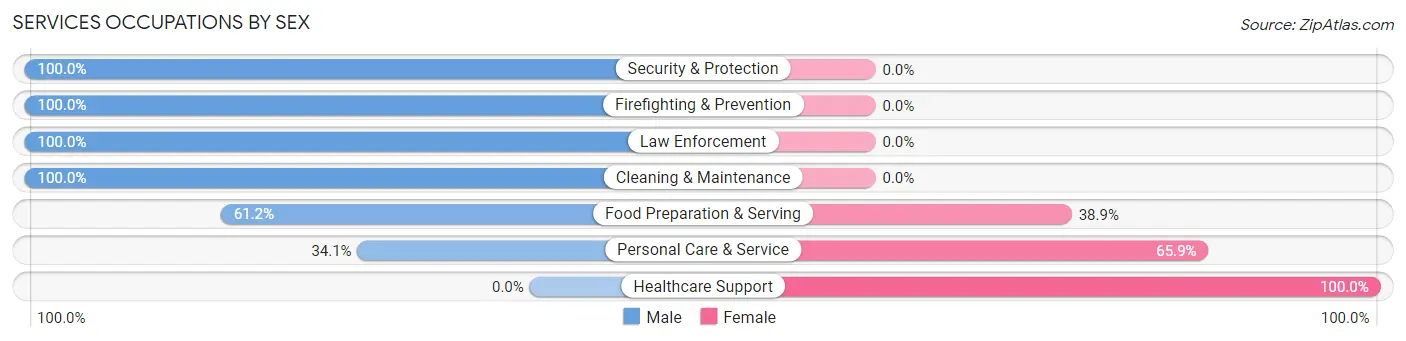
| Occupation | Male | Female |
| Healthcare Support | 0 (0.0%) | 26 (100.0%) |
| Security & Protection | 99 (100.0%) | 0 (0.0%) |
| Firefighting & Prevention | 30 (100.0%) | 0 (0.0%) |
| Law Enforcement | 69 (100.0%) | 0 (0.0%) |
| Food Preparation & Serving | 96 (61.2%) | 61 (38.9%) |
| Cleaning & Maintenance | 32 (100.0%) | 0 (0.0%) |
| Personal Care & Service | 30 (34.1%) | 58 (65.9%) |
| Total (Category) | 257 (63.9%) | 145 (36.1%) |
| Total (Overall) | 1,226 (49.4%) | 1,258 (50.6%) |
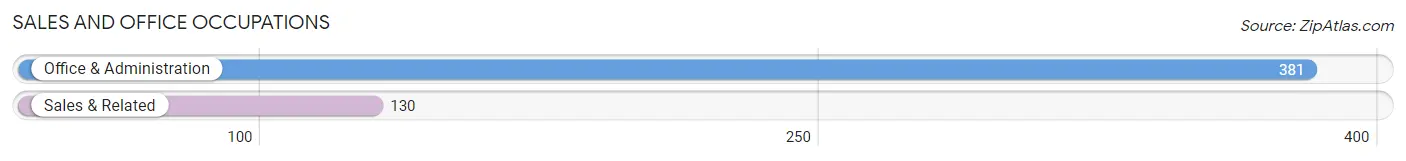
Sales and Office Occupations
The most common Sales and Office occupations in India Hook are Office & Administration (381 | 15.3%), and Sales & Related (130 | 5.2%).
Sales and Office Occupations by Sex
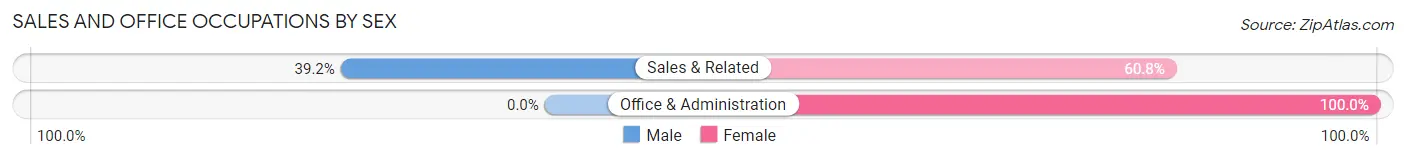
| Occupation | Male | Female |
| Sales & Related | 51 (39.2%) | 79 (60.8%) |
| Office & Administration | 0 (0.0%) | 381 (100.0%) |
| Total (Category) | 51 (10.0%) | 460 (90.0%) |
| Total (Overall) | 1,226 (49.4%) | 1,258 (50.6%) |
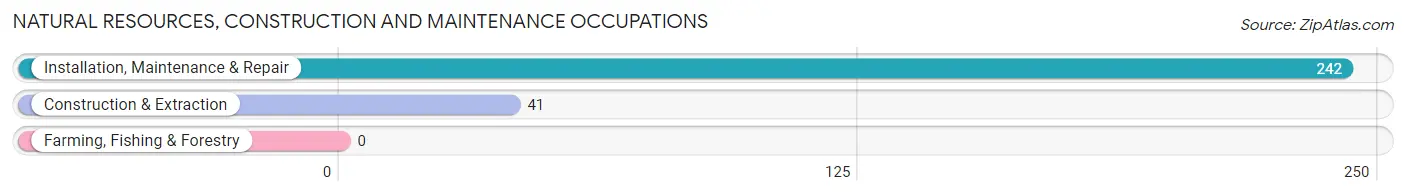
Natural Resources, Construction and Maintenance Occupations
The most common Natural Resources, Construction and Maintenance occupations in India Hook are Installation, Maintenance & Repair (242 | 9.7%), and Construction & Extraction (41 | 1.7%).
Natural Resources, Construction and Maintenance Occupations by Sex
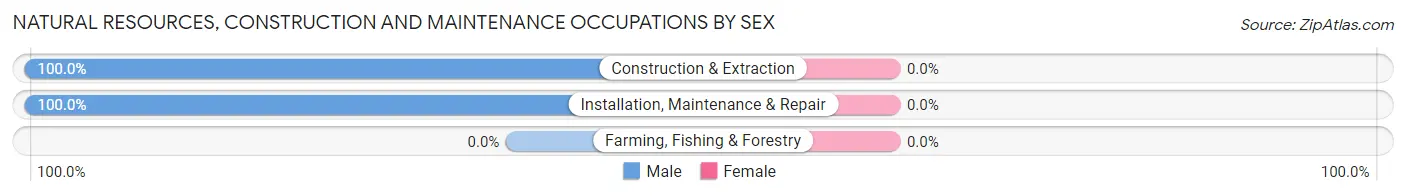
| Occupation | Male | Female |
| Farming, Fishing & Forestry | 0 (0.0%) | 0 (0.0%) |
| Construction & Extraction | 41 (100.0%) | 0 (0.0%) |
| Installation, Maintenance & Repair | 242 (100.0%) | 0 (0.0%) |
| Total (Category) | 283 (100.0%) | 0 (0.0%) |
| Total (Overall) | 1,226 (49.4%) | 1,258 (50.6%) |
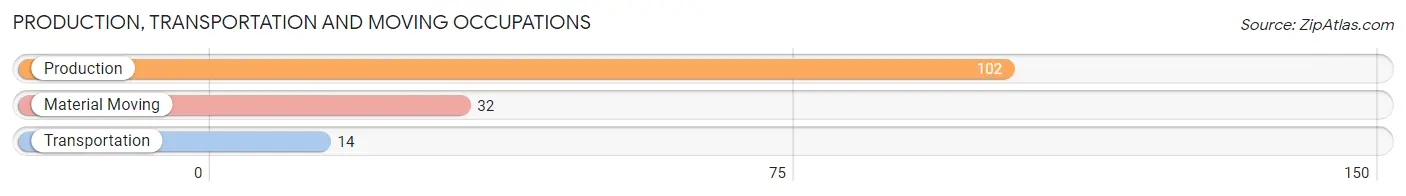
Production, Transportation and Moving Occupations
The most common Production, Transportation and Moving occupations in India Hook are Production (102 | 4.1%), Material Moving (32 | 1.3%), and Transportation (14 | 0.6%).
Production, Transportation and Moving Occupations by Sex
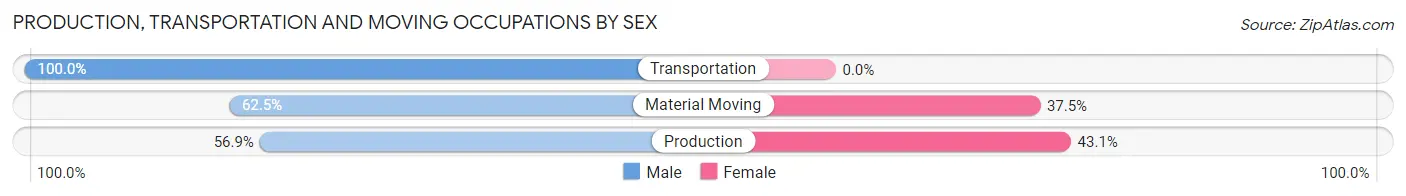
| Occupation | Male | Female |
| Production | 58 (56.9%) | 44 (43.1%) |
| Transportation | 14 (100.0%) | 0 (0.0%) |
| Material Moving | 20 (62.5%) | 12 (37.5%) |
| Total (Category) | 92 (62.2%) | 56 (37.8%) |
| Total (Overall) | 1,226 (49.4%) | 1,258 (50.6%) |
Employment Industries by Sex in India Hook
Employment Industries in India Hook
The major employment industries in India Hook include Manufacturing (558 | 22.5%), Health Care & Social Assistance (403 | 16.2%), Finance & Insurance (255 | 10.3%), Accommodation & Food Services (205 | 8.3%), and Information (170 | 6.8%).
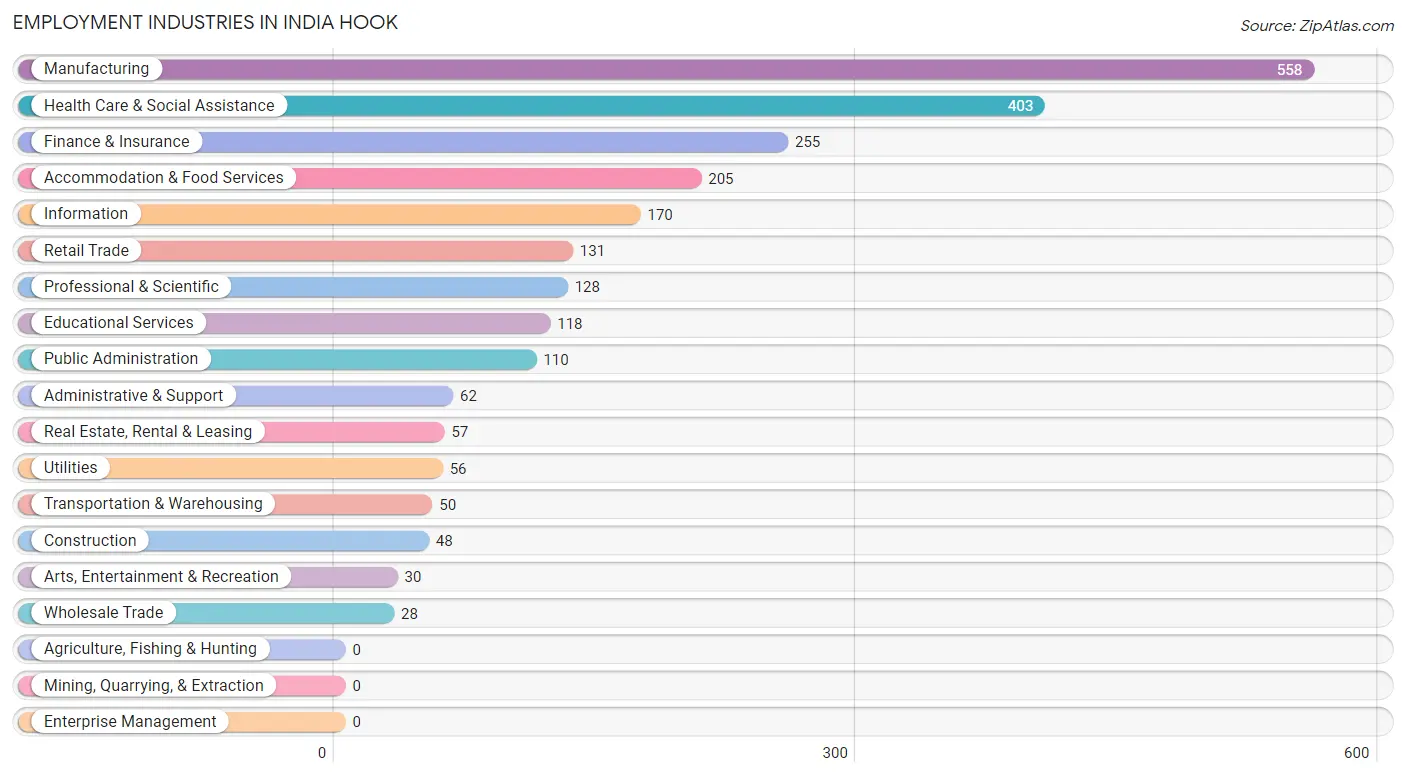
Employment Industries by Sex in India Hook
The India Hook industries that see more men than women are Construction (100.0%), Utilities (100.0%), and Arts, Entertainment & Recreation (100.0%), whereas the industries that tend to have a higher number of women are Administrative & Support (75.8%), Wholesale Trade (71.4%), and Finance & Insurance (70.6%).
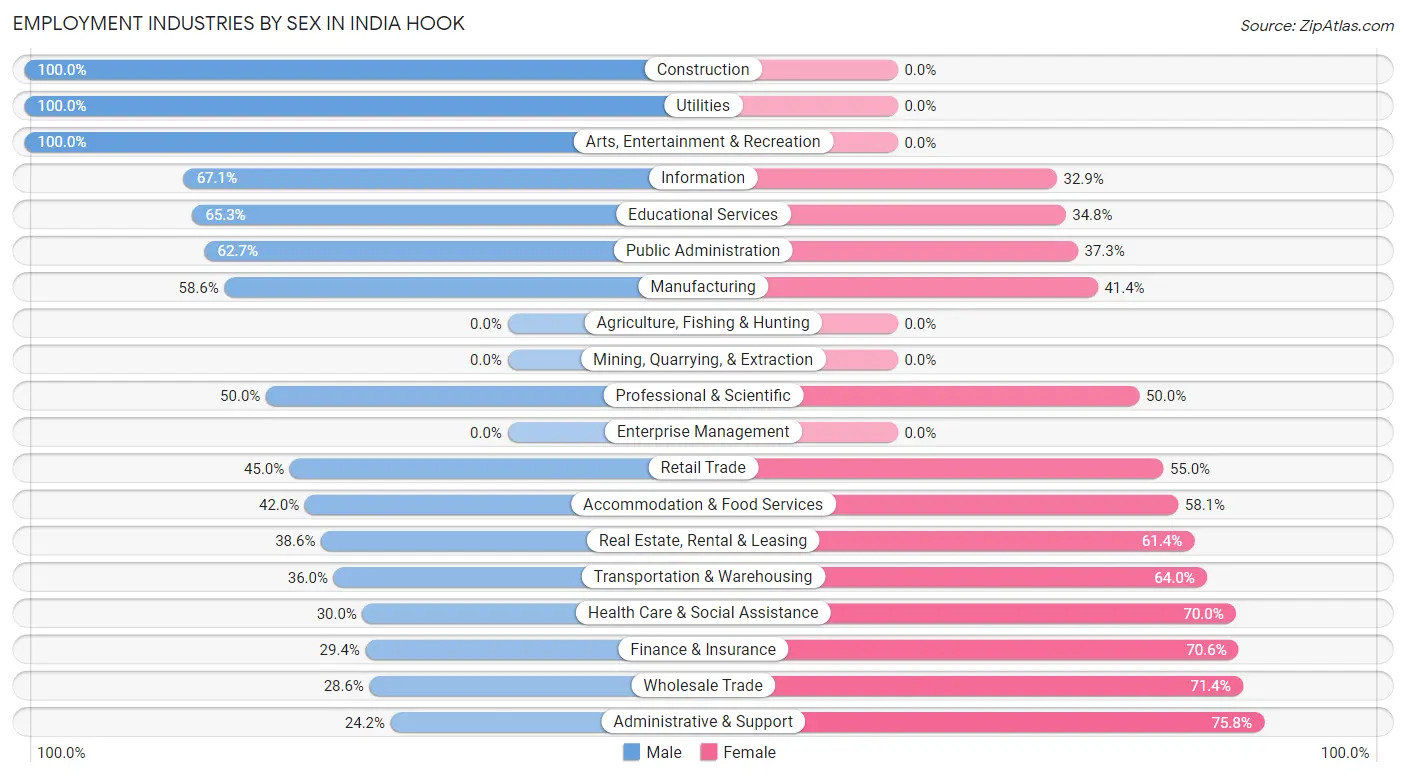
| Industry | Male | Female |
| Agriculture, Fishing & Hunting | 0 (0.0%) | 0 (0.0%) |
| Mining, Quarrying, & Extraction | 0 (0.0%) | 0 (0.0%) |
| Construction | 48 (100.0%) | 0 (0.0%) |
| Manufacturing | 327 (58.6%) | 231 (41.4%) |
| Wholesale Trade | 8 (28.6%) | 20 (71.4%) |
| Retail Trade | 59 (45.0%) | 72 (55.0%) |
| Transportation & Warehousing | 18 (36.0%) | 32 (64.0%) |
| Utilities | 56 (100.0%) | 0 (0.0%) |
| Information | 114 (67.1%) | 56 (32.9%) |
| Finance & Insurance | 75 (29.4%) | 180 (70.6%) |
| Real Estate, Rental & Leasing | 22 (38.6%) | 35 (61.4%) |
| Professional & Scientific | 64 (50.0%) | 64 (50.0%) |
| Enterprise Management | 0 (0.0%) | 0 (0.0%) |
| Administrative & Support | 15 (24.2%) | 47 (75.8%) |
| Educational Services | 77 (65.2%) | 41 (34.7%) |
| Health Care & Social Assistance | 121 (30.0%) | 282 (70.0%) |
| Arts, Entertainment & Recreation | 30 (100.0%) | 0 (0.0%) |
| Accommodation & Food Services | 86 (41.9%) | 119 (58.1%) |
| Public Administration | 69 (62.7%) | 41 (37.3%) |
| Total | 1,226 (49.4%) | 1,258 (50.6%) |
Education in India Hook
School Enrollment in India Hook
The most common levels of schooling among the 870 students in India Hook are high school (371 | 42.6%), middle school (249 | 28.6%), and nursery / preschool (92 | 10.6%).
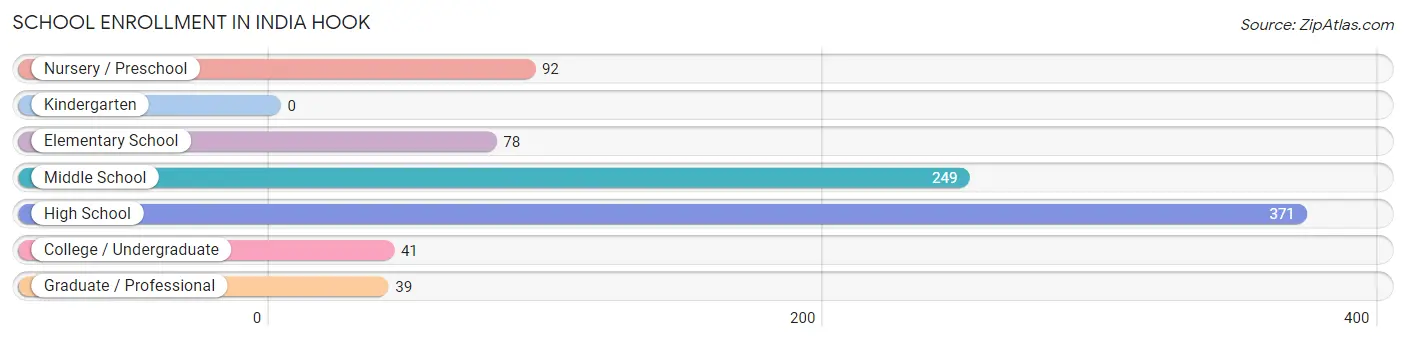
| School Level | # Students | % Students |
| Nursery / Preschool | 92 | 10.6% |
| Kindergarten | 0 | 0.0% |
| Elementary School | 78 | 9.0% |
| Middle School | 249 | 28.6% |
| High School | 371 | 42.6% |
| College / Undergraduate | 41 | 4.7% |
| Graduate / Professional | 39 | 4.5% |
| Total | 870 | 100.0% |
School Enrollment by Age by Funding Source in India Hook
Out of a total of 870 students who are enrolled in schools in India Hook, 367 (42.2%) attend a private institution, while the remaining 503 (57.8%) are enrolled in public schools. The age group of 3 to 4 year olds has the highest likelihood of being enrolled in private schools, with 64 (100.0% in the age bracket) enrolled. Conversely, the age group of 18 to 19 year olds has the lowest likelihood of being enrolled in a private school, with 36 (100.0% in the age bracket) attending a public institution.
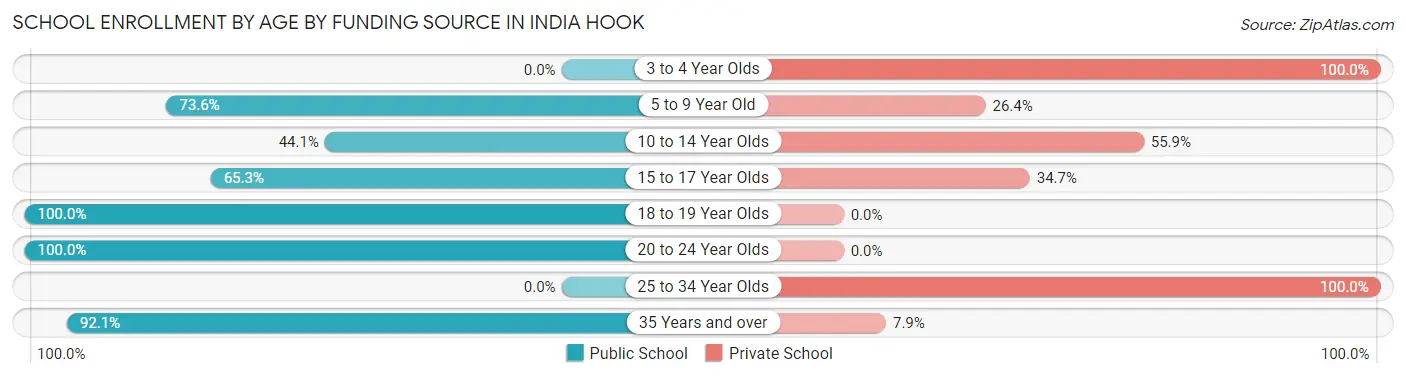
| Age Bracket | Public School | Private School |
| 3 to 4 Year Olds | 0 (0.0%) | 64 (100.0%) |
| 5 to 9 Year Old | 78 (73.6%) | 28 (26.4%) |
| 10 to 14 Year Olds | 127 (44.1%) | 161 (55.9%) |
| 15 to 17 Year Olds | 179 (65.3%) | 95 (34.7%) |
| 18 to 19 Year Olds | 36 (100.0%) | 0 (0.0%) |
| 20 to 24 Year Olds | 13 (100.0%) | 0 (0.0%) |
| 25 to 34 Year Olds | 0 (0.0%) | 13 (100.0%) |
| 35 Years and over | 70 (92.1%) | 6 (7.9%) |
| Total | 503 (57.8%) | 367 (42.2%) |
Educational Attainment by Field of Study in India Hook
Business (329 | 21.6%), science & technology (240 | 15.8%), engineering (194 | 12.8%), education (168 | 11.1%), and arts & humanities (127 | 8.4%) are the most common fields of study among 1,520 individuals in India Hook who have obtained a bachelor's degree or higher.
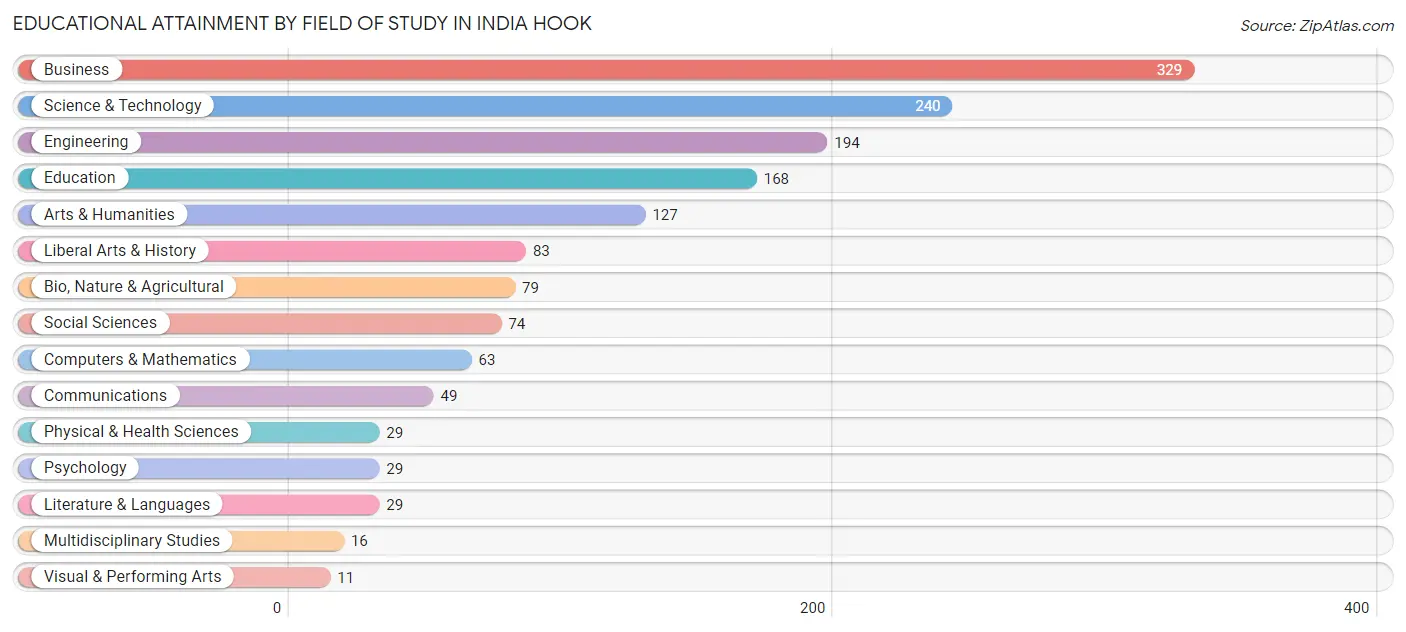
| Field of Study | # Graduates | % Graduates |
| Computers & Mathematics | 63 | 4.1% |
| Bio, Nature & Agricultural | 79 | 5.2% |
| Physical & Health Sciences | 29 | 1.9% |
| Psychology | 29 | 1.9% |
| Social Sciences | 74 | 4.9% |
| Engineering | 194 | 12.8% |
| Multidisciplinary Studies | 16 | 1.1% |
| Science & Technology | 240 | 15.8% |
| Business | 329 | 21.6% |
| Education | 168 | 11.1% |
| Literature & Languages | 29 | 1.9% |
| Liberal Arts & History | 83 | 5.5% |
| Visual & Performing Arts | 11 | 0.7% |
| Communications | 49 | 3.2% |
| Arts & Humanities | 127 | 8.4% |
| Total | 1,520 | 100.0% |
Transportation & Commute in India Hook
Vehicle Availability by Sex in India Hook
The most prevalent vehicle ownership categories in India Hook are males with 3 vehicles (601, accounting for 46.7%) and females with 3 vehicles (402, making up 48.0%).
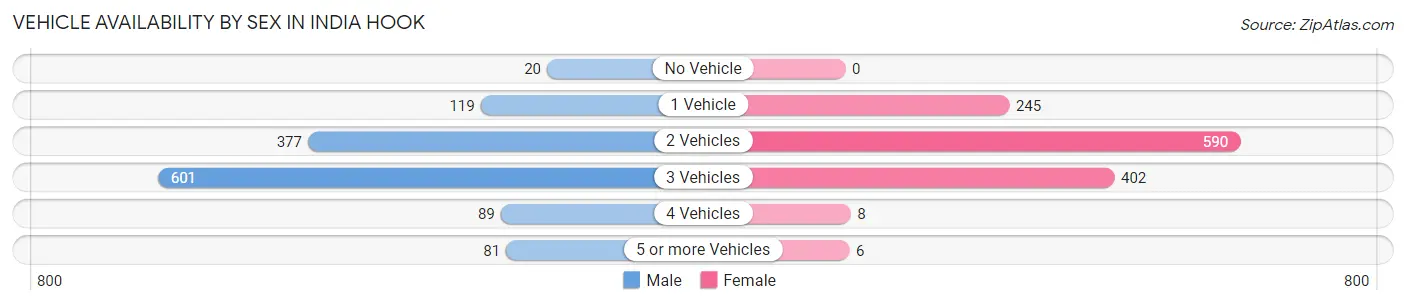
| Vehicles Available | Male | Female |
| No Vehicle | 20 (1.5%) | 0 (0.0%) |
| 1 Vehicle | 119 (9.2%) | 245 (19.6%) |
| 2 Vehicles | 377 (29.3%) | 590 (47.2%) |
| 3 Vehicles | 601 (46.7%) | 402 (32.1%) |
| 4 Vehicles | 89 (6.9%) | 8 (0.6%) |
| 5 or more Vehicles | 81 (6.3%) | 6 (0.5%) |
| Total | 1,287 (100.0%) | 1,251 (100.0%) |
Commute Time in India Hook
The most frequently occuring commute durations in India Hook are 20 to 24 minutes (617 commuters, 28.0%), 15 to 19 minutes (347 commuters, 15.7%), and 25 to 29 minutes (310 commuters, 14.1%).
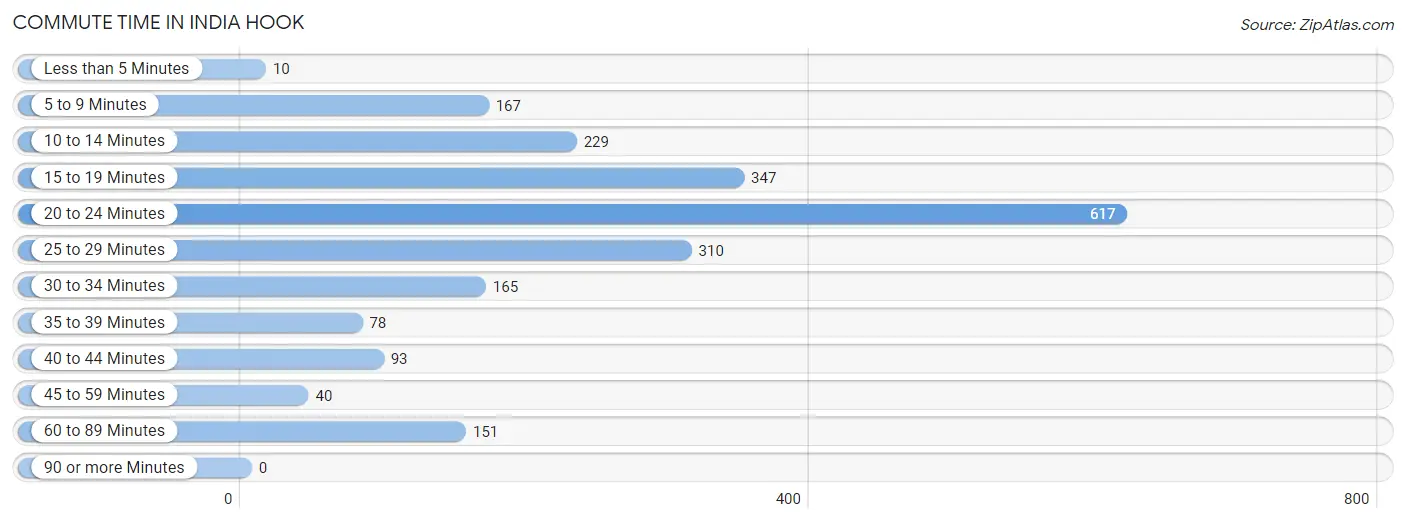
| Commute Time | # Commuters | % Commuters |
| Less than 5 Minutes | 10 | 0.4% |
| 5 to 9 Minutes | 167 | 7.6% |
| 10 to 14 Minutes | 229 | 10.4% |
| 15 to 19 Minutes | 347 | 15.7% |
| 20 to 24 Minutes | 617 | 28.0% |
| 25 to 29 Minutes | 310 | 14.1% |
| 30 to 34 Minutes | 165 | 7.5% |
| 35 to 39 Minutes | 78 | 3.5% |
| 40 to 44 Minutes | 93 | 4.2% |
| 45 to 59 Minutes | 40 | 1.8% |
| 60 to 89 Minutes | 151 | 6.8% |
| 90 or more Minutes | 0 | 0.0% |
Commute Time by Sex in India Hook
The most common commute times in India Hook are 20 to 24 minutes (384 commuters, 33.9%) for males and 20 to 24 minutes (233 commuters, 21.7%) for females.
| Commute Time | Male | Female |
| Less than 5 Minutes | 10 (0.9%) | 0 (0.0%) |
| 5 to 9 Minutes | 24 (2.1%) | 143 (13.3%) |
| 10 to 14 Minutes | 80 (7.0%) | 149 (13.9%) |
| 15 to 19 Minutes | 172 (15.2%) | 175 (16.3%) |
| 20 to 24 Minutes | 384 (33.9%) | 233 (21.7%) |
| 25 to 29 Minutes | 145 (12.8%) | 165 (15.4%) |
| 30 to 34 Minutes | 107 (9.4%) | 58 (5.4%) |
| 35 to 39 Minutes | 20 (1.8%) | 58 (5.4%) |
| 40 to 44 Minutes | 93 (8.2%) | 0 (0.0%) |
| 45 to 59 Minutes | 37 (3.3%) | 3 (0.3%) |
| 60 to 89 Minutes | 62 (5.5%) | 89 (8.3%) |
| 90 or more Minutes | 0 (0.0%) | 0 (0.0%) |
Time of Departure to Work by Sex in India Hook
The most frequent times of departure to work in India Hook are 6:30 AM to 6:59 AM (224, 19.8%) for males and 8:00 AM to 8:29 AM (195, 18.2%) for females.
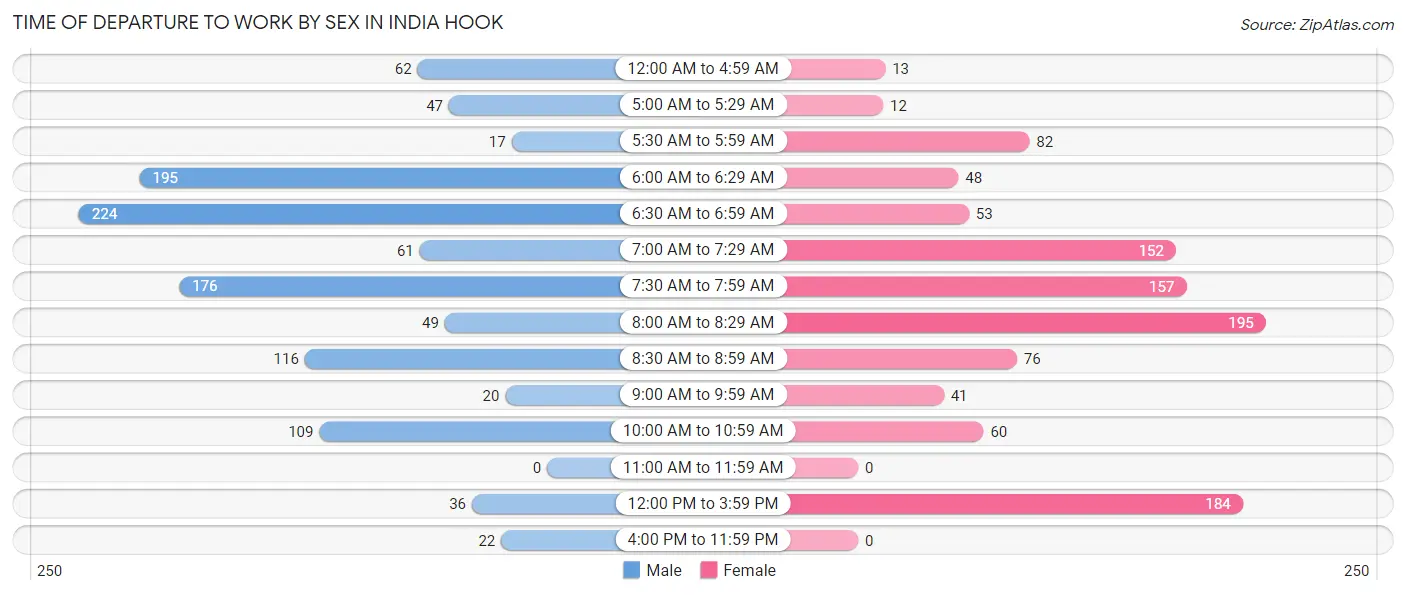
| Time of Departure | Male | Female |
| 12:00 AM to 4:59 AM | 62 (5.5%) | 13 (1.2%) |
| 5:00 AM to 5:29 AM | 47 (4.1%) | 12 (1.1%) |
| 5:30 AM to 5:59 AM | 17 (1.5%) | 82 (7.6%) |
| 6:00 AM to 6:29 AM | 195 (17.2%) | 48 (4.5%) |
| 6:30 AM to 6:59 AM | 224 (19.8%) | 53 (4.9%) |
| 7:00 AM to 7:29 AM | 61 (5.4%) | 152 (14.2%) |
| 7:30 AM to 7:59 AM | 176 (15.5%) | 157 (14.6%) |
| 8:00 AM to 8:29 AM | 49 (4.3%) | 195 (18.2%) |
| 8:30 AM to 8:59 AM | 116 (10.2%) | 76 (7.1%) |
| 9:00 AM to 9:59 AM | 20 (1.8%) | 41 (3.8%) |
| 10:00 AM to 10:59 AM | 109 (9.6%) | 60 (5.6%) |
| 11:00 AM to 11:59 AM | 0 (0.0%) | 0 (0.0%) |
| 12:00 PM to 3:59 PM | 36 (3.2%) | 184 (17.2%) |
| 4:00 PM to 11:59 PM | 22 (1.9%) | 0 (0.0%) |
| Total | 1,134 (100.0%) | 1,073 (100.0%) |
Housing Occupancy in India Hook
Occupancy by Ownership in India Hook
Of the total 1,852 dwellings in India Hook, owner-occupied units account for 1,784 (96.3%), while renter-occupied units make up 68 (3.7%).
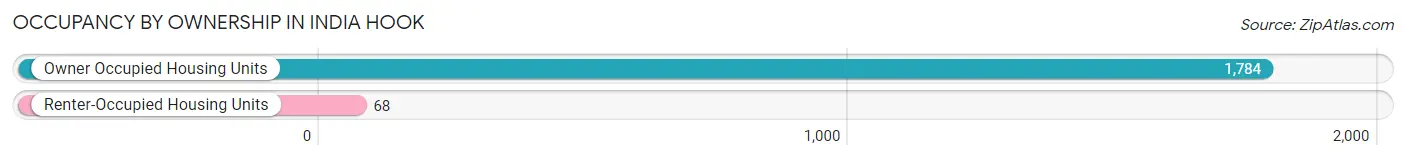
| Occupancy | # Housing Units | % Housing Units |
| Owner Occupied Housing Units | 1,784 | 96.3% |
| Renter-Occupied Housing Units | 68 | 3.7% |
| Total Occupied Housing Units | 1,852 | 100.0% |
Occupancy by Household Size in India Hook
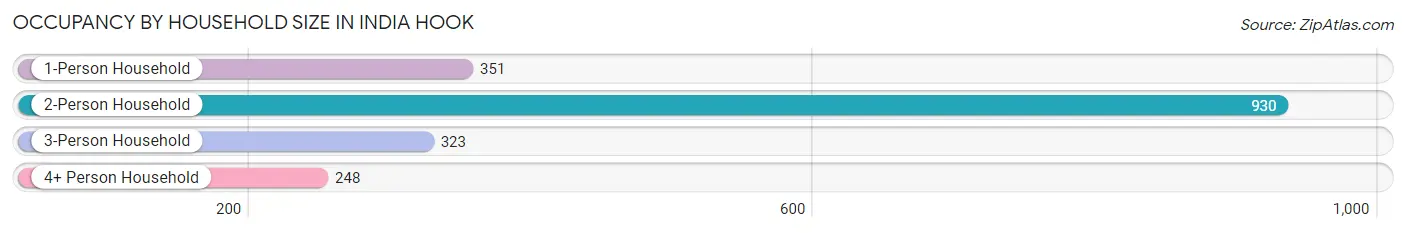
| Household Size | # Housing Units | % Housing Units |
| 1-Person Household | 351 | 19.0% |
| 2-Person Household | 930 | 50.2% |
| 3-Person Household | 323 | 17.4% |
| 4+ Person Household | 248 | 13.4% |
| Total Housing Units | 1,852 | 100.0% |
Occupancy by Ownership by Household Size in India Hook
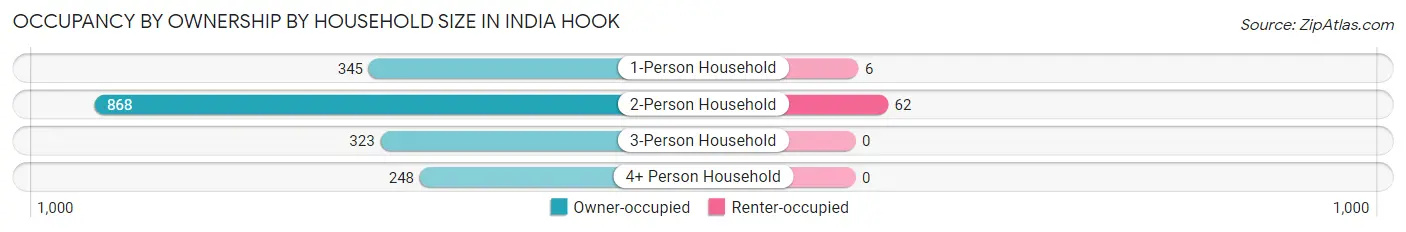
| Household Size | Owner-occupied | Renter-occupied |
| 1-Person Household | 345 (98.3%) | 6 (1.7%) |
| 2-Person Household | 868 (93.3%) | 62 (6.7%) |
| 3-Person Household | 323 (100.0%) | 0 (0.0%) |
| 4+ Person Household | 248 (100.0%) | 0 (0.0%) |
| Total Housing Units | 1,784 (96.3%) | 68 (3.7%) |
Occupancy by Educational Attainment in India Hook
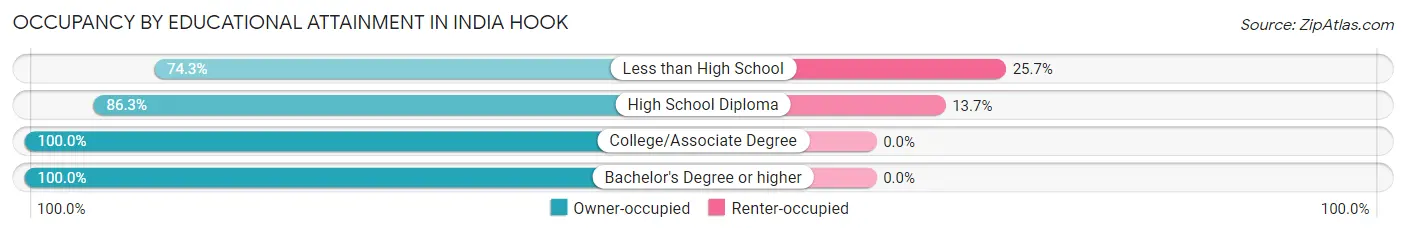
| Household Size | Owner-occupied | Renter-occupied |
| Less than High School | 55 (74.3%) | 19 (25.7%) |
| High School Diploma | 309 (86.3%) | 49 (13.7%) |
| College/Associate Degree | 618 (100.0%) | 0 (0.0%) |
| Bachelor's Degree or higher | 802 (100.0%) | 0 (0.0%) |
Occupancy by Age of Householder in India Hook
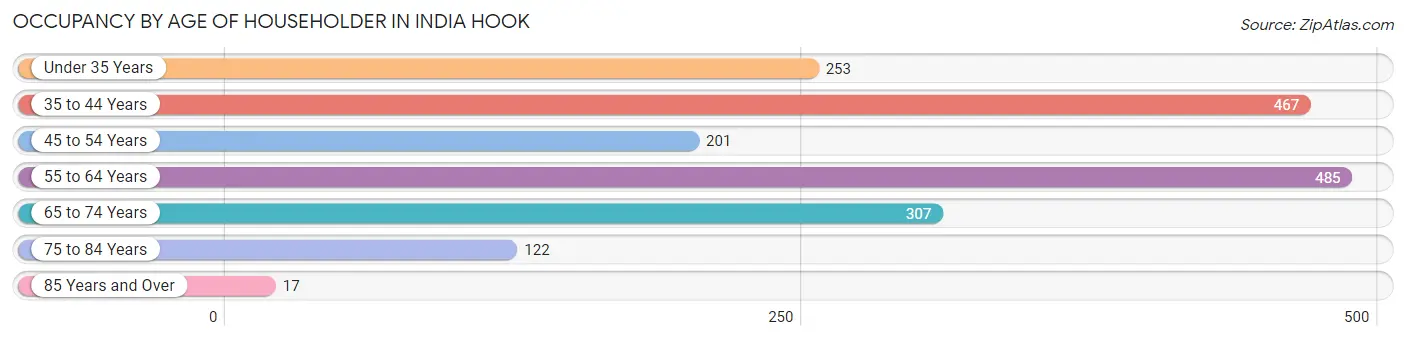
| Age Bracket | # Households | % Households |
| Under 35 Years | 253 | 13.7% |
| 35 to 44 Years | 467 | 25.2% |
| 45 to 54 Years | 201 | 10.8% |
| 55 to 64 Years | 485 | 26.2% |
| 65 to 74 Years | 307 | 16.6% |
| 75 to 84 Years | 122 | 6.6% |
| 85 Years and Over | 17 | 0.9% |
| Total | 1,852 | 100.0% |
Housing Finances in India Hook
Median Income by Occupancy in India Hook
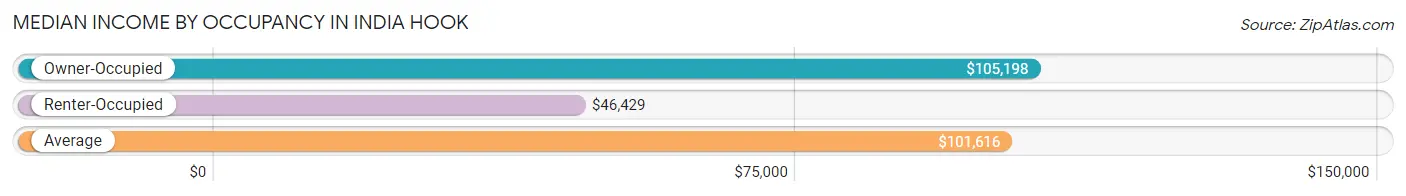
| Occupancy Type | # Households | Median Income |
| Owner-Occupied | 1,784 (96.3%) | $105,198 |
| Renter-Occupied | 68 (3.7%) | $46,429 |
| Average | 1,852 (100.0%) | $101,616 |
Occupancy by Householder Income Bracket in India Hook
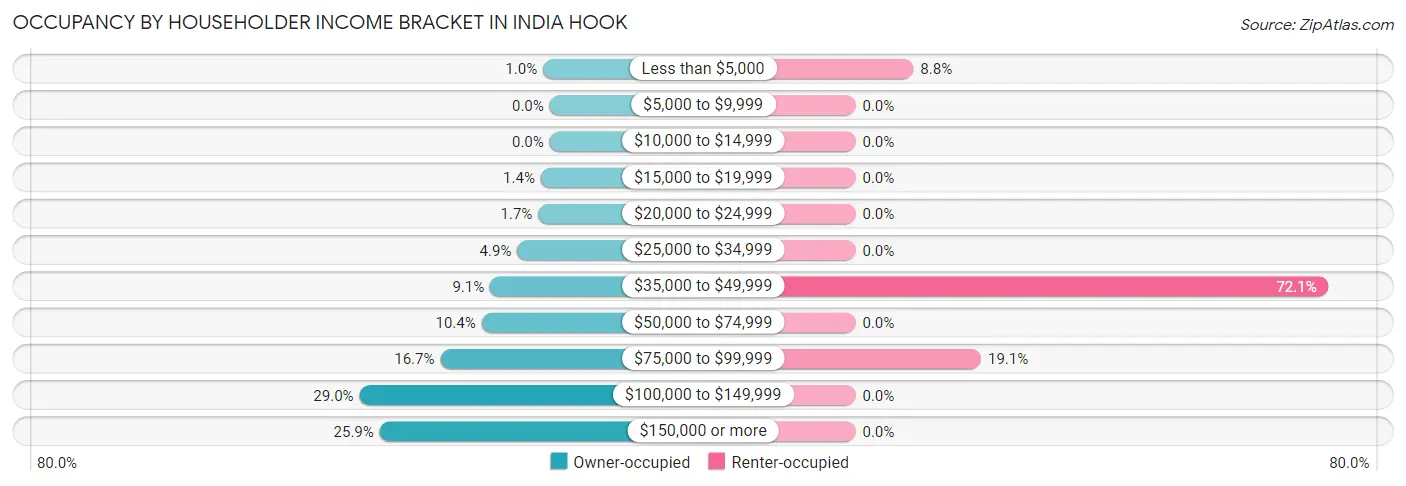
| Income Bracket | Owner-occupied | Renter-occupied |
| Less than $5,000 | 18 (1.0%) | 6 (8.8%) |
| $5,000 to $9,999 | 0 (0.0%) | 0 (0.0%) |
| $10,000 to $14,999 | 0 (0.0%) | 0 (0.0%) |
| $15,000 to $19,999 | 24 (1.3%) | 0 (0.0%) |
| $20,000 to $24,999 | 31 (1.7%) | 0 (0.0%) |
| $25,000 to $34,999 | 88 (4.9%) | 0 (0.0%) |
| $35,000 to $49,999 | 162 (9.1%) | 49 (72.1%) |
| $50,000 to $74,999 | 185 (10.4%) | 0 (0.0%) |
| $75,000 to $99,999 | 297 (16.7%) | 13 (19.1%) |
| $100,000 to $149,999 | 517 (29.0%) | 0 (0.0%) |
| $150,000 or more | 462 (25.9%) | 0 (0.0%) |
| Total | 1,784 (100.0%) | 68 (100.0%) |
Monthly Housing Cost Tiers in India Hook
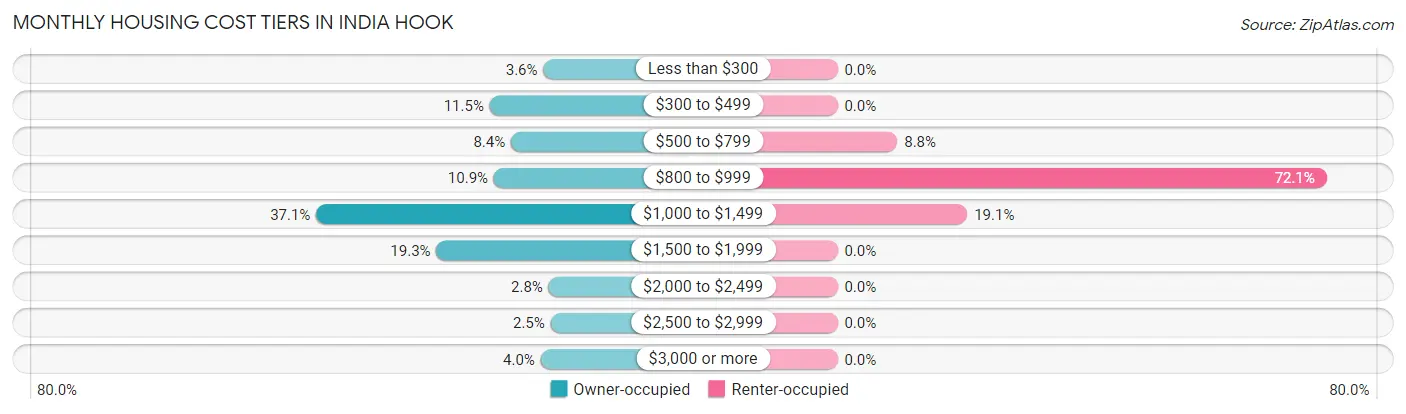
| Monthly Cost | Owner-occupied | Renter-occupied |
| Less than $300 | 64 (3.6%) | 0 (0.0%) |
| $300 to $499 | 205 (11.5%) | 0 (0.0%) |
| $500 to $799 | 149 (8.4%) | 6 (8.8%) |
| $800 to $999 | 194 (10.9%) | 49 (72.1%) |
| $1,000 to $1,499 | 661 (37.0%) | 13 (19.1%) |
| $1,500 to $1,999 | 345 (19.3%) | 0 (0.0%) |
| $2,000 to $2,499 | 50 (2.8%) | 0 (0.0%) |
| $2,500 to $2,999 | 45 (2.5%) | 0 (0.0%) |
| $3,000 or more | 71 (4.0%) | 0 (0.0%) |
| Total | 1,784 (100.0%) | 68 (100.0%) |
Physical Housing Characteristics in India Hook
Housing Structures in India Hook
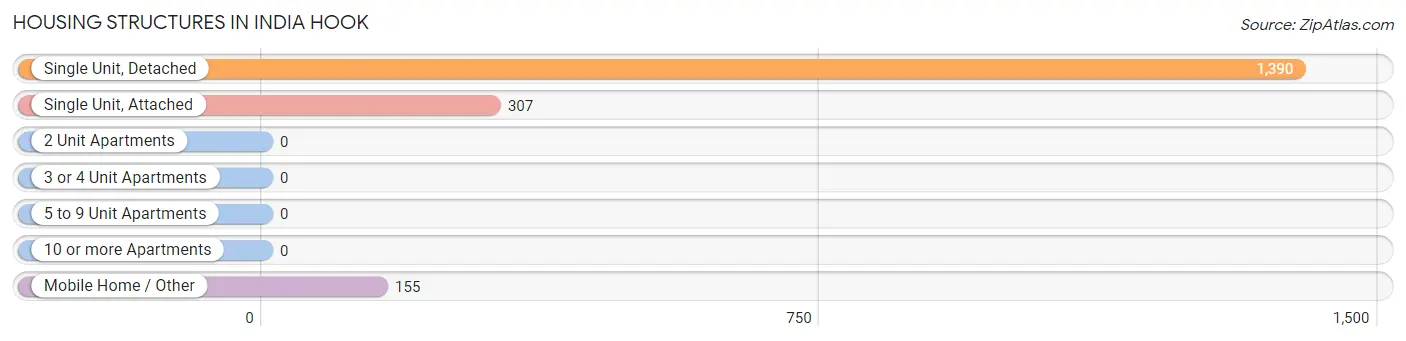
| Structure Type | # Housing Units | % Housing Units |
| Single Unit, Detached | 1,390 | 75.0% |
| Single Unit, Attached | 307 | 16.6% |
| 2 Unit Apartments | 0 | 0.0% |
| 3 or 4 Unit Apartments | 0 | 0.0% |
| 5 to 9 Unit Apartments | 0 | 0.0% |
| 10 or more Apartments | 0 | 0.0% |
| Mobile Home / Other | 155 | 8.4% |
| Total | 1,852 | 100.0% |
Housing Structures by Occupancy in India Hook
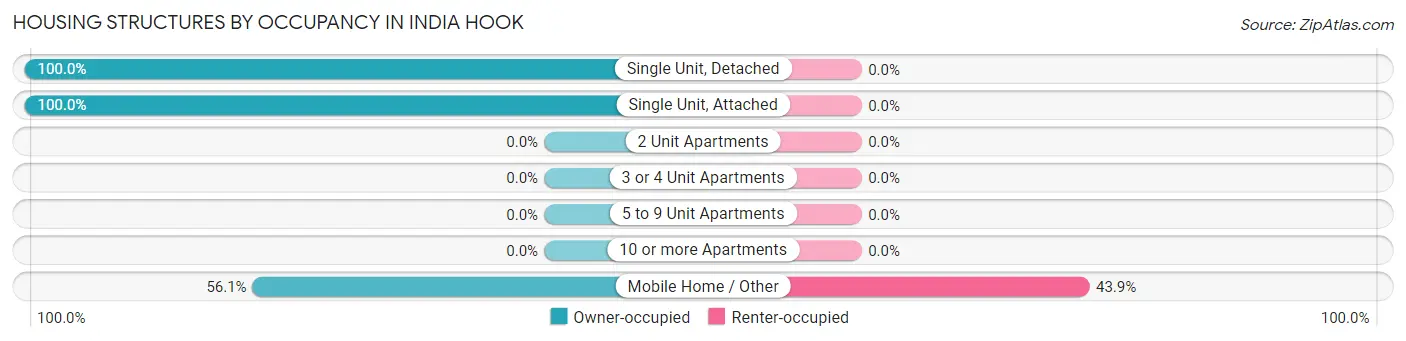
| Structure Type | Owner-occupied | Renter-occupied |
| Single Unit, Detached | 1,390 (100.0%) | 0 (0.0%) |
| Single Unit, Attached | 307 (100.0%) | 0 (0.0%) |
| 2 Unit Apartments | 0 (0.0%) | 0 (0.0%) |
| 3 or 4 Unit Apartments | 0 (0.0%) | 0 (0.0%) |
| 5 to 9 Unit Apartments | 0 (0.0%) | 0 (0.0%) |
| 10 or more Apartments | 0 (0.0%) | 0 (0.0%) |
| Mobile Home / Other | 87 (56.1%) | 68 (43.9%) |
| Total | 1,784 (96.3%) | 68 (3.7%) |
Housing Structures by Number of Rooms in India Hook
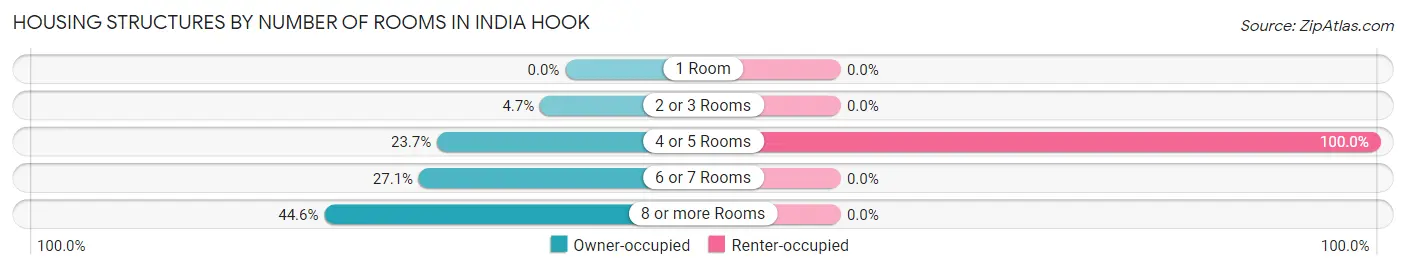
| Number of Rooms | Owner-occupied | Renter-occupied |
| 1 Room | 0 (0.0%) | 0 (0.0%) |
| 2 or 3 Rooms | 83 (4.6%) | 0 (0.0%) |
| 4 or 5 Rooms | 423 (23.7%) | 68 (100.0%) |
| 6 or 7 Rooms | 483 (27.1%) | 0 (0.0%) |
| 8 or more Rooms | 795 (44.6%) | 0 (0.0%) |
| Total | 1,784 (100.0%) | 68 (100.0%) |
Housing Structure by Heating Type in India Hook
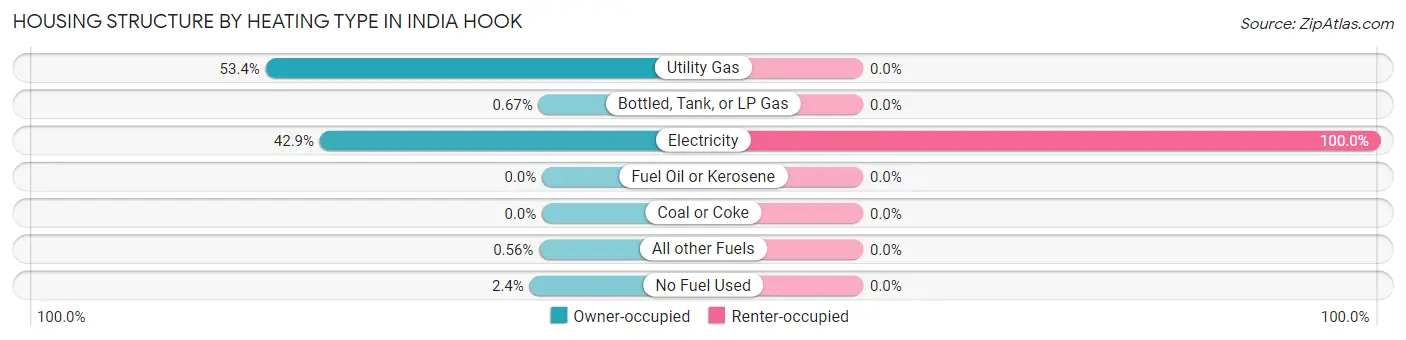
| Heating Type | Owner-occupied | Renter-occupied |
| Utility Gas | 953 (53.4%) | 0 (0.0%) |
| Bottled, Tank, or LP Gas | 12 (0.7%) | 0 (0.0%) |
| Electricity | 766 (42.9%) | 68 (100.0%) |
| Fuel Oil or Kerosene | 0 (0.0%) | 0 (0.0%) |
| Coal or Coke | 0 (0.0%) | 0 (0.0%) |
| All other Fuels | 10 (0.6%) | 0 (0.0%) |
| No Fuel Used | 43 (2.4%) | 0 (0.0%) |
| Total | 1,784 (100.0%) | 68 (100.0%) |
Household Vehicle Usage in India Hook
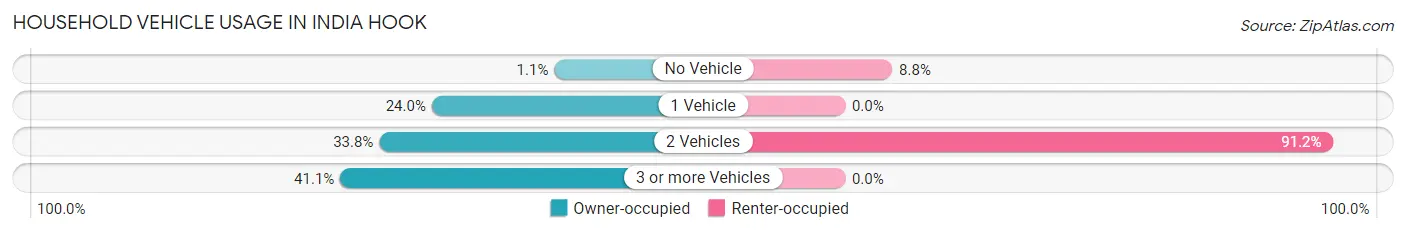
| Vehicles per Household | Owner-occupied | Renter-occupied |
| No Vehicle | 20 (1.1%) | 6 (8.8%) |
| 1 Vehicle | 428 (24.0%) | 0 (0.0%) |
| 2 Vehicles | 603 (33.8%) | 62 (91.2%) |
| 3 or more Vehicles | 733 (41.1%) | 0 (0.0%) |
| Total | 1,784 (100.0%) | 68 (100.0%) |
Real Estate & Mortgages in India Hook
Real Estate and Mortgage Overview in India Hook
| Characteristic | Without Mortgage | With Mortgage |
| Housing Units | 403 | 1,381 |
| Median Property Value | $192,800 | $283,400 |
| Median Household Income | $105,225 | $406 |
| Monthly Housing Costs | $420 | $71 |
| Real Estate Taxes | $1,180 | $21 |
Property Value by Mortgage Status in India Hook
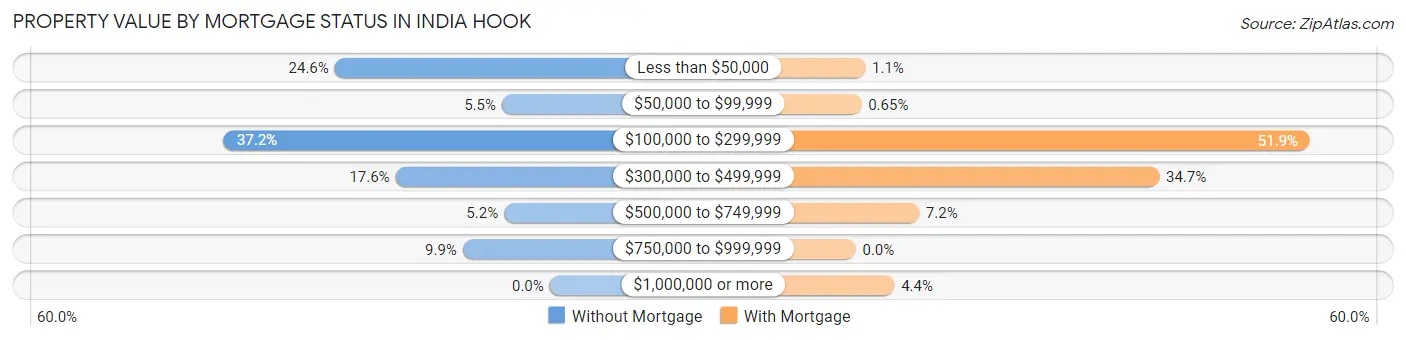
| Property Value | Without Mortgage | With Mortgage |
| Less than $50,000 | 99 (24.6%) | 15 (1.1%) |
| $50,000 to $99,999 | 22 (5.5%) | 9 (0.6%) |
| $100,000 to $299,999 | 150 (37.2%) | 717 (51.9%) |
| $300,000 to $499,999 | 71 (17.6%) | 479 (34.7%) |
| $500,000 to $749,999 | 21 (5.2%) | 100 (7.2%) |
| $750,000 to $999,999 | 40 (9.9%) | 0 (0.0%) |
| $1,000,000 or more | 0 (0.0%) | 61 (4.4%) |
| Total | 403 (100.0%) | 1,381 (100.0%) |
Household Income by Mortgage Status in India Hook
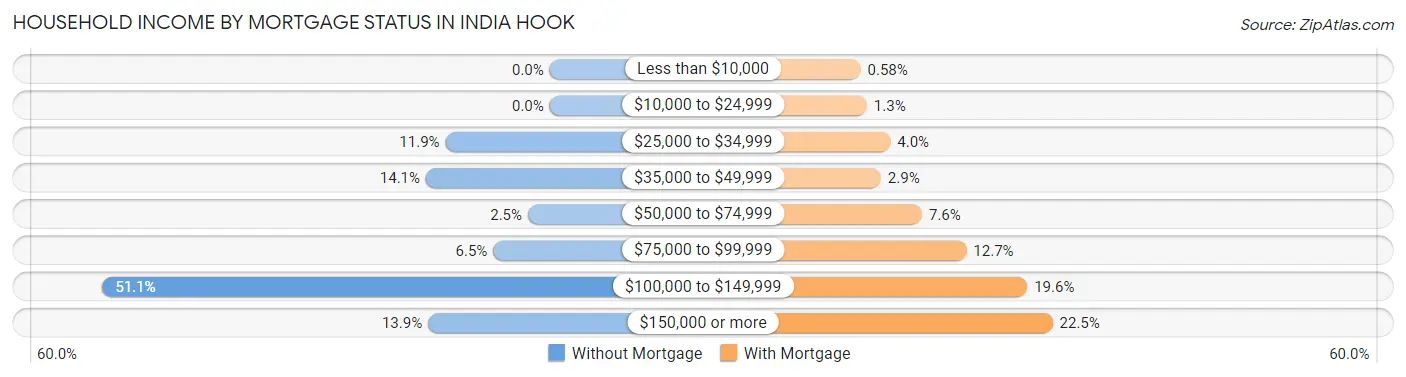
| Household Income | Without Mortgage | With Mortgage |
| Less than $10,000 | 0 (0.0%) | 8 (0.6%) |
| $10,000 to $24,999 | 0 (0.0%) | 18 (1.3%) |
| $25,000 to $34,999 | 48 (11.9%) | 55 (4.0%) |
| $35,000 to $49,999 | 57 (14.1%) | 40 (2.9%) |
| $50,000 to $74,999 | 10 (2.5%) | 105 (7.6%) |
| $75,000 to $99,999 | 26 (6.5%) | 175 (12.7%) |
| $100,000 to $149,999 | 206 (51.1%) | 271 (19.6%) |
| $150,000 or more | 56 (13.9%) | 311 (22.5%) |
| Total | 403 (100.0%) | 1,381 (100.0%) |
Property Value to Household Income Ratio in India Hook
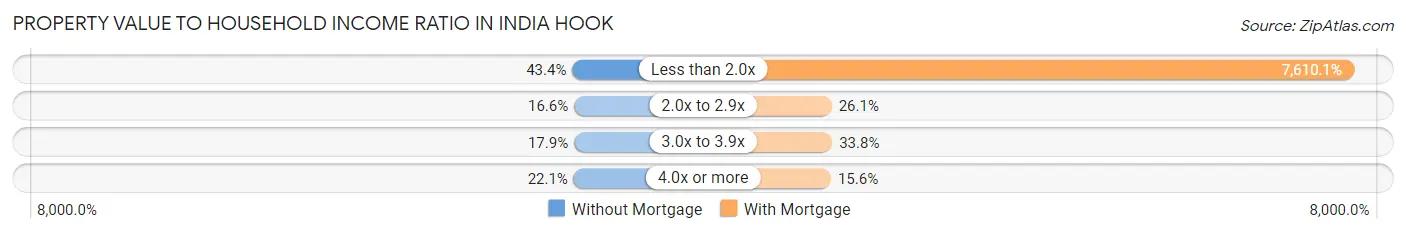
| Value-to-Income Ratio | Without Mortgage | With Mortgage |
| Less than 2.0x | 175 (43.4%) | 105,096 (7,610.1%) |
| 2.0x to 2.9x | 67 (16.6%) | 361 (26.1%) |
| 3.0x to 3.9x | 72 (17.9%) | 467 (33.8%) |
| 4.0x or more | 89 (22.1%) | 216 (15.6%) |
| Total | 403 (100.0%) | 1,381 (100.0%) |
Real Estate Taxes by Mortgage Status in India Hook
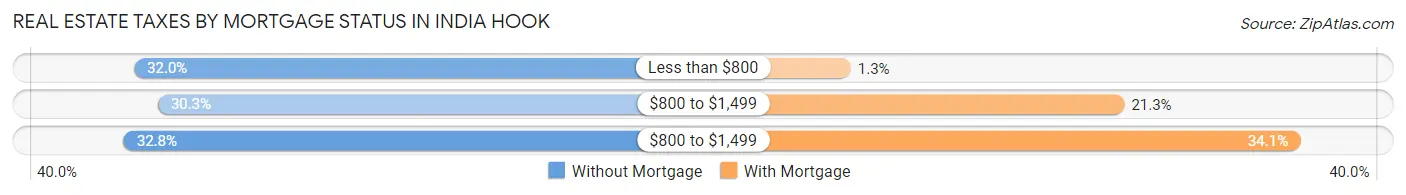
| Property Taxes | Without Mortgage | With Mortgage |
| Less than $800 | 129 (32.0%) | 18 (1.3%) |
| $800 to $1,499 | 122 (30.3%) | 294 (21.3%) |
| $800 to $1,499 | 132 (32.8%) | 471 (34.1%) |
| Total | 403 (100.0%) | 1,381 (100.0%) |
Health & Disability in India Hook
Health Insurance Coverage by Age in India Hook
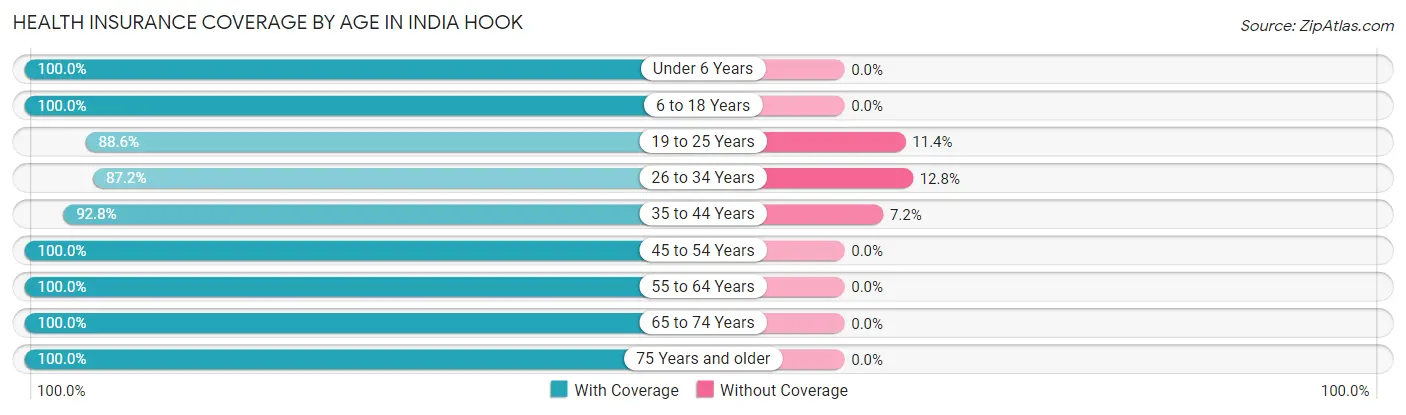
| Age Bracket | With Coverage | Without Coverage |
| Under 6 Years | 173 (100.0%) | 0 (0.0%) |
| 6 to 18 Years | 676 (100.0%) | 0 (0.0%) |
| 19 to 25 Years | 249 (88.6%) | 32 (11.4%) |
| 26 to 34 Years | 458 (87.2%) | 67 (12.8%) |
| 35 to 44 Years | 824 (92.8%) | 64 (7.2%) |
| 45 to 54 Years | 401 (100.0%) | 0 (0.0%) |
| 55 to 64 Years | 720 (100.0%) | 0 (0.0%) |
| 65 to 74 Years | 453 (100.0%) | 0 (0.0%) |
| 75 Years and older | 187 (100.0%) | 0 (0.0%) |
| Total | 4,141 (96.2%) | 163 (3.8%) |
Health Insurance Coverage by Citizenship Status in India Hook
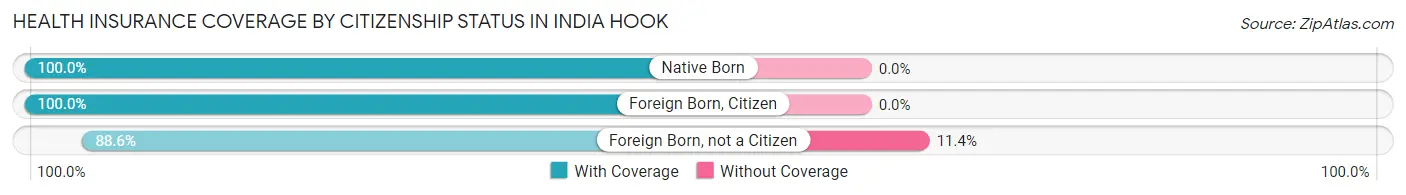
| Citizenship Status | With Coverage | Without Coverage |
| Native Born | 173 (100.0%) | 0 (0.0%) |
| Foreign Born, Citizen | 676 (100.0%) | 0 (0.0%) |
| Foreign Born, not a Citizen | 249 (88.6%) | 32 (11.4%) |
Health Insurance Coverage by Household Income in India Hook
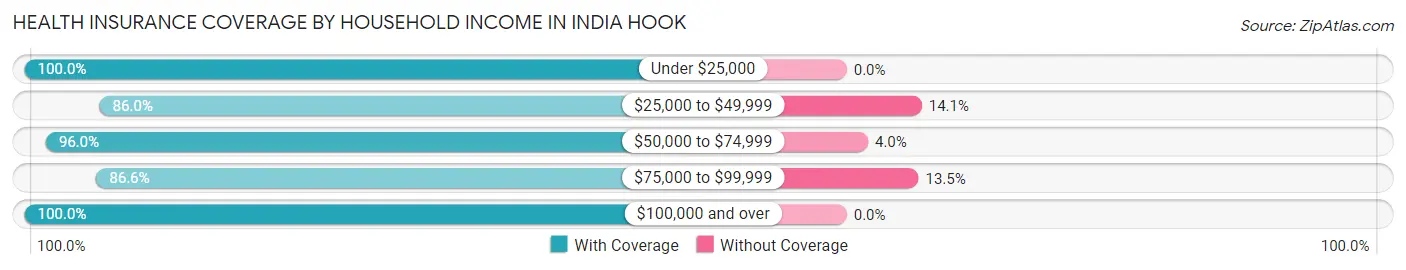
| Household Income | With Coverage | Without Coverage |
| Under $25,000 | 144 (100.0%) | 0 (0.0%) |
| $25,000 to $49,999 | 410 (86.0%) | 67 (14.1%) |
| $50,000 to $74,999 | 314 (96.0%) | 13 (4.0%) |
| $75,000 to $99,999 | 534 (86.6%) | 83 (13.5%) |
| $100,000 and over | 2,739 (100.0%) | 0 (0.0%) |
Public vs Private Health Insurance Coverage by Age in India Hook
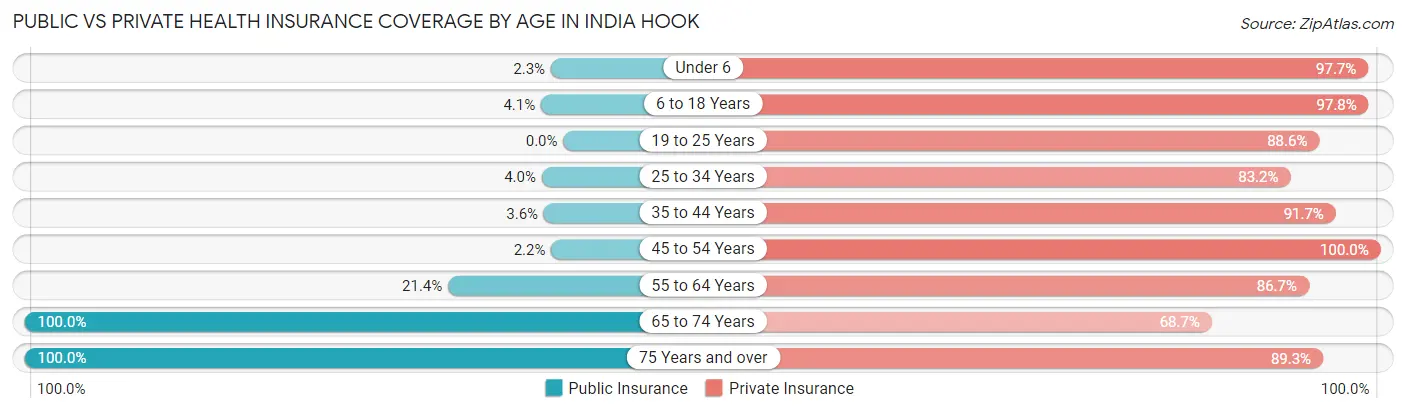
| Age Bracket | Public Insurance | Private Insurance |
| Under 6 | 4 (2.3%) | 169 (97.7%) |
| 6 to 18 Years | 28 (4.1%) | 661 (97.8%) |
| 19 to 25 Years | 0 (0.0%) | 249 (88.6%) |
| 25 to 34 Years | 21 (4.0%) | 437 (83.2%) |
| 35 to 44 Years | 32 (3.6%) | 814 (91.7%) |
| 45 to 54 Years | 9 (2.2%) | 401 (100.0%) |
| 55 to 64 Years | 154 (21.4%) | 624 (86.7%) |
| 65 to 74 Years | 453 (100.0%) | 311 (68.6%) |
| 75 Years and over | 187 (100.0%) | 167 (89.3%) |
| Total | 888 (20.6%) | 3,833 (89.1%) |
Disability Status by Sex by Age in India Hook
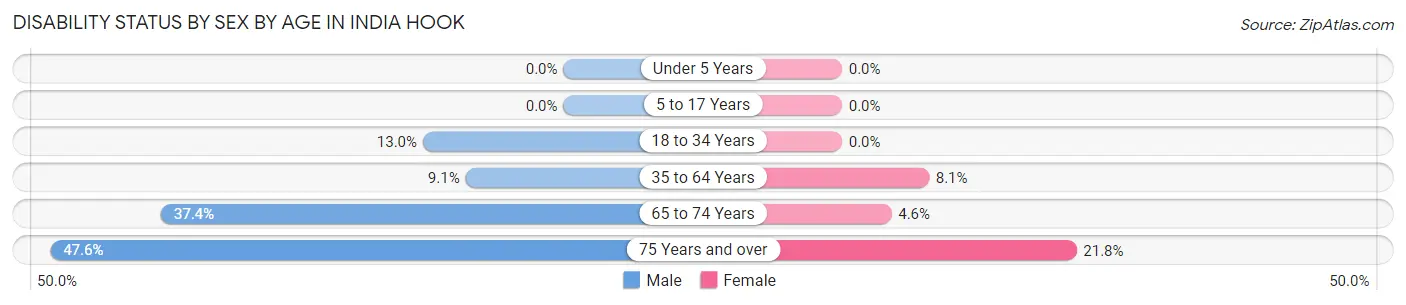
| Age Bracket | Male | Female |
| Under 5 Years | 0 (0.0%) | 0 (0.0%) |
| 5 to 17 Years | 0 (0.0%) | 0 (0.0%) |
| 18 to 34 Years | 42 (13.0%) | 0 (0.0%) |
| 35 to 64 Years | 89 (9.1%) | 83 (8.1%) |
| 65 to 74 Years | 96 (37.3%) | 9 (4.6%) |
| 75 Years and over | 30 (47.6%) | 27 (21.8%) |
Disability Class by Sex by Age in India Hook
Disability Class: Hearing Difficulty
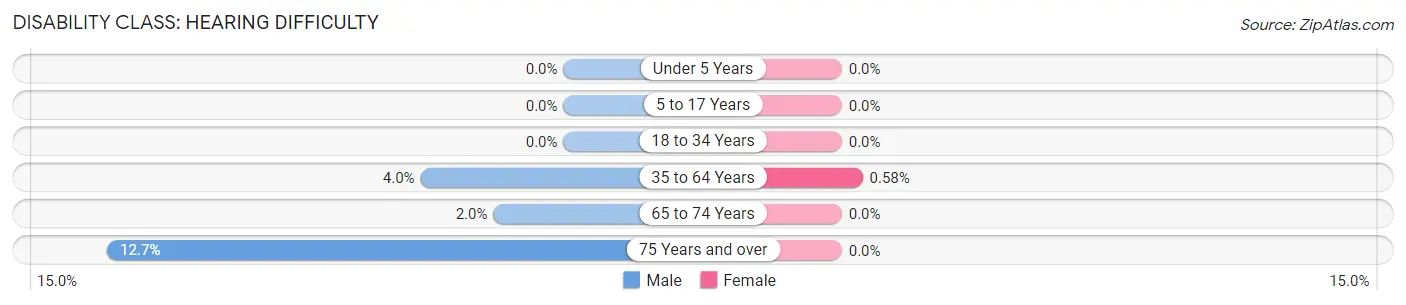
| Age Bracket | Male | Female |
| Under 5 Years | 0 (0.0%) | 0 (0.0%) |
| 5 to 17 Years | 0 (0.0%) | 0 (0.0%) |
| 18 to 34 Years | 0 (0.0%) | 0 (0.0%) |
| 35 to 64 Years | 39 (4.0%) | 6 (0.6%) |
| 65 to 74 Years | 5 (1.9%) | 0 (0.0%) |
| 75 Years and over | 8 (12.7%) | 0 (0.0%) |
Disability Class: Vision Difficulty
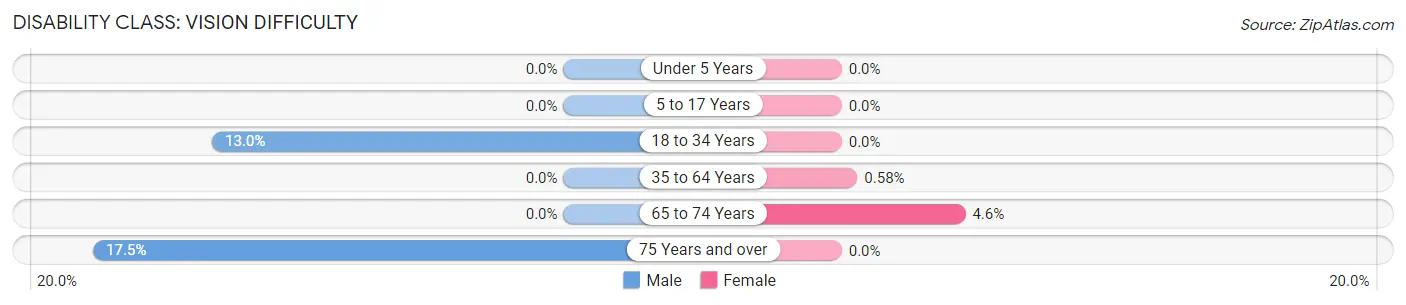
| Age Bracket | Male | Female |
| Under 5 Years | 0 (0.0%) | 0 (0.0%) |
| 5 to 17 Years | 0 (0.0%) | 0 (0.0%) |
| 18 to 34 Years | 42 (13.0%) | 0 (0.0%) |
| 35 to 64 Years | 0 (0.0%) | 6 (0.6%) |
| 65 to 74 Years | 0 (0.0%) | 9 (4.6%) |
| 75 Years and over | 11 (17.5%) | 0 (0.0%) |
Disability Class: Cognitive Difficulty
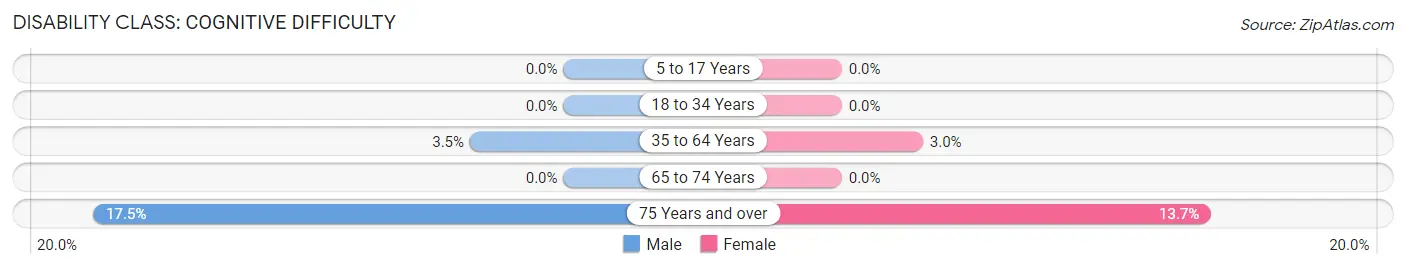
| Age Bracket | Male | Female |
| 5 to 17 Years | 0 (0.0%) | 0 (0.0%) |
| 18 to 34 Years | 0 (0.0%) | 0 (0.0%) |
| 35 to 64 Years | 34 (3.5%) | 31 (3.0%) |
| 65 to 74 Years | 0 (0.0%) | 0 (0.0%) |
| 75 Years and over | 11 (17.5%) | 17 (13.7%) |
Disability Class: Ambulatory Difficulty
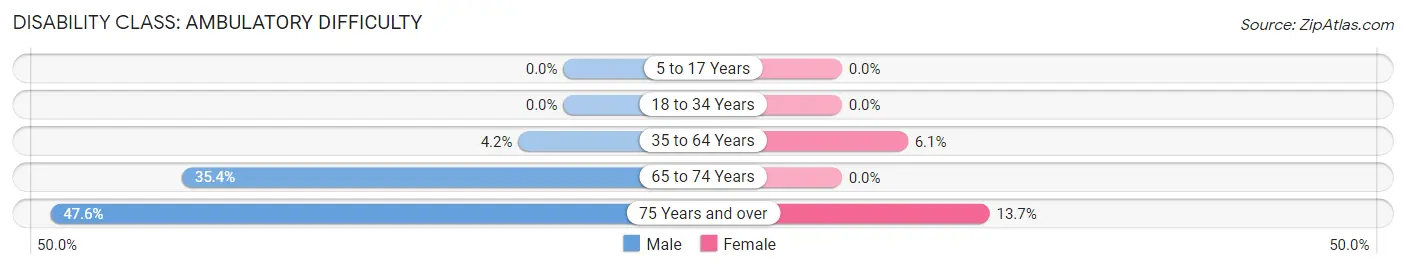
| Age Bracket | Male | Female |
| 5 to 17 Years | 0 (0.0%) | 0 (0.0%) |
| 18 to 34 Years | 0 (0.0%) | 0 (0.0%) |
| 35 to 64 Years | 41 (4.2%) | 63 (6.1%) |
| 65 to 74 Years | 91 (35.4%) | 0 (0.0%) |
| 75 Years and over | 30 (47.6%) | 17 (13.7%) |
Disability Class: Self-Care Difficulty
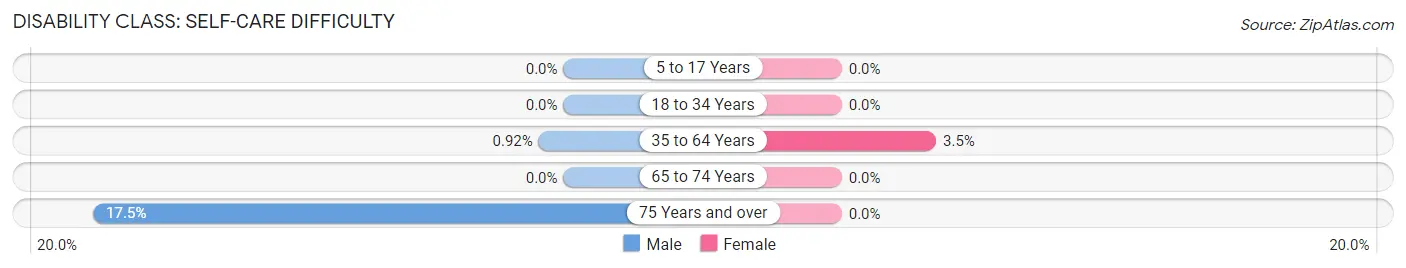
| Age Bracket | Male | Female |
| 5 to 17 Years | 0 (0.0%) | 0 (0.0%) |
| 18 to 34 Years | 0 (0.0%) | 0 (0.0%) |
| 35 to 64 Years | 9 (0.9%) | 36 (3.5%) |
| 65 to 74 Years | 0 (0.0%) | 0 (0.0%) |
| 75 Years and over | 11 (17.5%) | 0 (0.0%) |
Technology Access in India Hook
Computing Device Access in India Hook
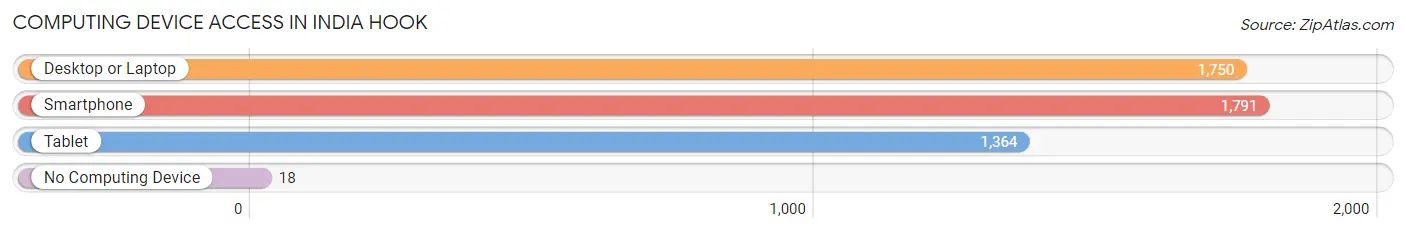
| Device Type | # Households | % Households |
| Desktop or Laptop | 1,750 | 94.5% |
| Smartphone | 1,791 | 96.7% |
| Tablet | 1,364 | 73.7% |
| No Computing Device | 18 | 1.0% |
| Total | 1,852 | 100.0% |
Internet Access in India Hook
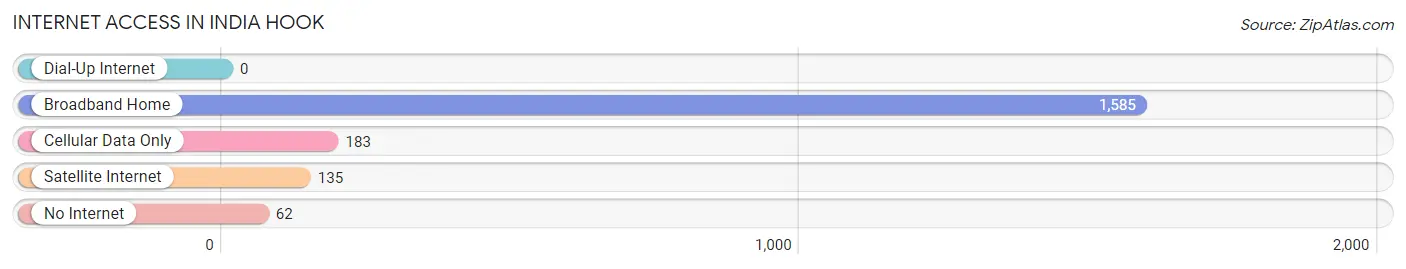
| Internet Type | # Households | % Households |
| Dial-Up Internet | 0 | 0.0% |
| Broadband Home | 1,585 | 85.6% |
| Cellular Data Only | 183 | 9.9% |
| Satellite Internet | 135 | 7.3% |
| No Internet | 62 | 3.4% |
| Total | 1,852 | 100.0% |
India Hook Summary
Hook, South Carolina is a small town located in the Lowcountry region of the state. It is situated on the banks of the Ashley River, just south of Charleston. The town was founded in 1790 and has a population of just over 1,000 people.
History
The area that is now known as India Hook was originally inhabited by the Sewee Indians. The Sewee were a tribe of Native Americans who lived in the area for centuries before the arrival of Europeans. The first Europeans to settle in the area were French Huguenots, who arrived in the late 1600s. They established a trading post and a small settlement, which eventually became known as India Hook.
The town was named after the nearby Indian Hook Plantation, which was owned by a wealthy planter named John Hook. The plantation was named after the Indian Hook tree, which was a type of hickory tree that grew in the area.
In 1790, the town of India Hook was officially incorporated. It was a small, rural community that relied heavily on agriculture and fishing for its livelihood. The town was also home to a number of small businesses, including a general store, a blacksmith shop, and a gristmill.
In the late 1800s, the town began to grow and develop. The railroad arrived in 1887, connecting India Hook to the rest of the state. This allowed for the transportation of goods and people, and helped to spur economic growth.
In the early 1900s, the town experienced a period of growth and prosperity. The population increased, and new businesses opened up. The town also became a popular tourist destination, as people came to enjoy the natural beauty of the area.
Geography
India Hook is located in the Lowcountry region of South Carolina. It is situated on the banks of the Ashley River, just south of Charleston. The town is surrounded by lush forests and wetlands, and is home to a variety of wildlife.
The town is located in Berkeley County, and is part of the Charleston-North Charleston-Summerville Metropolitan Statistical Area. The town is located about 25 miles from downtown Charleston, and is accessible by car or boat.
Economy
The economy of India Hook is largely based on tourism and agriculture. The town is home to a number of small businesses, including restaurants, shops, and galleries. The town also has a number of bed and breakfasts, which attract visitors from all over the world.
Agriculture is also an important part of the local economy. The town is home to a number of farms, which produce a variety of crops, including corn, soybeans, and cotton. Fishing is also an important part of the local economy, as the Ashley River is home to a variety of fish species.
Demographics
As of the 2010 census, the population of India Hook was 1,072. The racial makeup of the town was 94.3% White, 2.7% African American, 0.3% Native American, 0.7% Asian, 0.1% Pacific Islander, and 1.9% from other races. The median household income was $41,250, and the median family income was $50,000.
Conclusion
India Hook is a small town located in the Lowcountry region of South Carolina. It was founded in 1790 and has a population of just over 1,000 people. The town is known for its natural beauty and its rich history. The economy of India Hook is largely based on tourism and agriculture, and the town is home to a number of small businesses. The population of India Hook is mostly White, with a small percentage of African Americans, Native Americans, Asians, and Pacific Islanders.
Common Questions
What is Per Capita Income in India Hook?
Per Capita income in India Hook is $51,515.
What is the Median Family Income in India Hook?
Median Family Income in India Hook is $115,962.
What is the Median Household income in India Hook?
Median Household Income in India Hook is $101,616.
What is Income or Wage Gap in India Hook?
Income or Wage Gap in India Hook is 26.5%.
Women in India Hook earn 73.5 cents for every dollar earned by a man.
What is Inequality or Gini Index in India Hook?
Inequality or Gini Index in India Hook is 0.36.
What is the Total Population of India Hook?
Total Population of India Hook is 4,385.
What is the Total Male Population of India Hook?
Total Male Population of India Hook is 2,007.
What is the Total Female Population of India Hook?
Total Female Population of India Hook is 2,378.
What is the Ratio of Males per 100 Females in India Hook?
There are 84.40 Males per 100 Females in India Hook.
What is the Ratio of Females per 100 Males in India Hook?
There are 118.49 Females per 100 Males in India Hook.
What is the Median Population Age in India Hook?
Median Population Age in India Hook is 39.0 Years.
What is the Average Family Size in India Hook
Average Family Size in India Hook is 2.7 People.
What is the Average Household Size in India Hook
Average Household Size in India Hook is 2.4 People.
How Large is the Labor Force in India Hook?
There are 2,705 People in the Labor Forcein in India Hook.
What is the Percentage of People in the Labor Force in India Hook?
70.8% of People are in the Labor Force in India Hook.
What is the Unemployment Rate in India Hook?
Unemployment Rate in India Hook is 5.3%.