Varnville, SC Map & Demographics
Varnville Map
Varnville Overview
$18,571
PER CAPITA INCOME
$56,000
AVG FAMILY INCOME
$38,092
AVG HOUSEHOLD INCOME
31.0%
WAGE / INCOME GAP [ % ]
69.0¢/ $1
WAGE / INCOME GAP [ $ ]
0.46
INEQUALITY / GINI INDEX
2,173
TOTAL POPULATION
1,188
MALE POPULATION
985
FEMALE POPULATION
120.61
MALES / 100 FEMALES
82.91
FEMALES / 100 MALES
39.3
MEDIAN AGE
3.8
AVG FAMILY SIZE
2.9
AVG HOUSEHOLD SIZE
932
LABOR FORCE [ PEOPLE ]
55.9%
PERCENT IN LABOR FORCE
14.8%
UNEMPLOYMENT RATE
Varnville Zip Codes
Varnville Area Codes
Income in Varnville
Income Overview in Varnville
Per Capita Income in Varnville is $18,571, while median incomes of families and households are $56,000 and $38,092 respectively.
| Characteristic | Number | Measure |
| Per Capita Income | 2,173 | $18,571 |
| Median Family Income | 446 | $56,000 |
| Mean Family Income | 446 | $64,595 |
| Median Household Income | 734 | $38,092 |
| Mean Household Income | 734 | $50,567 |
| Income Deficit | 446 | $0 |
| Wage / Income Gap (%) | 2,173 | 30.99% |
| Wage / Income Gap ($) | 2,173 | 69.01¢ per $1 |
| Gini / Inequality Index | 2,173 | 0.46 |
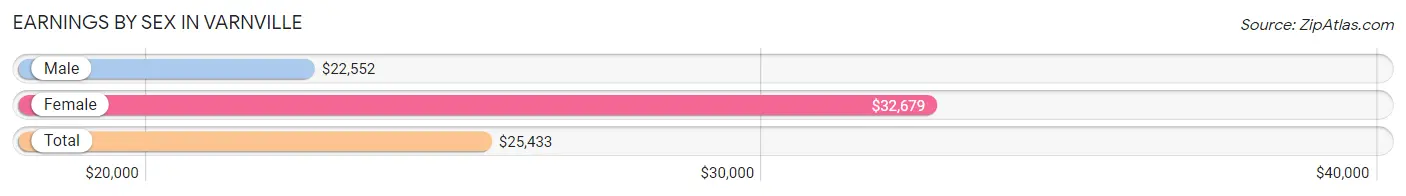
Earnings by Sex in Varnville
Average Earnings in Varnville are $25,433, $22,552 for men and $32,679 for women, a difference of 31.0%.
| Sex | Number | Average Earnings |
| Male | 597 (61.2%) | $22,552 |
| Female | 378 (38.8%) | $32,679 |
| Total | 975 (100.0%) | $25,433 |
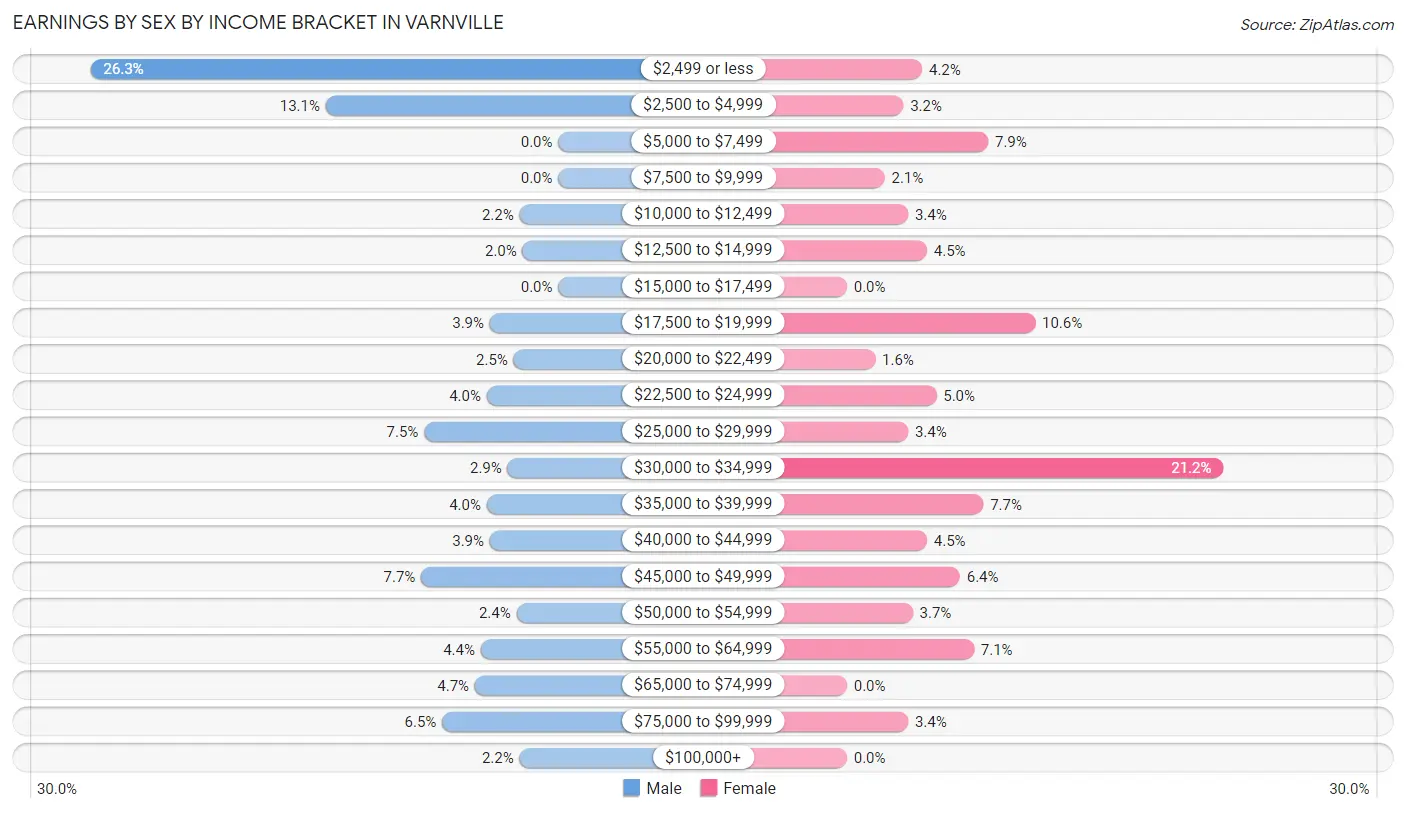
Earnings by Sex by Income Bracket in Varnville
The most common earnings brackets in Varnville are $2,499 or less for men (157 | 26.3%) and $30,000 to $34,999 for women (80 | 21.2%).
| Income | Male | Female |
| $2,499 or less | 157 (26.3%) | 16 (4.2%) |
| $2,500 to $4,999 | 78 (13.1%) | 12 (3.2%) |
| $5,000 to $7,499 | 0 (0.0%) | 30 (7.9%) |
| $7,500 to $9,999 | 0 (0.0%) | 8 (2.1%) |
| $10,000 to $12,499 | 13 (2.2%) | 13 (3.4%) |
| $12,500 to $14,999 | 12 (2.0%) | 17 (4.5%) |
| $15,000 to $17,499 | 0 (0.0%) | 0 (0.0%) |
| $17,500 to $19,999 | 23 (3.8%) | 40 (10.6%) |
| $20,000 to $22,499 | 15 (2.5%) | 6 (1.6%) |
| $22,500 to $24,999 | 24 (4.0%) | 19 (5.0%) |
| $25,000 to $29,999 | 45 (7.5%) | 13 (3.4%) |
| $30,000 to $34,999 | 17 (2.9%) | 80 (21.2%) |
| $35,000 to $39,999 | 24 (4.0%) | 29 (7.7%) |
| $40,000 to $44,999 | 23 (3.8%) | 17 (4.5%) |
| $45,000 to $49,999 | 46 (7.7%) | 24 (6.4%) |
| $50,000 to $54,999 | 14 (2.4%) | 14 (3.7%) |
| $55,000 to $64,999 | 26 (4.4%) | 27 (7.1%) |
| $65,000 to $74,999 | 28 (4.7%) | 0 (0.0%) |
| $75,000 to $99,999 | 39 (6.5%) | 13 (3.4%) |
| $100,000+ | 13 (2.2%) | 0 (0.0%) |
| Total | 597 (100.0%) | 378 (100.0%) |
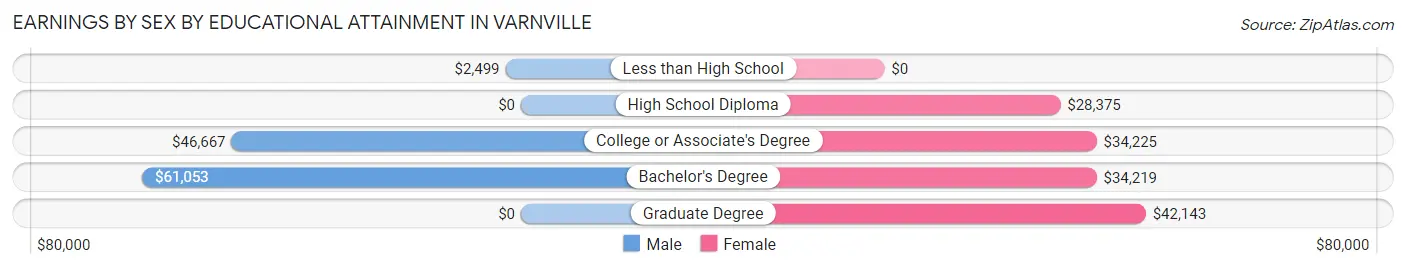
Earnings by Sex by Educational Attainment in Varnville
Average earnings in Varnville are $33,500 for men and $33,643 for women, a difference of 0.4%. Men with an educational attainment of bachelor's degree enjoy the highest average annual earnings of $61,053, while those with less than high school education earn the least with $2,499. Women with an educational attainment of graduate degree earn the most with the average annual earnings of $42,143, while those with high school diploma education have the smallest earnings of $28,375.
| Educational Attainment | Male Income | Female Income |
| Less than High School | $2,499 | $0 |
| High School Diploma | - | - |
| College or Associate's Degree | $46,667 | $34,225 |
| Bachelor's Degree | $61,053 | $34,219 |
| Graduate Degree | - | - |
| Total | $33,500 | $33,643 |
Family Income in Varnville
Family Income Brackets in Varnville
According to the Varnville family income data, there are 126 families falling into the $35,000 to $49,999 income range, which is the most common income bracket and makes up 28.2% of all families. Conversely, the $25,000 to $34,999 income bracket is the least frequent group with only 11 families (2.5%) belonging to this category.
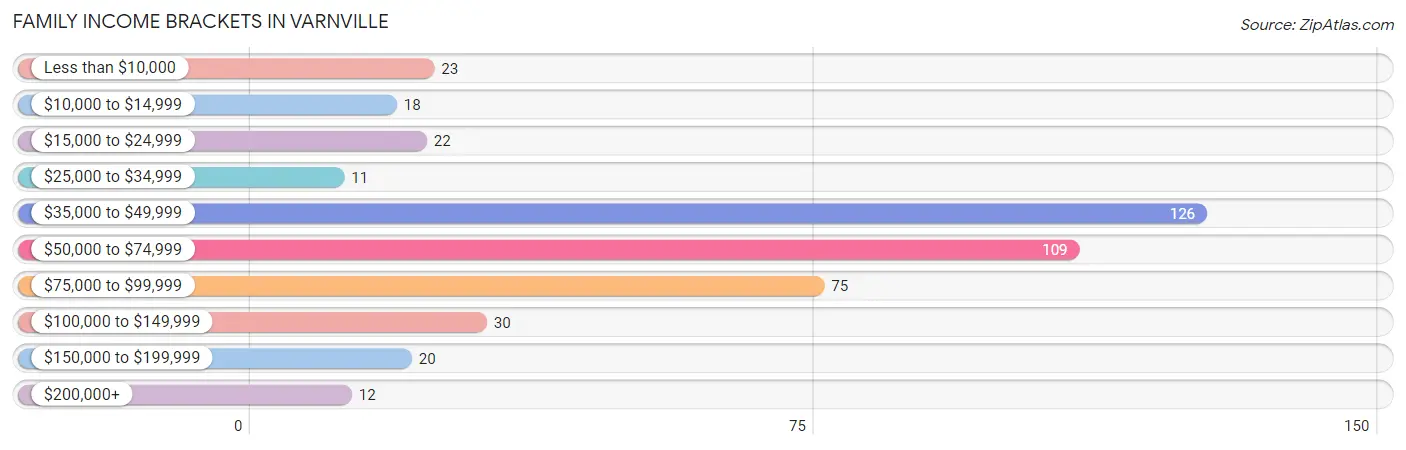
| Income Bracket | # Families | % Families |
| Less than $10,000 | 23 | 5.2% |
| $10,000 to $14,999 | 18 | 4.0% |
| $15,000 to $24,999 | 22 | 4.9% |
| $25,000 to $34,999 | 11 | 2.5% |
| $35,000 to $49,999 | 126 | 28.3% |
| $50,000 to $74,999 | 109 | 24.4% |
| $75,000 to $99,999 | 75 | 16.8% |
| $100,000 to $149,999 | 30 | 6.7% |
| $150,000 to $199,999 | 20 | 4.5% |
| $200,000+ | 12 | 2.7% |
Family Income by Famaliy Size in Varnville
4-person families (73 | 16.4%) account for the highest median family income in Varnville with $80,764 per family, while 2-person families (195 | 43.7%) have the highest median income of $29,297 per family member.
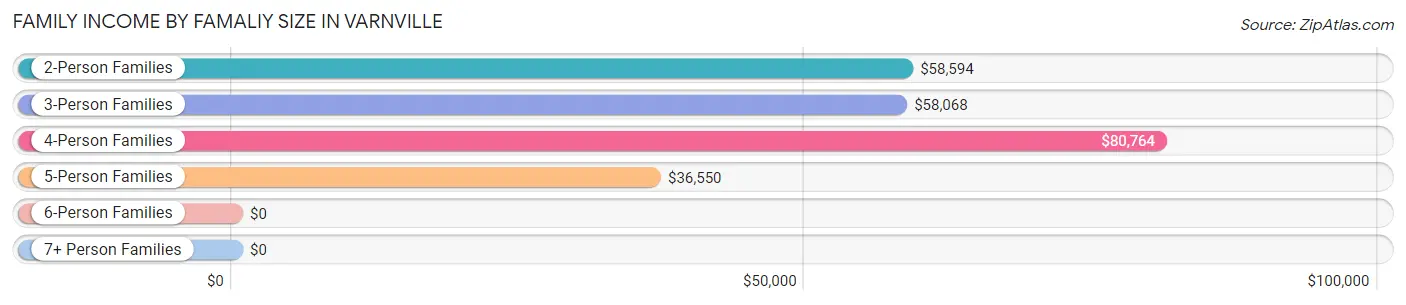
| Income Bracket | # Families | Median Income |
| 2-Person Families | 195 (43.7%) | $58,594 |
| 3-Person Families | 75 (16.8%) | $58,068 |
| 4-Person Families | 73 (16.4%) | $80,764 |
| 5-Person Families | 82 (18.4%) | $36,550 |
| 6-Person Families | 21 (4.7%) | $0 |
| 7+ Person Families | 0 (0.0%) | $0 |
| Total | 446 (100.0%) | $56,000 |
Family Income by Number of Earners in Varnville
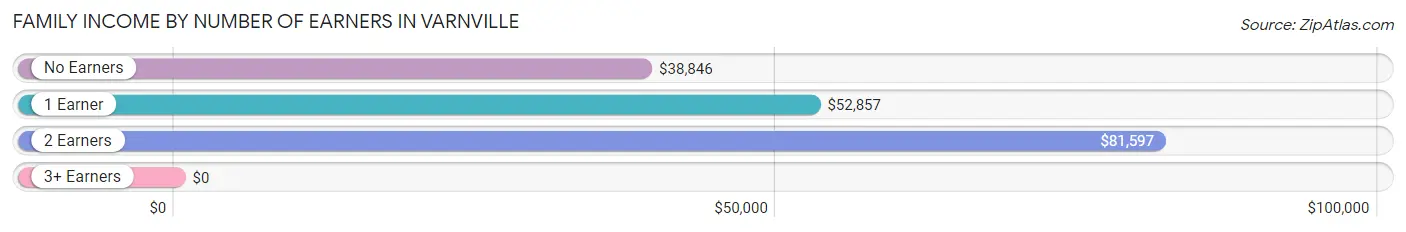
| Number of Earners | # Families | Median Income |
| No Earners | 80 (17.9%) | $38,846 |
| 1 Earner | 158 (35.4%) | $52,857 |
| 2 Earners | 129 (28.9%) | $81,597 |
| 3+ Earners | 79 (17.7%) | $0 |
| Total | 446 (100.0%) | $56,000 |
Household Income in Varnville
Household Income Brackets in Varnville
With 155 households falling in the category, the $35,000 to $49,999 income range is the most frequent in Varnville, accounting for 21.1% of all households. In contrast, only 12 households (1.6%) fall into the $200,000+ income bracket, making it the least populous group.
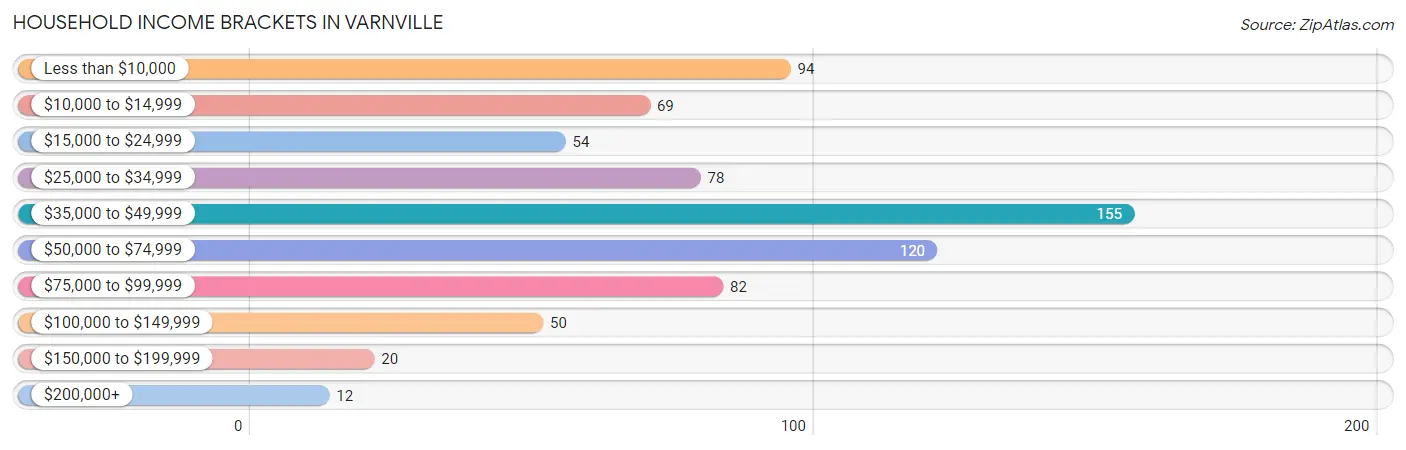
| Income Bracket | # Households | % Households |
| Less than $10,000 | 94 | 12.8% |
| $10,000 to $14,999 | 69 | 9.4% |
| $15,000 to $24,999 | 54 | 7.4% |
| $25,000 to $34,999 | 78 | 10.6% |
| $35,000 to $49,999 | 155 | 21.1% |
| $50,000 to $74,999 | 120 | 16.3% |
| $75,000 to $99,999 | 82 | 11.2% |
| $100,000 to $149,999 | 50 | 6.8% |
| $150,000 to $199,999 | 20 | 2.7% |
| $200,000+ | 12 | 1.6% |
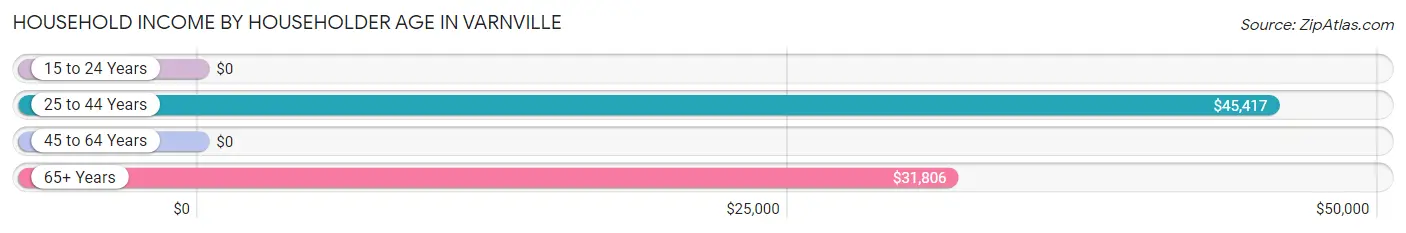
Household Income by Householder Age in Varnville
The median household income in Varnville is $38,092, with the highest median household income of $45,417 found in the 25 to 44 years age bracket for the primary householder. A total of 210 households (28.6%) fall into this category. Meanwhile, the 15 to 24 years age bracket for the primary householder has the lowest median household income of $0, with 2 households (0.3%) in this group.
| Income Bracket | # Households | Median Income |
| 15 to 24 Years | 2 (0.3%) | $0 |
| 25 to 44 Years | 210 (28.6%) | $45,417 |
| 45 to 64 Years | 239 (32.6%) | $0 |
| 65+ Years | 283 (38.6%) | $31,806 |
| Total | 734 (100.0%) | $38,092 |
Poverty in Varnville
Income Below Poverty by Sex and Age in Varnville
With 19.0% poverty level for males and 26.2% for females among the residents of Varnville, 16 and 17 year old males and under 5 year old females are the most vulnerable to poverty, with 20 males (69.0%) and 29 females (60.4%) in their respective age groups living below the poverty level.
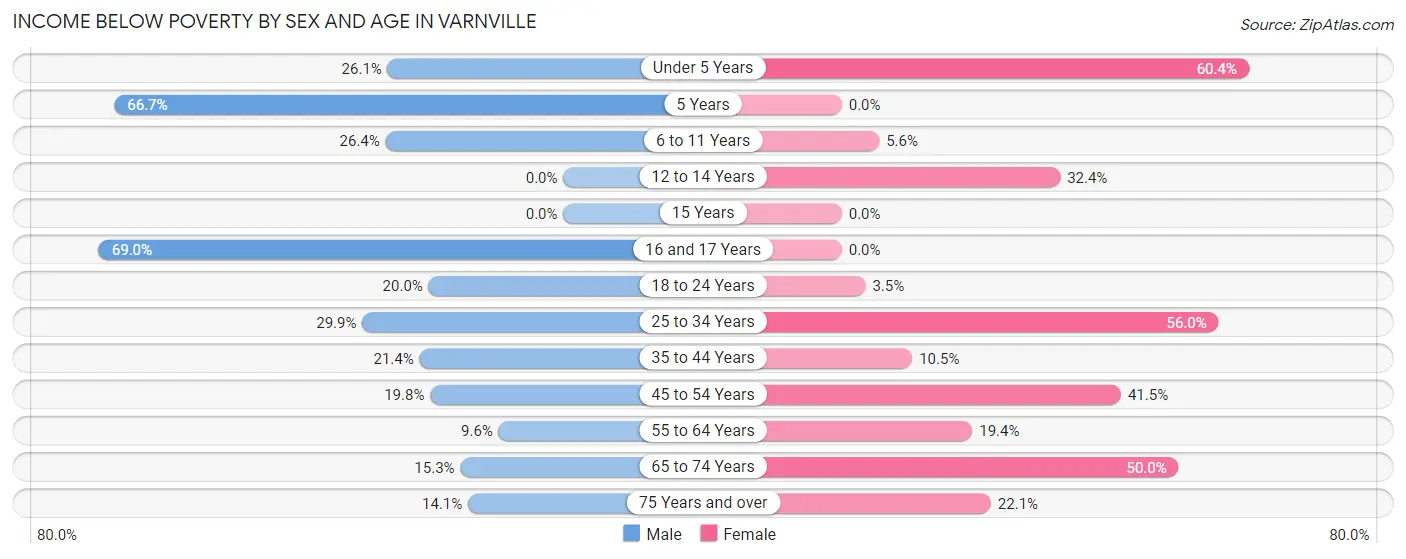
| Age Bracket | Male | Female |
| Under 5 Years | 12 (26.1%) | 29 (60.4%) |
| 5 Years | 10 (66.7%) | 0 (0.0%) |
| 6 to 11 Years | 19 (26.4%) | 7 (5.6%) |
| 12 to 14 Years | 0 (0.0%) | 12 (32.4%) |
| 15 Years | 0 (0.0%) | 0 (0.0%) |
| 16 and 17 Years | 20 (69.0%) | 0 (0.0%) |
| 18 to 24 Years | 40 (20.0%) | 2 (3.5%) |
| 25 to 34 Years | 20 (29.8%) | 47 (55.9%) |
| 35 to 44 Years | 41 (21.3%) | 16 (10.5%) |
| 45 to 54 Years | 17 (19.8%) | 34 (41.5%) |
| 55 to 64 Years | 12 (9.6%) | 25 (19.4%) |
| 65 to 74 Years | 13 (15.3%) | 57 (50.0%) |
| 75 Years and over | 14 (14.1%) | 29 (22.1%) |
| Total | 218 (19.0%) | 258 (26.2%) |
Income Above Poverty by Sex and Age in Varnville
According to the poverty statistics in Varnville, males aged 12 to 14 years and females aged 5 years are the age groups that are most secure financially, with 100.0% of males and 100.0% of females in these age groups living above the poverty line.
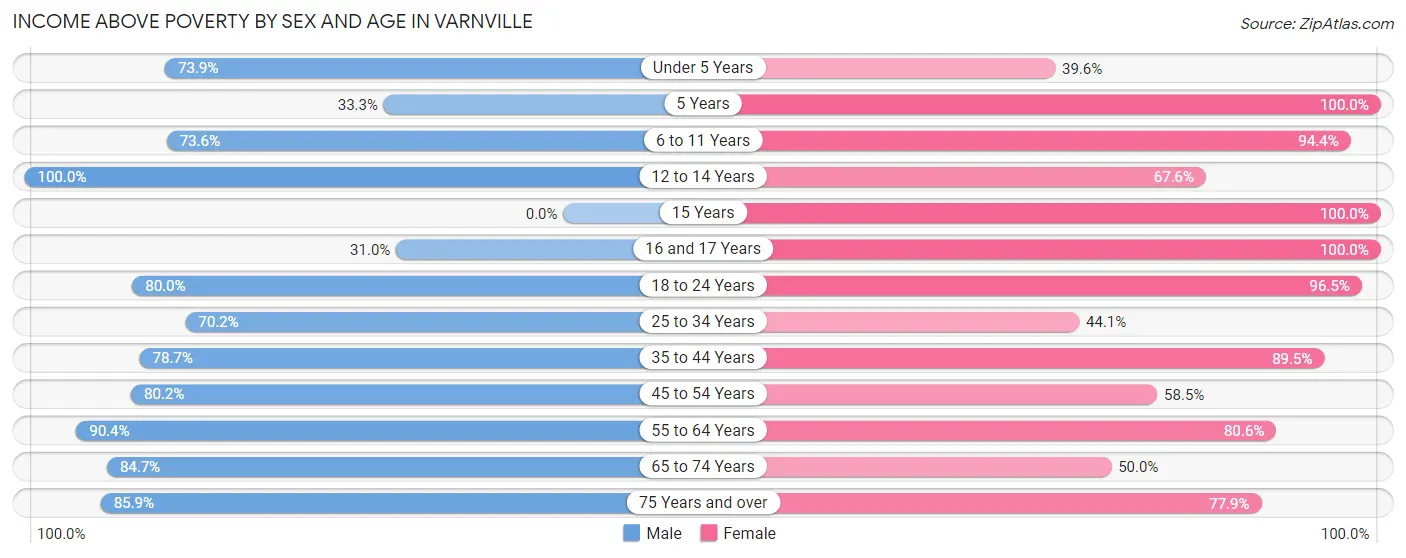
| Age Bracket | Male | Female |
| Under 5 Years | 34 (73.9%) | 19 (39.6%) |
| 5 Years | 5 (33.3%) | 14 (100.0%) |
| 6 to 11 Years | 53 (73.6%) | 119 (94.4%) |
| 12 to 14 Years | 129 (100.0%) | 25 (67.6%) |
| 15 Years | 0 (0.0%) | 5 (100.0%) |
| 16 and 17 Years | 9 (31.0%) | 5 (100.0%) |
| 18 to 24 Years | 160 (80.0%) | 55 (96.5%) |
| 25 to 34 Years | 47 (70.2%) | 37 (44.1%) |
| 35 to 44 Years | 151 (78.6%) | 137 (89.5%) |
| 45 to 54 Years | 69 (80.2%) | 48 (58.5%) |
| 55 to 64 Years | 113 (90.4%) | 104 (80.6%) |
| 65 to 74 Years | 72 (84.7%) | 57 (50.0%) |
| 75 Years and over | 85 (85.9%) | 102 (77.9%) |
| Total | 927 (81.0%) | 727 (73.8%) |
Income Below Poverty Among Married-Couple Families in Varnville
The poverty statistics for married-couple families in Varnville show that 2.9% or 10 of the total 341 families live below the poverty line. Families with 3 or 4 children have the highest poverty rate of 37.0%, comprising of 10 families. On the other hand, families with no children have the lowest poverty rate of 0.0%, which includes 0 families.
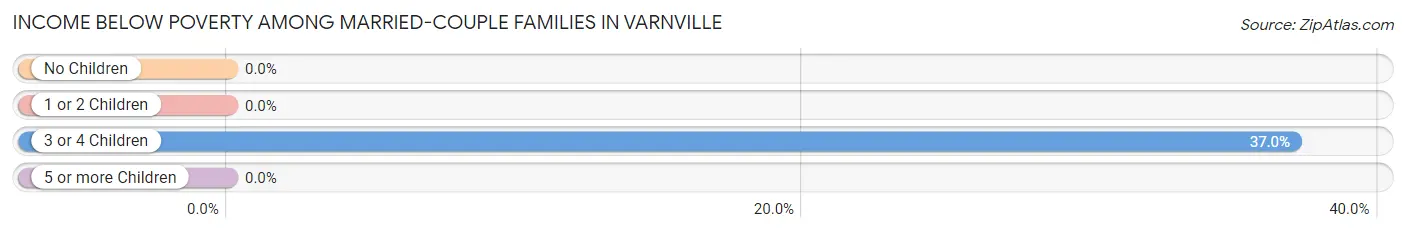
| Children | Above Poverty | Below Poverty |
| No Children | 193 (100.0%) | 0 (0.0%) |
| 1 or 2 Children | 121 (100.0%) | 0 (0.0%) |
| 3 or 4 Children | 17 (63.0%) | 10 (37.0%) |
| 5 or more Children | 0 (0.0%) | 0 (0.0%) |
| Total | 331 (97.1%) | 10 (2.9%) |
Income Below Poverty Among Single-Parent Households in Varnville
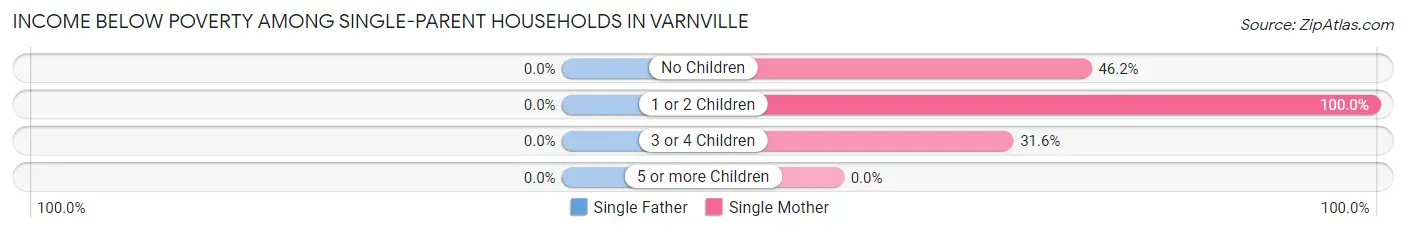
| Children | Single Father | Single Mother |
| No Children | 0 (0.0%) | 18 (46.2%) |
| 1 or 2 Children | 0 (0.0%) | 23 (100.0%) |
| 3 or 4 Children | 0 (0.0%) | 12 (31.6%) |
| 5 or more Children | 0 (0.0%) | 0 (0.0%) |
| Total | 0 (0.0%) | 53 (53.0%) |
Income Below Poverty Among Married-Couple vs Single-Parent Households in Varnville
The poverty data for Varnville shows that 10 of the married-couple family households (2.9%) and 53 of the single-parent households (50.5%) are living below the poverty level. Within the married-couple family households, those with 3 or 4 children have the highest poverty rate, with 10 households (37.0%) falling below the poverty line. Among the single-parent households, those with 1 or 2 children have the highest poverty rate, with 23 household (100.0%) living below poverty.
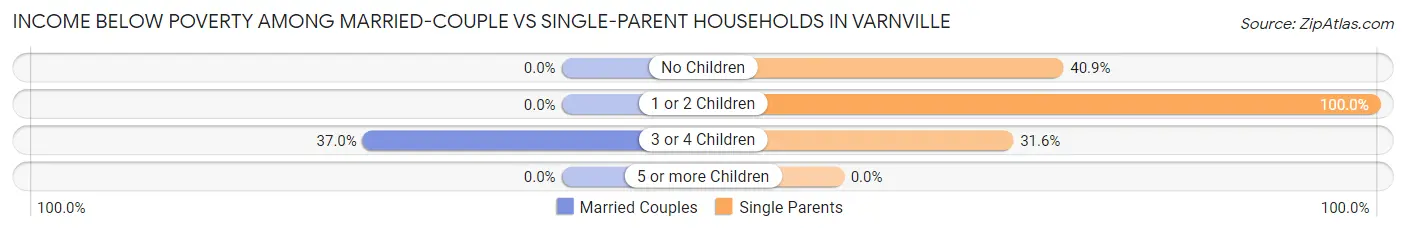
| Children | Married-Couple Families | Single-Parent Households |
| No Children | 0 (0.0%) | 18 (40.9%) |
| 1 or 2 Children | 0 (0.0%) | 23 (100.0%) |
| 3 or 4 Children | 10 (37.0%) | 12 (31.6%) |
| 5 or more Children | 0 (0.0%) | 0 (0.0%) |
| Total | 10 (2.9%) | 53 (50.5%) |
Race in Varnville
The most populous races in Varnville are Black / African American (1,303 | 60.0%), White / Caucasian (752 | 34.6%), and Asian (69 | 3.2%).
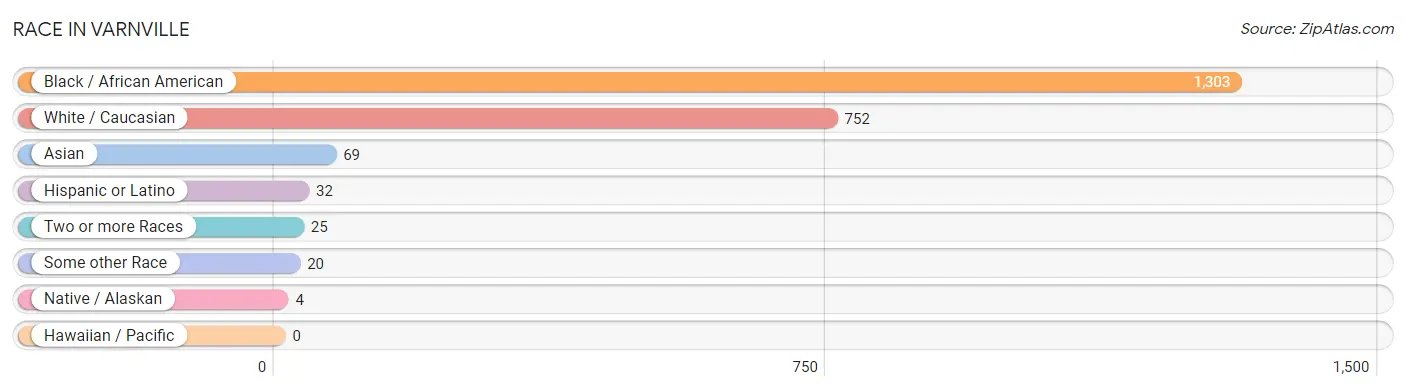
| Race | # Population | % Population |
| Asian | 69 | 3.2% |
| Black / African American | 1,303 | 60.0% |
| Hawaiian / Pacific | 0 | 0.0% |
| Hispanic or Latino | 32 | 1.5% |
| Native / Alaskan | 4 | 0.2% |
| White / Caucasian | 752 | 34.6% |
| Two or more Races | 25 | 1.1% |
| Some other Race | 20 | 0.9% |
| Total | 2,173 | 100.0% |
Ancestry in Varnville
The most populous ancestries reported in Varnville are English (105 | 4.8%), European (92 | 4.2%), German (86 | 4.0%), American (80 | 3.7%), and Scottish (62 | 2.9%), together accounting for 19.6% of all Varnville residents.
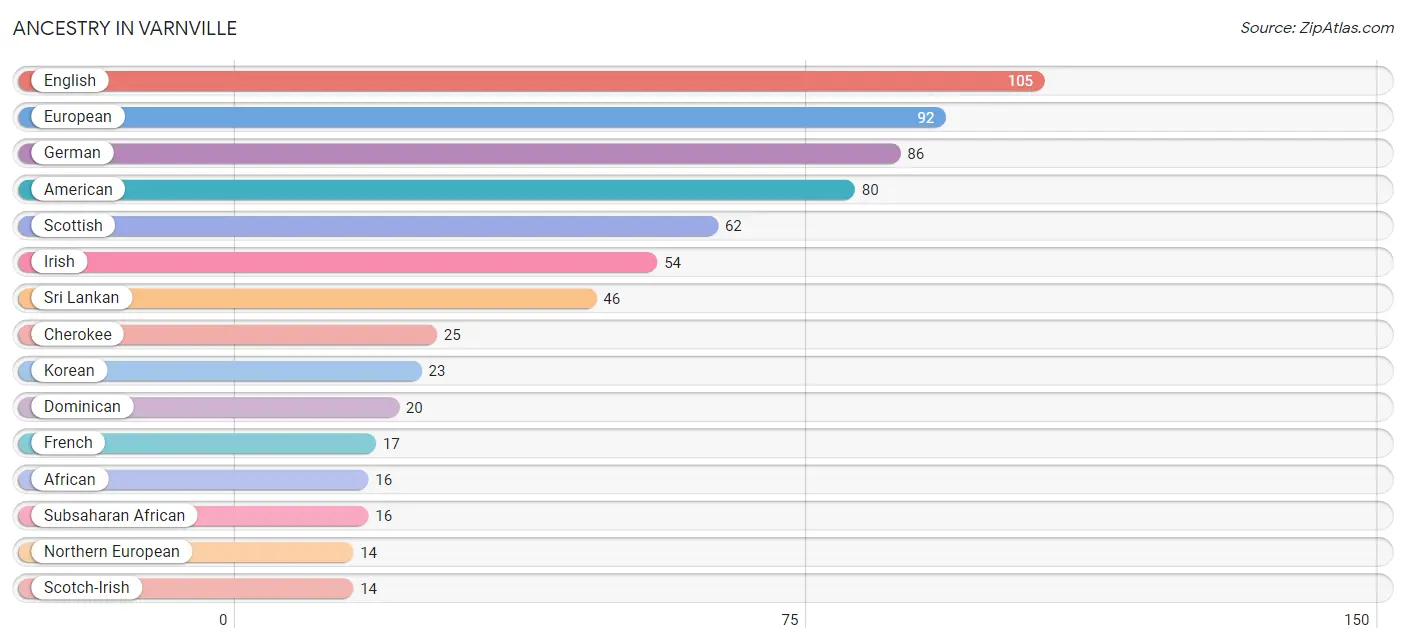
| Ancestry | # Population | % Population |
| African | 16 | 0.7% |
| American | 80 | 3.7% |
| Cherokee | 25 | 1.1% |
| Dominican | 20 | 0.9% |
| Dutch | 8 | 0.4% |
| English | 105 | 4.8% |
| European | 92 | 4.2% |
| Finnish | 5 | 0.2% |
| French | 17 | 0.8% |
| French Canadian | 3 | 0.1% |
| German | 86 | 4.0% |
| Irish | 54 | 2.5% |
| Italian | 12 | 0.5% |
| Korean | 23 | 1.1% |
| Mexican | 12 | 0.5% |
| Northern European | 14 | 0.6% |
| Pennsylvania German | 4 | 0.2% |
| Portuguese | 12 | 0.5% |
| Scandinavian | 2 | 0.1% |
| Scotch-Irish | 14 | 0.6% |
| Scottish | 62 | 2.9% |
| Sri Lankan | 46 | 2.1% |
| Subsaharan African | 16 | 0.7% |
| Swedish | 13 | 0.6% |
| Welsh | 6 | 0.3% | View All 25 Rows |
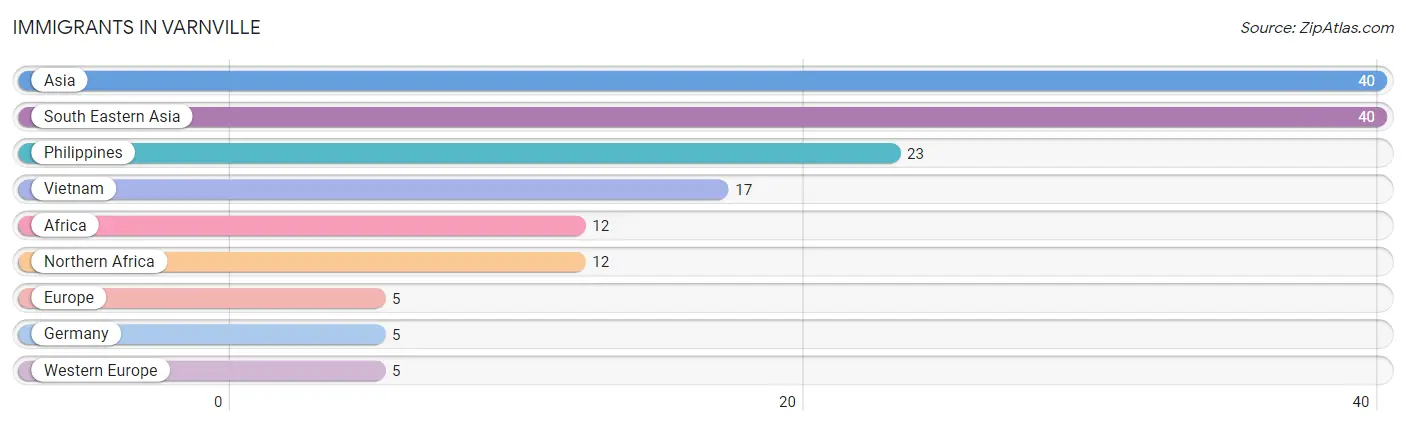
Immigrants in Varnville
The most numerous immigrant groups reported in Varnville came from Asia (40 | 1.8%), South Eastern Asia (40 | 1.8%), Philippines (23 | 1.1%), Vietnam (17 | 0.8%), and Africa (12 | 0.5%), together accounting for 6.1% of all Varnville residents.
| Immigration Origin | # Population | % Population |
| Africa | 12 | 0.5% |
| Asia | 40 | 1.8% |
| Europe | 5 | 0.2% |
| Germany | 5 | 0.2% |
| Northern Africa | 12 | 0.5% |
| Philippines | 23 | 1.1% |
| South Eastern Asia | 40 | 1.8% |
| Vietnam | 17 | 0.8% |
| Western Europe | 5 | 0.2% | View All 9 Rows |
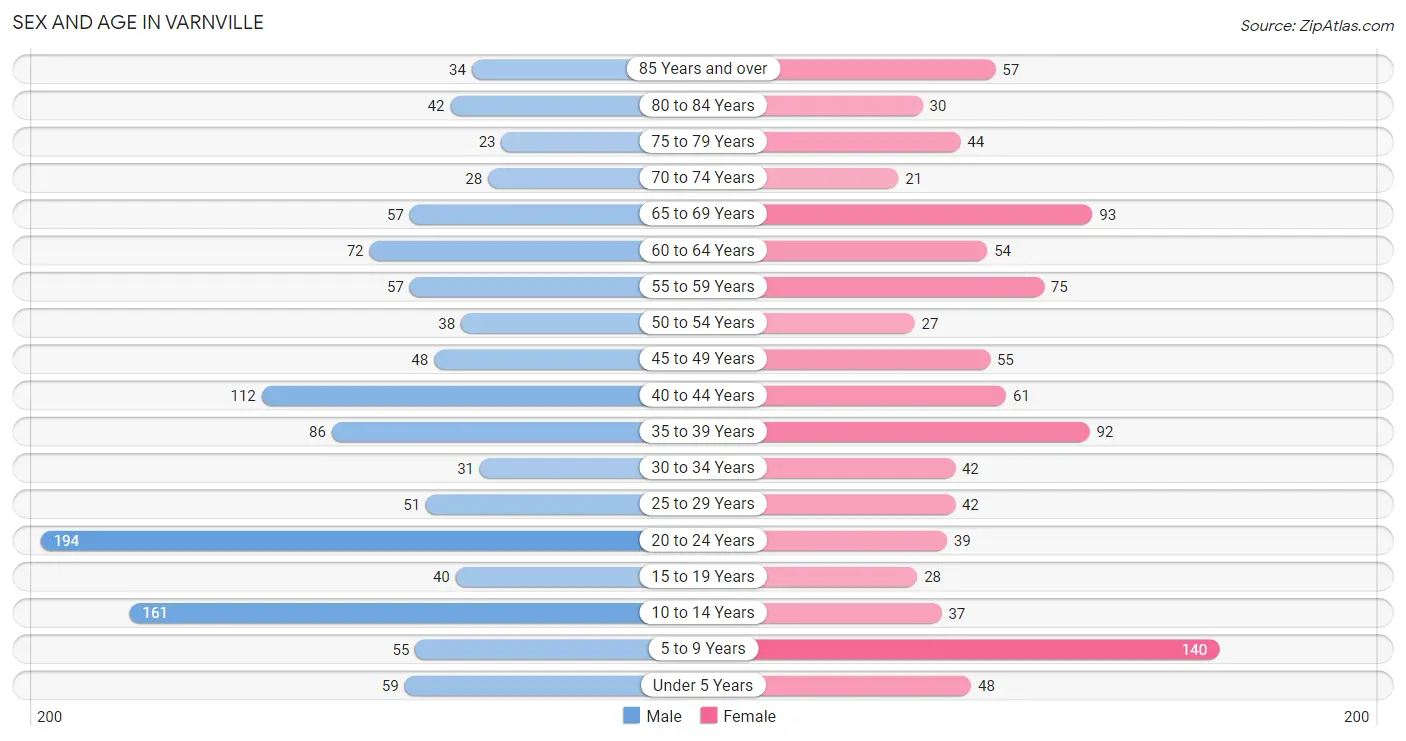
Sex and Age in Varnville
Sex and Age in Varnville
The most populous age groups in Varnville are 20 to 24 Years (194 | 16.3%) for men and 5 to 9 Years (140 | 14.2%) for women.
| Age Bracket | Male | Female |
| Under 5 Years | 59 (5.0%) | 48 (4.9%) |
| 5 to 9 Years | 55 (4.6%) | 140 (14.2%) |
| 10 to 14 Years | 161 (13.6%) | 37 (3.8%) |
| 15 to 19 Years | 40 (3.4%) | 28 (2.8%) |
| 20 to 24 Years | 194 (16.3%) | 39 (4.0%) |
| 25 to 29 Years | 51 (4.3%) | 42 (4.3%) |
| 30 to 34 Years | 31 (2.6%) | 42 (4.3%) |
| 35 to 39 Years | 86 (7.2%) | 92 (9.3%) |
| 40 to 44 Years | 112 (9.4%) | 61 (6.2%) |
| 45 to 49 Years | 48 (4.0%) | 55 (5.6%) |
| 50 to 54 Years | 38 (3.2%) | 27 (2.7%) |
| 55 to 59 Years | 57 (4.8%) | 75 (7.6%) |
| 60 to 64 Years | 72 (6.1%) | 54 (5.5%) |
| 65 to 69 Years | 57 (4.8%) | 93 (9.4%) |
| 70 to 74 Years | 28 (2.4%) | 21 (2.1%) |
| 75 to 79 Years | 23 (1.9%) | 44 (4.5%) |
| 80 to 84 Years | 42 (3.5%) | 30 (3.0%) |
| 85 Years and over | 34 (2.9%) | 57 (5.8%) |
| Total | 1,188 (100.0%) | 985 (100.0%) |
Families and Households in Varnville
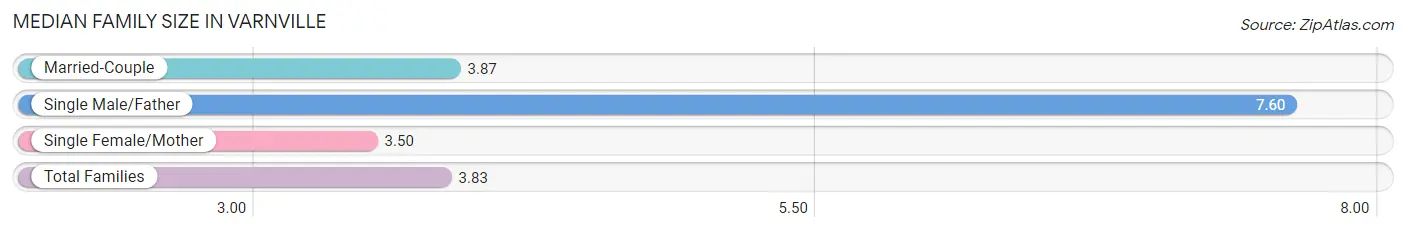
Median Family Size in Varnville
The median family size in Varnville is 3.83 persons per family, with single male/father families (5 | 1.1%) accounting for the largest median family size of 7.6 persons per family. On the other hand, single female/mother families (100 | 22.4%) represent the smallest median family size with 3.50 persons per family.
| Family Type | # Families | Family Size |
| Married-Couple | 341 (76.5%) | 3.87 |
| Single Male/Father | 5 (1.1%) | 7.60 |
| Single Female/Mother | 100 (22.4%) | 3.50 |
| Total Families | 446 (100.0%) | 3.83 |
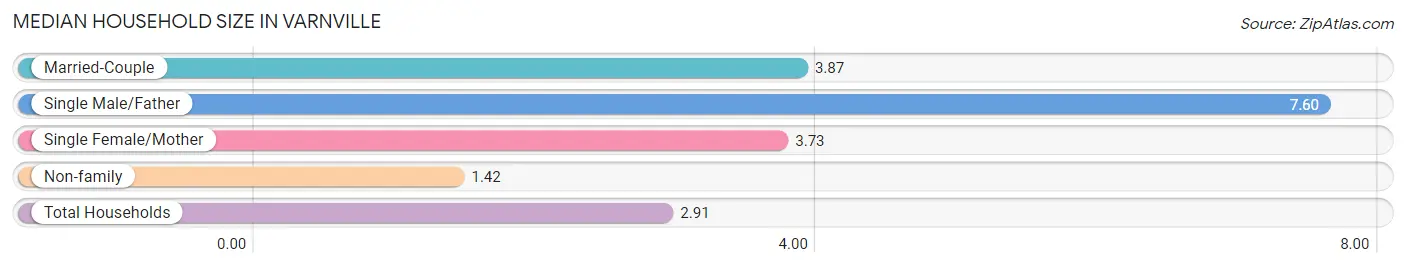
Median Household Size in Varnville
The median household size in Varnville is 2.91 persons per household, with single male/father households (5 | 0.7%) accounting for the largest median household size of 7.6 persons per household. non-family households (288 | 39.2%) represent the smallest median household size with 1.42 persons per household.
| Household Type | # Households | Household Size |
| Married-Couple | 341 (46.5%) | 3.87 |
| Single Male/Father | 5 (0.7%) | 7.60 |
| Single Female/Mother | 100 (13.6%) | 3.73 |
| Non-family | 288 (39.2%) | 1.42 |
| Total Households | 734 (100.0%) | 2.91 |
Household Size by Marriage Status in Varnville
Out of a total of 734 households in Varnville, 446 (60.8%) are family households, while 288 (39.2%) are nonfamily households. The most numerous type of family households are 2-person households, comprising 195, and the most common type of nonfamily households are 1-person households, comprising 253.
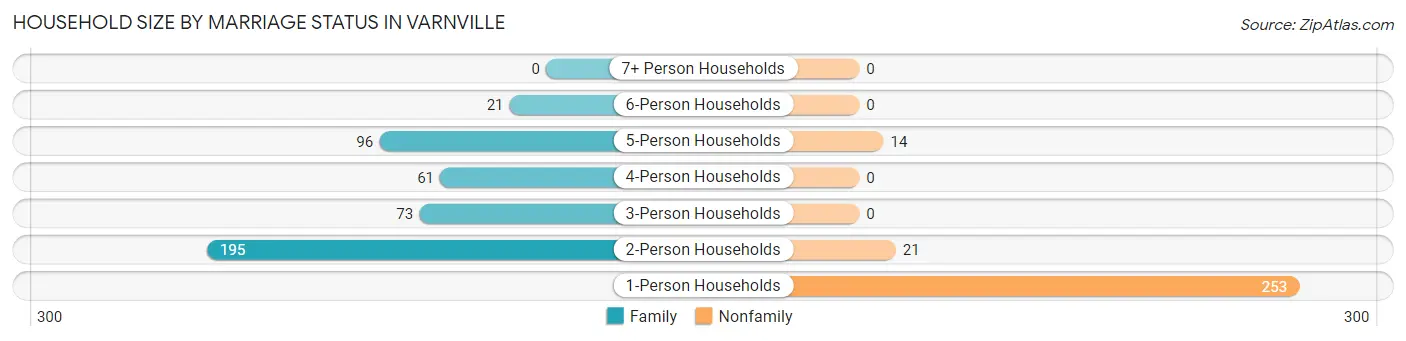
| Household Size | Family Households | Nonfamily Households |
| 1-Person Households | - | 253 (34.5%) |
| 2-Person Households | 195 (26.6%) | 21 (2.9%) |
| 3-Person Households | 73 (10.0%) | 0 (0.0%) |
| 4-Person Households | 61 (8.3%) | 0 (0.0%) |
| 5-Person Households | 96 (13.1%) | 14 (1.9%) |
| 6-Person Households | 21 (2.9%) | 0 (0.0%) |
| 7+ Person Households | 0 (0.0%) | 0 (0.0%) |
| Total | 446 (60.8%) | 288 (39.2%) |
Female Fertility in Varnville
Fertility by Age in Varnville
Average fertility rate in Varnville is 47.0 births per 1,000 women. Women in the age bracket of 20 to 34 years have the highest fertility rate with 73.0 births per 1,000 women. Women in the age bracket of 20 to 34 years acount for 52.9% of all women with births.
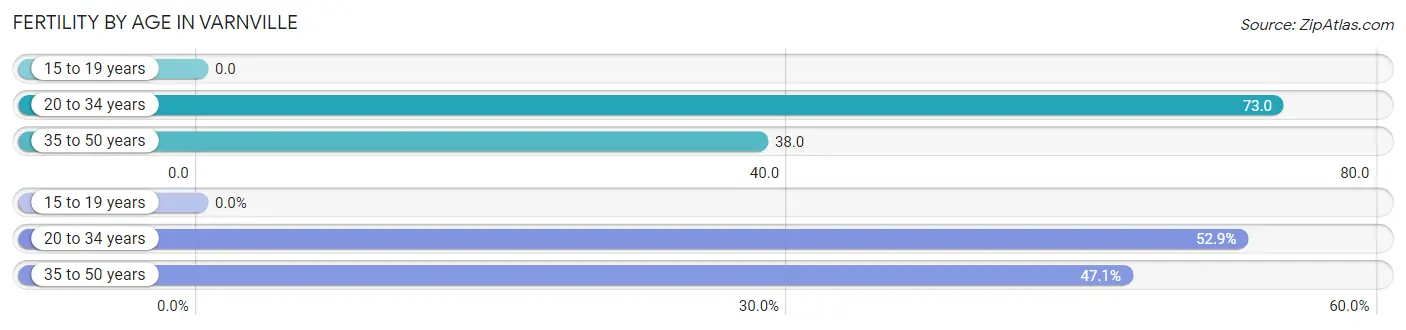
| Age Bracket | Women with Births | Births / 1,000 Women |
| 15 to 19 years | 0 (0.0%) | 0.0 |
| 20 to 34 years | 9 (52.9%) | 73.0 |
| 35 to 50 years | 8 (47.1%) | 38.0 |
| Total | 17 (100.0%) | 47.0 |
Fertility by Age by Marriage Status in Varnville
47.1% of women with births (17) in Varnville are married. The highest percentage of unmarried women with births falls into 20 to 34 years age bracket with 100.0% of them unmarried at the time of birth, while the lowest percentage of unmarried women with births belong to 35 to 50 years age bracket with 0.0% of them unmarried.
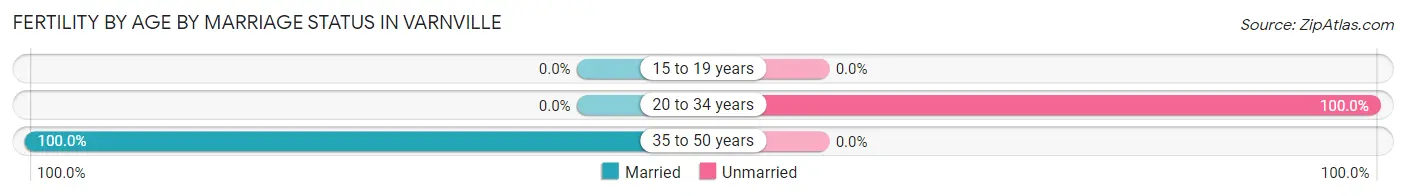
| Age Bracket | Married | Unmarried |
| 15 to 19 years | 0 (0.0%) | 0 (0.0%) |
| 20 to 34 years | 0 (0.0%) | 9 (100.0%) |
| 35 to 50 years | 8 (100.0%) | 0 (0.0%) |
| Total | 8 (47.1%) | 9 (52.9%) |
Fertility by Education in Varnville
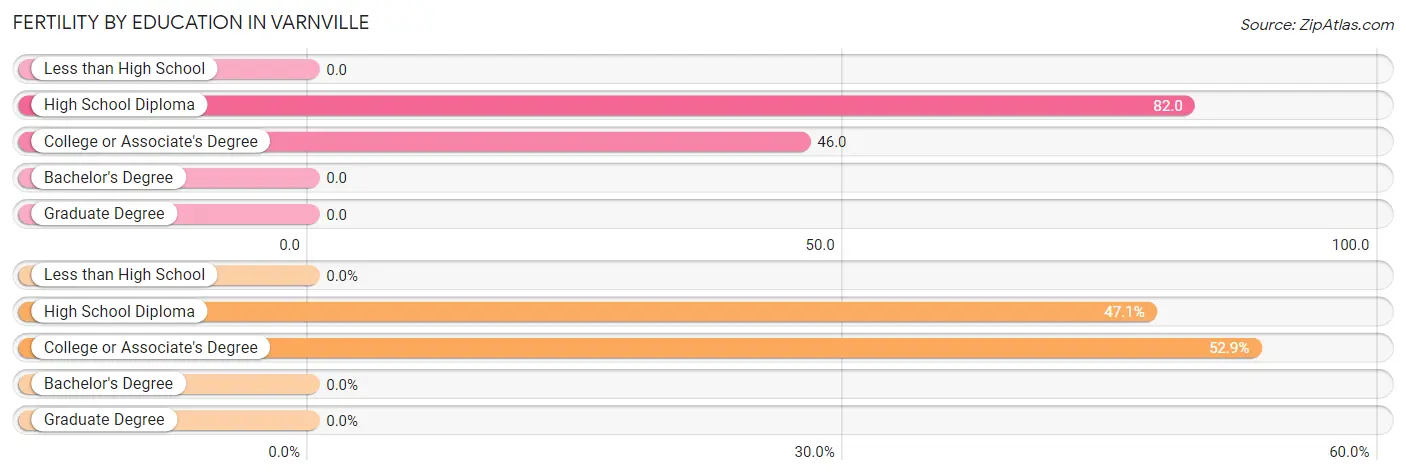
| Educational Attainment | Women with Births | Births / 1,000 Women |
| Less than High School | 0 (0.0%) | 0.0 |
| High School Diploma | 8 (47.1%) | 82.0 |
| College or Associate's Degree | 9 (52.9%) | 46.0 |
| Bachelor's Degree | 0 (0.0%) | 0.0 |
| Graduate Degree | 0 (0.0%) | 0.0 |
| Total | 17 (100.0%) | 47.0 |
Fertility by Education by Marriage Status in Varnville
52.9% of women with births in Varnville are unmarried. Women with the educational attainment of high school diploma are most likely to be married with 100.0% of them married at childbirth, while women with the educational attainment of college or associate's degree are least likely to be married with 100.0% of them unmarried at childbirth.
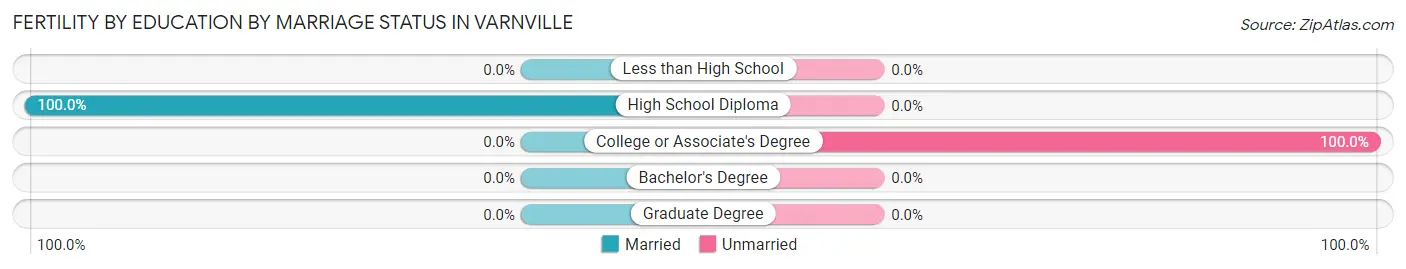
| Educational Attainment | Married | Unmarried |
| Less than High School | 0 (0.0%) | 0 (0.0%) |
| High School Diploma | 8 (100.0%) | 0 (0.0%) |
| College or Associate's Degree | 0 (0.0%) | 9 (100.0%) |
| Bachelor's Degree | 0 (0.0%) | 0 (0.0%) |
| Graduate Degree | 0 (0.0%) | 0 (0.0%) |
| Total | 8 (47.1%) | 9 (52.9%) |
Employment Characteristics in Varnville
Employment by Class of Employer in Varnville
Among the 786 employed individuals in Varnville, private company employees (493 | 62.7%), local government employees (116 | 14.8%), and state government employees (83 | 10.6%) make up the most common classes of employment.
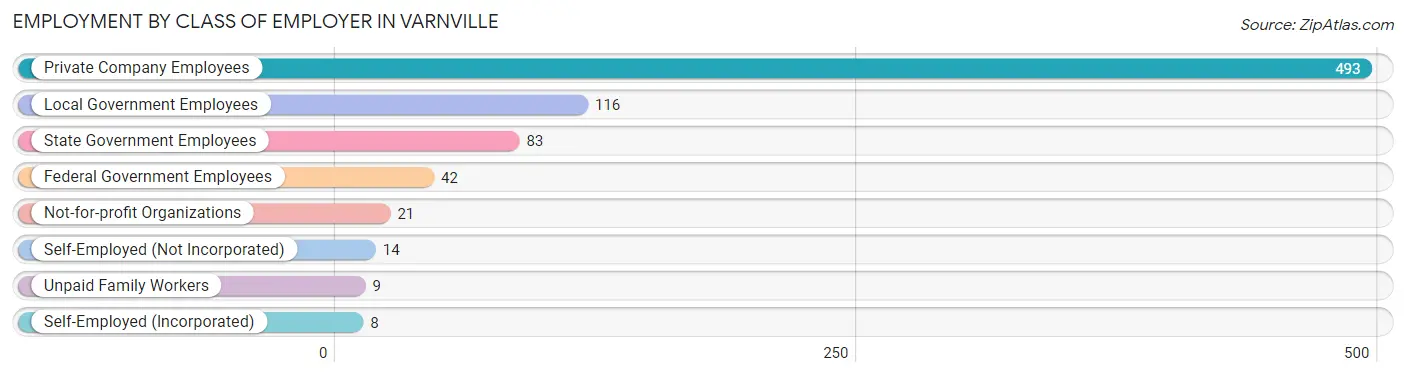
| Employer Class | # Employees | % Employees |
| Private Company Employees | 493 | 62.7% |
| Self-Employed (Incorporated) | 8 | 1.0% |
| Self-Employed (Not Incorporated) | 14 | 1.8% |
| Not-for-profit Organizations | 21 | 2.7% |
| Local Government Employees | 116 | 14.8% |
| State Government Employees | 83 | 10.6% |
| Federal Government Employees | 42 | 5.3% |
| Unpaid Family Workers | 9 | 1.1% |
| Total | 786 | 100.0% |
Employment Status by Age in Varnville
According to the labor force statistics for Varnville, out of the total population over 16 years of age (1,668), 55.9% or 932 individuals are in the labor force, with 14.8% or 138 of them unemployed. The age group with the highest labor force participation rate is 25 to 29 years, with 100.0% or 93 individuals in the labor force. Within the labor force, the 20 to 24 years age range has the highest percentage of unemployed individuals, with 59.0% or 111 of them being unemployed.
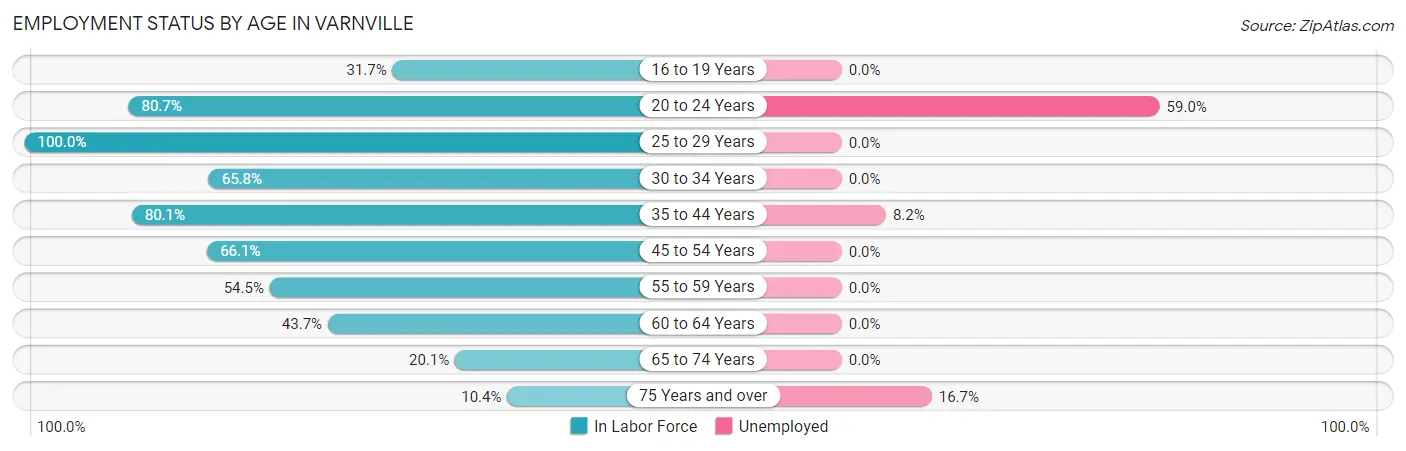
| Age Bracket | In Labor Force | Unemployed |
| 16 to 19 Years | 20 (31.7%) | 0 (0.0%) |
| 20 to 24 Years | 188 (80.7%) | 111 (59.0%) |
| 25 to 29 Years | 93 (100.0%) | 0 (0.0%) |
| 30 to 34 Years | 48 (65.8%) | 0 (0.0%) |
| 35 to 44 Years | 281 (80.1%) | 23 (8.2%) |
| 45 to 54 Years | 111 (66.1%) | 0 (0.0%) |
| 55 to 59 Years | 72 (54.5%) | 0 (0.0%) |
| 60 to 64 Years | 55 (43.7%) | 0 (0.0%) |
| 65 to 74 Years | 40 (20.1%) | 0 (0.0%) |
| 75 Years and over | 24 (10.4%) | 4 (16.7%) |
| Total | 932 (55.9%) | 138 (14.8%) |
Employment Status by Educational Attainment in Varnville
According to labor force statistics for Varnville, 70.0% of individuals (660) out of the total population between 25 and 64 years of age (943) are in the labor force, with 3.5% or 23 of them being unemployed. The group with the highest labor force participation rate are those with the educational attainment of college / associate degree, with 77.8% or 242 individuals in the labor force. Within the labor force, individuals with high school diploma education have the highest percentage of unemployment, with 9.1% or 23 of them being unemployed.
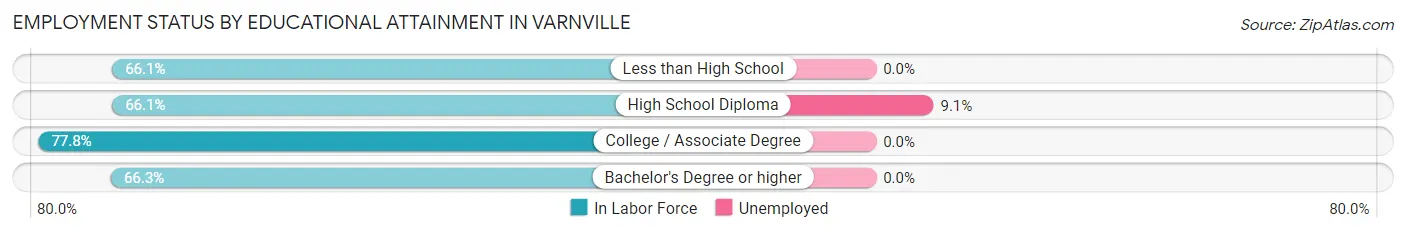
| Educational Attainment | In Labor Force | Unemployed |
| Less than High School | 41 (66.1%) | 0 (0.0%) |
| High School Diploma | 253 (66.1%) | 35 (9.1%) |
| College / Associate Degree | 242 (77.8%) | 0 (0.0%) |
| Bachelor's Degree or higher | 124 (66.3%) | 0 (0.0%) |
| Total | 660 (70.0%) | 33 (3.5%) |
Employment Occupations by Sex in Varnville
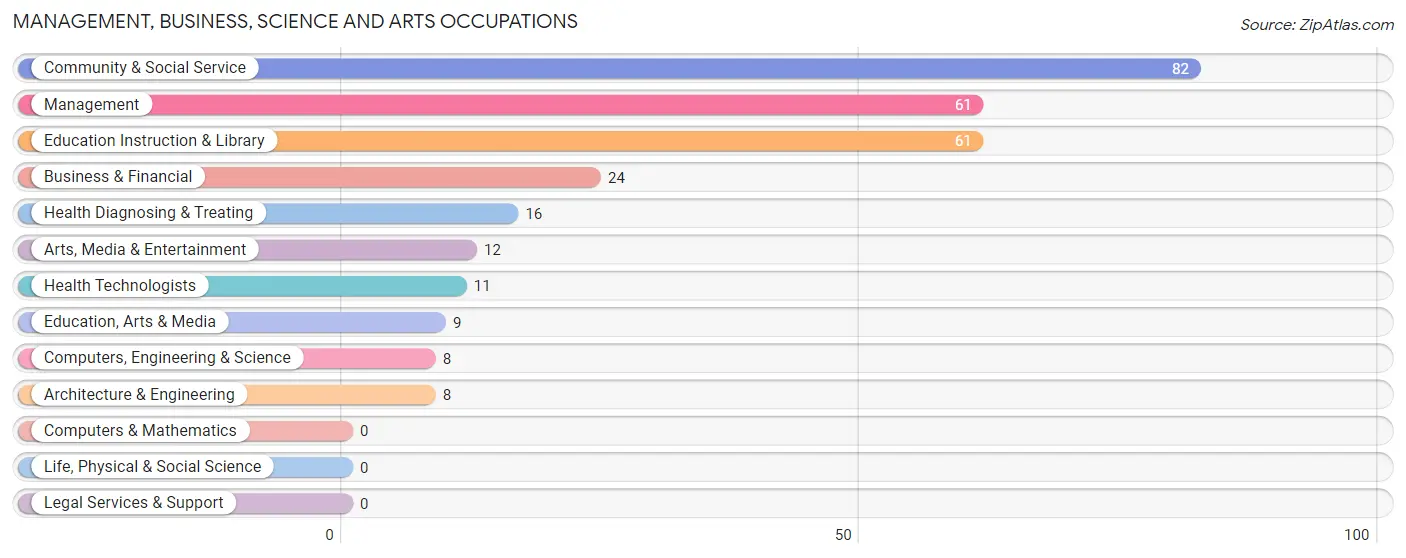
Management, Business, Science and Arts Occupations
The most common Management, Business, Science and Arts occupations in Varnville are Community & Social Service (82 | 10.3%), Management (61 | 7.7%), Education Instruction & Library (61 | 7.7%), Business & Financial (24 | 3.0%), and Health Diagnosing & Treating (16 | 2.0%).
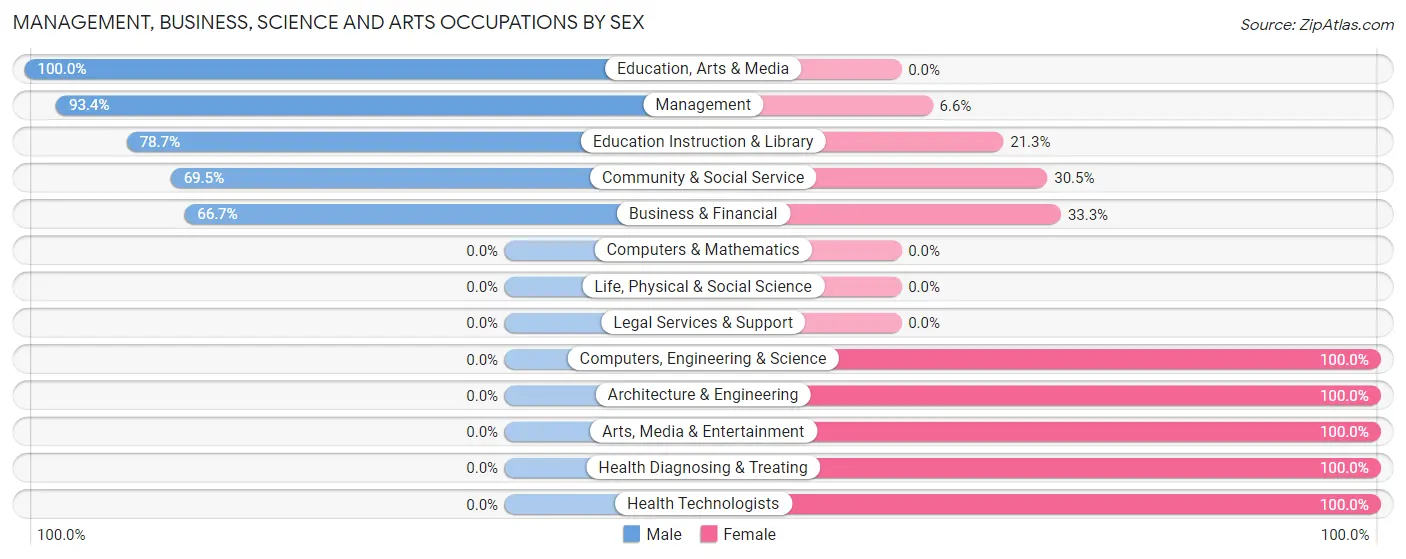
Management, Business, Science and Arts Occupations by Sex
Within the Management, Business, Science and Arts occupations in Varnville, the most male-oriented occupations are Education, Arts & Media (100.0%), Management (93.4%), and Education Instruction & Library (78.7%), while the most female-oriented occupations are Computers, Engineering & Science (100.0%), Architecture & Engineering (100.0%), and Arts, Media & Entertainment (100.0%).
| Occupation | Male | Female |
| Management | 57 (93.4%) | 4 (6.6%) |
| Business & Financial | 16 (66.7%) | 8 (33.3%) |
| Computers, Engineering & Science | 0 (0.0%) | 8 (100.0%) |
| Computers & Mathematics | 0 (0.0%) | 0 (0.0%) |
| Architecture & Engineering | 0 (0.0%) | 8 (100.0%) |
| Life, Physical & Social Science | 0 (0.0%) | 0 (0.0%) |
| Community & Social Service | 57 (69.5%) | 25 (30.5%) |
| Education, Arts & Media | 9 (100.0%) | 0 (0.0%) |
| Legal Services & Support | 0 (0.0%) | 0 (0.0%) |
| Education Instruction & Library | 48 (78.7%) | 13 (21.3%) |
| Arts, Media & Entertainment | 0 (0.0%) | 12 (100.0%) |
| Health Diagnosing & Treating | 0 (0.0%) | 16 (100.0%) |
| Health Technologists | 0 (0.0%) | 11 (100.0%) |
| Total (Category) | 130 (68.1%) | 61 (31.9%) |
| Total (Overall) | 432 (54.4%) | 362 (45.6%) |
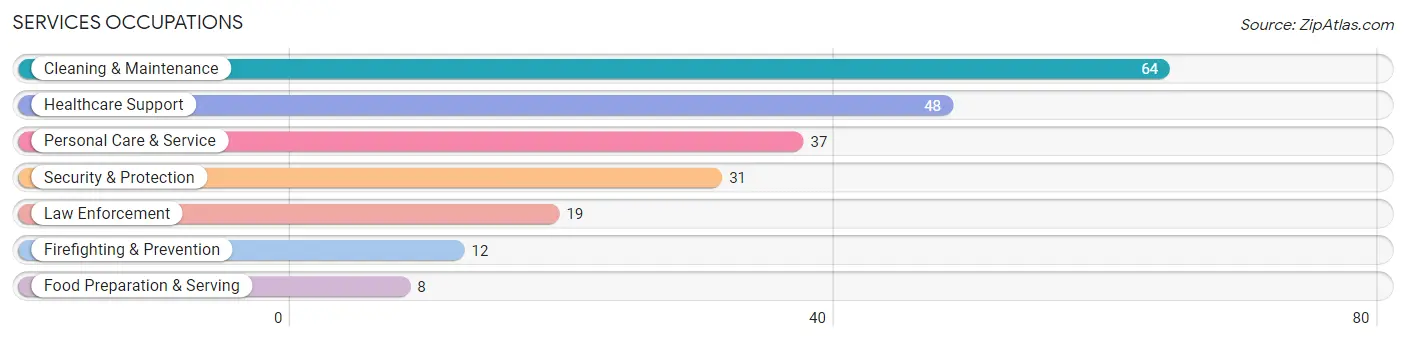
Services Occupations
The most common Services occupations in Varnville are Cleaning & Maintenance (64 | 8.1%), Healthcare Support (48 | 6.0%), Personal Care & Service (37 | 4.7%), Security & Protection (31 | 3.9%), and Law Enforcement (19 | 2.4%).
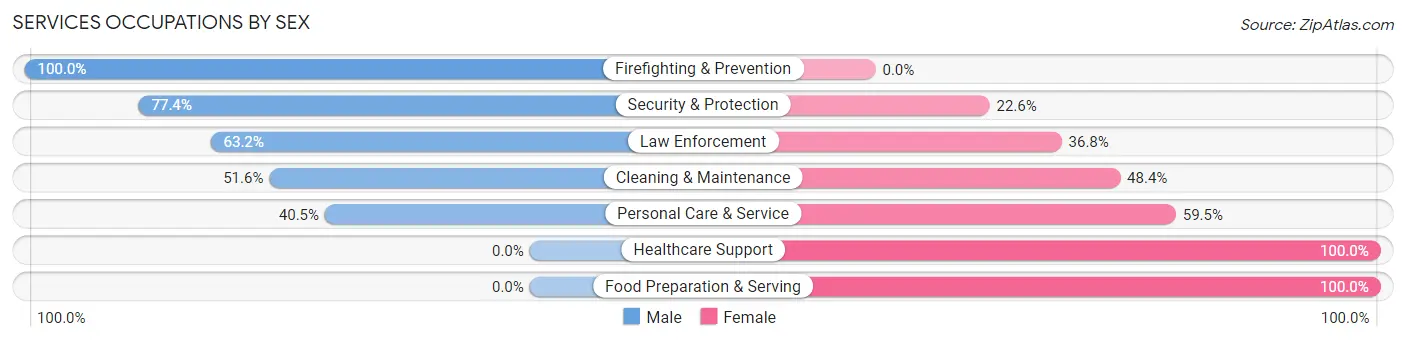
Services Occupations by Sex
Within the Services occupations in Varnville, the most male-oriented occupations are Firefighting & Prevention (100.0%), Security & Protection (77.4%), and Law Enforcement (63.2%), while the most female-oriented occupations are Healthcare Support (100.0%), Food Preparation & Serving (100.0%), and Personal Care & Service (59.5%).
| Occupation | Male | Female |
| Healthcare Support | 0 (0.0%) | 48 (100.0%) |
| Security & Protection | 24 (77.4%) | 7 (22.6%) |
| Firefighting & Prevention | 12 (100.0%) | 0 (0.0%) |
| Law Enforcement | 12 (63.2%) | 7 (36.8%) |
| Food Preparation & Serving | 0 (0.0%) | 8 (100.0%) |
| Cleaning & Maintenance | 33 (51.6%) | 31 (48.4%) |
| Personal Care & Service | 15 (40.5%) | 22 (59.5%) |
| Total (Category) | 72 (38.3%) | 116 (61.7%) |
| Total (Overall) | 432 (54.4%) | 362 (45.6%) |
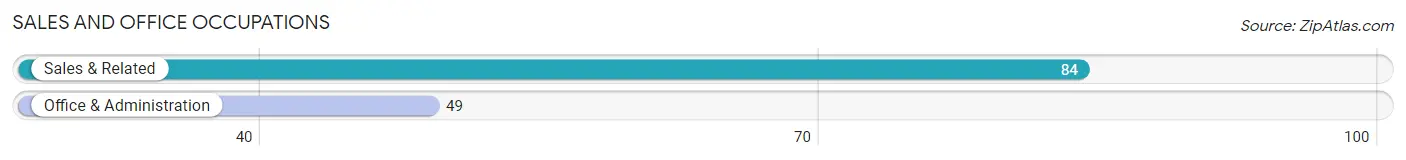
Sales and Office Occupations
The most common Sales and Office occupations in Varnville are Sales & Related (84 | 10.6%), and Office & Administration (49 | 6.2%).
Sales and Office Occupations by Sex
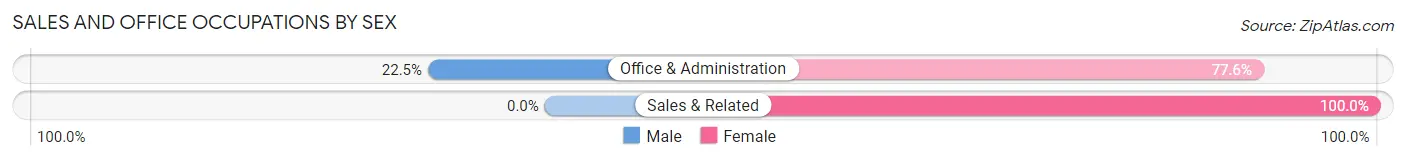
| Occupation | Male | Female |
| Sales & Related | 0 (0.0%) | 84 (100.0%) |
| Office & Administration | 11 (22.5%) | 38 (77.5%) |
| Total (Category) | 11 (8.3%) | 122 (91.7%) |
| Total (Overall) | 432 (54.4%) | 362 (45.6%) |
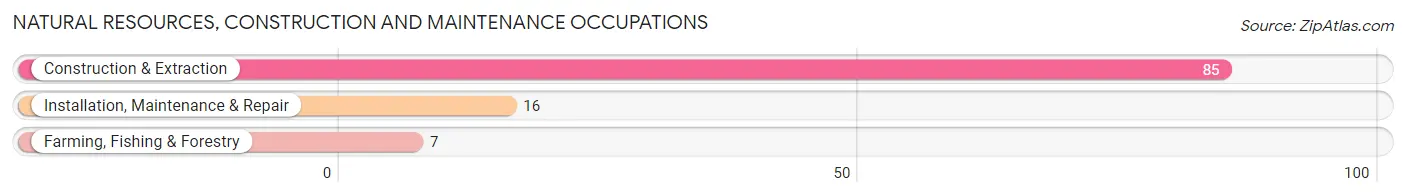
Natural Resources, Construction and Maintenance Occupations
The most common Natural Resources, Construction and Maintenance occupations in Varnville are Construction & Extraction (85 | 10.7%), Installation, Maintenance & Repair (16 | 2.0%), and Farming, Fishing & Forestry (7 | 0.9%).
Natural Resources, Construction and Maintenance Occupations by Sex
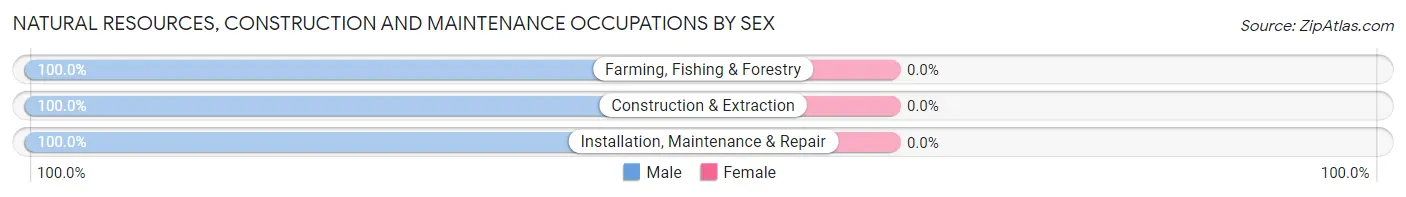
| Occupation | Male | Female |
| Farming, Fishing & Forestry | 7 (100.0%) | 0 (0.0%) |
| Construction & Extraction | 85 (100.0%) | 0 (0.0%) |
| Installation, Maintenance & Repair | 16 (100.0%) | 0 (0.0%) |
| Total (Category) | 108 (100.0%) | 0 (0.0%) |
| Total (Overall) | 432 (54.4%) | 362 (45.6%) |
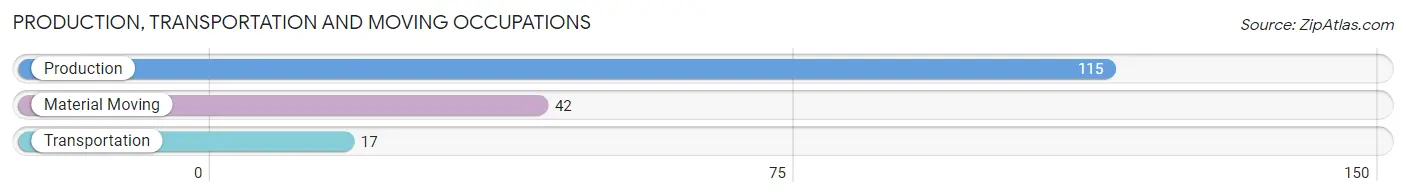
Production, Transportation and Moving Occupations
The most common Production, Transportation and Moving occupations in Varnville are Production (115 | 14.5%), Material Moving (42 | 5.3%), and Transportation (17 | 2.1%).
Production, Transportation and Moving Occupations by Sex
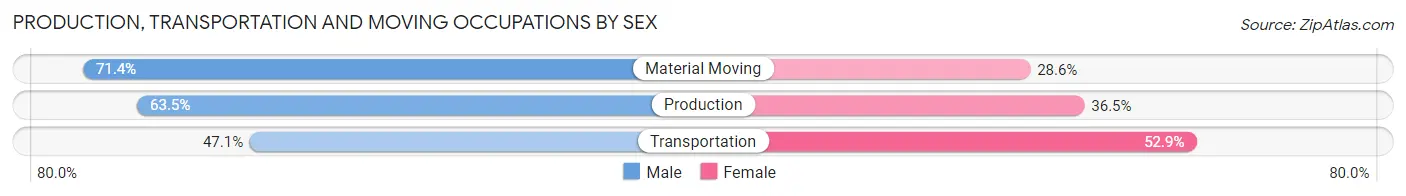
| Occupation | Male | Female |
| Production | 73 (63.5%) | 42 (36.5%) |
| Transportation | 8 (47.1%) | 9 (52.9%) |
| Material Moving | 30 (71.4%) | 12 (28.6%) |
| Total (Category) | 111 (63.8%) | 63 (36.2%) |
| Total (Overall) | 432 (54.4%) | 362 (45.6%) |
Employment Industries by Sex in Varnville
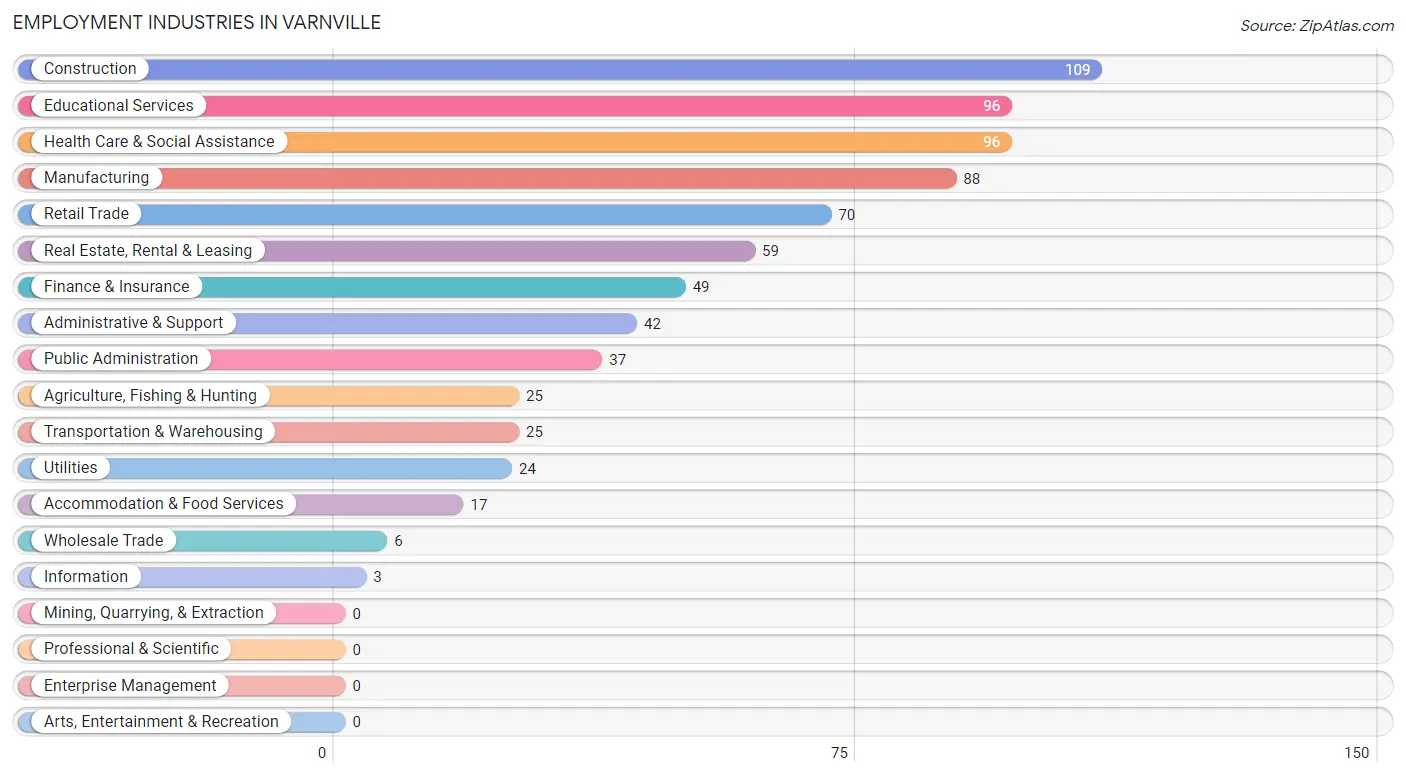
Employment Industries in Varnville
The major employment industries in Varnville include Construction (109 | 13.7%), Educational Services (96 | 12.1%), Health Care & Social Assistance (96 | 12.1%), Manufacturing (88 | 11.1%), and Retail Trade (70 | 8.8%).
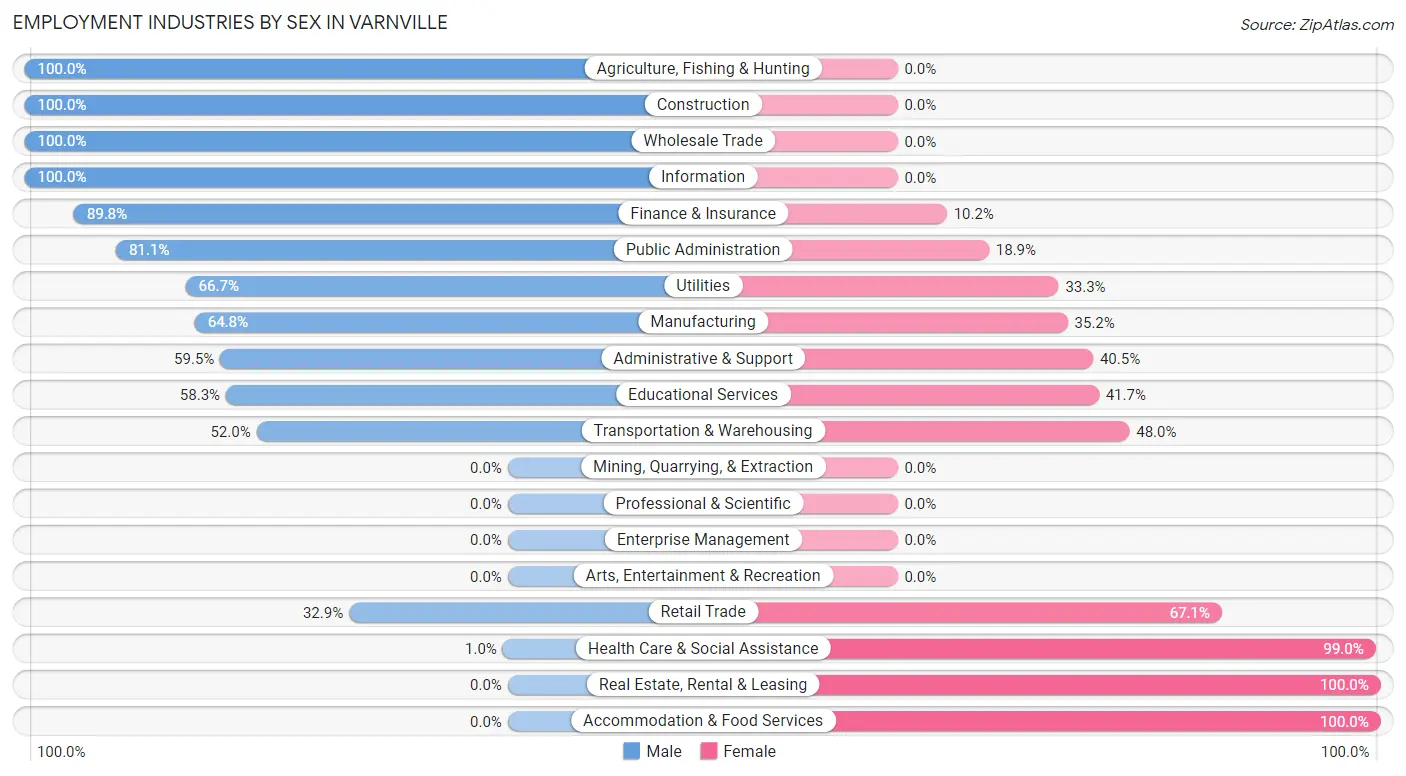
Employment Industries by Sex in Varnville
The Varnville industries that see more men than women are Agriculture, Fishing & Hunting (100.0%), Construction (100.0%), and Wholesale Trade (100.0%), whereas the industries that tend to have a higher number of women are Real Estate, Rental & Leasing (100.0%), Accommodation & Food Services (100.0%), and Health Care & Social Assistance (99.0%).
| Industry | Male | Female |
| Agriculture, Fishing & Hunting | 25 (100.0%) | 0 (0.0%) |
| Mining, Quarrying, & Extraction | 0 (0.0%) | 0 (0.0%) |
| Construction | 109 (100.0%) | 0 (0.0%) |
| Manufacturing | 57 (64.8%) | 31 (35.2%) |
| Wholesale Trade | 6 (100.0%) | 0 (0.0%) |
| Retail Trade | 23 (32.9%) | 47 (67.1%) |
| Transportation & Warehousing | 13 (52.0%) | 12 (48.0%) |
| Utilities | 16 (66.7%) | 8 (33.3%) |
| Information | 3 (100.0%) | 0 (0.0%) |
| Finance & Insurance | 44 (89.8%) | 5 (10.2%) |
| Real Estate, Rental & Leasing | 0 (0.0%) | 59 (100.0%) |
| Professional & Scientific | 0 (0.0%) | 0 (0.0%) |
| Enterprise Management | 0 (0.0%) | 0 (0.0%) |
| Administrative & Support | 25 (59.5%) | 17 (40.5%) |
| Educational Services | 56 (58.3%) | 40 (41.7%) |
| Health Care & Social Assistance | 1 (1.0%) | 95 (99.0%) |
| Arts, Entertainment & Recreation | 0 (0.0%) | 0 (0.0%) |
| Accommodation & Food Services | 0 (0.0%) | 17 (100.0%) |
| Public Administration | 30 (81.1%) | 7 (18.9%) |
| Total | 432 (54.4%) | 362 (45.6%) |
Education in Varnville
School Enrollment in Varnville
The most common levels of schooling among the 581 students in Varnville are middle school (183 | 31.5%), elementary school (166 | 28.6%), and college / undergraduate (127 | 21.9%).
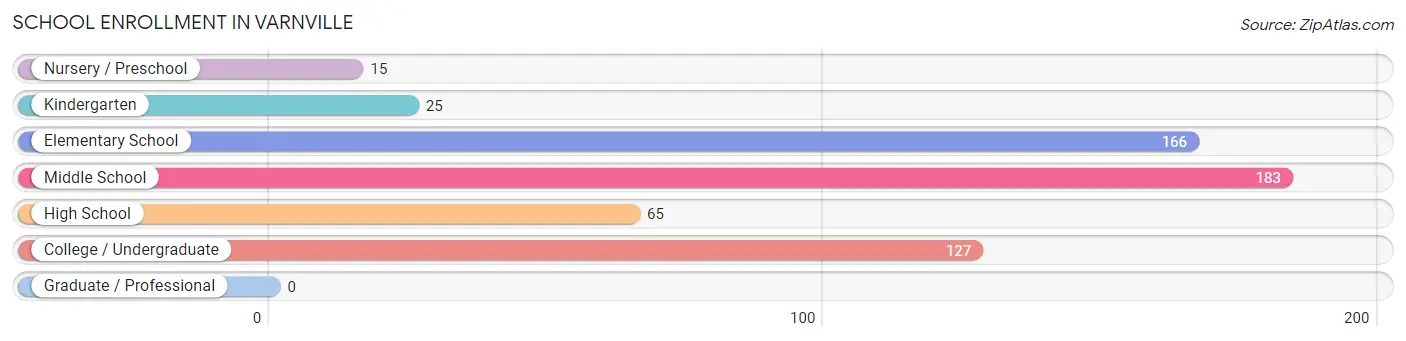
| School Level | # Students | % Students |
| Nursery / Preschool | 15 | 2.6% |
| Kindergarten | 25 | 4.3% |
| Elementary School | 166 | 28.6% |
| Middle School | 183 | 31.5% |
| High School | 65 | 11.2% |
| College / Undergraduate | 127 | 21.9% |
| Graduate / Professional | 0 | 0.0% |
| Total | 581 | 100.0% |
School Enrollment by Age by Funding Source in Varnville
Out of a total of 581 students who are enrolled in schools in Varnville, 46 (7.9%) attend a private institution, while the remaining 535 (92.1%) are enrolled in public schools. The age group of 35 years and over has the highest likelihood of being enrolled in private schools, with 14 (21.2% in the age bracket) enrolled. Conversely, the age group of 3 to 4 year olds has the lowest likelihood of being enrolled in a private school, with 4 (100.0% in the age bracket) attending a public institution.
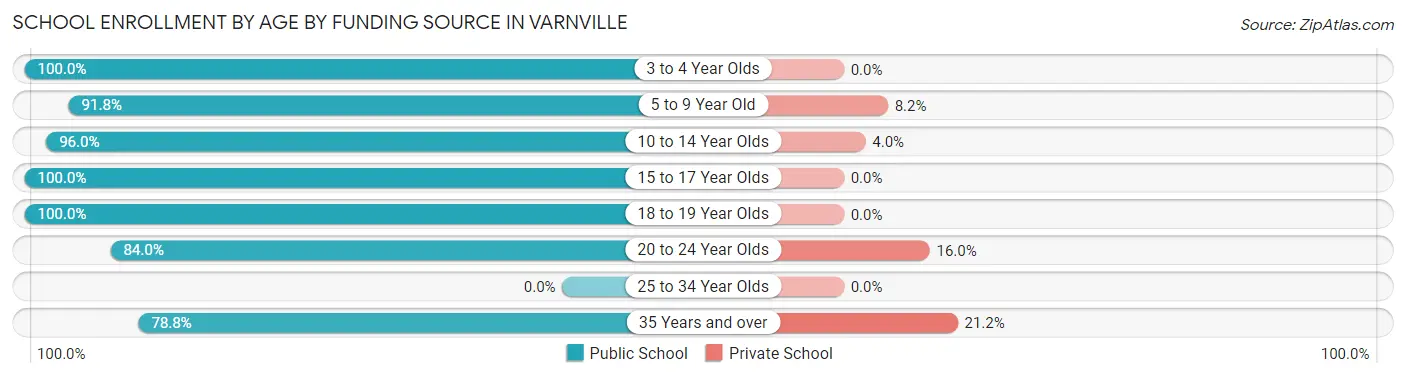
| Age Bracket | Public School | Private School |
| 3 to 4 Year Olds | 4 (100.0%) | 0 (0.0%) |
| 5 to 9 Year Old | 179 (91.8%) | 16 (8.2%) |
| 10 to 14 Year Olds | 190 (96.0%) | 8 (4.0%) |
| 15 to 17 Year Olds | 39 (100.0%) | 0 (0.0%) |
| 18 to 19 Year Olds | 29 (100.0%) | 0 (0.0%) |
| 20 to 24 Year Olds | 42 (84.0%) | 8 (16.0%) |
| 25 to 34 Year Olds | 0 (0.0%) | 0 (0.0%) |
| 35 Years and over | 52 (78.8%) | 14 (21.2%) |
| Total | 535 (92.1%) | 46 (7.9%) |
Educational Attainment by Field of Study in Varnville
Education (68 | 25.0%), computers & mathematics (51 | 18.8%), business (49 | 18.0%), psychology (38 | 14.0%), and liberal arts & history (22 | 8.1%) are the most common fields of study among 272 individuals in Varnville who have obtained a bachelor's degree or higher.
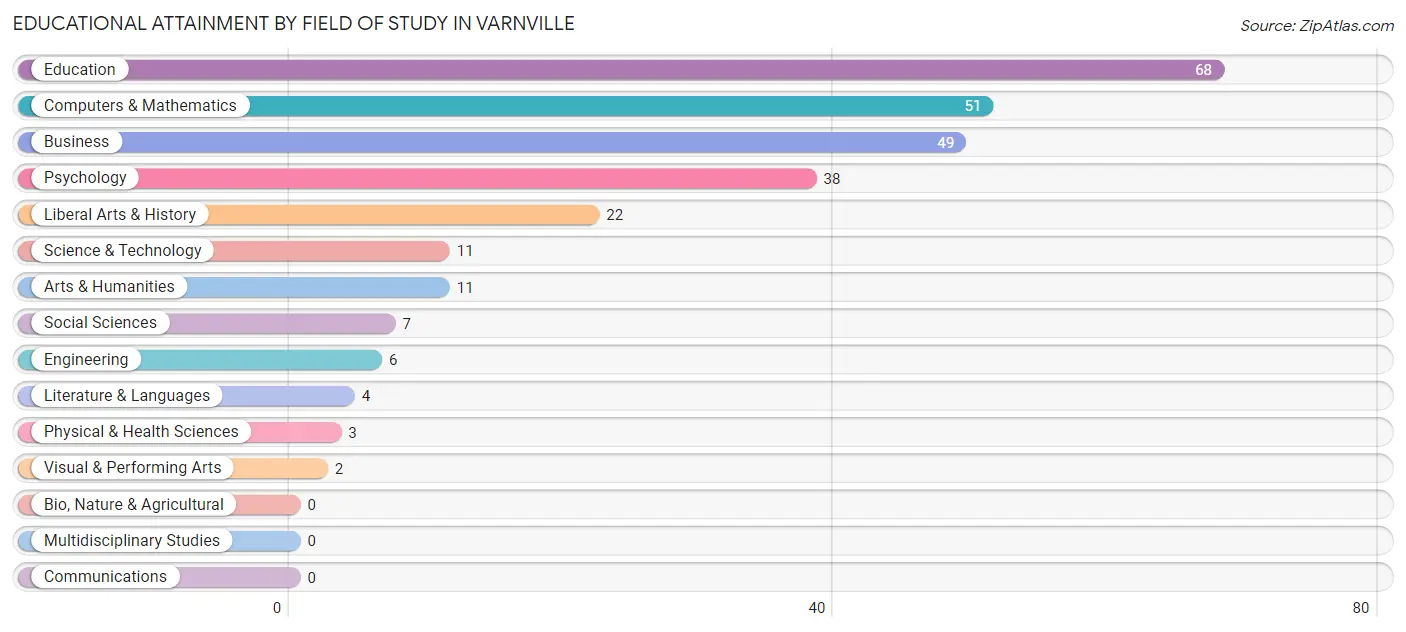
| Field of Study | # Graduates | % Graduates |
| Computers & Mathematics | 51 | 18.8% |
| Bio, Nature & Agricultural | 0 | 0.0% |
| Physical & Health Sciences | 3 | 1.1% |
| Psychology | 38 | 14.0% |
| Social Sciences | 7 | 2.6% |
| Engineering | 6 | 2.2% |
| Multidisciplinary Studies | 0 | 0.0% |
| Science & Technology | 11 | 4.0% |
| Business | 49 | 18.0% |
| Education | 68 | 25.0% |
| Literature & Languages | 4 | 1.5% |
| Liberal Arts & History | 22 | 8.1% |
| Visual & Performing Arts | 2 | 0.7% |
| Communications | 0 | 0.0% |
| Arts & Humanities | 11 | 4.0% |
| Total | 272 | 100.0% |
Transportation & Commute in Varnville
Vehicle Availability by Sex in Varnville
The most prevalent vehicle ownership categories in Varnville are males with 2 vehicles (234, accounting for 54.3%) and females with 2 vehicles (199, making up 66.1%).
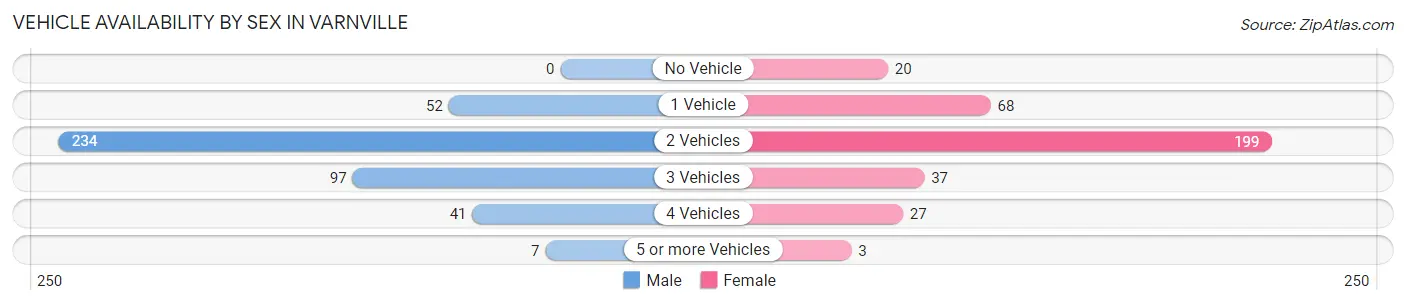
| Vehicles Available | Male | Female |
| No Vehicle | 0 (0.0%) | 20 (5.7%) |
| 1 Vehicle | 52 (12.1%) | 68 (19.2%) |
| 2 Vehicles | 234 (54.3%) | 199 (56.2%) |
| 3 Vehicles | 97 (22.5%) | 37 (10.4%) |
| 4 Vehicles | 41 (9.5%) | 27 (7.6%) |
| 5 or more Vehicles | 7 (1.6%) | 3 (0.9%) |
| Total | 431 (100.0%) | 354 (100.0%) |
Commute Time in Varnville
The most frequently occuring commute durations in Varnville are 10 to 14 minutes (138 commuters, 18.0%), 30 to 34 minutes (137 commuters, 17.8%), and 15 to 19 minutes (91 commuters, 11.8%).
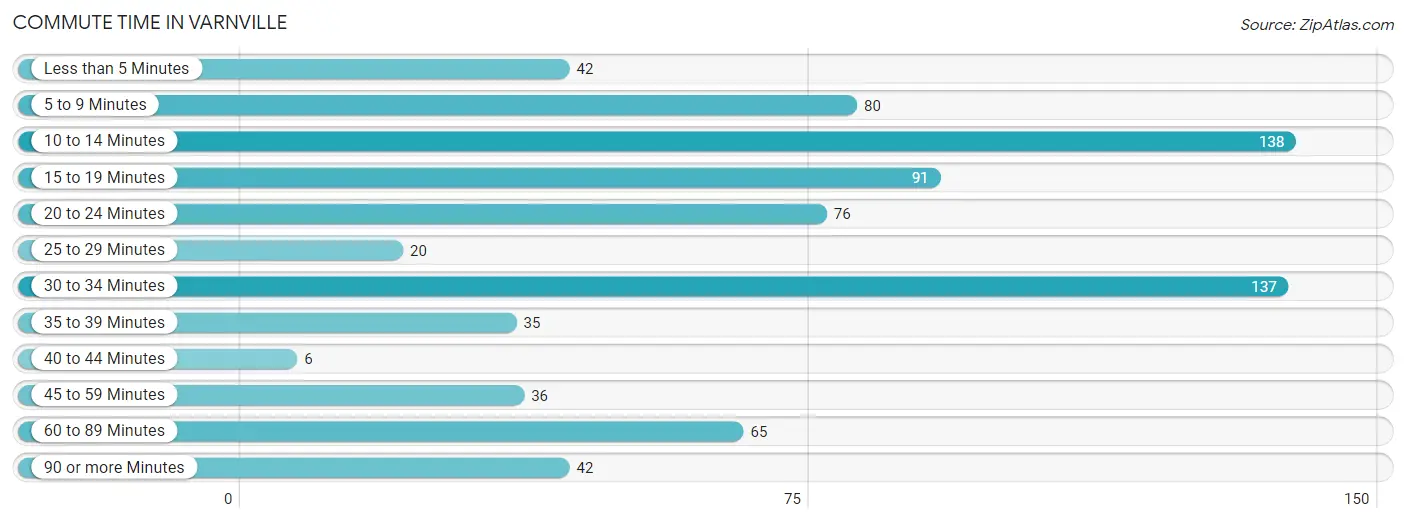
| Commute Time | # Commuters | % Commuters |
| Less than 5 Minutes | 42 | 5.5% |
| 5 to 9 Minutes | 80 | 10.4% |
| 10 to 14 Minutes | 138 | 18.0% |
| 15 to 19 Minutes | 91 | 11.8% |
| 20 to 24 Minutes | 76 | 9.9% |
| 25 to 29 Minutes | 20 | 2.6% |
| 30 to 34 Minutes | 137 | 17.8% |
| 35 to 39 Minutes | 35 | 4.6% |
| 40 to 44 Minutes | 6 | 0.8% |
| 45 to 59 Minutes | 36 | 4.7% |
| 60 to 89 Minutes | 65 | 8.5% |
| 90 or more Minutes | 42 | 5.5% |
Commute Time by Sex in Varnville
The most common commute times in Varnville are 10 to 14 minutes (76 commuters, 17.7%) for males and 30 to 34 minutes (83 commuters, 24.5%) for females.
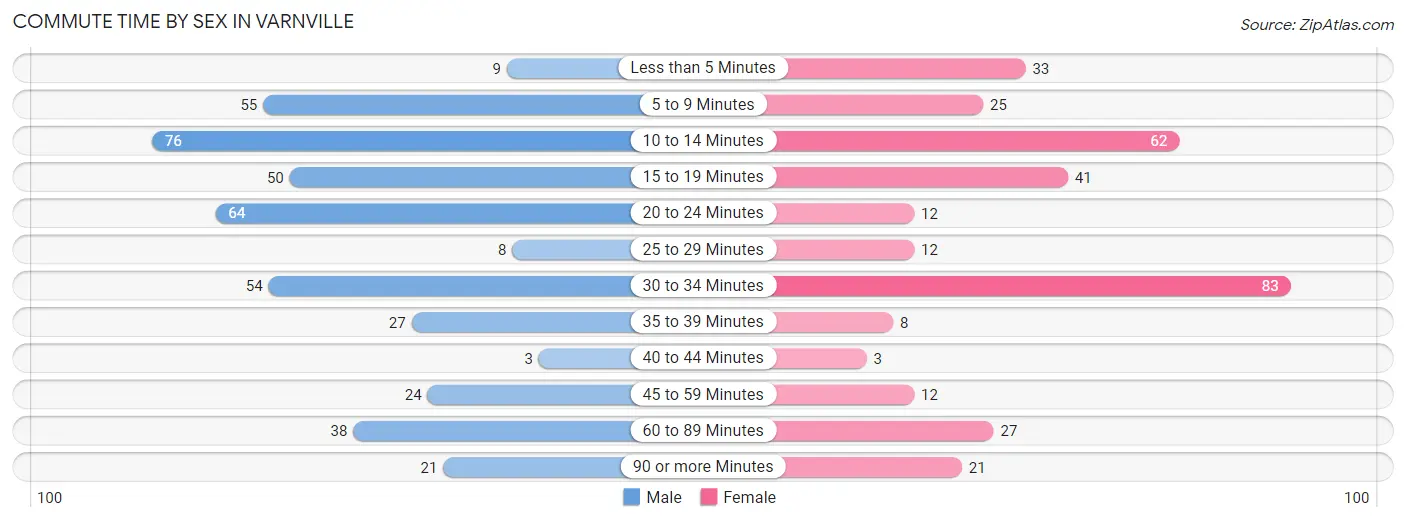
| Commute Time | Male | Female |
| Less than 5 Minutes | 9 (2.1%) | 33 (9.7%) |
| 5 to 9 Minutes | 55 (12.8%) | 25 (7.4%) |
| 10 to 14 Minutes | 76 (17.7%) | 62 (18.3%) |
| 15 to 19 Minutes | 50 (11.7%) | 41 (12.1%) |
| 20 to 24 Minutes | 64 (14.9%) | 12 (3.5%) |
| 25 to 29 Minutes | 8 (1.9%) | 12 (3.5%) |
| 30 to 34 Minutes | 54 (12.6%) | 83 (24.5%) |
| 35 to 39 Minutes | 27 (6.3%) | 8 (2.4%) |
| 40 to 44 Minutes | 3 (0.7%) | 3 (0.9%) |
| 45 to 59 Minutes | 24 (5.6%) | 12 (3.5%) |
| 60 to 89 Minutes | 38 (8.9%) | 27 (8.0%) |
| 90 or more Minutes | 21 (4.9%) | 21 (6.2%) |
Time of Departure to Work by Sex in Varnville
The most frequent times of departure to work in Varnville are 6:30 AM to 6:59 AM (104, 24.2%) for males and 7:00 AM to 7:29 AM (66, 19.5%) for females.
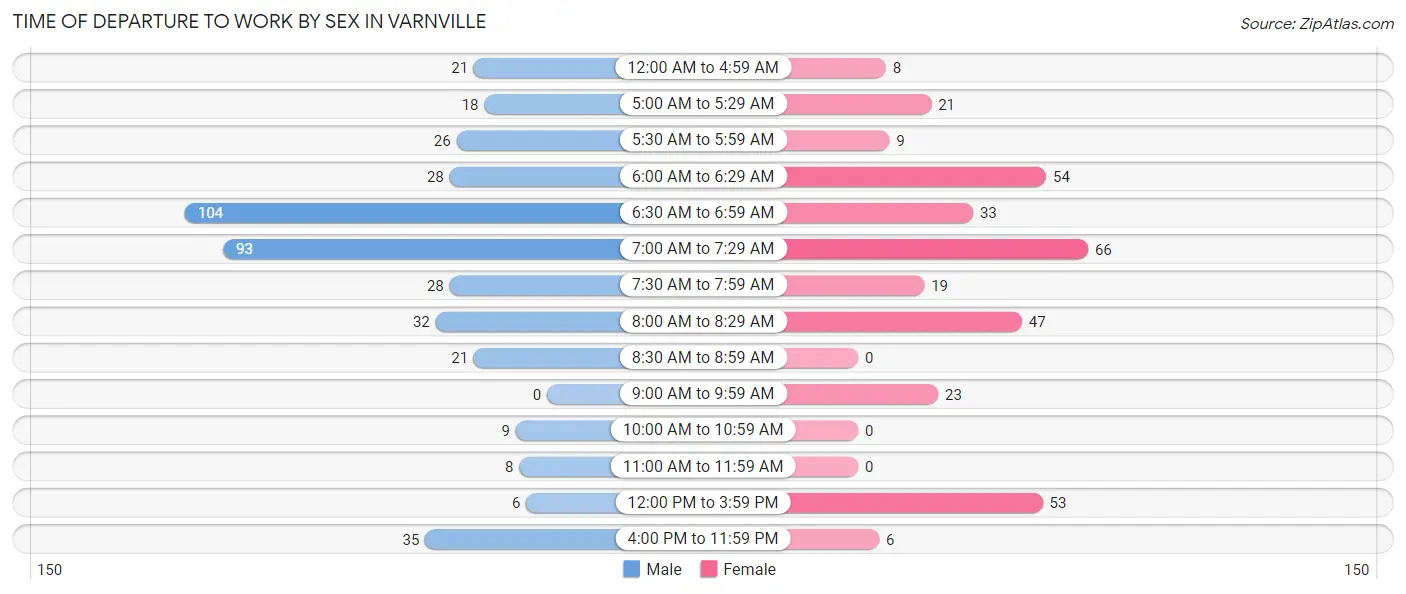
| Time of Departure | Male | Female |
| 12:00 AM to 4:59 AM | 21 (4.9%) | 8 (2.4%) |
| 5:00 AM to 5:29 AM | 18 (4.2%) | 21 (6.2%) |
| 5:30 AM to 5:59 AM | 26 (6.1%) | 9 (2.6%) |
| 6:00 AM to 6:29 AM | 28 (6.5%) | 54 (15.9%) |
| 6:30 AM to 6:59 AM | 104 (24.2%) | 33 (9.7%) |
| 7:00 AM to 7:29 AM | 93 (21.7%) | 66 (19.5%) |
| 7:30 AM to 7:59 AM | 28 (6.5%) | 19 (5.6%) |
| 8:00 AM to 8:29 AM | 32 (7.5%) | 47 (13.9%) |
| 8:30 AM to 8:59 AM | 21 (4.9%) | 0 (0.0%) |
| 9:00 AM to 9:59 AM | 0 (0.0%) | 23 (6.8%) |
| 10:00 AM to 10:59 AM | 9 (2.1%) | 0 (0.0%) |
| 11:00 AM to 11:59 AM | 8 (1.9%) | 0 (0.0%) |
| 12:00 PM to 3:59 PM | 6 (1.4%) | 53 (15.6%) |
| 4:00 PM to 11:59 PM | 35 (8.2%) | 6 (1.8%) |
| Total | 429 (100.0%) | 339 (100.0%) |
Housing Occupancy in Varnville
Occupancy by Ownership in Varnville
Of the total 734 dwellings in Varnville, owner-occupied units account for 423 (57.6%), while renter-occupied units make up 311 (42.4%).
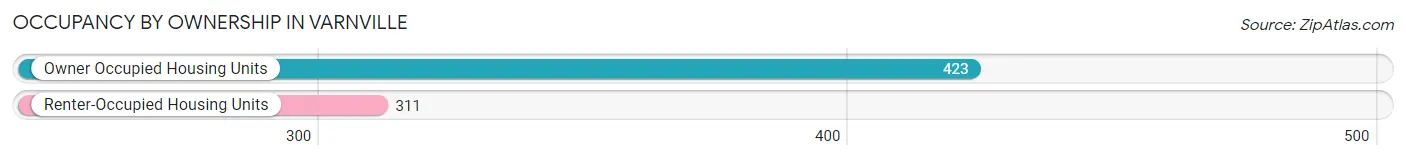
| Occupancy | # Housing Units | % Housing Units |
| Owner Occupied Housing Units | 423 | 57.6% |
| Renter-Occupied Housing Units | 311 | 42.4% |
| Total Occupied Housing Units | 734 | 100.0% |
Occupancy by Household Size in Varnville
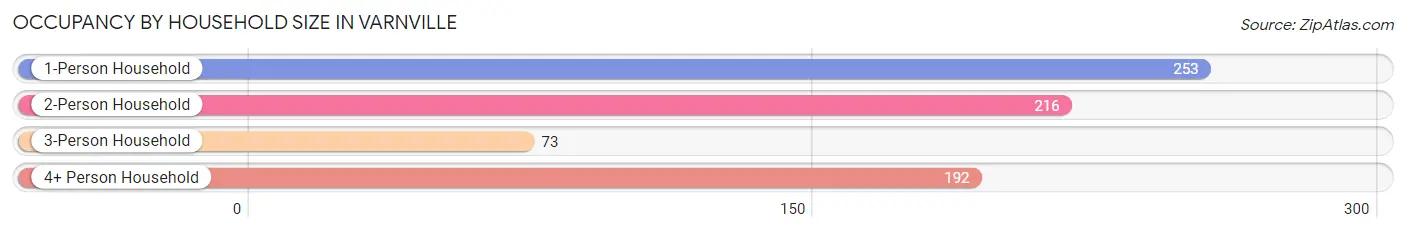
| Household Size | # Housing Units | % Housing Units |
| 1-Person Household | 253 | 34.5% |
| 2-Person Household | 216 | 29.4% |
| 3-Person Household | 73 | 10.0% |
| 4+ Person Household | 192 | 26.2% |
| Total Housing Units | 734 | 100.0% |
Occupancy by Ownership by Household Size in Varnville
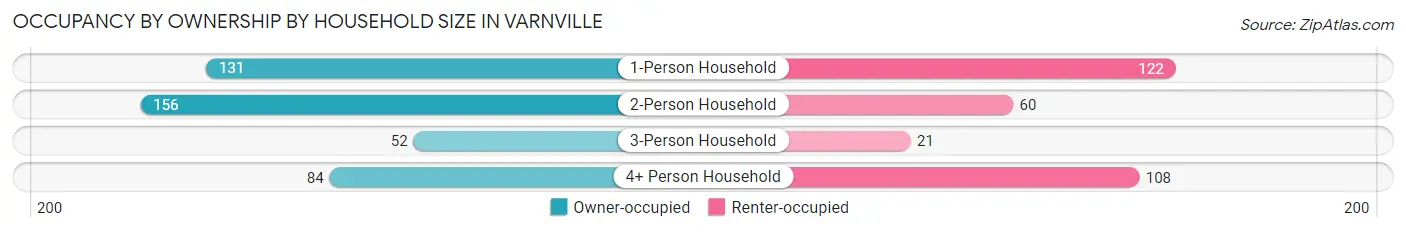
| Household Size | Owner-occupied | Renter-occupied |
| 1-Person Household | 131 (51.8%) | 122 (48.2%) |
| 2-Person Household | 156 (72.2%) | 60 (27.8%) |
| 3-Person Household | 52 (71.2%) | 21 (28.8%) |
| 4+ Person Household | 84 (43.8%) | 108 (56.2%) |
| Total Housing Units | 423 (57.6%) | 311 (42.4%) |
Occupancy by Educational Attainment in Varnville
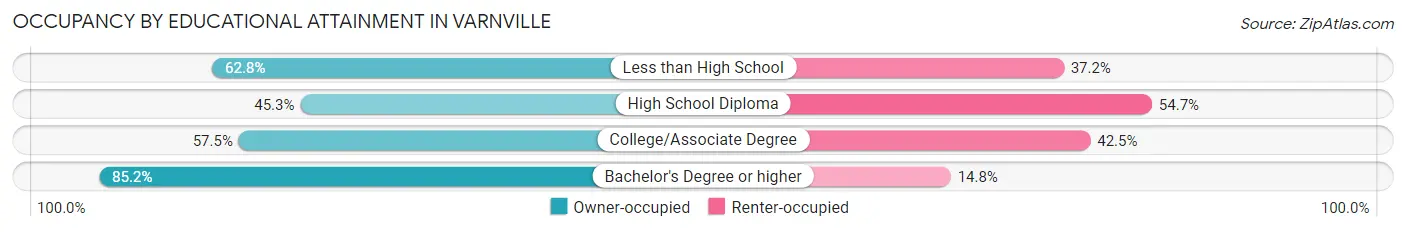
| Household Size | Owner-occupied | Renter-occupied |
| Less than High School | 49 (62.8%) | 29 (37.2%) |
| High School Diploma | 131 (45.3%) | 158 (54.7%) |
| College/Associate Degree | 145 (57.5%) | 107 (42.5%) |
| Bachelor's Degree or higher | 98 (85.2%) | 17 (14.8%) |
Occupancy by Age of Householder in Varnville
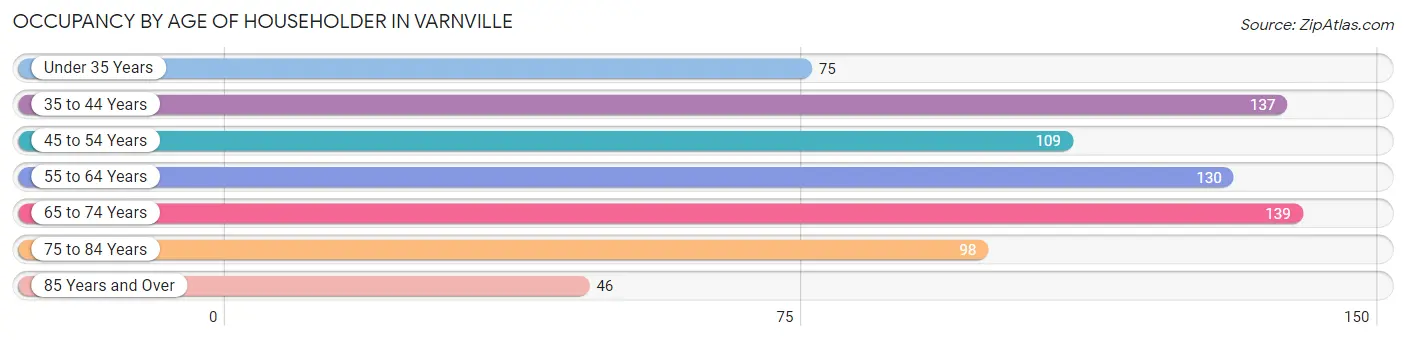
| Age Bracket | # Households | % Households |
| Under 35 Years | 75 | 10.2% |
| 35 to 44 Years | 137 | 18.7% |
| 45 to 54 Years | 109 | 14.8% |
| 55 to 64 Years | 130 | 17.7% |
| 65 to 74 Years | 139 | 18.9% |
| 75 to 84 Years | 98 | 13.4% |
| 85 Years and Over | 46 | 6.3% |
| Total | 734 | 100.0% |
Housing Finances in Varnville
Median Income by Occupancy in Varnville
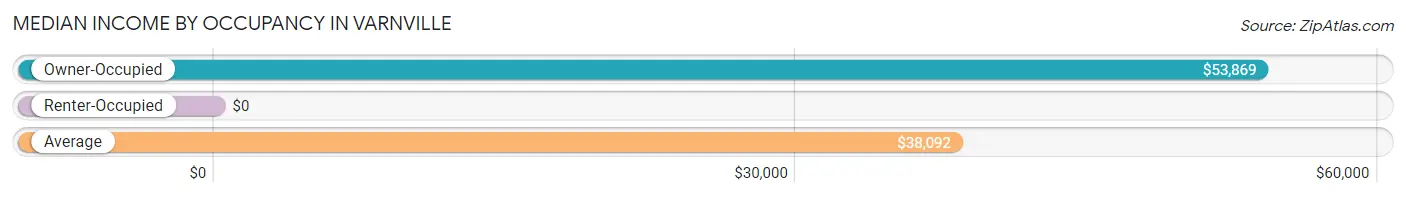
| Occupancy Type | # Households | Median Income |
| Owner-Occupied | 423 (57.6%) | $53,869 |
| Renter-Occupied | 311 (42.4%) | $0 |
| Average | 734 (100.0%) | $38,092 |
Occupancy by Householder Income Bracket in Varnville
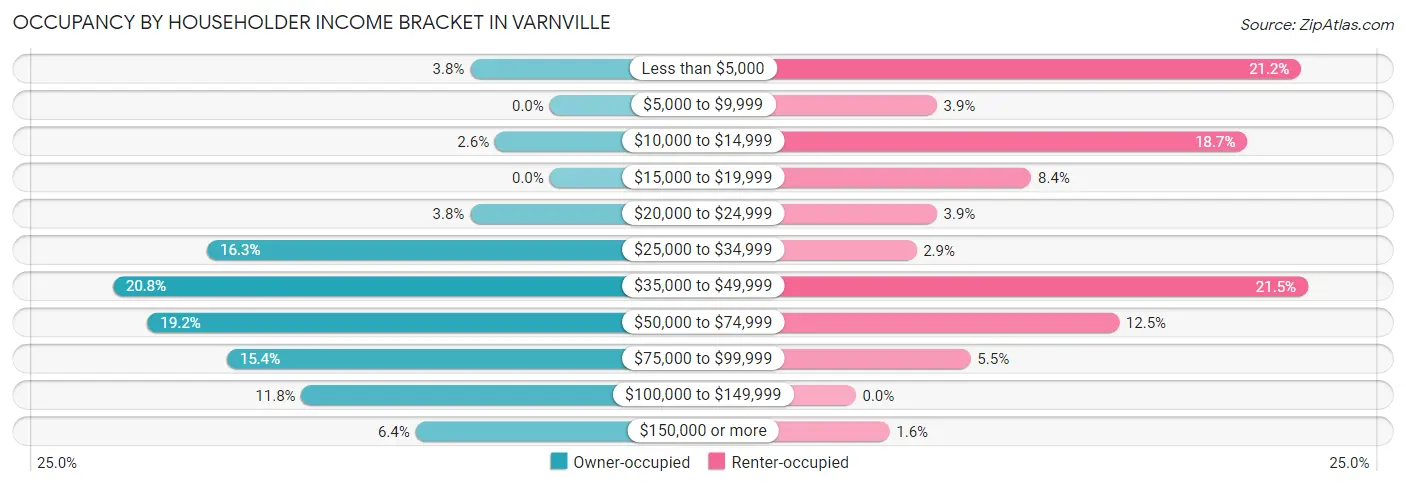
| Income Bracket | Owner-occupied | Renter-occupied |
| Less than $5,000 | 16 (3.8%) | 66 (21.2%) |
| $5,000 to $9,999 | 0 (0.0%) | 12 (3.9%) |
| $10,000 to $14,999 | 11 (2.6%) | 58 (18.6%) |
| $15,000 to $19,999 | 0 (0.0%) | 26 (8.4%) |
| $20,000 to $24,999 | 16 (3.8%) | 12 (3.9%) |
| $25,000 to $34,999 | 69 (16.3%) | 9 (2.9%) |
| $35,000 to $49,999 | 88 (20.8%) | 67 (21.5%) |
| $50,000 to $74,999 | 81 (19.2%) | 39 (12.5%) |
| $75,000 to $99,999 | 65 (15.4%) | 17 (5.5%) |
| $100,000 to $149,999 | 50 (11.8%) | 0 (0.0%) |
| $150,000 or more | 27 (6.4%) | 5 (1.6%) |
| Total | 423 (100.0%) | 311 (100.0%) |
Monthly Housing Cost Tiers in Varnville
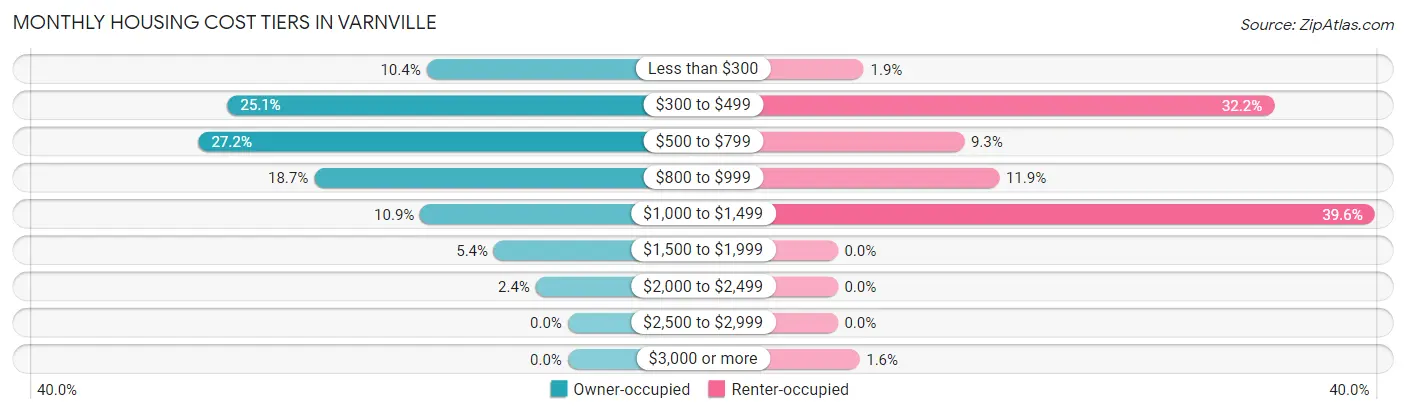
| Monthly Cost | Owner-occupied | Renter-occupied |
| Less than $300 | 44 (10.4%) | 6 (1.9%) |
| $300 to $499 | 106 (25.1%) | 100 (32.2%) |
| $500 to $799 | 115 (27.2%) | 29 (9.3%) |
| $800 to $999 | 79 (18.7%) | 37 (11.9%) |
| $1,000 to $1,499 | 46 (10.9%) | 123 (39.6%) |
| $1,500 to $1,999 | 23 (5.4%) | 0 (0.0%) |
| $2,000 to $2,499 | 10 (2.4%) | 0 (0.0%) |
| $2,500 to $2,999 | 0 (0.0%) | 0 (0.0%) |
| $3,000 or more | 0 (0.0%) | 5 (1.6%) |
| Total | 423 (100.0%) | 311 (100.0%) |
Physical Housing Characteristics in Varnville
Housing Structures in Varnville
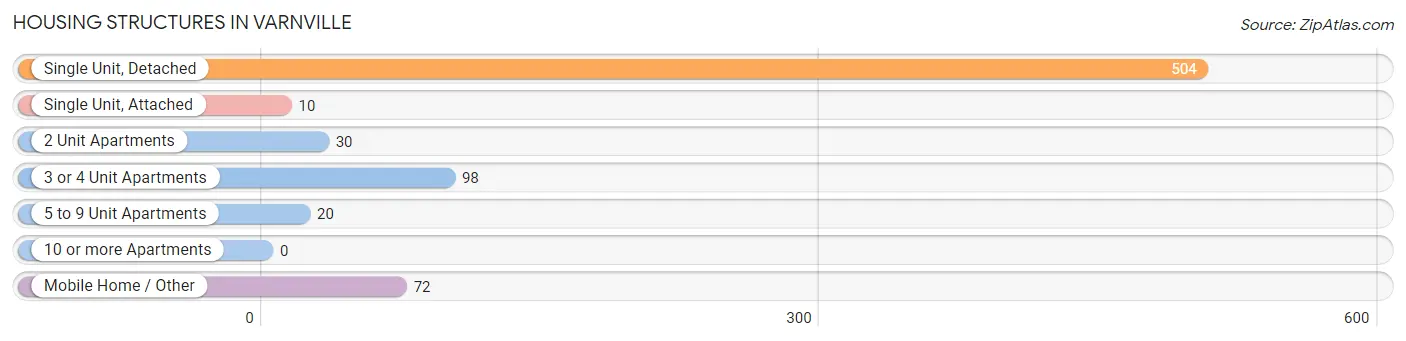
| Structure Type | # Housing Units | % Housing Units |
| Single Unit, Detached | 504 | 68.7% |
| Single Unit, Attached | 10 | 1.4% |
| 2 Unit Apartments | 30 | 4.1% |
| 3 or 4 Unit Apartments | 98 | 13.4% |
| 5 to 9 Unit Apartments | 20 | 2.7% |
| 10 or more Apartments | 0 | 0.0% |
| Mobile Home / Other | 72 | 9.8% |
| Total | 734 | 100.0% |
Housing Structures by Occupancy in Varnville
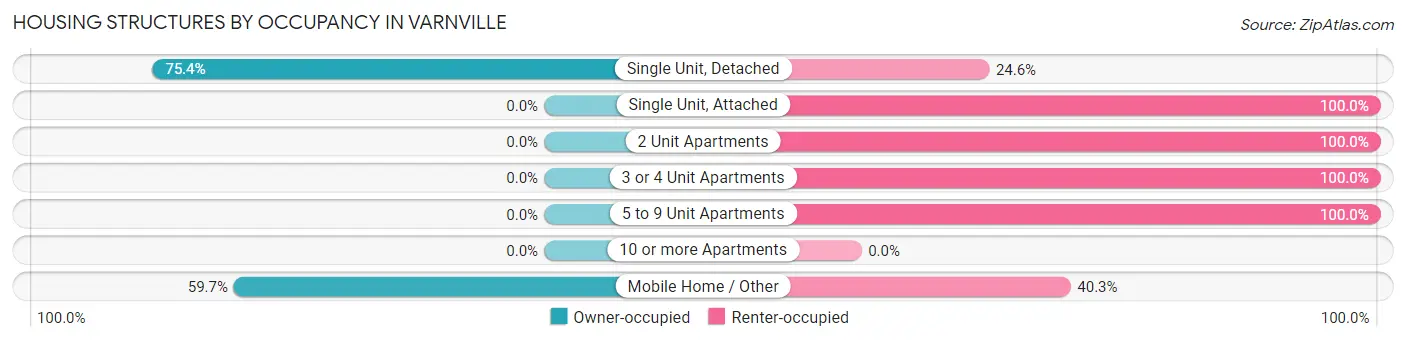
| Structure Type | Owner-occupied | Renter-occupied |
| Single Unit, Detached | 380 (75.4%) | 124 (24.6%) |
| Single Unit, Attached | 0 (0.0%) | 10 (100.0%) |
| 2 Unit Apartments | 0 (0.0%) | 30 (100.0%) |
| 3 or 4 Unit Apartments | 0 (0.0%) | 98 (100.0%) |
| 5 to 9 Unit Apartments | 0 (0.0%) | 20 (100.0%) |
| 10 or more Apartments | 0 (0.0%) | 0 (0.0%) |
| Mobile Home / Other | 43 (59.7%) | 29 (40.3%) |
| Total | 423 (57.6%) | 311 (42.4%) |
Housing Structures by Number of Rooms in Varnville
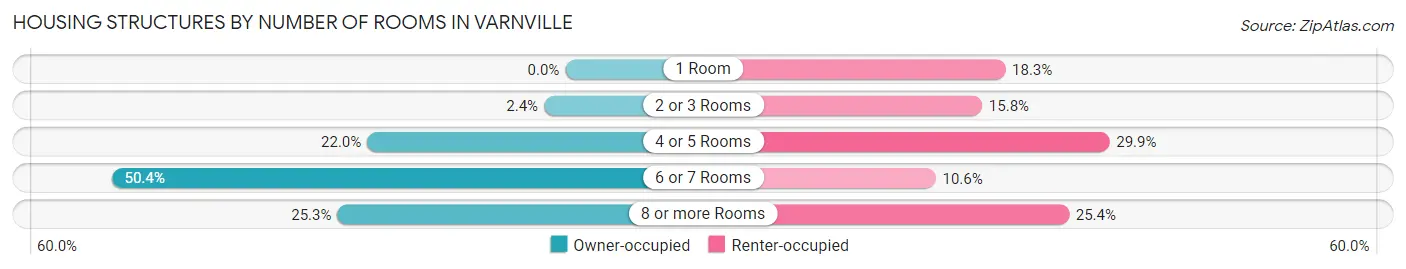
| Number of Rooms | Owner-occupied | Renter-occupied |
| 1 Room | 0 (0.0%) | 57 (18.3%) |
| 2 or 3 Rooms | 10 (2.4%) | 49 (15.8%) |
| 4 or 5 Rooms | 93 (22.0%) | 93 (29.9%) |
| 6 or 7 Rooms | 213 (50.3%) | 33 (10.6%) |
| 8 or more Rooms | 107 (25.3%) | 79 (25.4%) |
| Total | 423 (100.0%) | 311 (100.0%) |
Housing Structure by Heating Type in Varnville
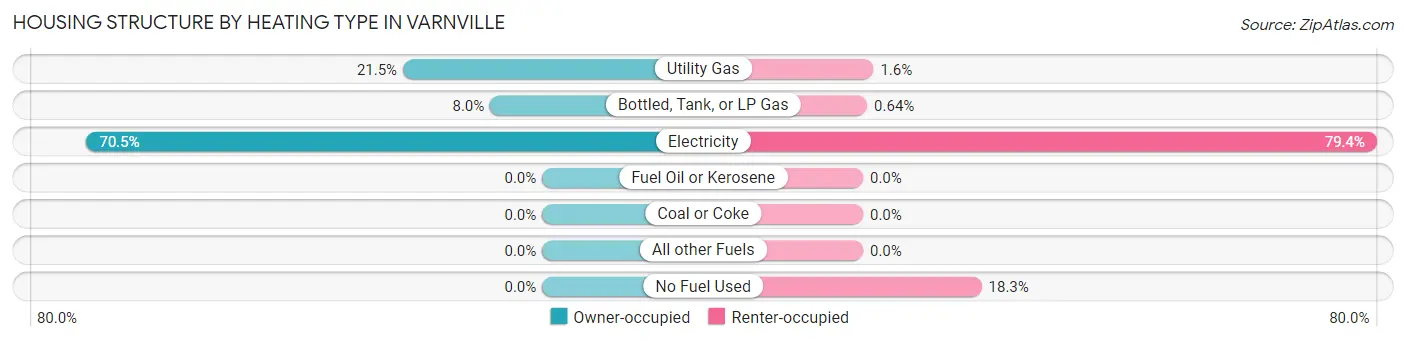
| Heating Type | Owner-occupied | Renter-occupied |
| Utility Gas | 91 (21.5%) | 5 (1.6%) |
| Bottled, Tank, or LP Gas | 34 (8.0%) | 2 (0.6%) |
| Electricity | 298 (70.5%) | 247 (79.4%) |
| Fuel Oil or Kerosene | 0 (0.0%) | 0 (0.0%) |
| Coal or Coke | 0 (0.0%) | 0 (0.0%) |
| All other Fuels | 0 (0.0%) | 0 (0.0%) |
| No Fuel Used | 0 (0.0%) | 57 (18.3%) |
| Total | 423 (100.0%) | 311 (100.0%) |
Household Vehicle Usage in Varnville
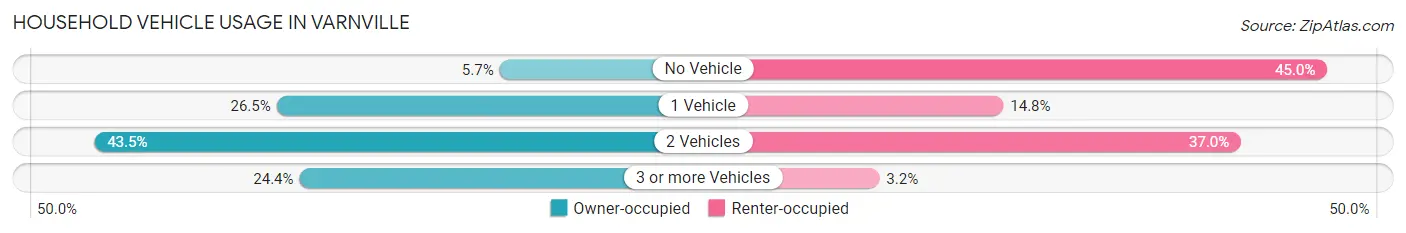
| Vehicles per Household | Owner-occupied | Renter-occupied |
| No Vehicle | 24 (5.7%) | 140 (45.0%) |
| 1 Vehicle | 112 (26.5%) | 46 (14.8%) |
| 2 Vehicles | 184 (43.5%) | 115 (37.0%) |
| 3 or more Vehicles | 103 (24.3%) | 10 (3.2%) |
| Total | 423 (100.0%) | 311 (100.0%) |
Real Estate & Mortgages in Varnville
Real Estate and Mortgage Overview in Varnville
| Characteristic | Without Mortgage | With Mortgage |
| Housing Units | 246 | 177 |
| Median Property Value | $79,800 | $116,900 |
| Median Household Income | $53,026 | $3 |
| Monthly Housing Costs | $447 | $0 |
| Real Estate Taxes | $804 | $7 |
Property Value by Mortgage Status in Varnville
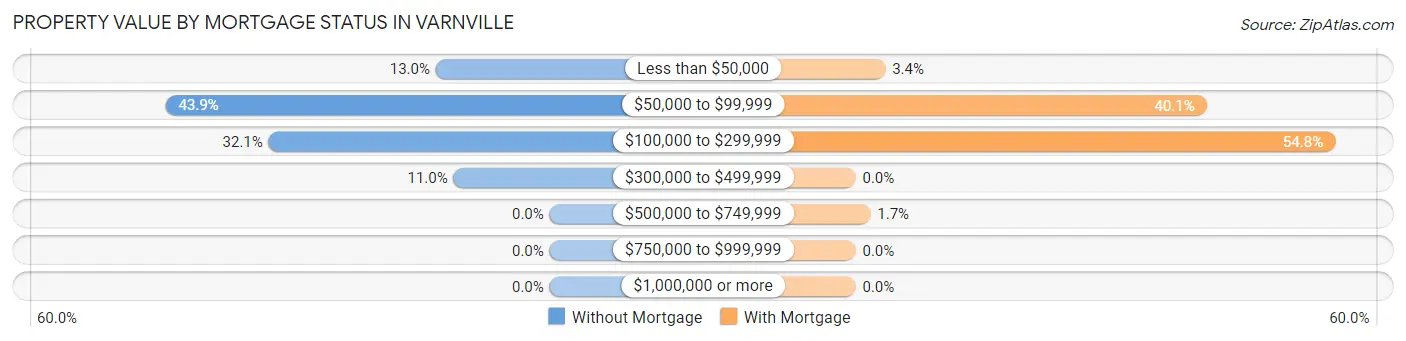
| Property Value | Without Mortgage | With Mortgage |
| Less than $50,000 | 32 (13.0%) | 6 (3.4%) |
| $50,000 to $99,999 | 108 (43.9%) | 71 (40.1%) |
| $100,000 to $299,999 | 79 (32.1%) | 97 (54.8%) |
| $300,000 to $499,999 | 27 (11.0%) | 0 (0.0%) |
| $500,000 to $749,999 | 0 (0.0%) | 3 (1.7%) |
| $750,000 to $999,999 | 0 (0.0%) | 0 (0.0%) |
| $1,000,000 or more | 0 (0.0%) | 0 (0.0%) |
| Total | 246 (100.0%) | 177 (100.0%) |
Household Income by Mortgage Status in Varnville
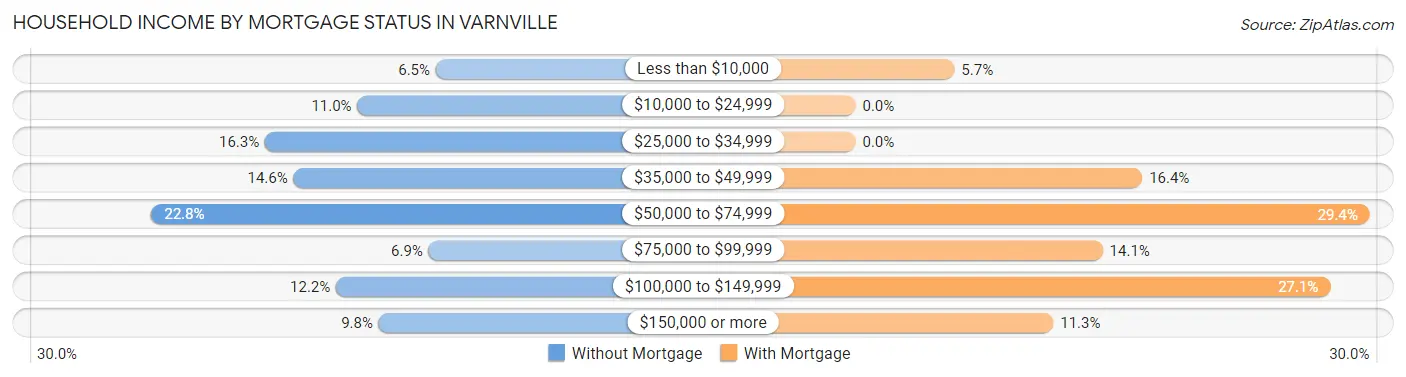
| Household Income | Without Mortgage | With Mortgage |
| Less than $10,000 | 16 (6.5%) | 10 (5.7%) |
| $10,000 to $24,999 | 27 (11.0%) | 0 (0.0%) |
| $25,000 to $34,999 | 40 (16.3%) | 0 (0.0%) |
| $35,000 to $49,999 | 36 (14.6%) | 29 (16.4%) |
| $50,000 to $74,999 | 56 (22.8%) | 52 (29.4%) |
| $75,000 to $99,999 | 17 (6.9%) | 25 (14.1%) |
| $100,000 to $149,999 | 30 (12.2%) | 48 (27.1%) |
| $150,000 or more | 24 (9.8%) | 20 (11.3%) |
| Total | 246 (100.0%) | 177 (100.0%) |
Property Value to Household Income Ratio in Varnville
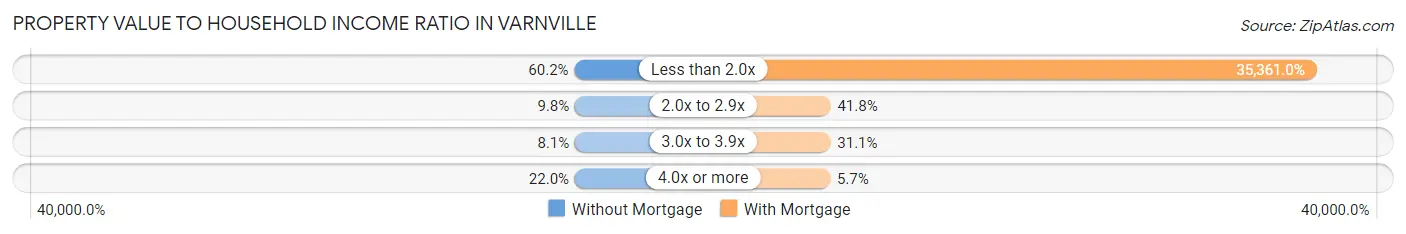
| Value-to-Income Ratio | Without Mortgage | With Mortgage |
| Less than 2.0x | 148 (60.2%) | 62,589 (35,361.0%) |
| 2.0x to 2.9x | 24 (9.8%) | 74 (41.8%) |
| 3.0x to 3.9x | 20 (8.1%) | 55 (31.1%) |
| 4.0x or more | 54 (22.0%) | 10 (5.7%) |
| Total | 246 (100.0%) | 177 (100.0%) |
Real Estate Taxes by Mortgage Status in Varnville
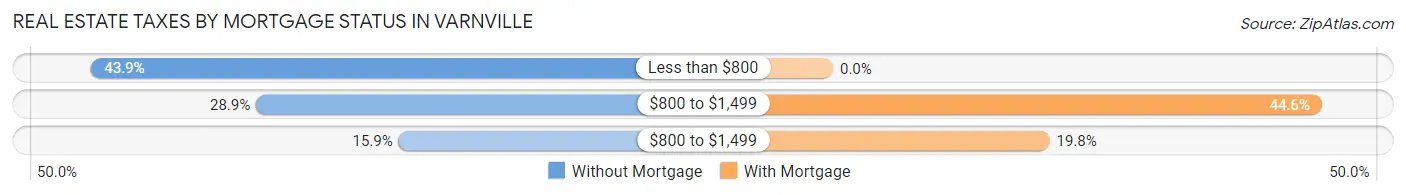
| Property Taxes | Without Mortgage | With Mortgage |
| Less than $800 | 108 (43.9%) | 0 (0.0%) |
| $800 to $1,499 | 71 (28.9%) | 79 (44.6%) |
| $800 to $1,499 | 39 (15.9%) | 35 (19.8%) |
| Total | 246 (100.0%) | 177 (100.0%) |
Health & Disability in Varnville
Health Insurance Coverage by Age in Varnville
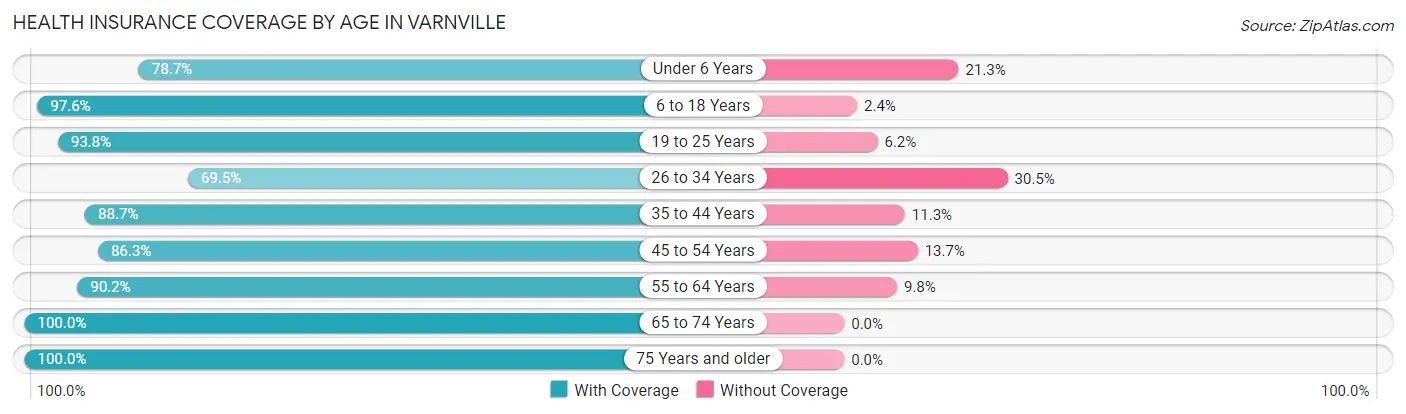
| Age Bracket | With Coverage | Without Coverage |
| Under 6 Years | 107 (78.7%) | 29 (21.3%) |
| 6 to 18 Years | 408 (97.6%) | 10 (2.4%) |
| 19 to 25 Years | 227 (93.8%) | 15 (6.2%) |
| 26 to 34 Years | 105 (69.5%) | 46 (30.5%) |
| 35 to 44 Years | 306 (88.7%) | 39 (11.3%) |
| 45 to 54 Years | 145 (86.3%) | 23 (13.7%) |
| 55 to 64 Years | 229 (90.2%) | 25 (9.8%) |
| 65 to 74 Years | 199 (100.0%) | 0 (0.0%) |
| 75 Years and older | 230 (100.0%) | 0 (0.0%) |
| Total | 1,956 (91.3%) | 187 (8.7%) |
Health Insurance Coverage by Citizenship Status in Varnville
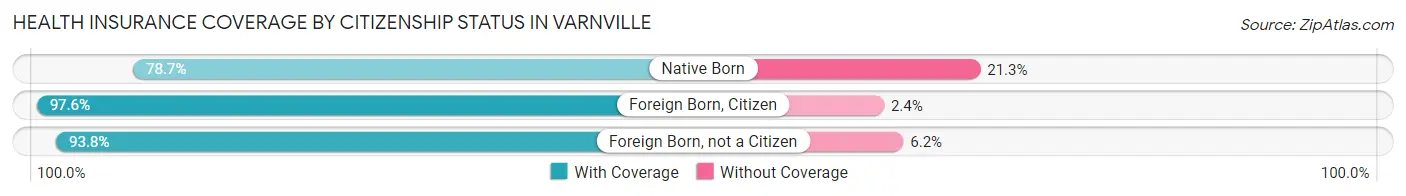
| Citizenship Status | With Coverage | Without Coverage |
| Native Born | 107 (78.7%) | 29 (21.3%) |
| Foreign Born, Citizen | 408 (97.6%) | 10 (2.4%) |
| Foreign Born, not a Citizen | 227 (93.8%) | 15 (6.2%) |
Health Insurance Coverage by Household Income in Varnville
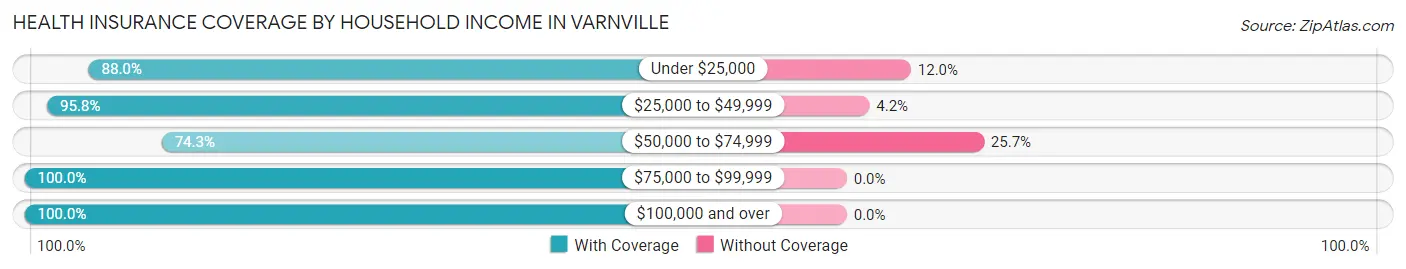
| Household Income | With Coverage | Without Coverage |
| Under $25,000 | 352 (88.0%) | 48 (12.0%) |
| $25,000 to $49,999 | 840 (95.8%) | 37 (4.2%) |
| $50,000 to $74,999 | 295 (74.3%) | 102 (25.7%) |
| $75,000 to $99,999 | 250 (100.0%) | 0 (0.0%) |
| $100,000 and over | 213 (100.0%) | 0 (0.0%) |
Public vs Private Health Insurance Coverage by Age in Varnville
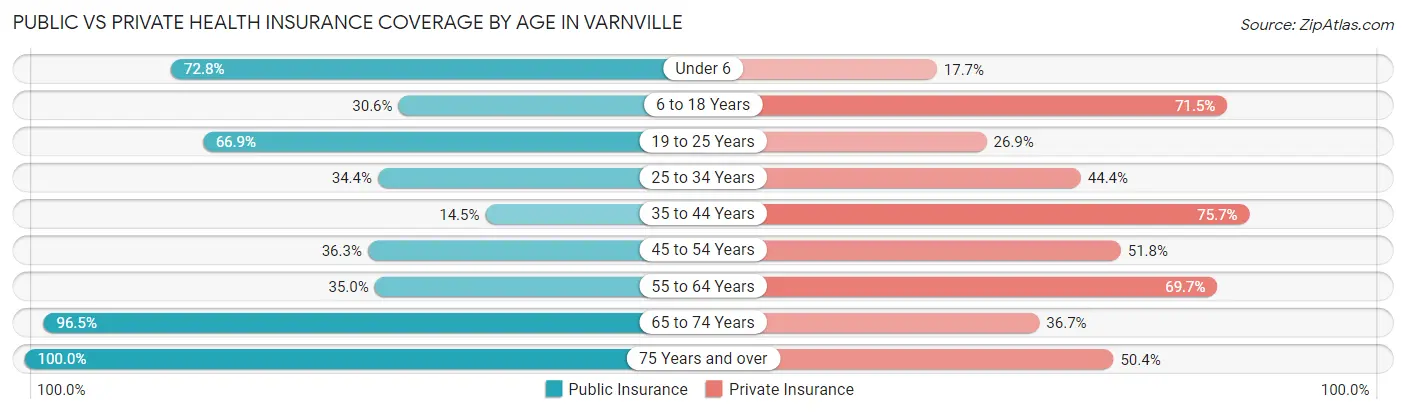
| Age Bracket | Public Insurance | Private Insurance |
| Under 6 | 99 (72.8%) | 24 (17.6%) |
| 6 to 18 Years | 128 (30.6%) | 299 (71.5%) |
| 19 to 25 Years | 162 (66.9%) | 65 (26.9%) |
| 25 to 34 Years | 52 (34.4%) | 67 (44.4%) |
| 35 to 44 Years | 50 (14.5%) | 261 (75.6%) |
| 45 to 54 Years | 61 (36.3%) | 87 (51.8%) |
| 55 to 64 Years | 89 (35.0%) | 177 (69.7%) |
| 65 to 74 Years | 192 (96.5%) | 73 (36.7%) |
| 75 Years and over | 230 (100.0%) | 116 (50.4%) |
| Total | 1,063 (49.6%) | 1,169 (54.5%) |
Disability Status by Sex by Age in Varnville
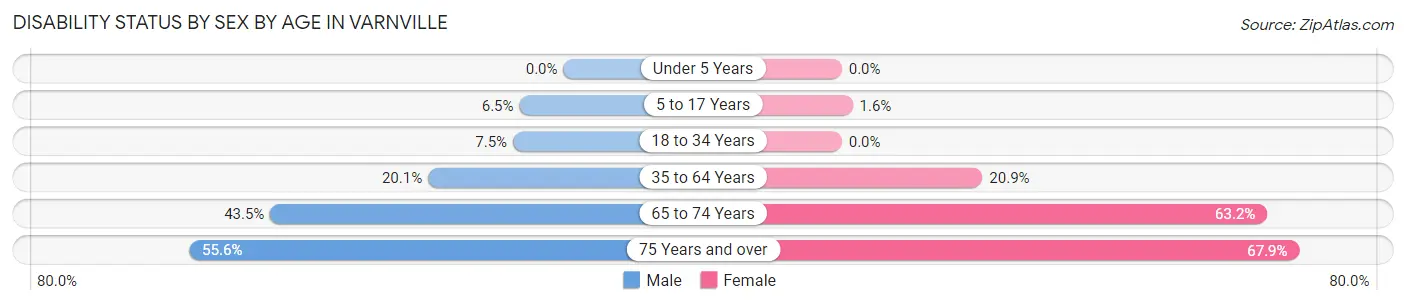
| Age Bracket | Male | Female |
| Under 5 Years | 0 (0.0%) | 0 (0.0%) |
| 5 to 17 Years | 16 (6.5%) | 3 (1.6%) |
| 18 to 34 Years | 20 (7.5%) | 0 (0.0%) |
| 35 to 64 Years | 81 (20.1%) | 76 (20.9%) |
| 65 to 74 Years | 37 (43.5%) | 72 (63.2%) |
| 75 Years and over | 55 (55.6%) | 89 (67.9%) |
Disability Class by Sex by Age in Varnville
Disability Class: Hearing Difficulty
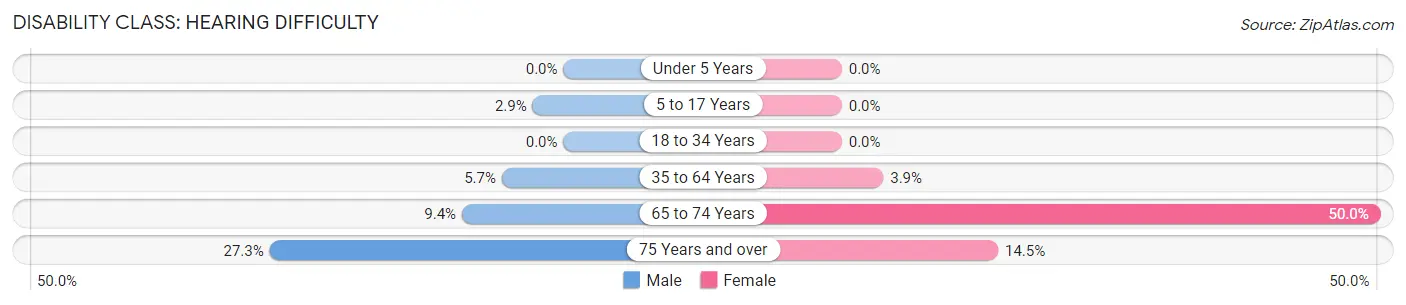
| Age Bracket | Male | Female |
| Under 5 Years | 0 (0.0%) | 0 (0.0%) |
| 5 to 17 Years | 7 (2.9%) | 0 (0.0%) |
| 18 to 34 Years | 0 (0.0%) | 0 (0.0%) |
| 35 to 64 Years | 23 (5.7%) | 14 (3.8%) |
| 65 to 74 Years | 8 (9.4%) | 57 (50.0%) |
| 75 Years and over | 27 (27.3%) | 19 (14.5%) |
Disability Class: Vision Difficulty
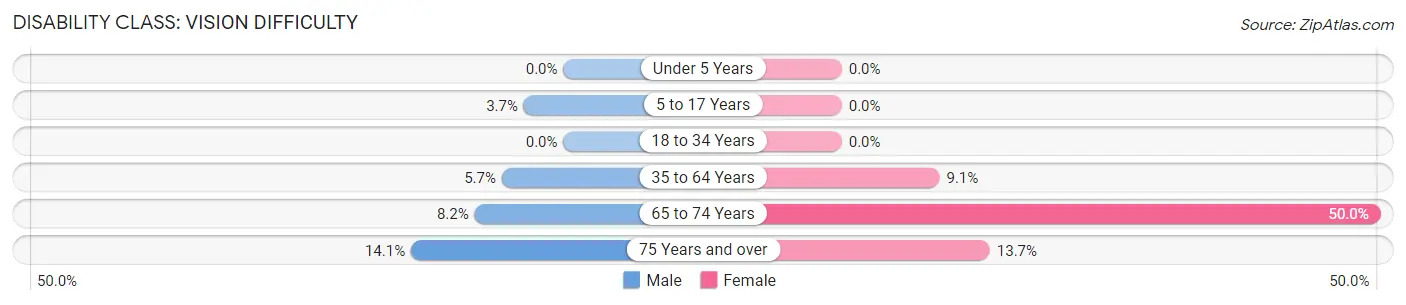
| Age Bracket | Male | Female |
| Under 5 Years | 0 (0.0%) | 0 (0.0%) |
| 5 to 17 Years | 9 (3.7%) | 0 (0.0%) |
| 18 to 34 Years | 0 (0.0%) | 0 (0.0%) |
| 35 to 64 Years | 23 (5.7%) | 33 (9.1%) |
| 65 to 74 Years | 7 (8.2%) | 57 (50.0%) |
| 75 Years and over | 14 (14.1%) | 18 (13.7%) |
Disability Class: Cognitive Difficulty
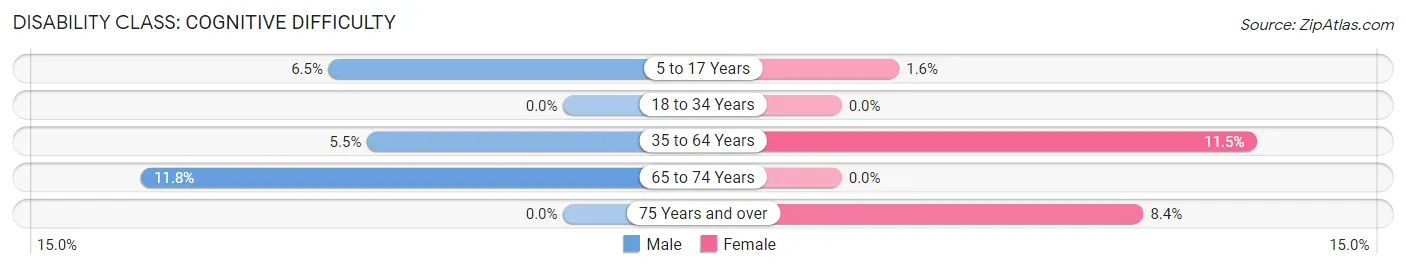
| Age Bracket | Male | Female |
| 5 to 17 Years | 16 (6.5%) | 3 (1.6%) |
| 18 to 34 Years | 0 (0.0%) | 0 (0.0%) |
| 35 to 64 Years | 22 (5.5%) | 42 (11.5%) |
| 65 to 74 Years | 10 (11.8%) | 0 (0.0%) |
| 75 Years and over | 0 (0.0%) | 11 (8.4%) |
Disability Class: Ambulatory Difficulty
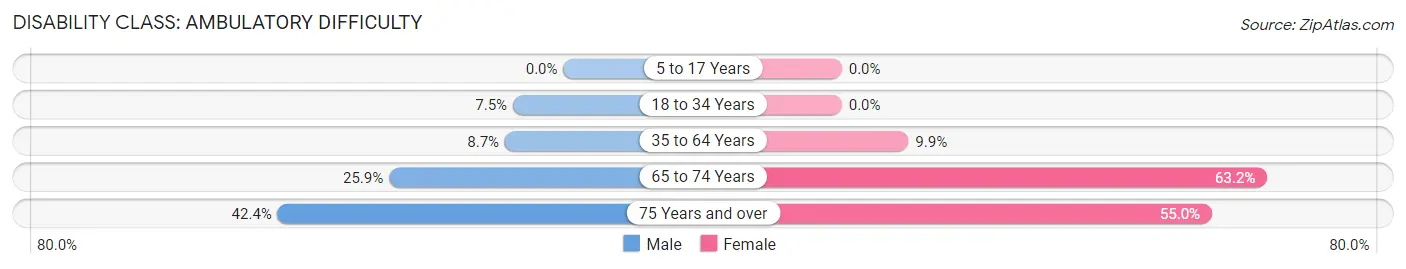
| Age Bracket | Male | Female |
| 5 to 17 Years | 0 (0.0%) | 0 (0.0%) |
| 18 to 34 Years | 20 (7.5%) | 0 (0.0%) |
| 35 to 64 Years | 35 (8.7%) | 36 (9.9%) |
| 65 to 74 Years | 22 (25.9%) | 72 (63.2%) |
| 75 Years and over | 42 (42.4%) | 72 (55.0%) |
Disability Class: Self-Care Difficulty
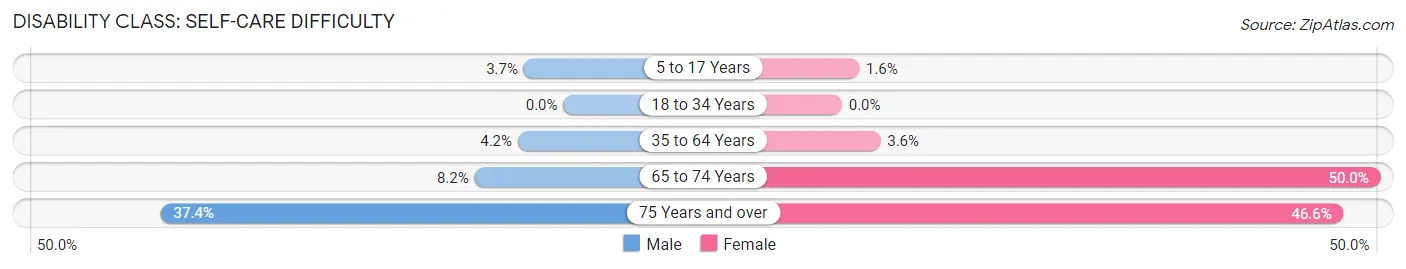
| Age Bracket | Male | Female |
| 5 to 17 Years | 9 (3.7%) | 3 (1.6%) |
| 18 to 34 Years | 0 (0.0%) | 0 (0.0%) |
| 35 to 64 Years | 17 (4.2%) | 13 (3.6%) |
| 65 to 74 Years | 7 (8.2%) | 57 (50.0%) |
| 75 Years and over | 37 (37.4%) | 61 (46.6%) |
Technology Access in Varnville
Computing Device Access in Varnville
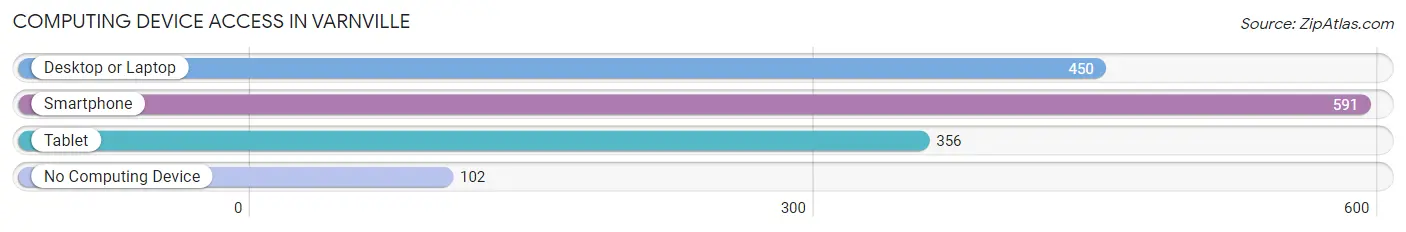
| Device Type | # Households | % Households |
| Desktop or Laptop | 450 | 61.3% |
| Smartphone | 591 | 80.5% |
| Tablet | 356 | 48.5% |
| No Computing Device | 102 | 13.9% |
| Total | 734 | 100.0% |
Internet Access in Varnville
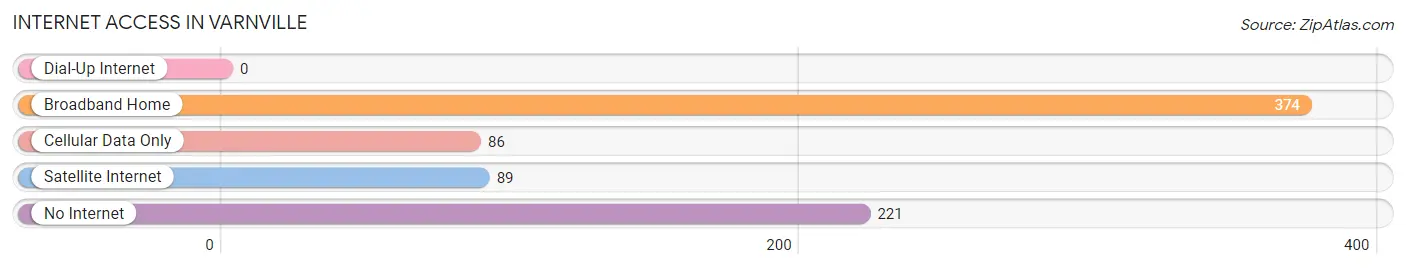
| Internet Type | # Households | % Households |
| Dial-Up Internet | 0 | 0.0% |
| Broadband Home | 374 | 50.9% |
| Cellular Data Only | 86 | 11.7% |
| Satellite Internet | 89 | 12.1% |
| No Internet | 221 | 30.1% |
| Total | 734 | 100.0% |
Varnville Summary
Varnville is a small town located in Hampton County, South Carolina. It is situated in the Lowcountry region of the state, approximately 30 miles northwest of Beaufort and 40 miles southwest of Charleston. The town was founded in 1883 and is named after the Varn family, who were early settlers in the area. As of the 2010 census, the population of Varnville was 1,845.
Geography
Varnville is located at 32°51'N, 81°7'W (32.85, -81.12). It is situated in the Lowcountry region of South Carolina, approximately 30 miles northwest of Beaufort and 40 miles southwest of Charleston. The town is located in the coastal plain, and is surrounded by pine forests and wetlands. The town is situated on the banks of the Coosawhatchie River, which flows through the town and is a popular spot for fishing and boating.
Climate
Varnville has a humid subtropical climate, with hot, humid summers and mild winters. The average annual temperature is around 70°F (21°C). The average annual precipitation is around 50 inches (127 cm).
Demographics
As of the 2010 census, the population of Varnville was 1,845. The racial makeup of the town was 79.3% White, 17.2% African American, 0.3% Native American, 0.7% Asian, 0.1% Pacific Islander, 1.2% from other races, and 1.4% from two or more races. Hispanic or Latino of any race were 2.3% of the population.
Economy
Varnville is a small, rural town with a largely agricultural economy. The town is home to several farms, which produce a variety of crops, including corn, soybeans, cotton, and peanuts. The town is also home to several small businesses, including restaurants, convenience stores, and auto repair shops.
The town is also home to several manufacturing companies, including a paper mill, a furniture factory, and a plastics factory. The town is also home to a number of retail stores, including a grocery store, a hardware store, and a clothing store.
Education
Varnville is served by the Hampton County School District. The town is home to two public schools: Varnville Elementary School and Varnville High School. The town is also home to a private school, St. Mary's Catholic School.
Conclusion
Varnville is a small town located in Hampton County, South Carolina. It is situated in the Lowcountry region of the state, approximately 30 miles northwest of Beaufort and 40 miles southwest of Charleston. The town was founded in 1883 and is named after the Varn family, who were early settlers in the area. As of the 2010 census, the population of Varnville was 1,845. The town has a humid subtropical climate, with hot, humid summers and mild winters. The town has a largely agricultural economy, with several farms producing a variety of crops, as well as several small businesses and manufacturing companies. The town is served by the Hampton County School District, and is home to two public schools and one private school.
Common Questions
What is Per Capita Income in Varnville?
Per Capita income in Varnville is $18,571.
What is the Median Family Income in Varnville?
Median Family Income in Varnville is $56,000.
What is the Median Household income in Varnville?
Median Household Income in Varnville is $38,092.
What is Income or Wage Gap in Varnville?
Income or Wage Gap in Varnville is 31.0%.
Women in Varnville earn 69.0 cents for every dollar earned by a man.
What is Inequality or Gini Index in Varnville?
Inequality or Gini Index in Varnville is 0.46.
What is the Total Population of Varnville?
Total Population of Varnville is 2,173.
What is the Total Male Population of Varnville?
Total Male Population of Varnville is 1,188.
What is the Total Female Population of Varnville?
Total Female Population of Varnville is 985.
What is the Ratio of Males per 100 Females in Varnville?
There are 120.61 Males per 100 Females in Varnville.
What is the Ratio of Females per 100 Males in Varnville?
There are 82.91 Females per 100 Males in Varnville.
What is the Median Population Age in Varnville?
Median Population Age in Varnville is 39.3 Years.
What is the Average Family Size in Varnville
Average Family Size in Varnville is 3.8 People.
What is the Average Household Size in Varnville
Average Household Size in Varnville is 2.9 People.
How Large is the Labor Force in Varnville?
There are 932 People in the Labor Forcein in Varnville.
What is the Percentage of People in the Labor Force in Varnville?
55.9% of People are in the Labor Force in Varnville.
What is the Unemployment Rate in Varnville?
Unemployment Rate in Varnville is 14.8%.