Zip Codes with the Highest Percentage of Population Employed in Security & Protection in Orangeburg, SC
RELATED REPORTS & OPTIONS
Security & Protection
Orangeburg
Compare Zip Codes
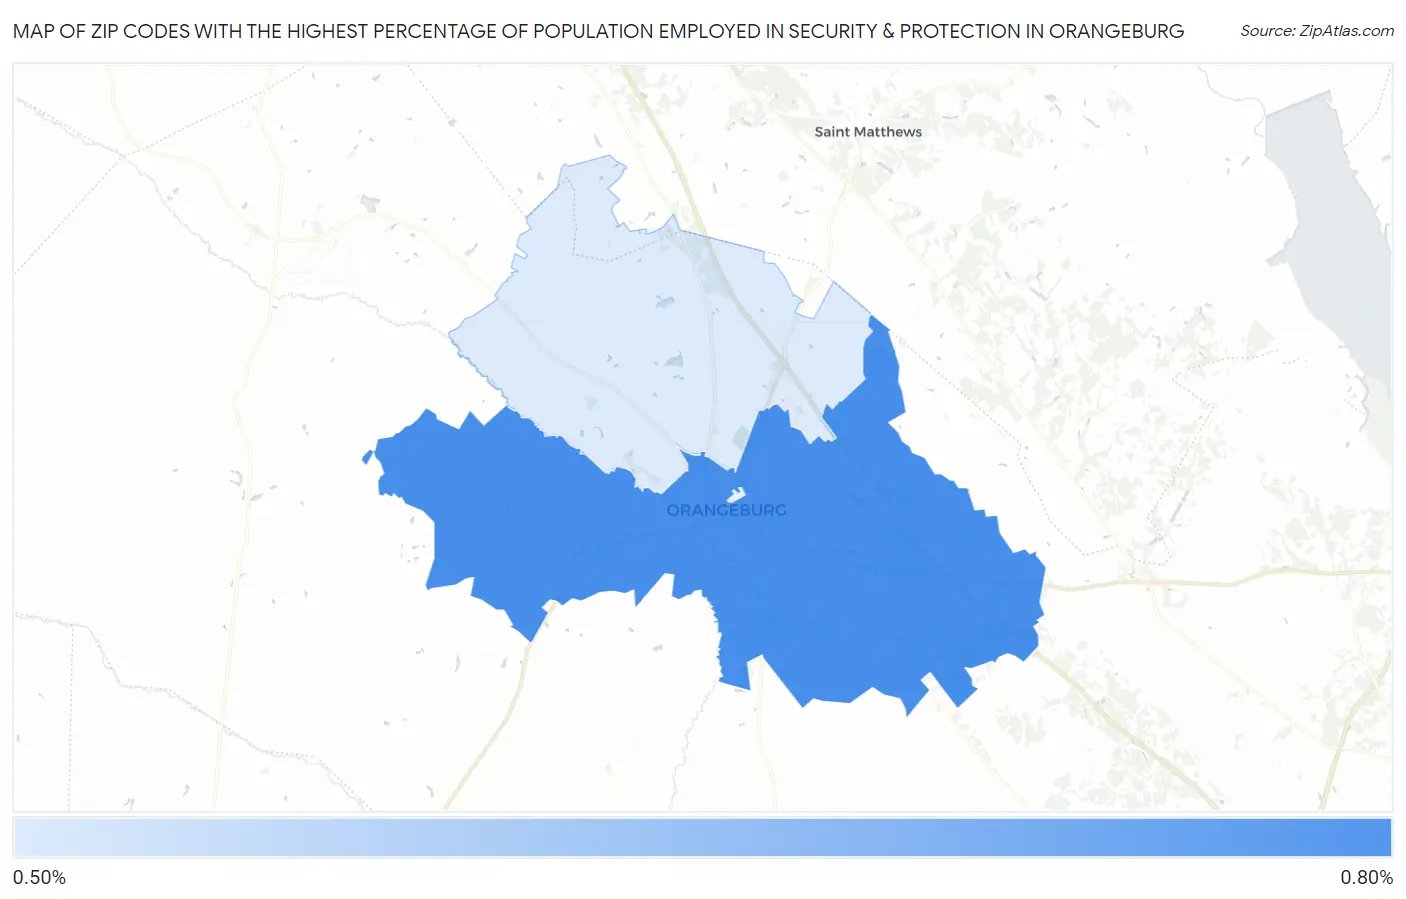
Map of Zip Codes with the Highest Percentage of Population Employed in Security & Protection in Orangeburg
0.59%
0.73%
Zip Codes with the Highest Percentage of Population Employed in Security & Protection in Orangeburg, SC
| Zip Code | % Employed | vs State | vs National | |
| 1. | 29115 | 0.73% | 2.1%(-1.37)#317 | 2.1%(-1.42)#21,892 |
| 2. | 29118 | 0.59% | 2.1%(-1.51)#326 | 2.1%(-1.55)#22,700 |
1
Common Questions
What are the Top Zip Codes with the Highest Percentage of Population Employed in Security & Protection in Orangeburg, SC?
Top Zip Codes with the Highest Percentage of Population Employed in Security & Protection in Orangeburg, SC are:
What zip code has the Highest Percentage of Population Employed in Security & Protection in Orangeburg, SC?
29115 has the Highest Percentage of Population Employed in Security & Protection in Orangeburg, SC with 0.73%.
What is the Percentage of Population Employed in Security & Protection in Orangeburg, SC?
Percentage of Population Employed in Security & Protection in Orangeburg is 0.80%.
What is the Percentage of Population Employed in Security & Protection in South Carolina?
Percentage of Population Employed in Security & Protection in South Carolina is 2.1%.
What is the Percentage of Population Employed in Security & Protection in the United States?
Percentage of Population Employed in Security & Protection in the United States is 2.1%.