Oakland, SC Map & Demographics
Oakland Map
Oakland Overview
$30,295
PER CAPITA INCOME
$57,167
AVG FAMILY INCOME
$55,104
AVG HOUSEHOLD INCOME
0.45
INEQUALITY / GINI INDEX
958
TOTAL POPULATION
417
MALE POPULATION
541
FEMALE POPULATION
77.08
MALES / 100 FEMALES
129.74
FEMALES / 100 MALES
42.2
MEDIAN AGE
3.4
AVG FAMILY SIZE
2.0
AVG HOUSEHOLD SIZE
337
LABOR FORCE [ PEOPLE ]
45.7%
PERCENT IN LABOR FORCE
8.4%
UNEMPLOYMENT RATE
Income in Oakland
Income Overview in Oakland
Per Capita Income in Oakland is $30,295, while median incomes of families and households are $57,167 and $55,104 respectively.
| Characteristic | Number | Measure |
| Per Capita Income | 958 | $30,295 |
| Median Family Income | 196 | $57,167 |
| Mean Family Income | 196 | $72,484 |
| Median Household Income | 473 | $55,104 |
| Mean Household Income | 473 | $58,387 |
| Income Deficit | 196 | $0 |
| Wage / Income Gap (%) | 958 | 0.00% |
| Wage / Income Gap ($) | 958 | 100.00¢ per $1 |
| Gini / Inequality Index | 958 | 0.45 |
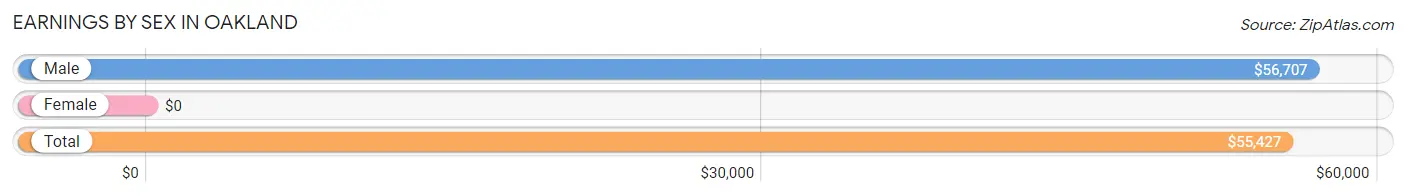
Earnings by Sex in Oakland
| Sex | Number | Average Earnings |
| Male | 196 (51.3%) | $56,707 |
| Female | 186 (48.7%) | $0 |
| Total | 382 (100.0%) | $55,427 |
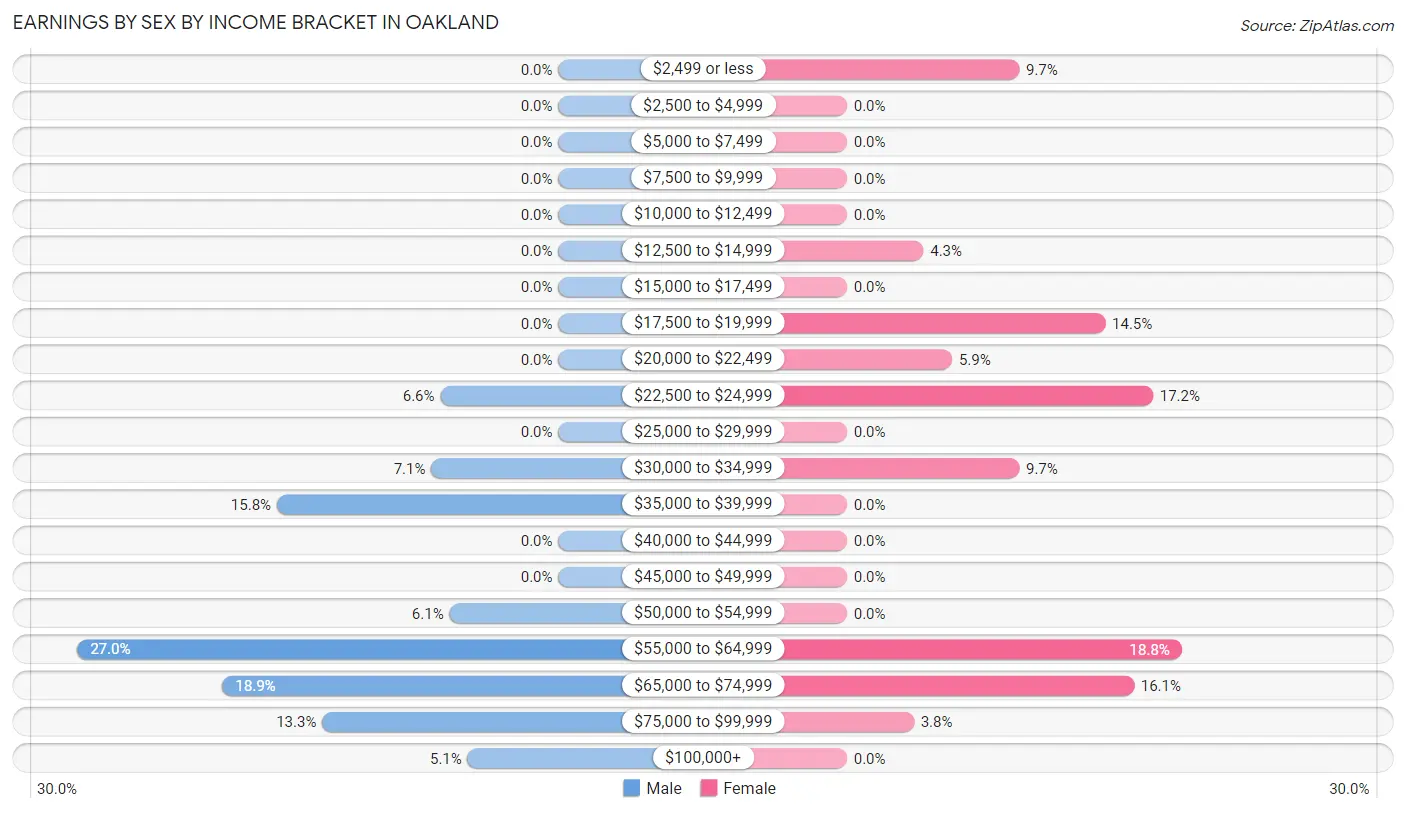
Earnings by Sex by Income Bracket in Oakland
The most common earnings brackets in Oakland are $55,000 to $64,999 for men (53 | 27.0%) and $55,000 to $64,999 for women (35 | 18.8%).
| Income | Male | Female |
| $2,499 or less | 0 (0.0%) | 18 (9.7%) |
| $2,500 to $4,999 | 0 (0.0%) | 0 (0.0%) |
| $5,000 to $7,499 | 0 (0.0%) | 0 (0.0%) |
| $7,500 to $9,999 | 0 (0.0%) | 0 (0.0%) |
| $10,000 to $12,499 | 0 (0.0%) | 0 (0.0%) |
| $12,500 to $14,999 | 0 (0.0%) | 8 (4.3%) |
| $15,000 to $17,499 | 0 (0.0%) | 0 (0.0%) |
| $17,500 to $19,999 | 0 (0.0%) | 27 (14.5%) |
| $20,000 to $22,499 | 0 (0.0%) | 11 (5.9%) |
| $22,500 to $24,999 | 13 (6.6%) | 32 (17.2%) |
| $25,000 to $29,999 | 0 (0.0%) | 0 (0.0%) |
| $30,000 to $34,999 | 14 (7.1%) | 18 (9.7%) |
| $35,000 to $39,999 | 31 (15.8%) | 0 (0.0%) |
| $40,000 to $44,999 | 0 (0.0%) | 0 (0.0%) |
| $45,000 to $49,999 | 0 (0.0%) | 0 (0.0%) |
| $50,000 to $54,999 | 12 (6.1%) | 0 (0.0%) |
| $55,000 to $64,999 | 53 (27.0%) | 35 (18.8%) |
| $65,000 to $74,999 | 37 (18.9%) | 30 (16.1%) |
| $75,000 to $99,999 | 26 (13.3%) | 7 (3.8%) |
| $100,000+ | 10 (5.1%) | 0 (0.0%) |
| Total | 196 (100.0%) | 186 (100.0%) |
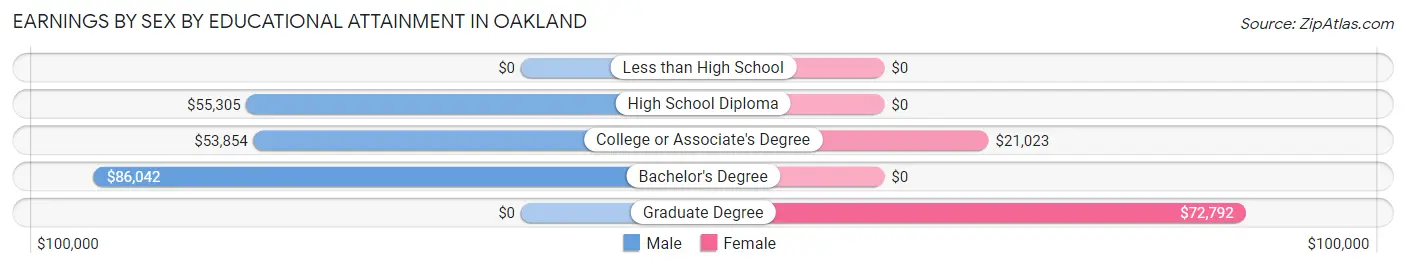
Earnings by Sex by Educational Attainment in Oakland
| Educational Attainment | Male Income | Female Income |
| Less than High School | - | - |
| High School Diploma | $55,305 | $0 |
| College or Associate's Degree | $53,854 | $21,023 |
| Bachelor's Degree | $86,042 | $0 |
| Graduate Degree | - | - |
| Total | $57,134 | $0 |
Family Income in Oakland
Family Income Brackets in Oakland
According to the Oakland family income data, there are 72 families falling into the $50,000 to $74,999 income range, which is the most common income bracket and makes up 36.7% of all families.
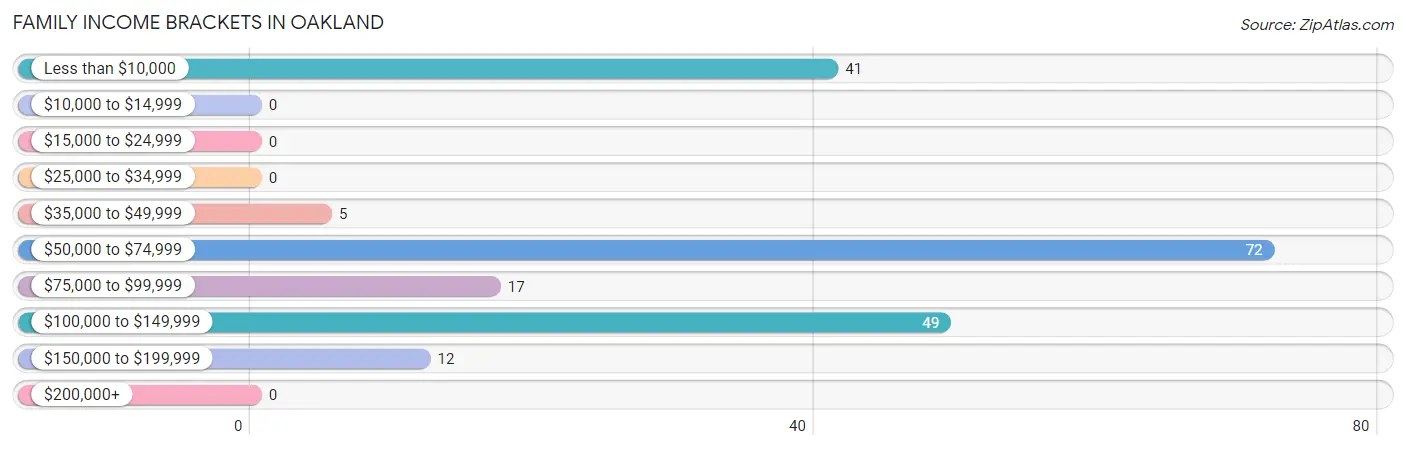
| Income Bracket | # Families | % Families |
| Less than $10,000 | 41 | 20.9% |
| $10,000 to $14,999 | 0 | 0.0% |
| $15,000 to $24,999 | 0 | 0.0% |
| $25,000 to $34,999 | 0 | 0.0% |
| $35,000 to $49,999 | 5 | 2.6% |
| $50,000 to $74,999 | 72 | 36.7% |
| $75,000 to $99,999 | 17 | 8.7% |
| $100,000 to $149,999 | 49 | 25.0% |
| $150,000 to $199,999 | 12 | 6.1% |
| $200,000+ | 0 | 0.0% |
Family Income by Famaliy Size in Oakland
3-person families (75 | 38.3%) account for the highest median family income in Oakland with $56,477 per family, while 3-person families (75 | 38.3%) have the highest median income of $18,826 per family member.
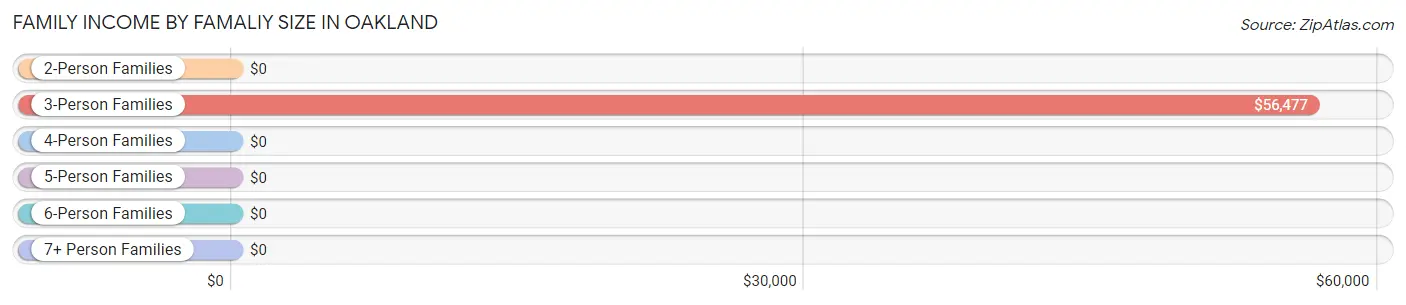
| Income Bracket | # Families | Median Income |
| 2-Person Families | 60 (30.6%) | $0 |
| 3-Person Families | 75 (38.3%) | $56,477 |
| 4-Person Families | 39 (19.9%) | $0 |
| 5-Person Families | 12 (6.1%) | $0 |
| 6-Person Families | 10 (5.1%) | $0 |
| 7+ Person Families | 0 (0.0%) | $0 |
| Total | 196 (100.0%) | $57,167 |
Family Income by Number of Earners in Oakland
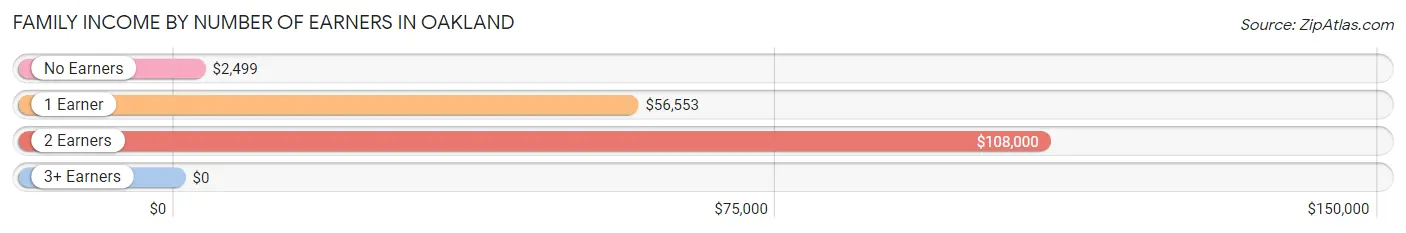
| Number of Earners | # Families | Median Income |
| No Earners | 41 (20.9%) | $2,499 |
| 1 Earner | 77 (39.3%) | $56,553 |
| 2 Earners | 78 (39.8%) | $108,000 |
| 3+ Earners | 0 (0.0%) | $0 |
| Total | 196 (100.0%) | $57,167 |
Household Income in Oakland
Household Income Brackets in Oakland
With 135 households falling in the category, the $15,000 to $24,999 income range is the most frequent in Oakland, accounting for 28.5% of all households.
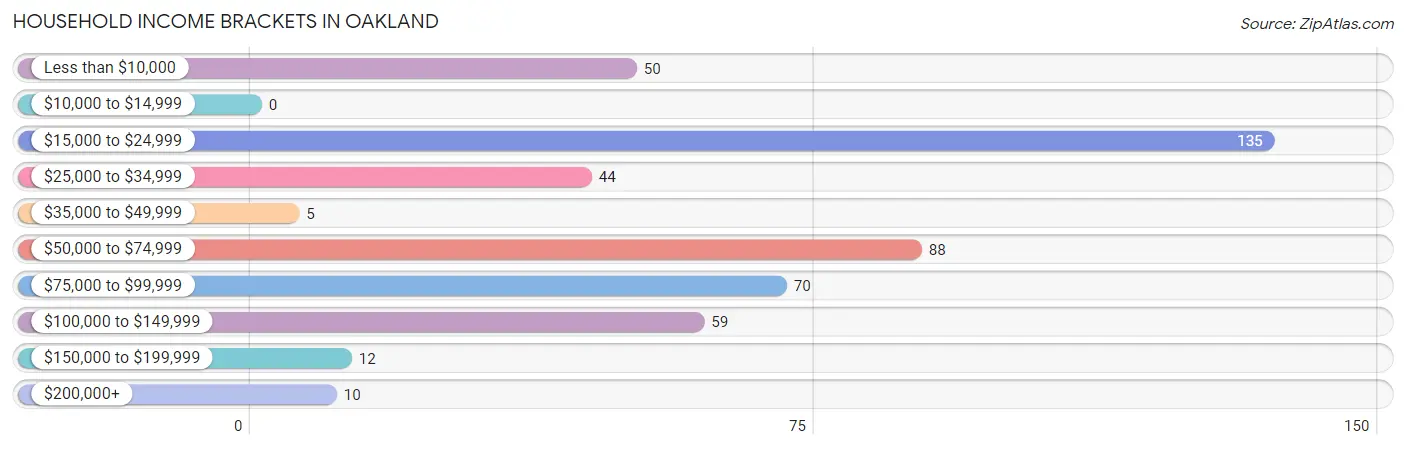
| Income Bracket | # Households | % Households |
| Less than $10,000 | 50 | 10.6% |
| $10,000 to $14,999 | 0 | 0.0% |
| $15,000 to $24,999 | 135 | 28.5% |
| $25,000 to $34,999 | 44 | 9.3% |
| $35,000 to $49,999 | 5 | 1.1% |
| $50,000 to $74,999 | 88 | 18.6% |
| $75,000 to $99,999 | 70 | 14.8% |
| $100,000 to $149,999 | 59 | 12.5% |
| $150,000 to $199,999 | 12 | 2.5% |
| $200,000+ | 10 | 2.1% |
Household Income by Householder Age in Oakland
The median household income in Oakland is $55,104, with the highest median household income of $56,932 found in the 45 to 64 years age bracket for the primary householder. A total of 191 households (40.4%) fall into this category. Meanwhile, the 15 to 24 years age bracket for the primary householder has the lowest median household income of $0, with 55 households (11.6%) in this group.
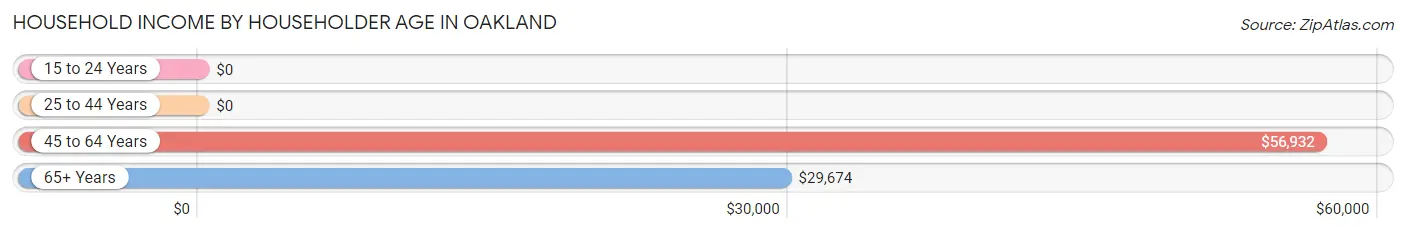
| Income Bracket | # Households | Median Income |
| 15 to 24 Years | 55 (11.6%) | $0 |
| 25 to 44 Years | 81 (17.1%) | $0 |
| 45 to 64 Years | 191 (40.4%) | $56,932 |
| 65+ Years | 146 (30.9%) | $29,674 |
| Total | 473 (100.0%) | $55,104 |
Poverty in Oakland
Income Below Poverty by Sex and Age in Oakland
With 8.9% poverty level for males and 15.5% for females among the residents of Oakland, under 5 year old males and under 5 year old females are the most vulnerable to poverty, with 28 males (100.0%) and 43 females (100.0%) in their respective age groups living below the poverty level.
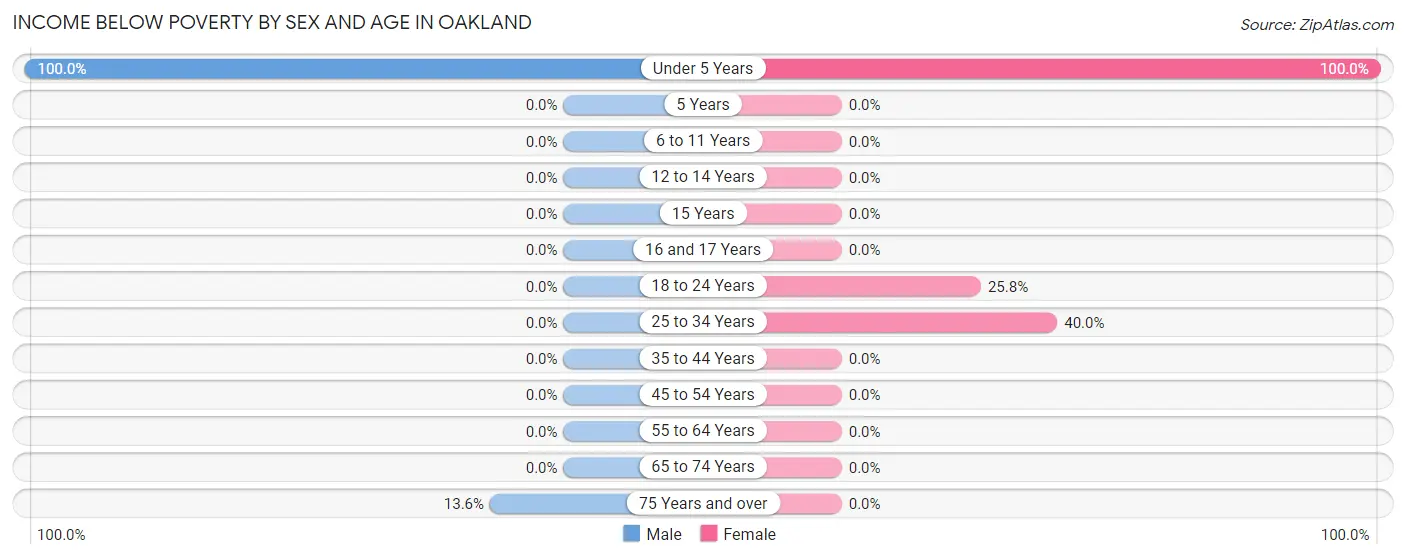
| Age Bracket | Male | Female |
| Under 5 Years | 28 (100.0%) | 43 (100.0%) |
| 5 Years | 0 (0.0%) | 0 (0.0%) |
| 6 to 11 Years | 0 (0.0%) | 0 (0.0%) |
| 12 to 14 Years | 0 (0.0%) | 0 (0.0%) |
| 15 Years | 0 (0.0%) | 0 (0.0%) |
| 16 and 17 Years | 0 (0.0%) | 0 (0.0%) |
| 18 to 24 Years | 0 (0.0%) | 23 (25.8%) |
| 25 to 34 Years | 0 (0.0%) | 18 (40.0%) |
| 35 to 44 Years | 0 (0.0%) | 0 (0.0%) |
| 45 to 54 Years | 0 (0.0%) | 0 (0.0%) |
| 55 to 64 Years | 0 (0.0%) | 0 (0.0%) |
| 65 to 74 Years | 0 (0.0%) | 0 (0.0%) |
| 75 Years and over | 9 (13.6%) | 0 (0.0%) |
| Total | 37 (8.9%) | 84 (15.5%) |
Income Above Poverty by Sex and Age in Oakland
According to the poverty statistics in Oakland, males aged 6 to 11 years and females aged 6 to 11 years are the age groups that are most secure financially, with 100.0% of males and 100.0% of females in these age groups living above the poverty line.
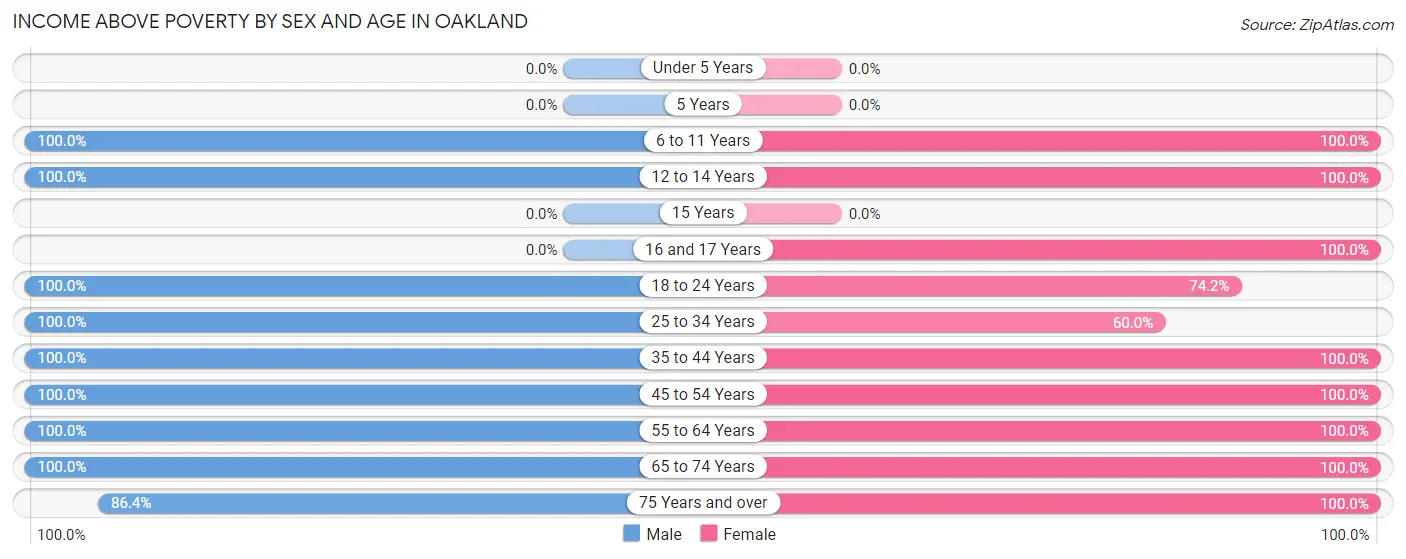
| Age Bracket | Male | Female |
| Under 5 Years | 0 (0.0%) | 0 (0.0%) |
| 5 Years | 0 (0.0%) | 0 (0.0%) |
| 6 to 11 Years | 63 (100.0%) | 27 (100.0%) |
| 12 to 14 Years | 28 (100.0%) | 31 (100.0%) |
| 15 Years | 0 (0.0%) | 0 (0.0%) |
| 16 and 17 Years | 0 (0.0%) | 10 (100.0%) |
| 18 to 24 Years | 22 (100.0%) | 66 (74.2%) |
| 25 to 34 Years | 25 (100.0%) | 27 (60.0%) |
| 35 to 44 Years | 53 (100.0%) | 23 (100.0%) |
| 45 to 54 Years | 79 (100.0%) | 85 (100.0%) |
| 55 to 64 Years | 44 (100.0%) | 87 (100.0%) |
| 65 to 74 Years | 9 (100.0%) | 42 (100.0%) |
| 75 Years and over | 57 (86.4%) | 59 (100.0%) |
| Total | 380 (91.1%) | 457 (84.5%) |
Income Below Poverty Among Married-Couple Families in Oakland
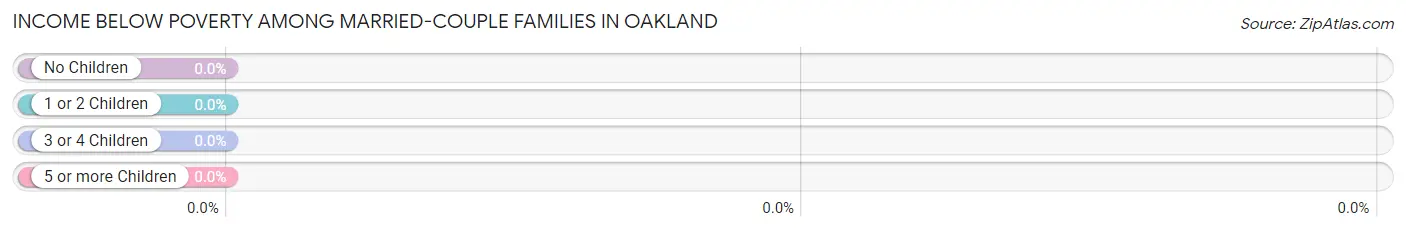
| Children | Above Poverty | Below Poverty |
| No Children | 57 (100.0%) | 0 (0.0%) |
| 1 or 2 Children | 92 (100.0%) | 0 (0.0%) |
| 3 or 4 Children | 0 (0.0%) | 0 (0.0%) |
| 5 or more Children | 0 (0.0%) | 0 (0.0%) |
| Total | 149 (100.0%) | 0 (0.0%) |
Income Below Poverty Among Single-Parent Households in Oakland
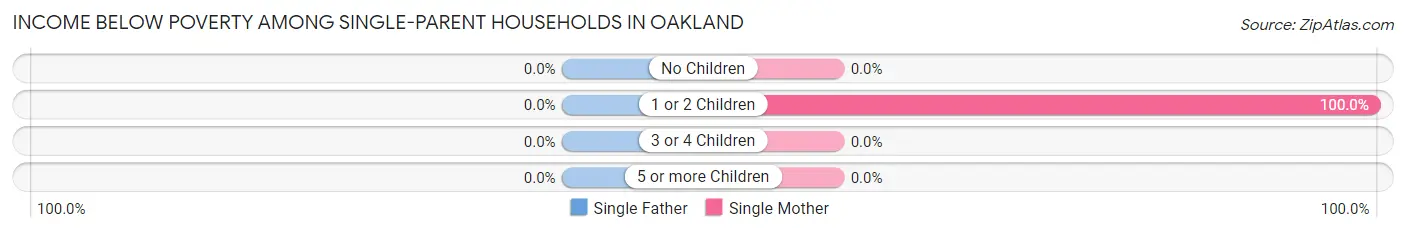
| Children | Single Father | Single Mother |
| No Children | 0 (0.0%) | 0 (0.0%) |
| 1 or 2 Children | 0 (0.0%) | 41 (100.0%) |
| 3 or 4 Children | 0 (0.0%) | 0 (0.0%) |
| 5 or more Children | 0 (0.0%) | 0 (0.0%) |
| Total | 0 (0.0%) | 41 (87.2%) |
Income Below Poverty Among Married-Couple vs Single-Parent Households in Oakland
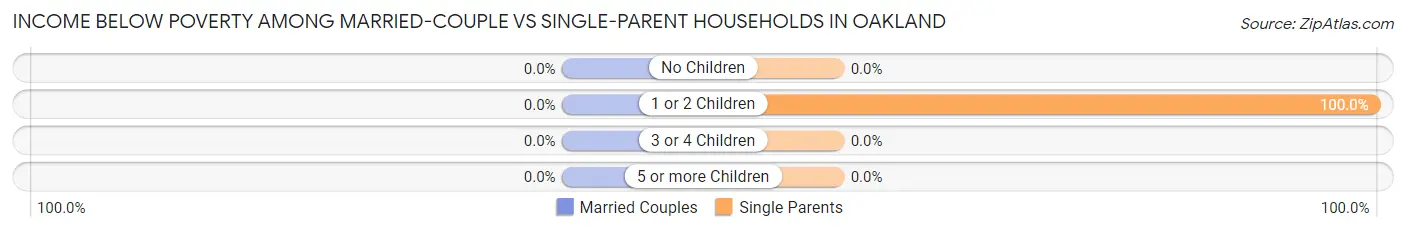
| Children | Married-Couple Families | Single-Parent Households |
| No Children | 0 (0.0%) | 0 (0.0%) |
| 1 or 2 Children | 0 (0.0%) | 41 (100.0%) |
| 3 or 4 Children | 0 (0.0%) | 0 (0.0%) |
| 5 or more Children | 0 (0.0%) | 0 (0.0%) |
| Total | 0 (0.0%) | 41 (87.2%) |
Race in Oakland
The most populous races in Oakland are White / Caucasian (472 | 49.3%), Black / African American (281 | 29.3%), and Two or more Races (193 | 20.2%).
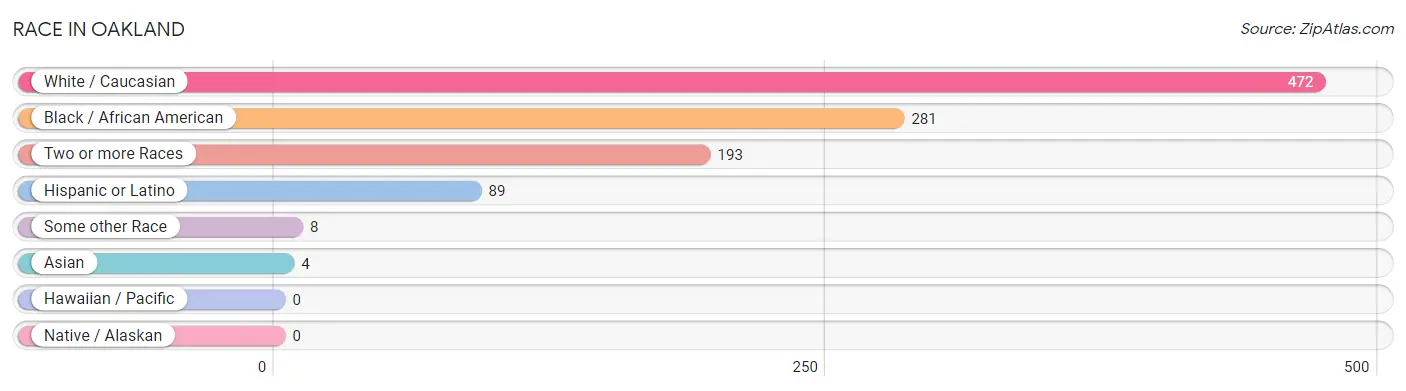
| Race | # Population | % Population |
| Asian | 4 | 0.4% |
| Black / African American | 281 | 29.3% |
| Hawaiian / Pacific | 0 | 0.0% |
| Hispanic or Latino | 89 | 9.3% |
| Native / Alaskan | 0 | 0.0% |
| White / Caucasian | 472 | 49.3% |
| Two or more Races | 193 | 20.2% |
| Some other Race | 8 | 0.8% |
| Total | 958 | 100.0% |
Ancestry in Oakland
The most populous ancestries reported in Oakland are Irish (107 | 11.2%), English (103 | 10.7%), German (82 | 8.6%), American (59 | 6.2%), and Cherokee (59 | 6.2%), together accounting for 42.8% of all Oakland residents.
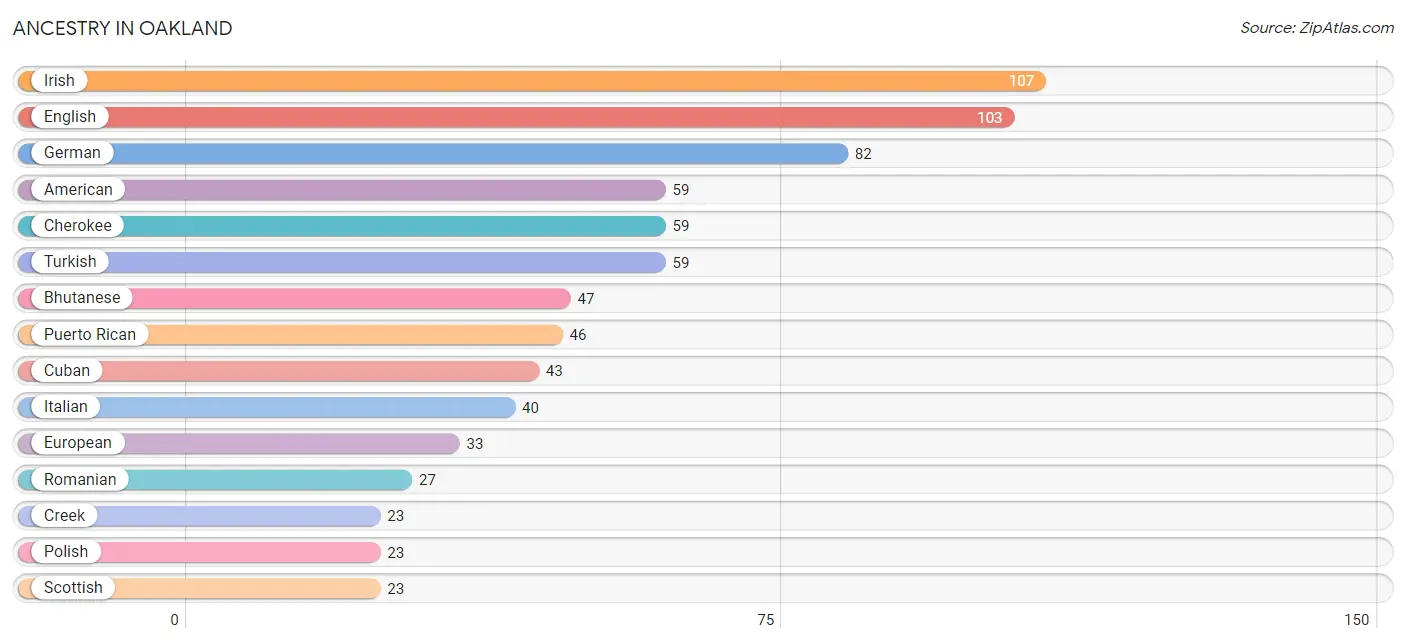
| Ancestry | # Population | % Population |
| American | 59 | 6.2% |
| Bhutanese | 47 | 4.9% |
| Cherokee | 59 | 6.2% |
| Creek | 23 | 2.4% |
| Cuban | 43 | 4.5% |
| Czech | 9 | 0.9% |
| Dutch | 10 | 1.0% |
| English | 103 | 10.7% |
| European | 33 | 3.4% |
| French | 22 | 2.3% |
| German | 82 | 8.6% |
| Irish | 107 | 11.2% |
| Italian | 40 | 4.2% |
| Norwegian | 5 | 0.5% |
| Polish | 23 | 2.4% |
| Puerto Rican | 46 | 4.8% |
| Romanian | 27 | 2.8% |
| Scottish | 23 | 2.4% |
| Turkish | 59 | 6.2% | View All 19 Rows |
Immigrants in Oakland
The most numerous immigrant groups reported in Oakland came from England (9 | 0.9%), Europe (9 | 0.9%), Northern Europe (9 | 0.9%), Asia (4 | 0.4%), and Eastern Asia (4 | 0.4%), together accounting for 3.7% of all Oakland residents.
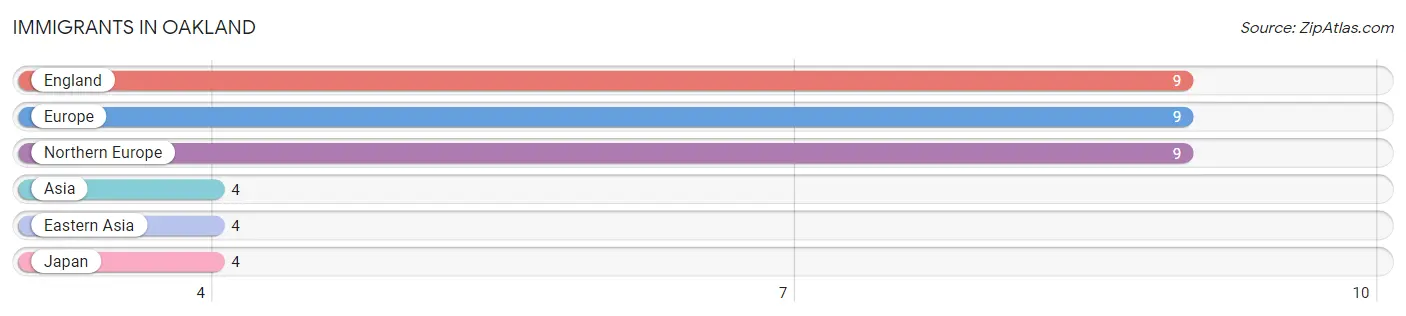
| Immigration Origin | # Population | % Population |
| Asia | 4 | 0.4% |
| Eastern Asia | 4 | 0.4% |
| England | 9 | 0.9% |
| Europe | 9 | 0.9% |
| Japan | 4 | 0.4% |
| Northern Europe | 9 | 0.9% | View All 6 Rows |
Sex and Age in Oakland
Sex and Age in Oakland
The most populous age groups in Oakland are 5 to 9 Years (50 | 12.0%) for men and 55 to 59 Years (66 | 12.2%) for women.
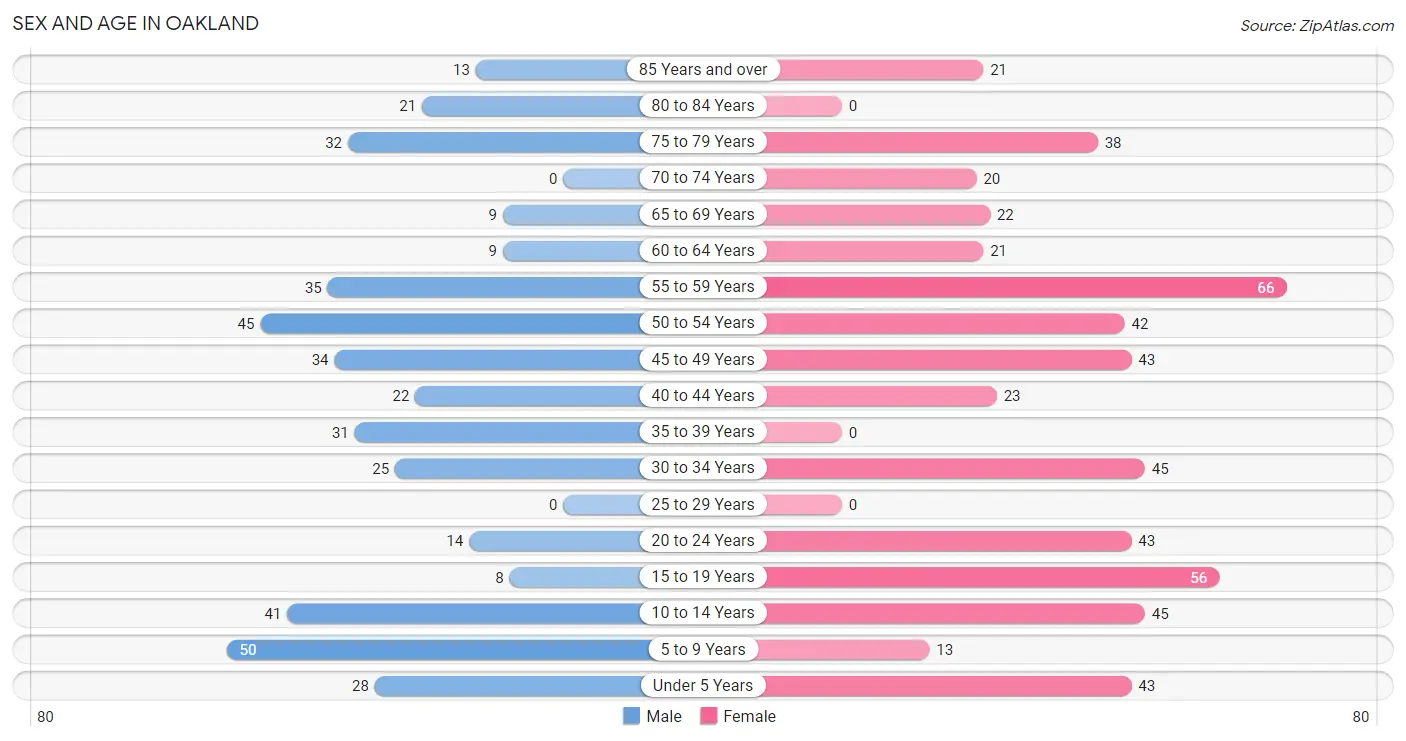
| Age Bracket | Male | Female |
| Under 5 Years | 28 (6.7%) | 43 (8.0%) |
| 5 to 9 Years | 50 (12.0%) | 13 (2.4%) |
| 10 to 14 Years | 41 (9.8%) | 45 (8.3%) |
| 15 to 19 Years | 8 (1.9%) | 56 (10.3%) |
| 20 to 24 Years | 14 (3.4%) | 43 (8.0%) |
| 25 to 29 Years | 0 (0.0%) | 0 (0.0%) |
| 30 to 34 Years | 25 (6.0%) | 45 (8.3%) |
| 35 to 39 Years | 31 (7.4%) | 0 (0.0%) |
| 40 to 44 Years | 22 (5.3%) | 23 (4.3%) |
| 45 to 49 Years | 34 (8.2%) | 43 (8.0%) |
| 50 to 54 Years | 45 (10.8%) | 42 (7.8%) |
| 55 to 59 Years | 35 (8.4%) | 66 (12.2%) |
| 60 to 64 Years | 9 (2.2%) | 21 (3.9%) |
| 65 to 69 Years | 9 (2.2%) | 22 (4.1%) |
| 70 to 74 Years | 0 (0.0%) | 20 (3.7%) |
| 75 to 79 Years | 32 (7.7%) | 38 (7.0%) |
| 80 to 84 Years | 21 (5.0%) | 0 (0.0%) |
| 85 Years and over | 13 (3.1%) | 21 (3.9%) |
| Total | 417 (100.0%) | 541 (100.0%) |
Families and Households in Oakland
Median Family Size in Oakland
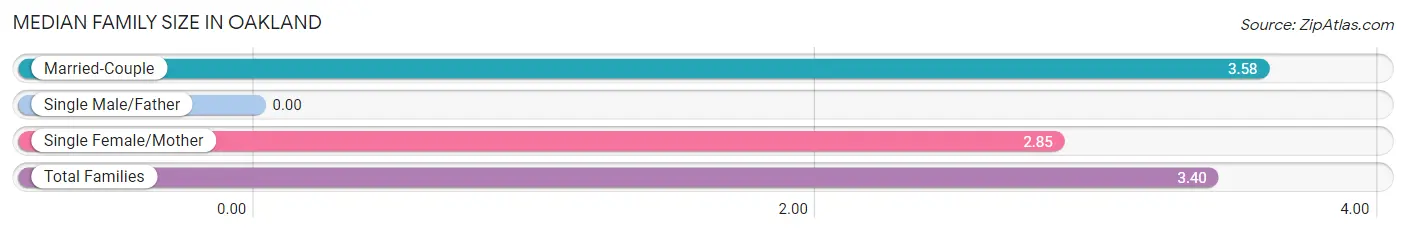
| Family Type | # Families | Family Size |
| Married-Couple | 149 (76.0%) | 3.58 |
| Single Male/Father | 0 (0.0%) | - |
| Single Female/Mother | 47 (24.0%) | 2.85 |
| Total Families | 196 (100.0%) | 3.40 |
Median Household Size in Oakland
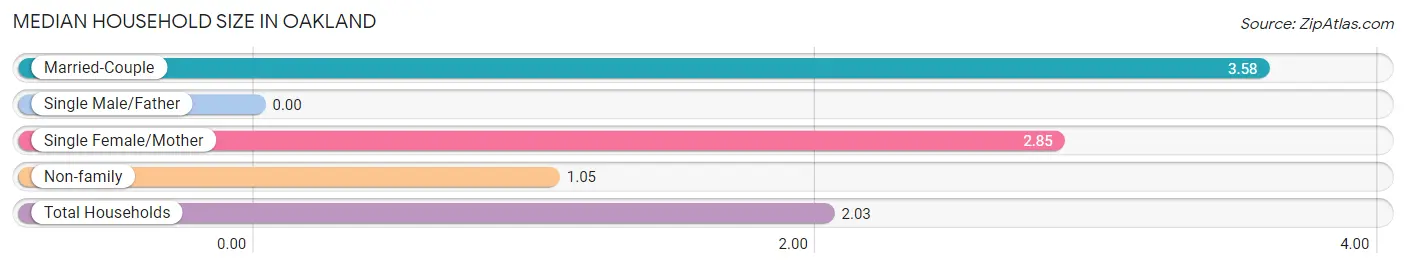
| Household Type | # Households | Household Size |
| Married-Couple | 149 (31.5%) | 3.58 |
| Single Male/Father | 0 (0.0%) | - |
| Single Female/Mother | 47 (9.9%) | 2.85 |
| Non-family | 277 (58.6%) | 1.05 |
| Total Households | 473 (100.0%) | 2.03 |
Household Size by Marriage Status in Oakland
Out of a total of 473 households in Oakland, 196 (41.4%) are family households, while 277 (58.6%) are nonfamily households. The most numerous type of family households are 3-person households, comprising 75, and the most common type of nonfamily households are 1-person households, comprising 265.
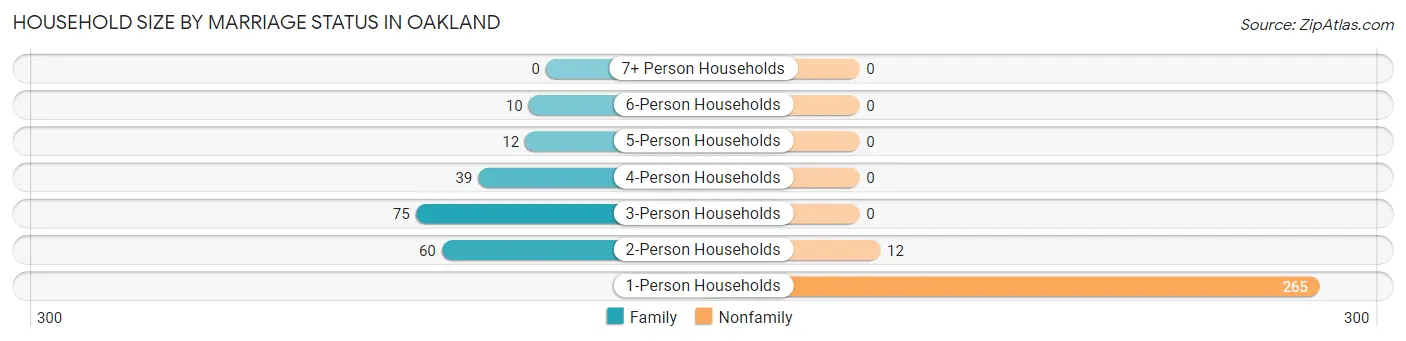
| Household Size | Family Households | Nonfamily Households |
| 1-Person Households | - | 265 (56.0%) |
| 2-Person Households | 60 (12.7%) | 12 (2.5%) |
| 3-Person Households | 75 (15.9%) | 0 (0.0%) |
| 4-Person Households | 39 (8.3%) | 0 (0.0%) |
| 5-Person Households | 12 (2.5%) | 0 (0.0%) |
| 6-Person Households | 10 (2.1%) | 0 (0.0%) |
| 7+ Person Households | 0 (0.0%) | 0 (0.0%) |
| Total | 196 (41.4%) | 277 (58.6%) |
Female Fertility in Oakland
Fertility by Age in Oakland
Average fertility rate in Oakland is 104.0 births per 1,000 women. Women in the age bracket of 15 to 19 years have the highest fertility rate with 411.0 births per 1,000 women. Women in the age bracket of 15 to 19 years acount for 100.0% of all women with births.
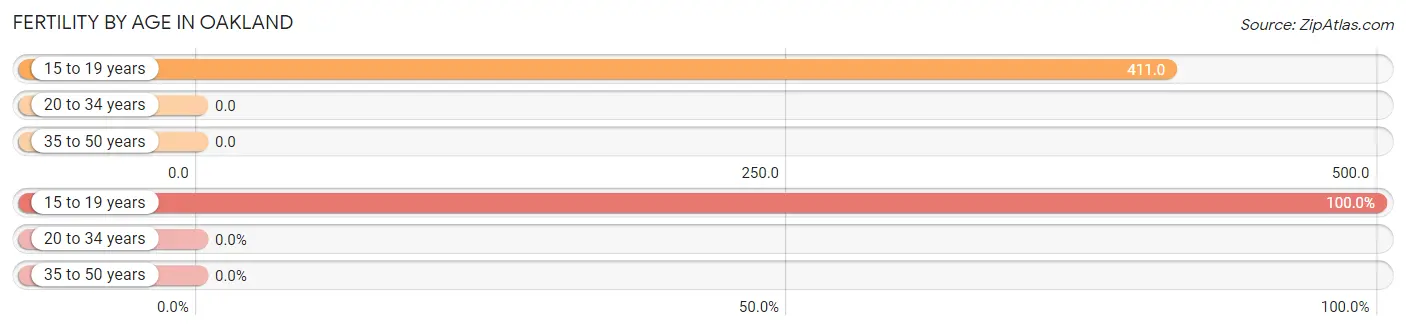
| Age Bracket | Women with Births | Births / 1,000 Women |
| 15 to 19 years | 23 (100.0%) | 411.0 |
| 20 to 34 years | 0 (0.0%) | 0.0 |
| 35 to 50 years | 0 (0.0%) | 0.0 |
| Total | 23 (100.0%) | 104.0 |
Fertility by Age by Marriage Status in Oakland
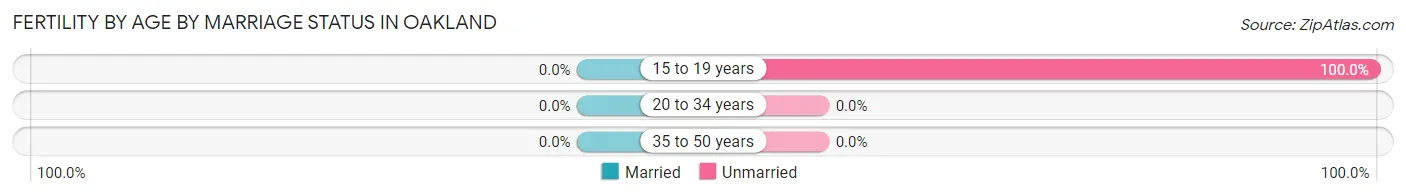
| Age Bracket | Married | Unmarried |
| 15 to 19 years | 0 (0.0%) | 23 (100.0%) |
| 20 to 34 years | 0 (0.0%) | 0 (0.0%) |
| 35 to 50 years | 0 (0.0%) | 0 (0.0%) |
| Total | 0 (0.0%) | 23 (100.0%) |
Fertility by Education in Oakland
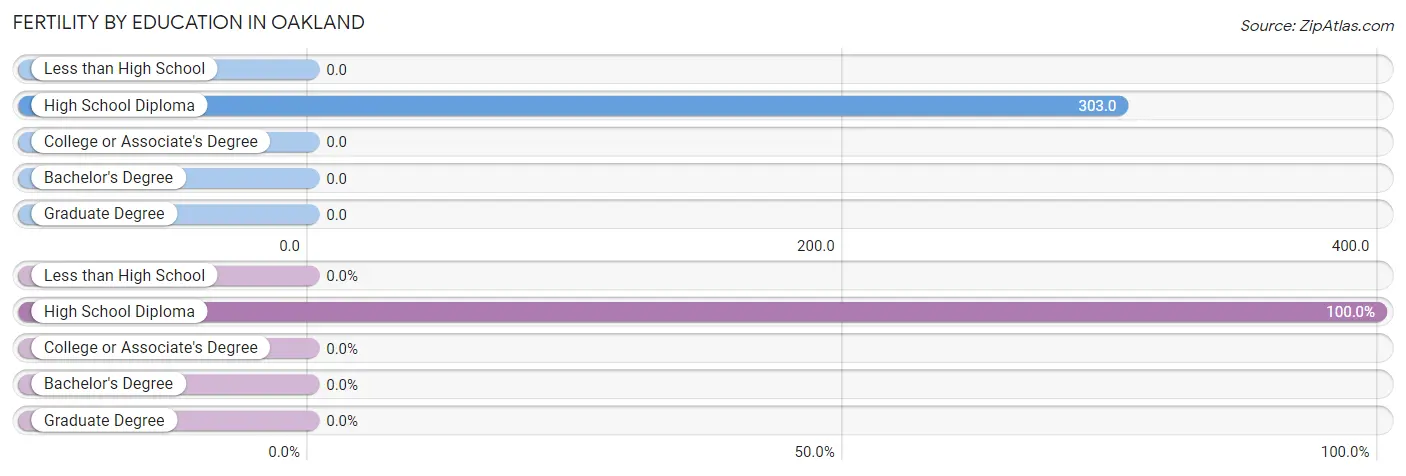
| Educational Attainment | Women with Births | Births / 1,000 Women |
| Less than High School | 0 (0.0%) | 0.0 |
| High School Diploma | 23 (100.0%) | 303.0 |
| College or Associate's Degree | 0 (0.0%) | 0.0 |
| Bachelor's Degree | 0 (0.0%) | 0.0 |
| Graduate Degree | 0 (0.0%) | 0.0 |
| Total | 23 (100.0%) | 104.0 |
Fertility by Education by Marriage Status in Oakland
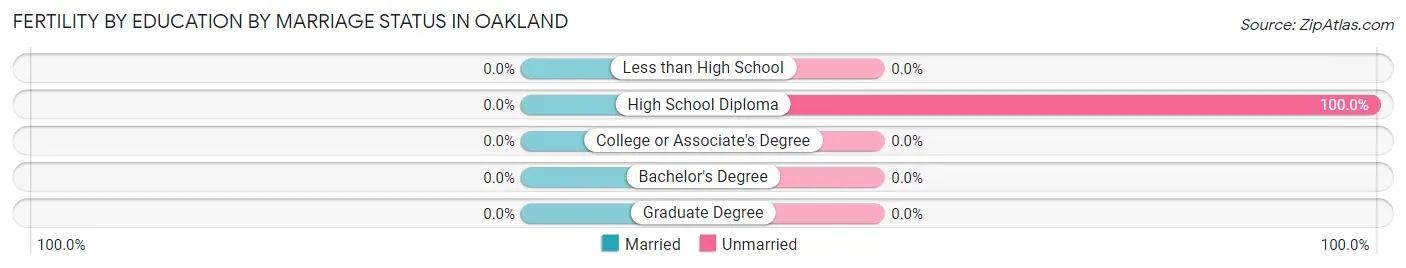
| Educational Attainment | Married | Unmarried |
| Less than High School | 0 (0.0%) | 0 (0.0%) |
| High School Diploma | 0 (0.0%) | 23 (100.0%) |
| College or Associate's Degree | 0 (0.0%) | 0 (0.0%) |
| Bachelor's Degree | 0 (0.0%) | 0 (0.0%) |
| Graduate Degree | 0 (0.0%) | 0 (0.0%) |
| Total | 0 (0.0%) | 23 (100.0%) |
Employment Characteristics in Oakland
Employment by Class of Employer in Oakland
Among the 310 employed individuals in Oakland, private company employees (138 | 44.5%), federal government employees (68 | 21.9%), and local government employees (40 | 12.9%) make up the most common classes of employment.
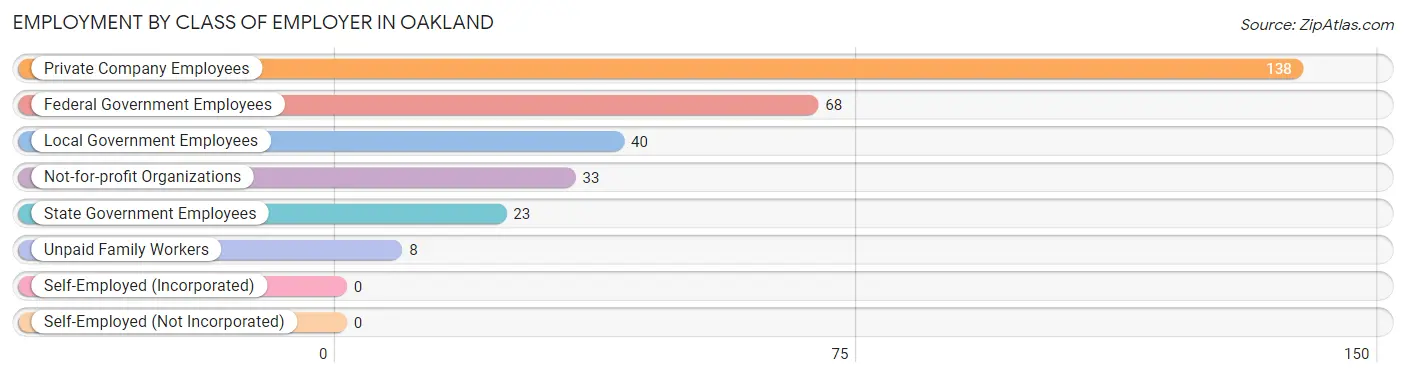
| Employer Class | # Employees | % Employees |
| Private Company Employees | 138 | 44.5% |
| Self-Employed (Incorporated) | 0 | 0.0% |
| Self-Employed (Not Incorporated) | 0 | 0.0% |
| Not-for-profit Organizations | 33 | 10.6% |
| Local Government Employees | 40 | 12.9% |
| State Government Employees | 23 | 7.4% |
| Federal Government Employees | 68 | 21.9% |
| Unpaid Family Workers | 8 | 2.6% |
| Total | 310 | 100.0% |
Employment Status by Age in Oakland
According to the labor force statistics for Oakland, out of the total population over 16 years of age (738), 45.7% or 337 individuals are in the labor force, with 8.4% or 28 of them unemployed. The age group with the highest labor force participation rate is 35 to 44 years, with 100.0% or 76 individuals in the labor force. Within the labor force, the 55 to 59 years age range has the highest percentage of unemployed individuals, with 64.3% or 27 of them being unemployed.
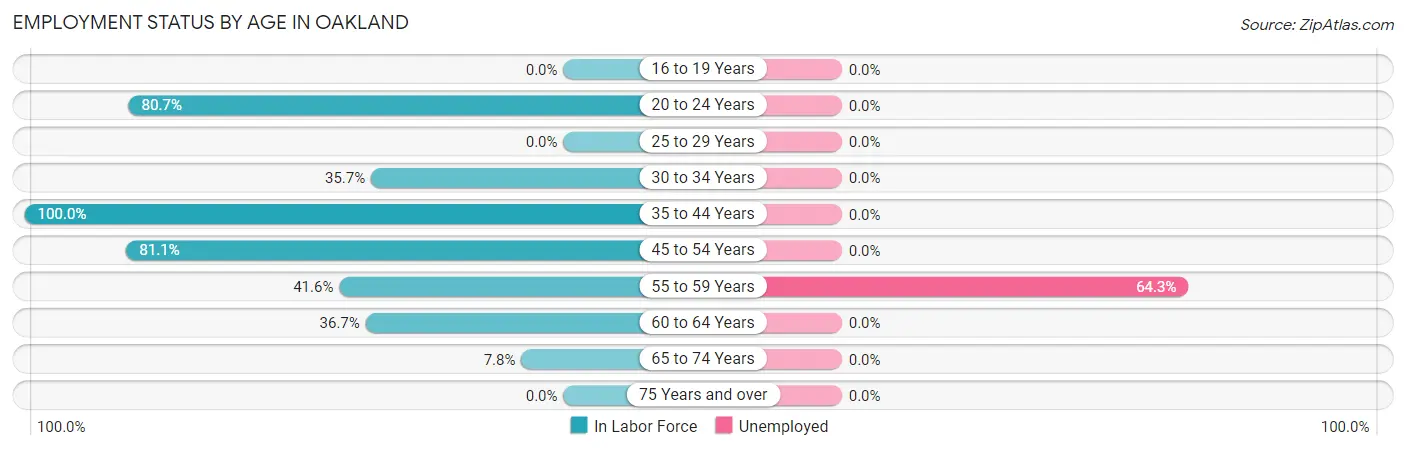
| Age Bracket | In Labor Force | Unemployed |
| 16 to 19 Years | 0 (0.0%) | 0 (0.0%) |
| 20 to 24 Years | 46 (80.7%) | 0 (0.0%) |
| 25 to 29 Years | 0 (0.0%) | 0 (0.0%) |
| 30 to 34 Years | 25 (35.7%) | 0 (0.0%) |
| 35 to 44 Years | 76 (100.0%) | 0 (0.0%) |
| 45 to 54 Years | 133 (81.1%) | 0 (0.0%) |
| 55 to 59 Years | 42 (41.6%) | 27 (64.3%) |
| 60 to 64 Years | 11 (36.7%) | 0 (0.0%) |
| 65 to 74 Years | 4 (7.8%) | 0 (0.0%) |
| 75 Years and over | 0 (0.0%) | 0 (0.0%) |
| Total | 337 (45.7%) | 28 (8.4%) |
Employment Status by Educational Attainment in Oakland
According to labor force statistics for Oakland, 65.1% of individuals (287) out of the total population between 25 and 64 years of age (441) are in the labor force, with 9.4% or 27 of them being unemployed. The group with the highest labor force participation rate are those with the educational attainment of bachelor's degree or higher, with 100.0% or 126 individuals in the labor force. Within the labor force, individuals with bachelor's degree or higher education have the highest percentage of unemployment, with 21.4% or 27 of them being unemployed.
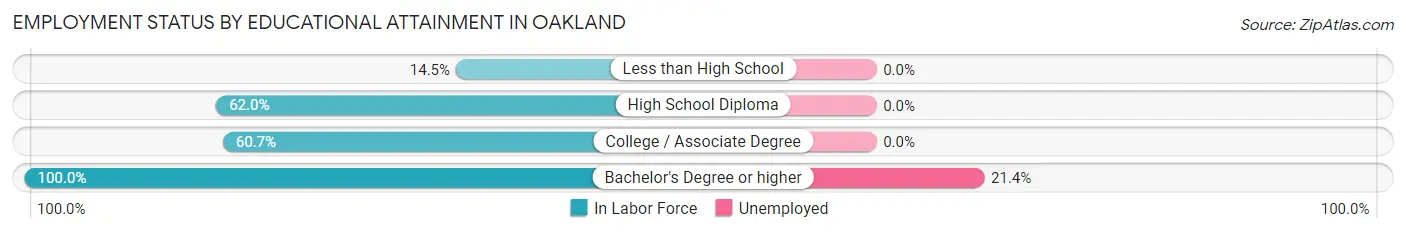
| Educational Attainment | In Labor Force | Unemployed |
| Less than High School | 10 (14.5%) | 0 (0.0%) |
| High School Diploma | 80 (62.0%) | 0 (0.0%) |
| College / Associate Degree | 71 (60.7%) | 0 (0.0%) |
| Bachelor's Degree or higher | 126 (100.0%) | 27 (21.4%) |
| Total | 287 (65.1%) | 41 (9.4%) |
Employment Occupations by Sex in Oakland
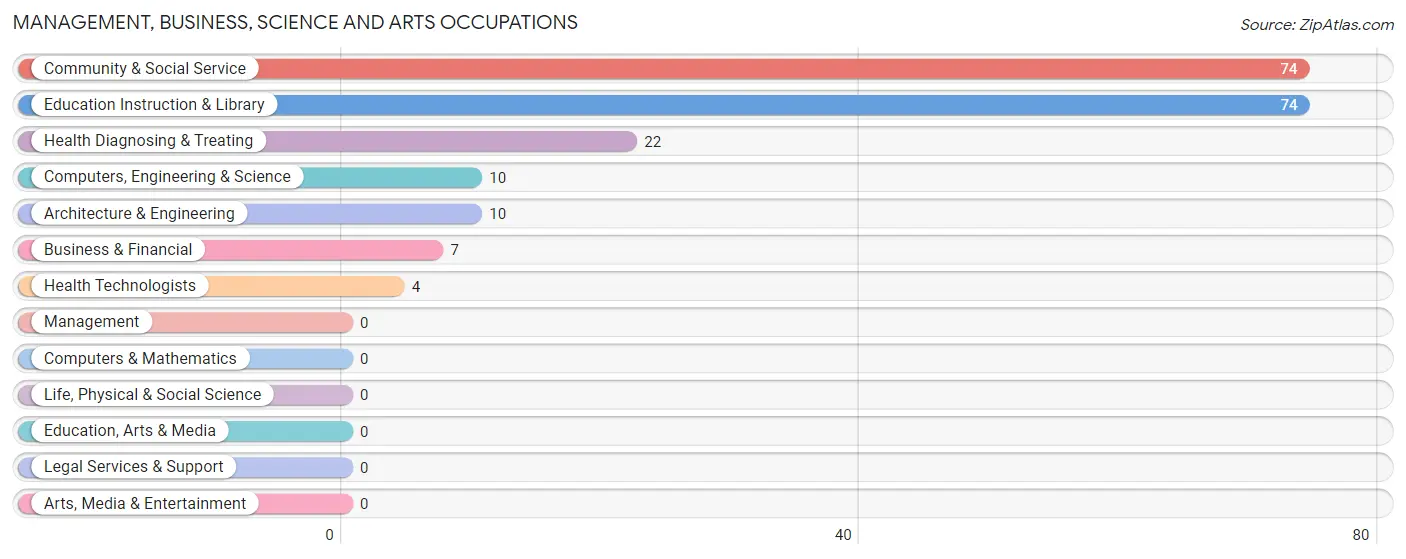
Management, Business, Science and Arts Occupations
The most common Management, Business, Science and Arts occupations in Oakland are Community & Social Service (74 | 25.0%), Education Instruction & Library (74 | 25.0%), Health Diagnosing & Treating (22 | 7.4%), Computers, Engineering & Science (10 | 3.4%), and Architecture & Engineering (10 | 3.4%).
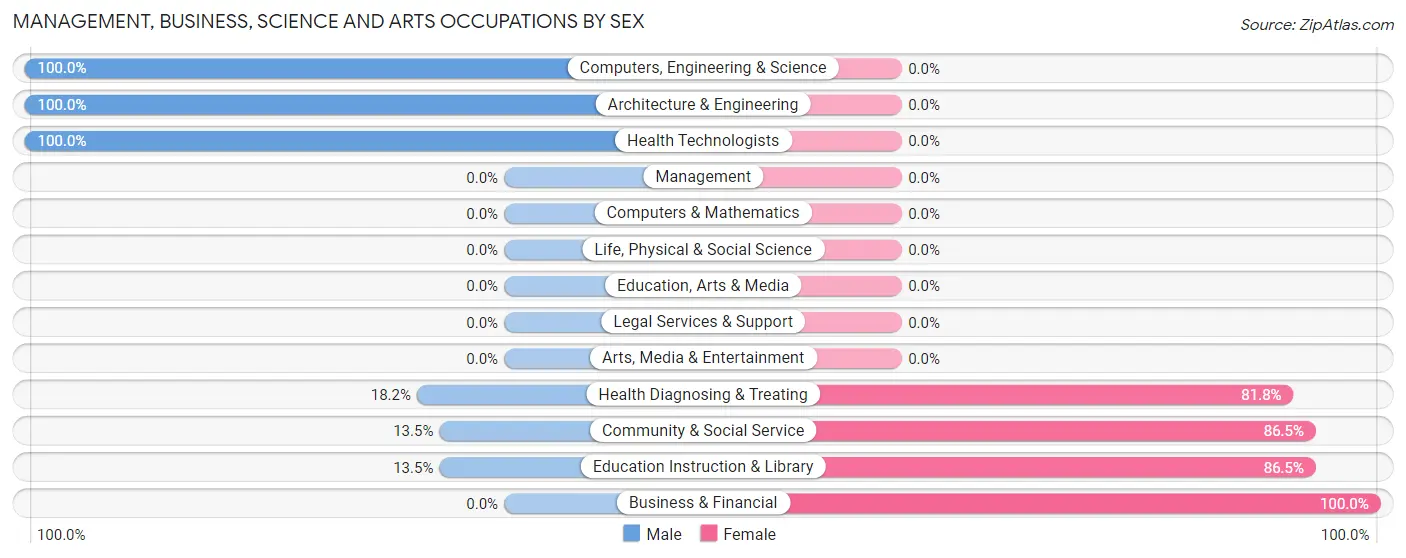
Management, Business, Science and Arts Occupations by Sex
Within the Management, Business, Science and Arts occupations in Oakland, the most male-oriented occupations are Computers, Engineering & Science (100.0%), Architecture & Engineering (100.0%), and Health Technologists (100.0%), while the most female-oriented occupations are Business & Financial (100.0%), Community & Social Service (86.5%), and Education Instruction & Library (86.5%).
| Occupation | Male | Female |
| Management | 0 (0.0%) | 0 (0.0%) |
| Business & Financial | 0 (0.0%) | 7 (100.0%) |
| Computers, Engineering & Science | 10 (100.0%) | 0 (0.0%) |
| Computers & Mathematics | 0 (0.0%) | 0 (0.0%) |
| Architecture & Engineering | 10 (100.0%) | 0 (0.0%) |
| Life, Physical & Social Science | 0 (0.0%) | 0 (0.0%) |
| Community & Social Service | 10 (13.5%) | 64 (86.5%) |
| Education, Arts & Media | 0 (0.0%) | 0 (0.0%) |
| Legal Services & Support | 0 (0.0%) | 0 (0.0%) |
| Education Instruction & Library | 10 (13.5%) | 64 (86.5%) |
| Arts, Media & Entertainment | 0 (0.0%) | 0 (0.0%) |
| Health Diagnosing & Treating | 4 (18.2%) | 18 (81.8%) |
| Health Technologists | 4 (100.0%) | 0 (0.0%) |
| Total (Category) | 24 (21.2%) | 89 (78.8%) |
| Total (Overall) | 155 (52.4%) | 141 (47.6%) |
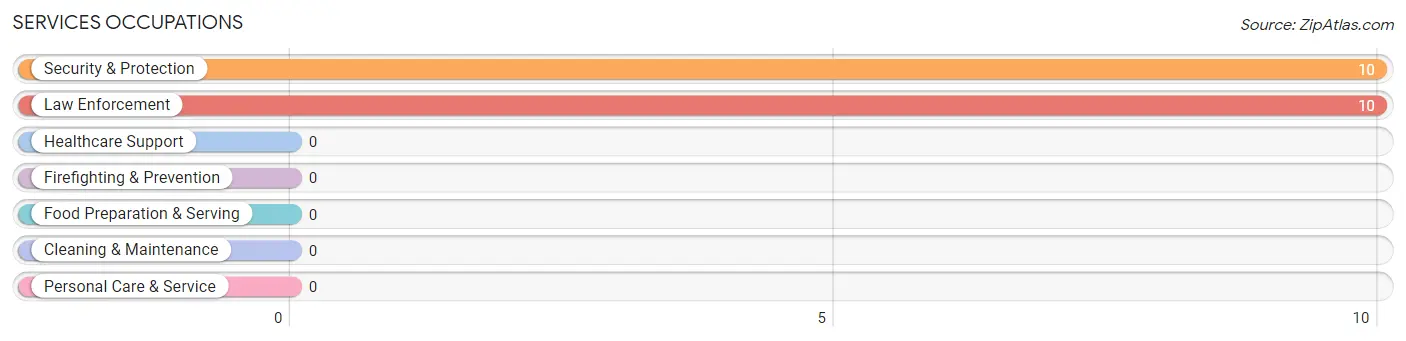
Services Occupations
The most common Services occupations in Oakland are Security & Protection (10 | 3.4%), and Law Enforcement (10 | 3.4%).
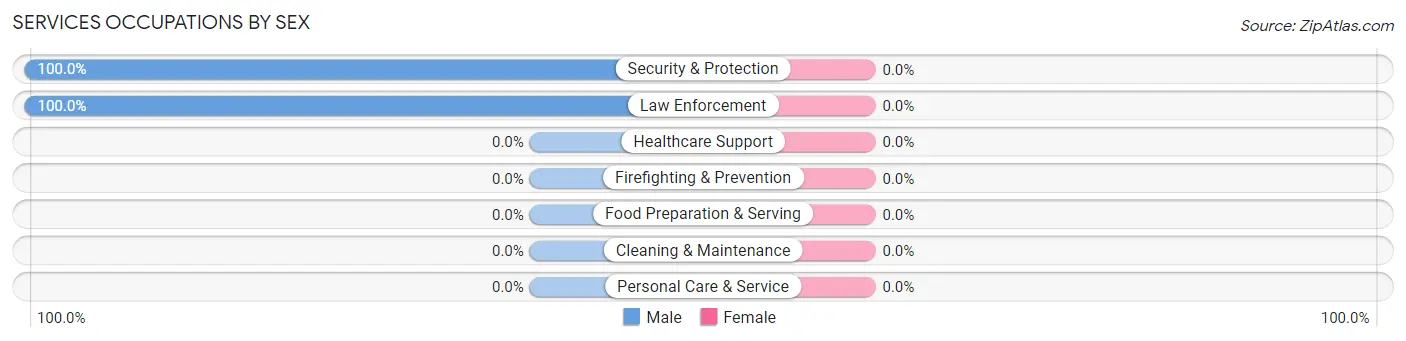
Services Occupations by Sex
| Occupation | Male | Female |
| Healthcare Support | 0 (0.0%) | 0 (0.0%) |
| Security & Protection | 10 (100.0%) | 0 (0.0%) |
| Firefighting & Prevention | 0 (0.0%) | 0 (0.0%) |
| Law Enforcement | 10 (100.0%) | 0 (0.0%) |
| Food Preparation & Serving | 0 (0.0%) | 0 (0.0%) |
| Cleaning & Maintenance | 0 (0.0%) | 0 (0.0%) |
| Personal Care & Service | 0 (0.0%) | 0 (0.0%) |
| Total (Category) | 10 (100.0%) | 0 (0.0%) |
| Total (Overall) | 155 (52.4%) | 141 (47.6%) |
Sales and Office Occupations
The most common Sales and Office occupations in Oakland are Office & Administration (44 | 14.9%), and Sales & Related (20 | 6.8%).
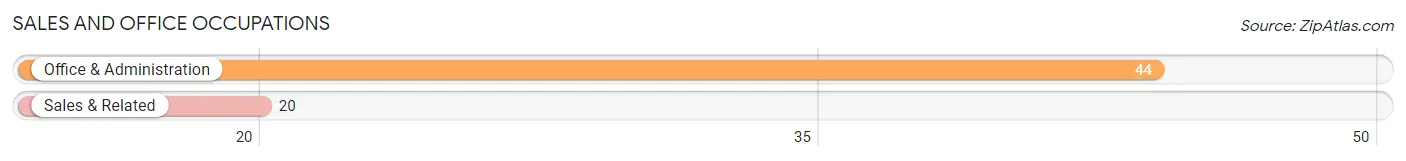
Sales and Office Occupations by Sex
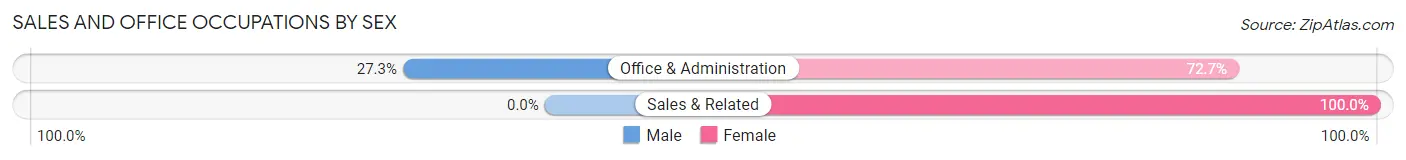
| Occupation | Male | Female |
| Sales & Related | 0 (0.0%) | 20 (100.0%) |
| Office & Administration | 12 (27.3%) | 32 (72.7%) |
| Total (Category) | 12 (18.8%) | 52 (81.2%) |
| Total (Overall) | 155 (52.4%) | 141 (47.6%) |
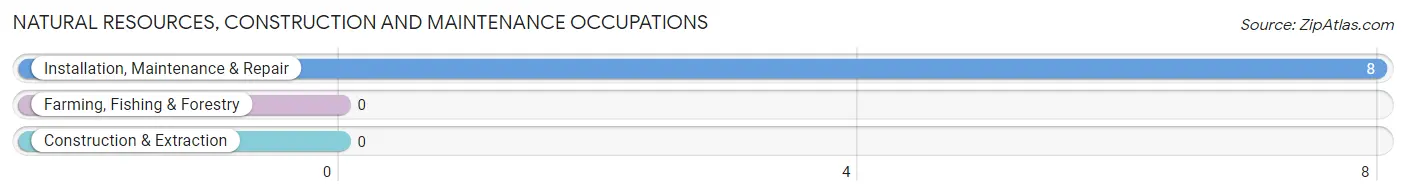
Natural Resources, Construction and Maintenance Occupations
The most common Natural Resources, Construction and Maintenance occupations in Oakland are , and Installation, Maintenance & Repair (8 | 2.7%).
Natural Resources, Construction and Maintenance Occupations by Sex
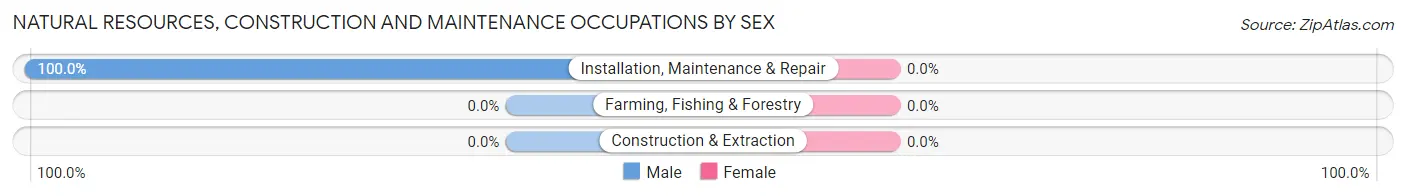
| Occupation | Male | Female |
| Farming, Fishing & Forestry | 0 (0.0%) | 0 (0.0%) |
| Construction & Extraction | 0 (0.0%) | 0 (0.0%) |
| Installation, Maintenance & Repair | 8 (100.0%) | 0 (0.0%) |
| Total (Category) | 8 (100.0%) | 0 (0.0%) |
| Total (Overall) | 155 (52.4%) | 141 (47.6%) |
Production, Transportation and Moving Occupations
The most common Production, Transportation and Moving occupations in Oakland are Transportation (46 | 15.5%), Material Moving (31 | 10.5%), and Production (24 | 8.1%).
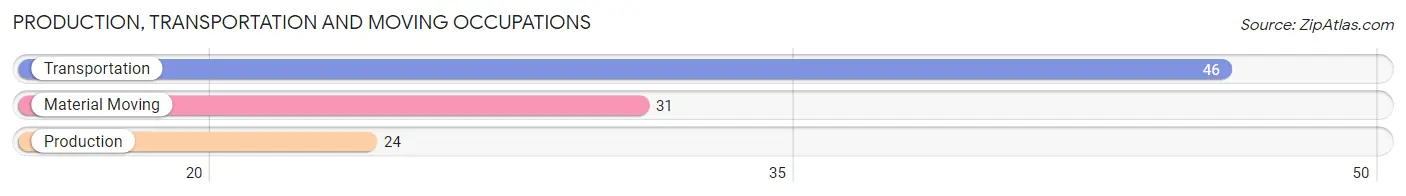
Production, Transportation and Moving Occupations by Sex
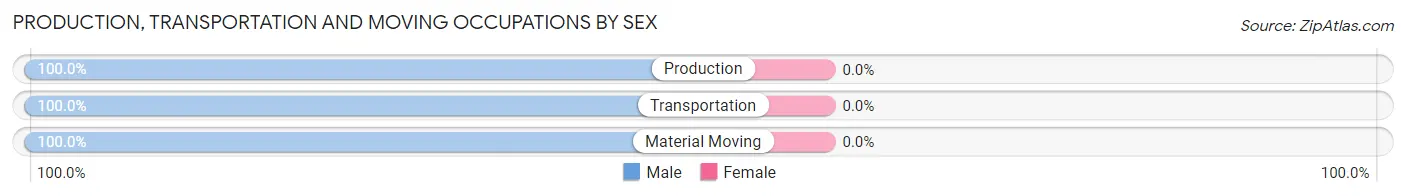
| Occupation | Male | Female |
| Production | 24 (100.0%) | 0 (0.0%) |
| Transportation | 46 (100.0%) | 0 (0.0%) |
| Material Moving | 31 (100.0%) | 0 (0.0%) |
| Total (Category) | 101 (100.0%) | 0 (0.0%) |
| Total (Overall) | 155 (52.4%) | 141 (47.6%) |
Employment Industries by Sex in Oakland
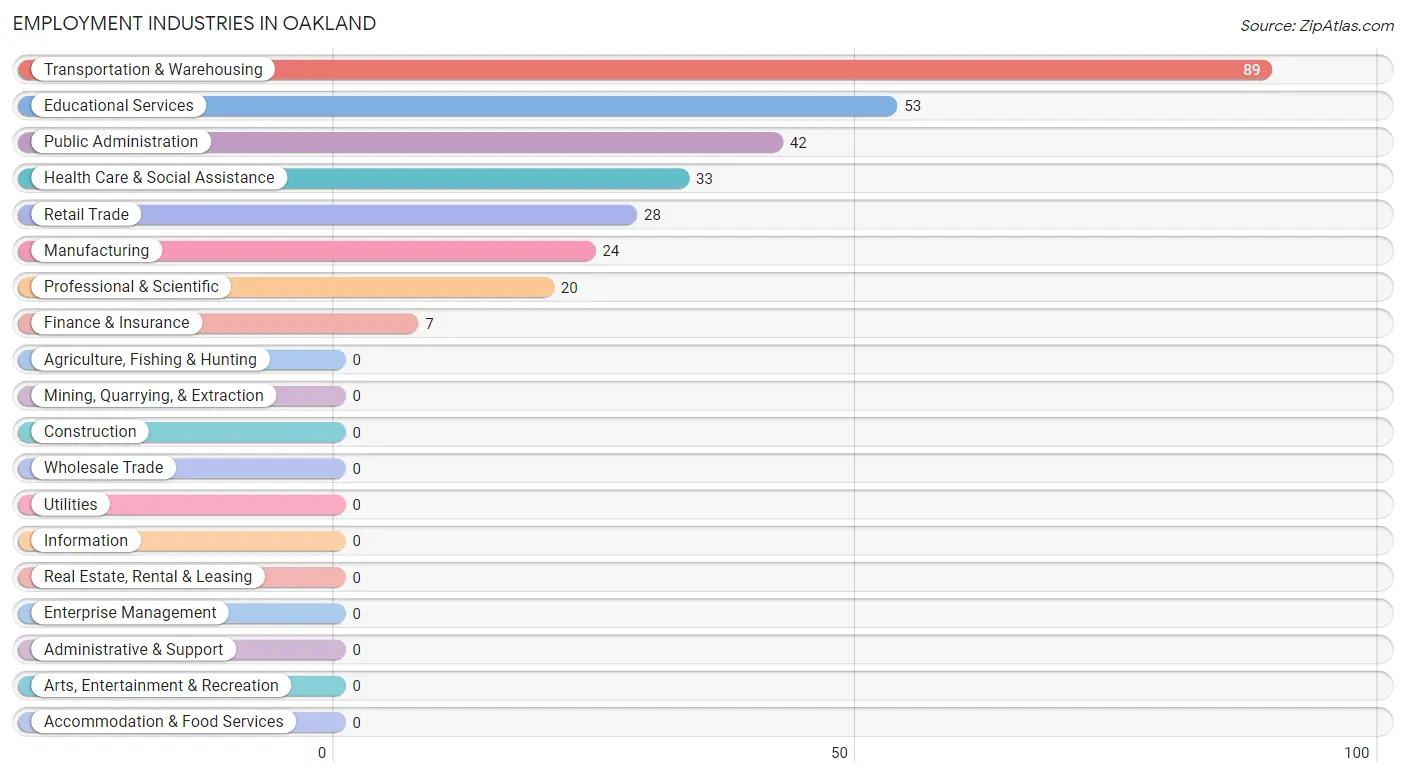
Employment Industries in Oakland
The major employment industries in Oakland include Transportation & Warehousing (89 | 30.1%), Educational Services (53 | 17.9%), Public Administration (42 | 14.2%), Health Care & Social Assistance (33 | 11.2%), and Retail Trade (28 | 9.5%).
Employment Industries by Sex in Oakland
The Oakland industries that see more men than women are Manufacturing (100.0%), Transportation & Warehousing (100.0%), and Professional & Scientific (100.0%), whereas the industries that tend to have a higher number of women are Finance & Insurance (100.0%), Educational Services (100.0%), and Health Care & Social Assistance (87.9%).
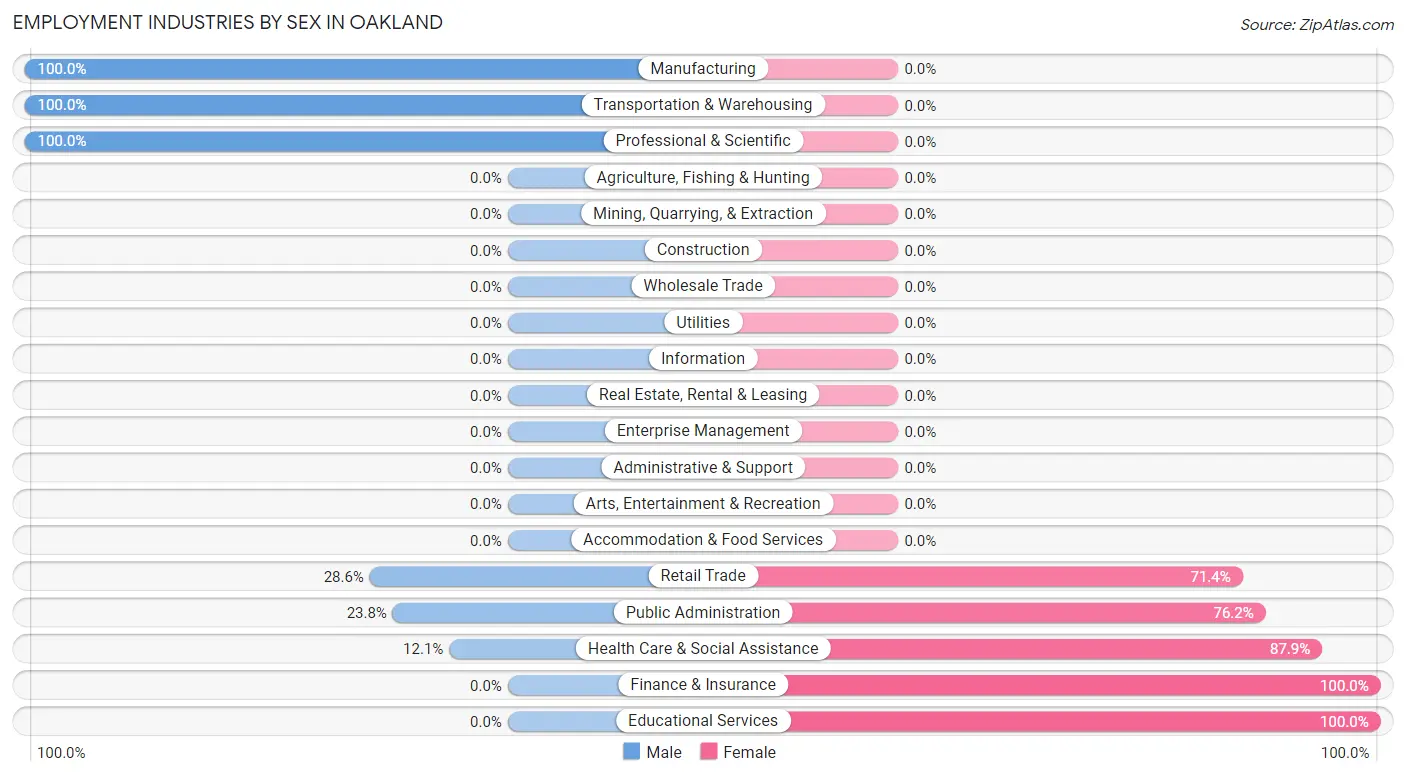
| Industry | Male | Female |
| Agriculture, Fishing & Hunting | 0 (0.0%) | 0 (0.0%) |
| Mining, Quarrying, & Extraction | 0 (0.0%) | 0 (0.0%) |
| Construction | 0 (0.0%) | 0 (0.0%) |
| Manufacturing | 24 (100.0%) | 0 (0.0%) |
| Wholesale Trade | 0 (0.0%) | 0 (0.0%) |
| Retail Trade | 8 (28.6%) | 20 (71.4%) |
| Transportation & Warehousing | 89 (100.0%) | 0 (0.0%) |
| Utilities | 0 (0.0%) | 0 (0.0%) |
| Information | 0 (0.0%) | 0 (0.0%) |
| Finance & Insurance | 0 (0.0%) | 7 (100.0%) |
| Real Estate, Rental & Leasing | 0 (0.0%) | 0 (0.0%) |
| Professional & Scientific | 20 (100.0%) | 0 (0.0%) |
| Enterprise Management | 0 (0.0%) | 0 (0.0%) |
| Administrative & Support | 0 (0.0%) | 0 (0.0%) |
| Educational Services | 0 (0.0%) | 53 (100.0%) |
| Health Care & Social Assistance | 4 (12.1%) | 29 (87.9%) |
| Arts, Entertainment & Recreation | 0 (0.0%) | 0 (0.0%) |
| Accommodation & Food Services | 0 (0.0%) | 0 (0.0%) |
| Public Administration | 10 (23.8%) | 32 (76.2%) |
| Total | 155 (52.4%) | 141 (47.6%) |
Education in Oakland
School Enrollment in Oakland
The most common levels of schooling among the 203 students in Oakland are elementary school (76 | 37.4%), high school (48 | 23.6%), and middle school (45 | 22.2%).
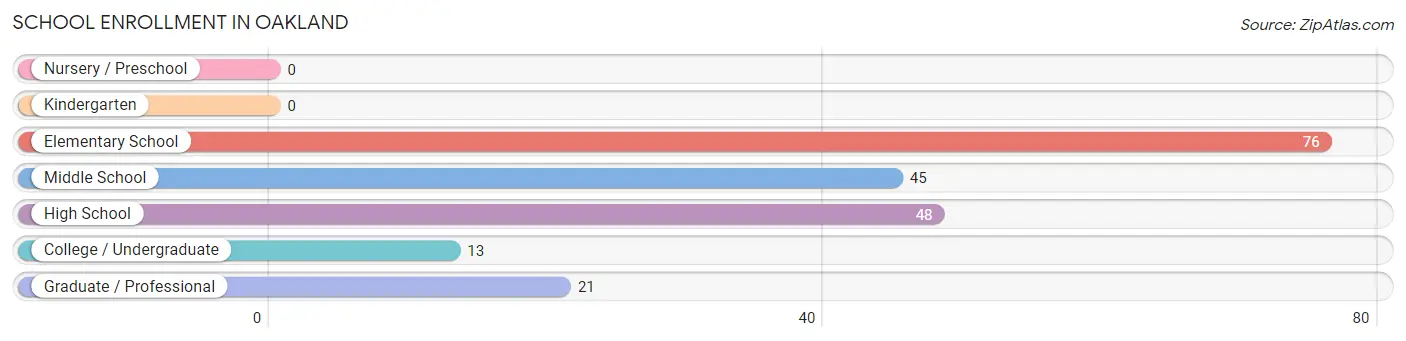
| School Level | # Students | % Students |
| Nursery / Preschool | 0 | 0.0% |
| Kindergarten | 0 | 0.0% |
| Elementary School | 76 | 37.4% |
| Middle School | 45 | 22.2% |
| High School | 48 | 23.6% |
| College / Undergraduate | 13 | 6.4% |
| Graduate / Professional | 21 | 10.3% |
| Total | 203 | 100.0% |
School Enrollment by Age by Funding Source in Oakland
Out of a total of 203 students who are enrolled in schools in Oakland, 52 (25.6%) attend a private institution, while the remaining 151 (74.4%) are enrolled in public schools. The age group of 25 to 34 year olds has the highest likelihood of being enrolled in private schools, with 13 (100.0% in the age bracket) enrolled. Conversely, the age group of 5 to 9 year old has the lowest likelihood of being enrolled in a private school, with 63 (100.0% in the age bracket) attending a public institution.
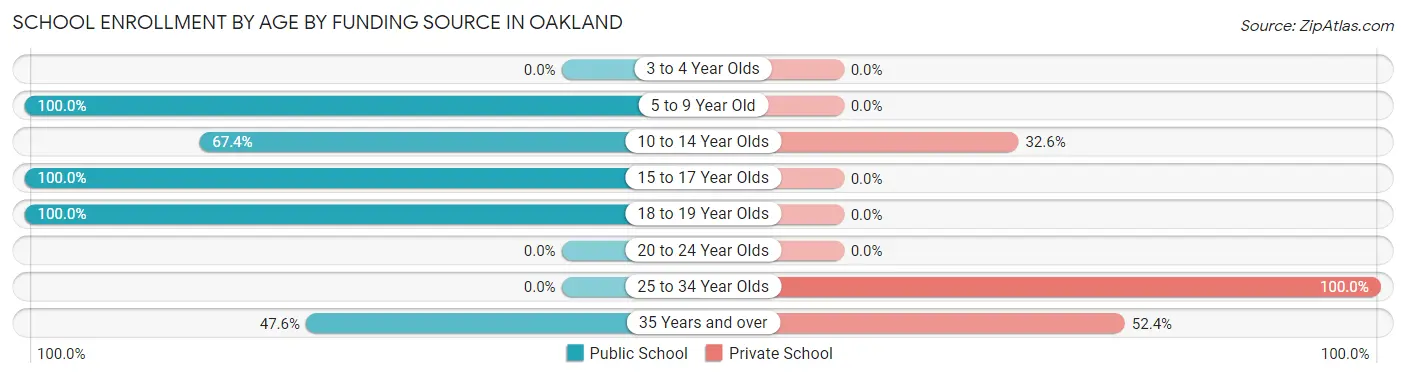
| Age Bracket | Public School | Private School |
| 3 to 4 Year Olds | 0 (0.0%) | 0 (0.0%) |
| 5 to 9 Year Old | 63 (100.0%) | 0 (0.0%) |
| 10 to 14 Year Olds | 58 (67.4%) | 28 (32.6%) |
| 15 to 17 Year Olds | 10 (100.0%) | 0 (0.0%) |
| 18 to 19 Year Olds | 10 (100.0%) | 0 (0.0%) |
| 20 to 24 Year Olds | 0 (0.0%) | 0 (0.0%) |
| 25 to 34 Year Olds | 0 (0.0%) | 13 (100.0%) |
| 35 Years and over | 10 (47.6%) | 11 (52.4%) |
| Total | 151 (74.4%) | 52 (25.6%) |
Educational Attainment by Field of Study in Oakland
Business (60 | 26.4%), engineering (39 | 17.2%), education (33 | 14.5%), bio, nature & agricultural (23 | 10.1%), and visual & performing arts (23 | 10.1%) are the most common fields of study among 227 individuals in Oakland who have obtained a bachelor's degree or higher.
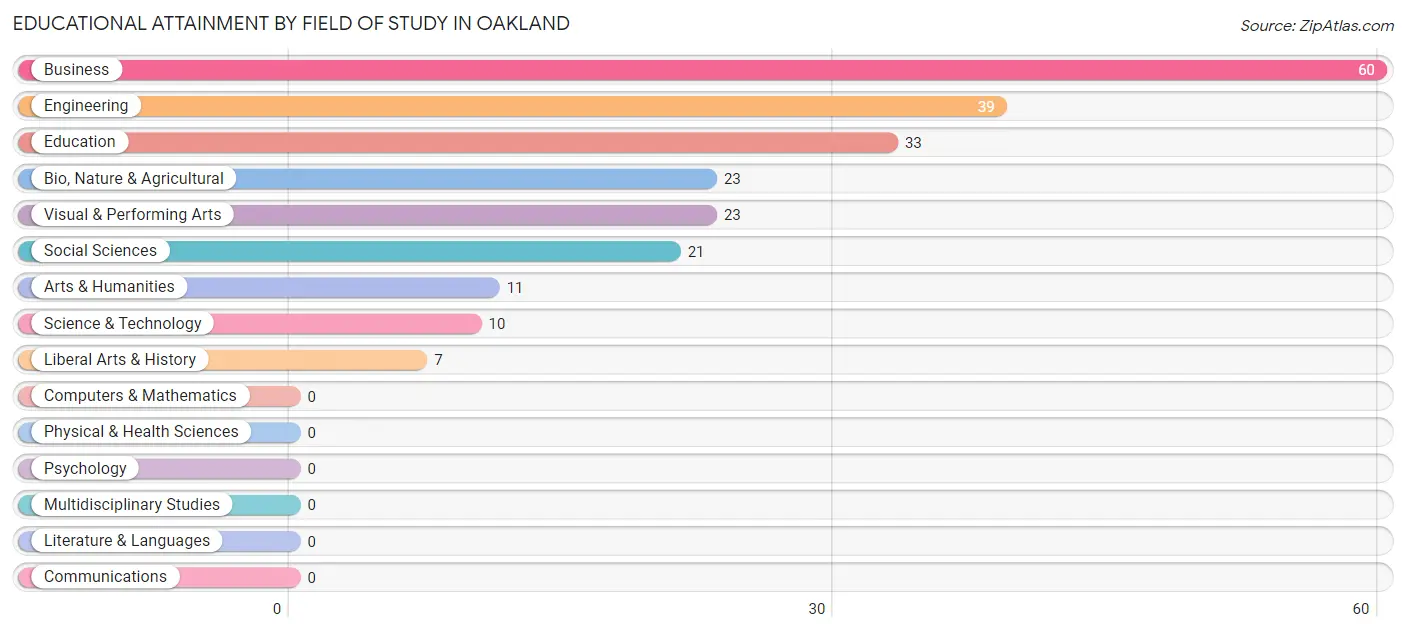
| Field of Study | # Graduates | % Graduates |
| Computers & Mathematics | 0 | 0.0% |
| Bio, Nature & Agricultural | 23 | 10.1% |
| Physical & Health Sciences | 0 | 0.0% |
| Psychology | 0 | 0.0% |
| Social Sciences | 21 | 9.2% |
| Engineering | 39 | 17.2% |
| Multidisciplinary Studies | 0 | 0.0% |
| Science & Technology | 10 | 4.4% |
| Business | 60 | 26.4% |
| Education | 33 | 14.5% |
| Literature & Languages | 0 | 0.0% |
| Liberal Arts & History | 7 | 3.1% |
| Visual & Performing Arts | 23 | 10.1% |
| Communications | 0 | 0.0% |
| Arts & Humanities | 11 | 4.9% |
| Total | 227 | 100.0% |
Transportation & Commute in Oakland
Vehicle Availability by Sex in Oakland
The most prevalent vehicle ownership categories in Oakland are males with 2 vehicles (104, accounting for 61.5%) and females with 2 vehicles (30, making up 73.8%).
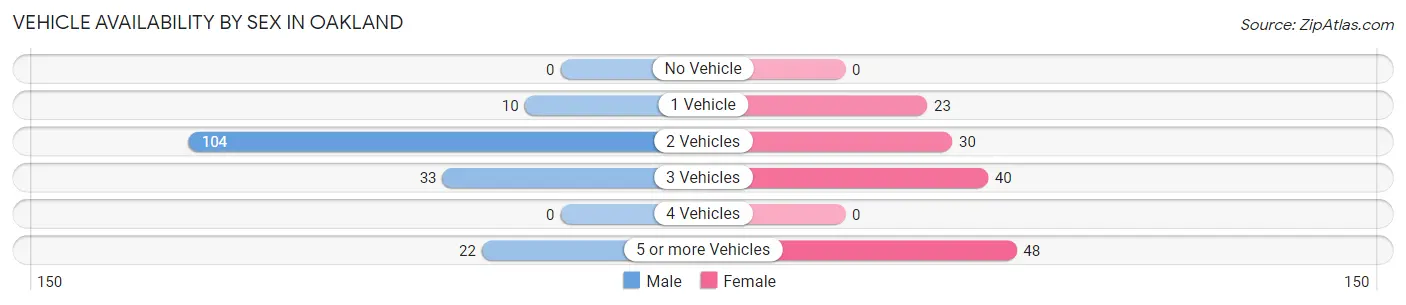
| Vehicles Available | Male | Female |
| No Vehicle | 0 (0.0%) | 0 (0.0%) |
| 1 Vehicle | 10 (5.9%) | 23 (16.3%) |
| 2 Vehicles | 104 (61.5%) | 30 (21.3%) |
| 3 Vehicles | 33 (19.5%) | 40 (28.4%) |
| 4 Vehicles | 0 (0.0%) | 0 (0.0%) |
| 5 or more Vehicles | 22 (13.0%) | 48 (34.0%) |
| Total | 169 (100.0%) | 141 (100.0%) |
Commute Time in Oakland
The most frequently occuring commute durations in Oakland are 20 to 24 minutes (163 commuters, 52.6%), 15 to 19 minutes (62 commuters, 20.0%), and 30 to 34 minutes (26 commuters, 8.4%).
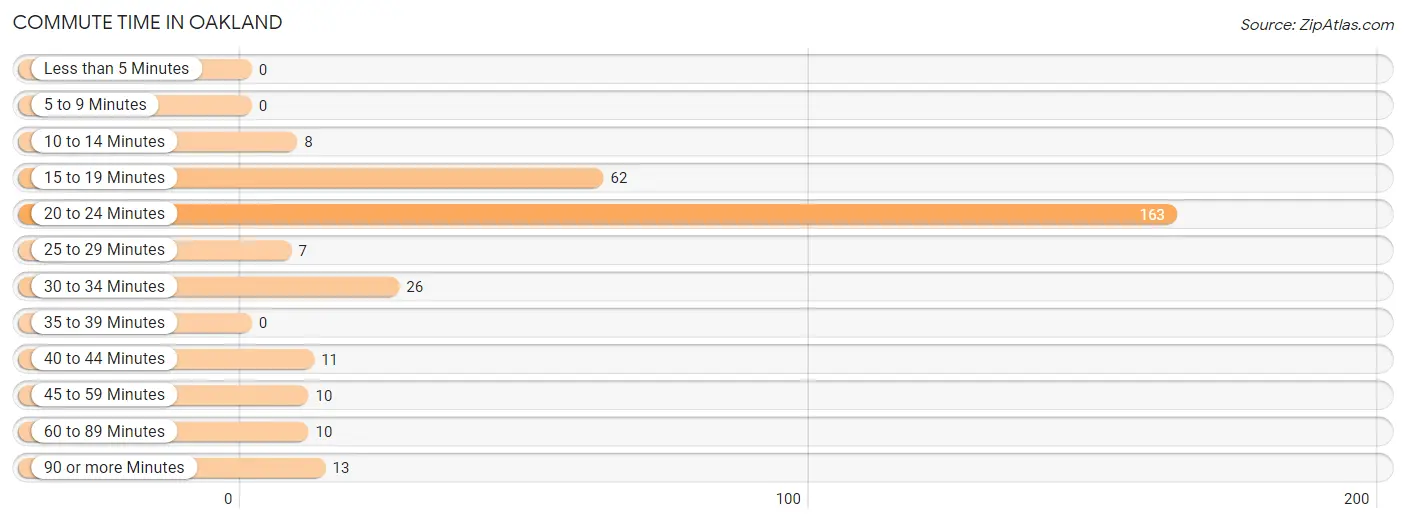
| Commute Time | # Commuters | % Commuters |
| Less than 5 Minutes | 0 | 0.0% |
| 5 to 9 Minutes | 0 | 0.0% |
| 10 to 14 Minutes | 8 | 2.6% |
| 15 to 19 Minutes | 62 | 20.0% |
| 20 to 24 Minutes | 163 | 52.6% |
| 25 to 29 Minutes | 7 | 2.3% |
| 30 to 34 Minutes | 26 | 8.4% |
| 35 to 39 Minutes | 0 | 0.0% |
| 40 to 44 Minutes | 11 | 3.5% |
| 45 to 59 Minutes | 10 | 3.2% |
| 60 to 89 Minutes | 10 | 3.2% |
| 90 or more Minutes | 13 | 4.2% |
Commute Time by Sex in Oakland
The most common commute times in Oakland are 20 to 24 minutes (92 commuters, 54.4%) for males and 20 to 24 minutes (71 commuters, 50.3%) for females.
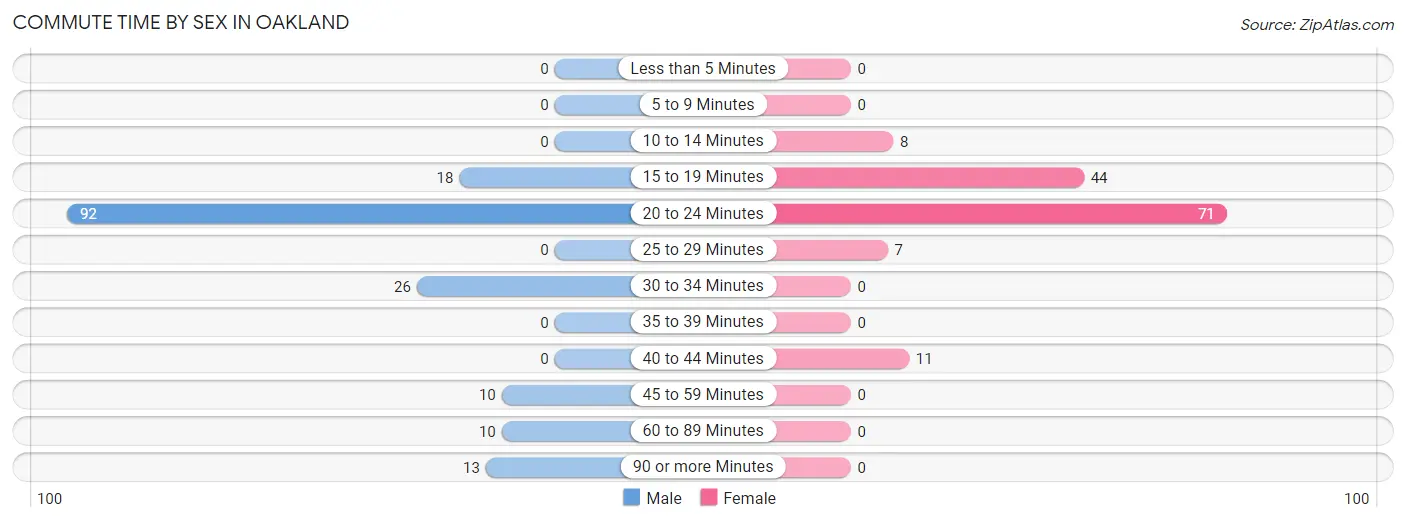
| Commute Time | Male | Female |
| Less than 5 Minutes | 0 (0.0%) | 0 (0.0%) |
| 5 to 9 Minutes | 0 (0.0%) | 0 (0.0%) |
| 10 to 14 Minutes | 0 (0.0%) | 8 (5.7%) |
| 15 to 19 Minutes | 18 (10.6%) | 44 (31.2%) |
| 20 to 24 Minutes | 92 (54.4%) | 71 (50.3%) |
| 25 to 29 Minutes | 0 (0.0%) | 7 (5.0%) |
| 30 to 34 Minutes | 26 (15.4%) | 0 (0.0%) |
| 35 to 39 Minutes | 0 (0.0%) | 0 (0.0%) |
| 40 to 44 Minutes | 0 (0.0%) | 11 (7.8%) |
| 45 to 59 Minutes | 10 (5.9%) | 0 (0.0%) |
| 60 to 89 Minutes | 10 (5.9%) | 0 (0.0%) |
| 90 or more Minutes | 13 (7.7%) | 0 (0.0%) |
Time of Departure to Work by Sex in Oakland
The most frequent times of departure to work in Oakland are 6:30 AM to 6:59 AM (59, 34.9%) for males and 8:30 AM to 8:59 AM (41, 29.1%) for females.
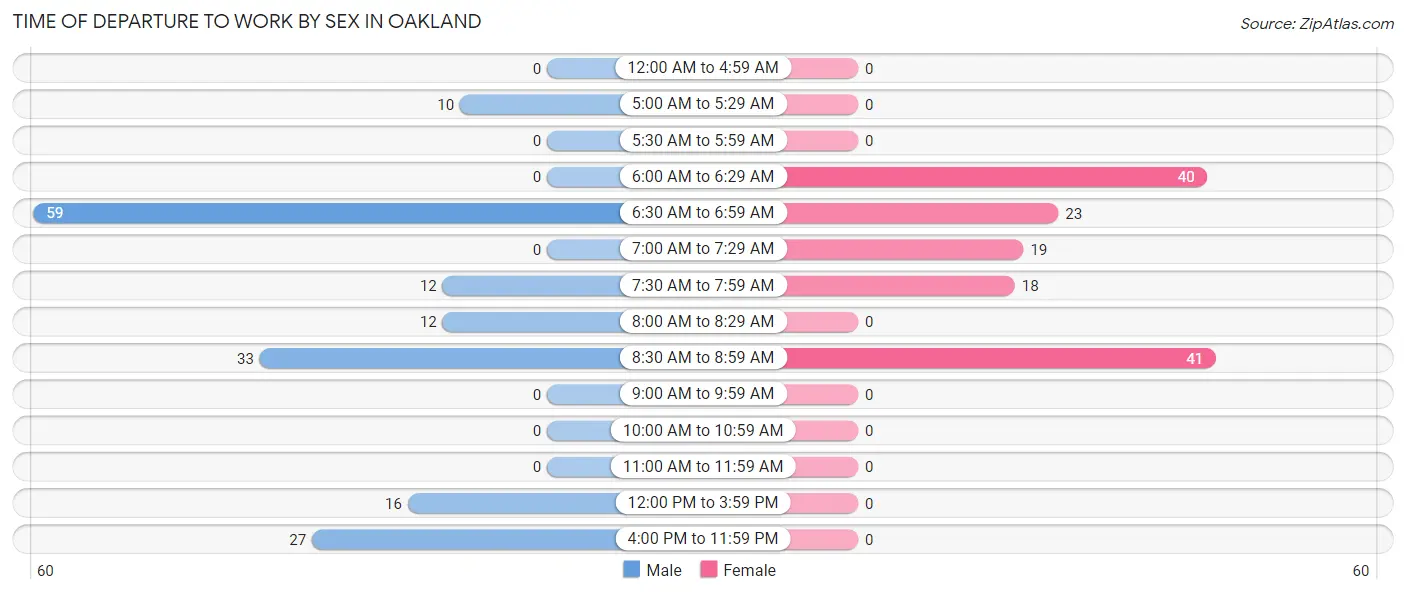
| Time of Departure | Male | Female |
| 12:00 AM to 4:59 AM | 0 (0.0%) | 0 (0.0%) |
| 5:00 AM to 5:29 AM | 10 (5.9%) | 0 (0.0%) |
| 5:30 AM to 5:59 AM | 0 (0.0%) | 0 (0.0%) |
| 6:00 AM to 6:29 AM | 0 (0.0%) | 40 (28.4%) |
| 6:30 AM to 6:59 AM | 59 (34.9%) | 23 (16.3%) |
| 7:00 AM to 7:29 AM | 0 (0.0%) | 19 (13.5%) |
| 7:30 AM to 7:59 AM | 12 (7.1%) | 18 (12.8%) |
| 8:00 AM to 8:29 AM | 12 (7.1%) | 0 (0.0%) |
| 8:30 AM to 8:59 AM | 33 (19.5%) | 41 (29.1%) |
| 9:00 AM to 9:59 AM | 0 (0.0%) | 0 (0.0%) |
| 10:00 AM to 10:59 AM | 0 (0.0%) | 0 (0.0%) |
| 11:00 AM to 11:59 AM | 0 (0.0%) | 0 (0.0%) |
| 12:00 PM to 3:59 PM | 16 (9.5%) | 0 (0.0%) |
| 4:00 PM to 11:59 PM | 27 (16.0%) | 0 (0.0%) |
| Total | 169 (100.0%) | 141 (100.0%) |
Housing Occupancy in Oakland
Occupancy by Ownership in Oakland
Of the total 473 dwellings in Oakland, owner-occupied units account for 273 (57.7%), while renter-occupied units make up 200 (42.3%).
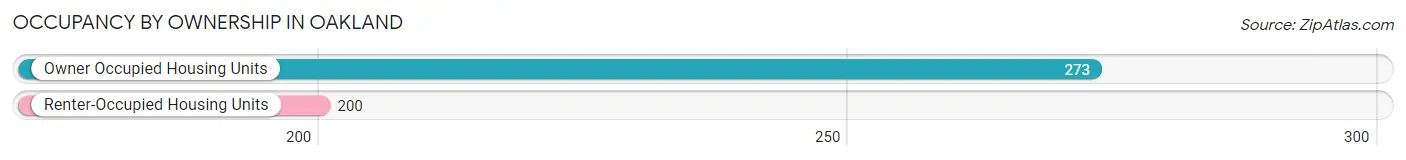
| Occupancy | # Housing Units | % Housing Units |
| Owner Occupied Housing Units | 273 | 57.7% |
| Renter-Occupied Housing Units | 200 | 42.3% |
| Total Occupied Housing Units | 473 | 100.0% |
Occupancy by Household Size in Oakland
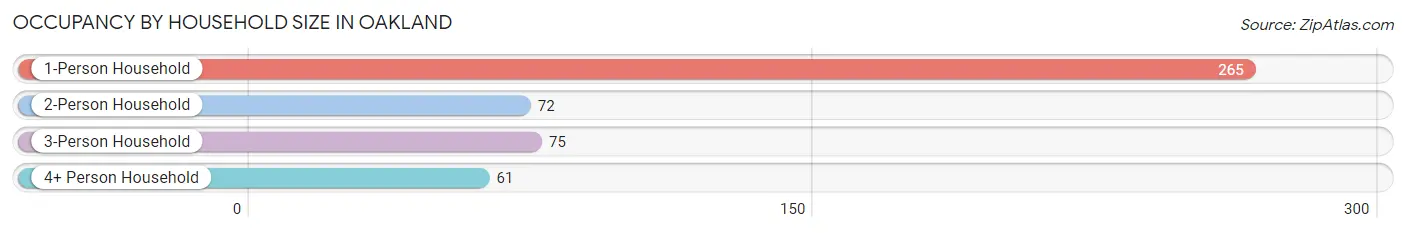
| Household Size | # Housing Units | % Housing Units |
| 1-Person Household | 265 | 56.0% |
| 2-Person Household | 72 | 15.2% |
| 3-Person Household | 75 | 15.9% |
| 4+ Person Household | 61 | 12.9% |
| Total Housing Units | 473 | 100.0% |
Occupancy by Ownership by Household Size in Oakland
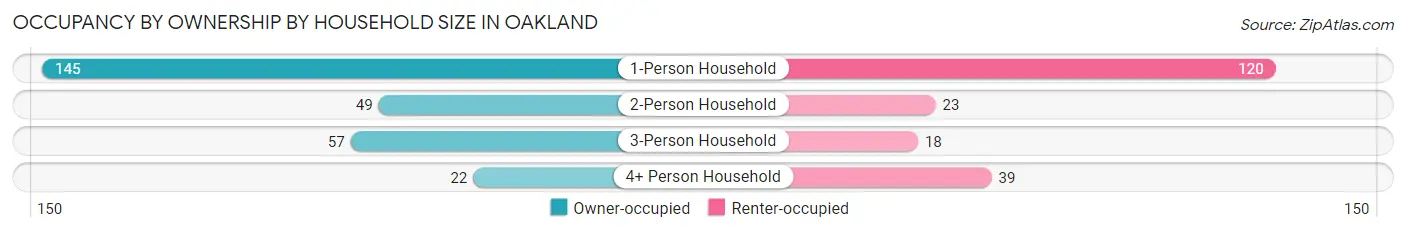
| Household Size | Owner-occupied | Renter-occupied |
| 1-Person Household | 145 (54.7%) | 120 (45.3%) |
| 2-Person Household | 49 (68.1%) | 23 (31.9%) |
| 3-Person Household | 57 (76.0%) | 18 (24.0%) |
| 4+ Person Household | 22 (36.1%) | 39 (63.9%) |
| Total Housing Units | 273 (57.7%) | 200 (42.3%) |
Occupancy by Educational Attainment in Oakland
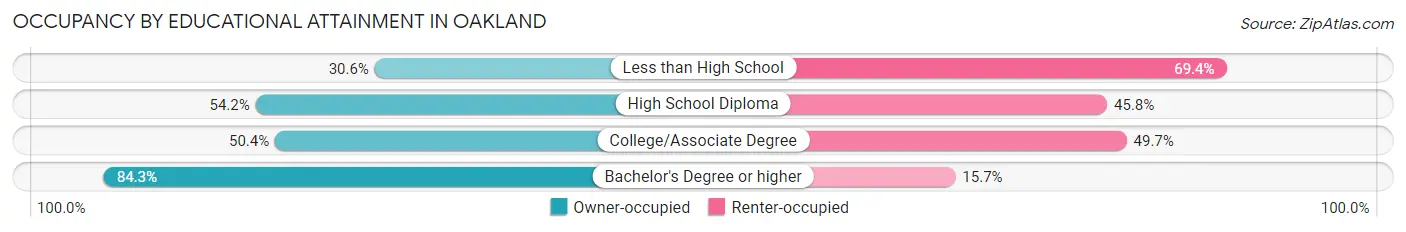
| Household Size | Owner-occupied | Renter-occupied |
| Less than High School | 26 (30.6%) | 59 (69.4%) |
| High School Diploma | 58 (54.2%) | 49 (45.8%) |
| College/Associate Degree | 71 (50.3%) | 70 (49.6%) |
| Bachelor's Degree or higher | 118 (84.3%) | 22 (15.7%) |
Occupancy by Age of Householder in Oakland
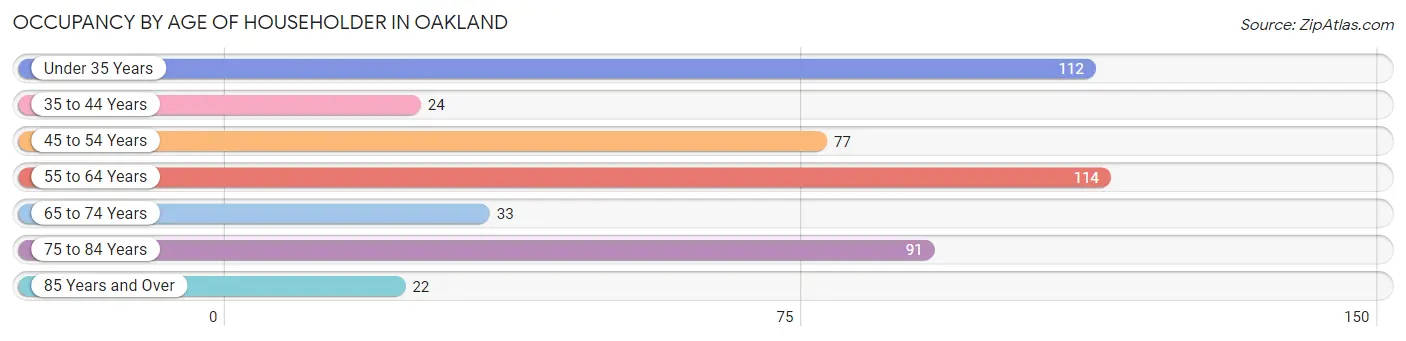
| Age Bracket | # Households | % Households |
| Under 35 Years | 112 | 23.7% |
| 35 to 44 Years | 24 | 5.1% |
| 45 to 54 Years | 77 | 16.3% |
| 55 to 64 Years | 114 | 24.1% |
| 65 to 74 Years | 33 | 7.0% |
| 75 to 84 Years | 91 | 19.2% |
| 85 Years and Over | 22 | 4.6% |
| Total | 473 | 100.0% |
Housing Finances in Oakland
Median Income by Occupancy in Oakland
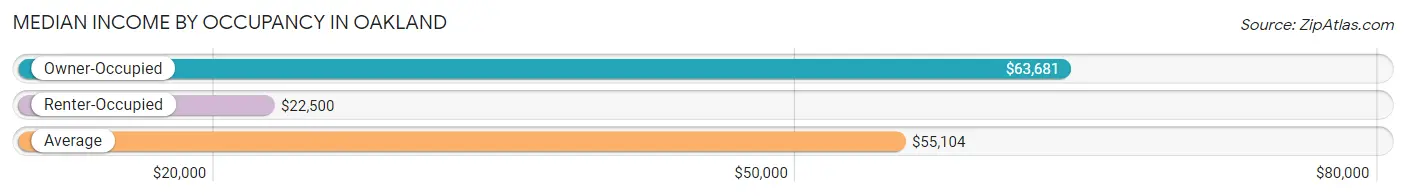
| Occupancy Type | # Households | Median Income |
| Owner-Occupied | 273 (57.7%) | $63,681 |
| Renter-Occupied | 200 (42.3%) | $22,500 |
| Average | 473 (100.0%) | $55,104 |
Occupancy by Householder Income Bracket in Oakland
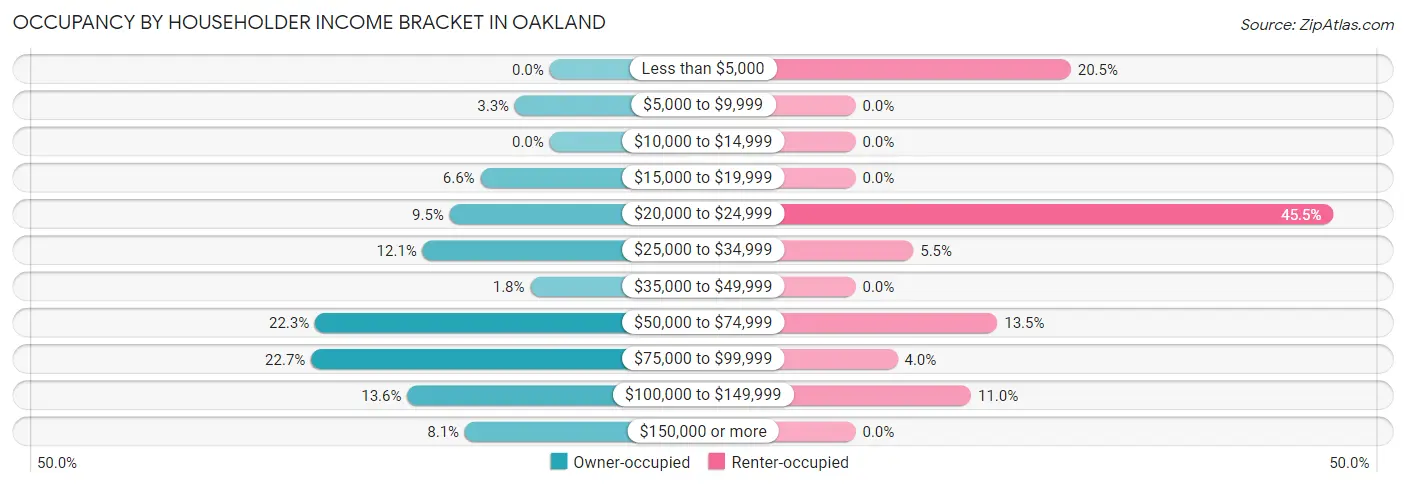
| Income Bracket | Owner-occupied | Renter-occupied |
| Less than $5,000 | 0 (0.0%) | 41 (20.5%) |
| $5,000 to $9,999 | 9 (3.3%) | 0 (0.0%) |
| $10,000 to $14,999 | 0 (0.0%) | 0 (0.0%) |
| $15,000 to $19,999 | 18 (6.6%) | 0 (0.0%) |
| $20,000 to $24,999 | 26 (9.5%) | 91 (45.5%) |
| $25,000 to $34,999 | 33 (12.1%) | 11 (5.5%) |
| $35,000 to $49,999 | 5 (1.8%) | 0 (0.0%) |
| $50,000 to $74,999 | 61 (22.3%) | 27 (13.5%) |
| $75,000 to $99,999 | 62 (22.7%) | 8 (4.0%) |
| $100,000 to $149,999 | 37 (13.6%) | 22 (11.0%) |
| $150,000 or more | 22 (8.1%) | 0 (0.0%) |
| Total | 273 (100.0%) | 200 (100.0%) |
Monthly Housing Cost Tiers in Oakland
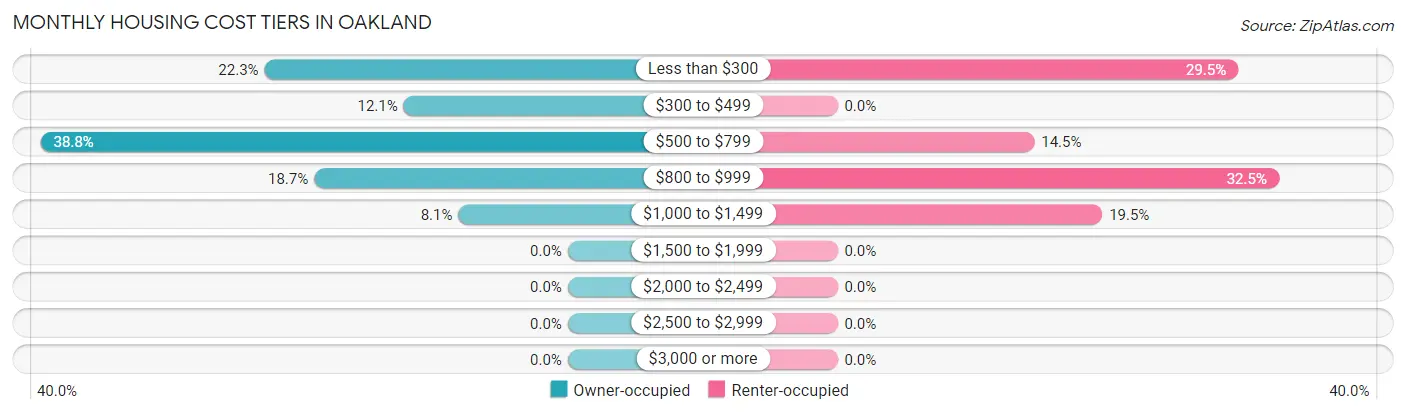
| Monthly Cost | Owner-occupied | Renter-occupied |
| Less than $300 | 61 (22.3%) | 59 (29.5%) |
| $300 to $499 | 33 (12.1%) | 0 (0.0%) |
| $500 to $799 | 106 (38.8%) | 29 (14.5%) |
| $800 to $999 | 51 (18.7%) | 65 (32.5%) |
| $1,000 to $1,499 | 22 (8.1%) | 39 (19.5%) |
| $1,500 to $1,999 | 0 (0.0%) | 0 (0.0%) |
| $2,000 to $2,499 | 0 (0.0%) | 0 (0.0%) |
| $2,500 to $2,999 | 0 (0.0%) | 0 (0.0%) |
| $3,000 or more | 0 (0.0%) | 0 (0.0%) |
| Total | 273 (100.0%) | 200 (100.0%) |
Physical Housing Characteristics in Oakland
Housing Structures in Oakland
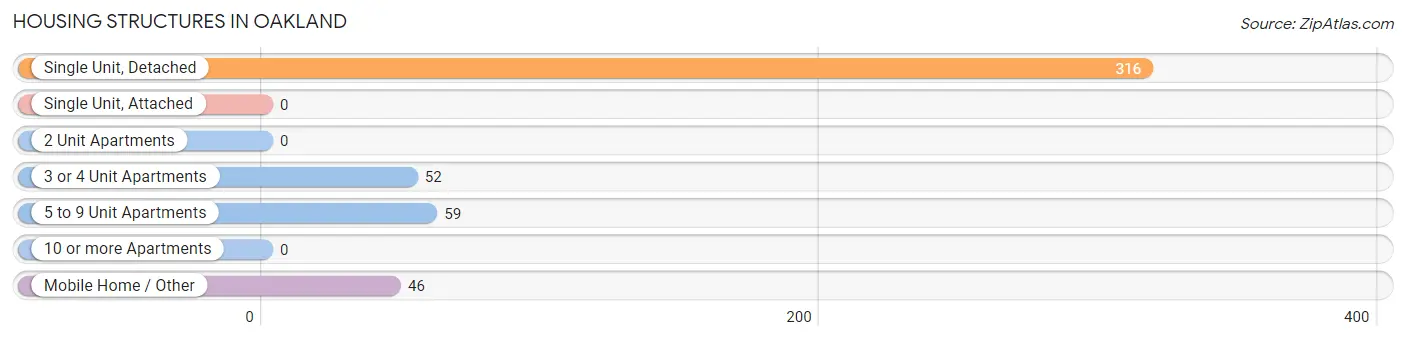
| Structure Type | # Housing Units | % Housing Units |
| Single Unit, Detached | 316 | 66.8% |
| Single Unit, Attached | 0 | 0.0% |
| 2 Unit Apartments | 0 | 0.0% |
| 3 or 4 Unit Apartments | 52 | 11.0% |
| 5 to 9 Unit Apartments | 59 | 12.5% |
| 10 or more Apartments | 0 | 0.0% |
| Mobile Home / Other | 46 | 9.7% |
| Total | 473 | 100.0% |
Housing Structures by Occupancy in Oakland
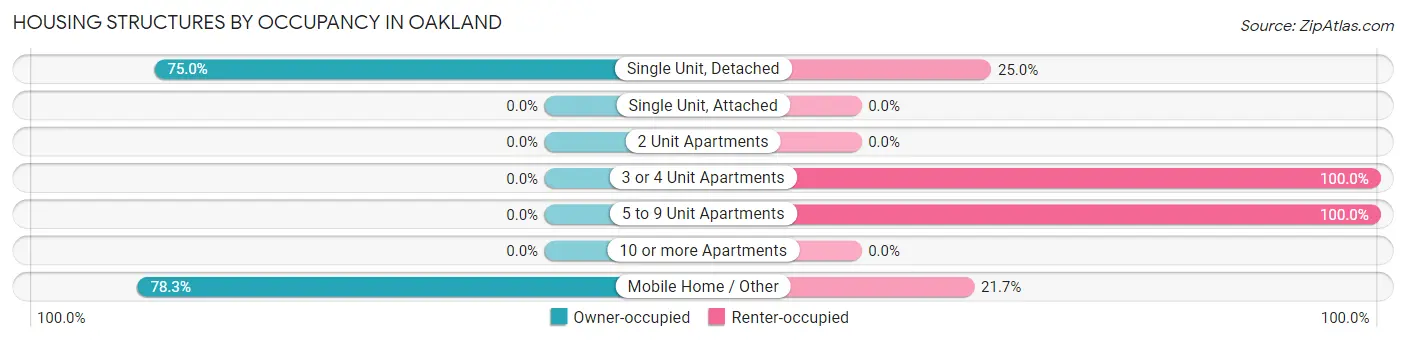
| Structure Type | Owner-occupied | Renter-occupied |
| Single Unit, Detached | 237 (75.0%) | 79 (25.0%) |
| Single Unit, Attached | 0 (0.0%) | 0 (0.0%) |
| 2 Unit Apartments | 0 (0.0%) | 0 (0.0%) |
| 3 or 4 Unit Apartments | 0 (0.0%) | 52 (100.0%) |
| 5 to 9 Unit Apartments | 0 (0.0%) | 59 (100.0%) |
| 10 or more Apartments | 0 (0.0%) | 0 (0.0%) |
| Mobile Home / Other | 36 (78.3%) | 10 (21.7%) |
| Total | 273 (57.7%) | 200 (42.3%) |
Housing Structures by Number of Rooms in Oakland
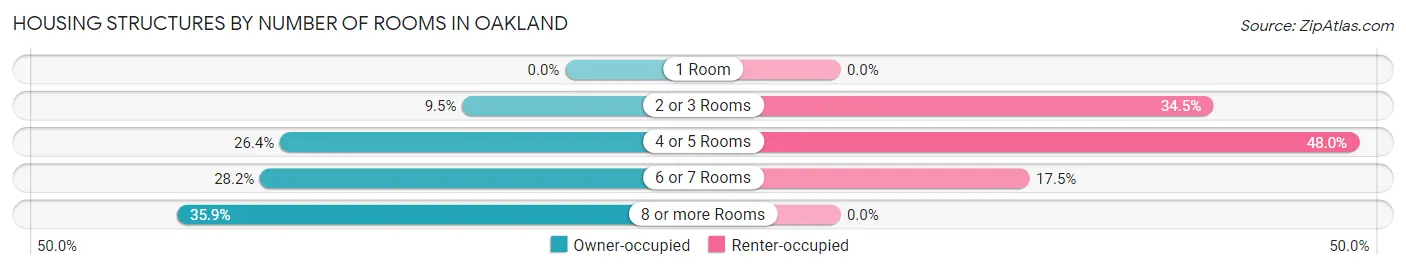
| Number of Rooms | Owner-occupied | Renter-occupied |
| 1 Room | 0 (0.0%) | 0 (0.0%) |
| 2 or 3 Rooms | 26 (9.5%) | 69 (34.5%) |
| 4 or 5 Rooms | 72 (26.4%) | 96 (48.0%) |
| 6 or 7 Rooms | 77 (28.2%) | 35 (17.5%) |
| 8 or more Rooms | 98 (35.9%) | 0 (0.0%) |
| Total | 273 (100.0%) | 200 (100.0%) |
Housing Structure by Heating Type in Oakland
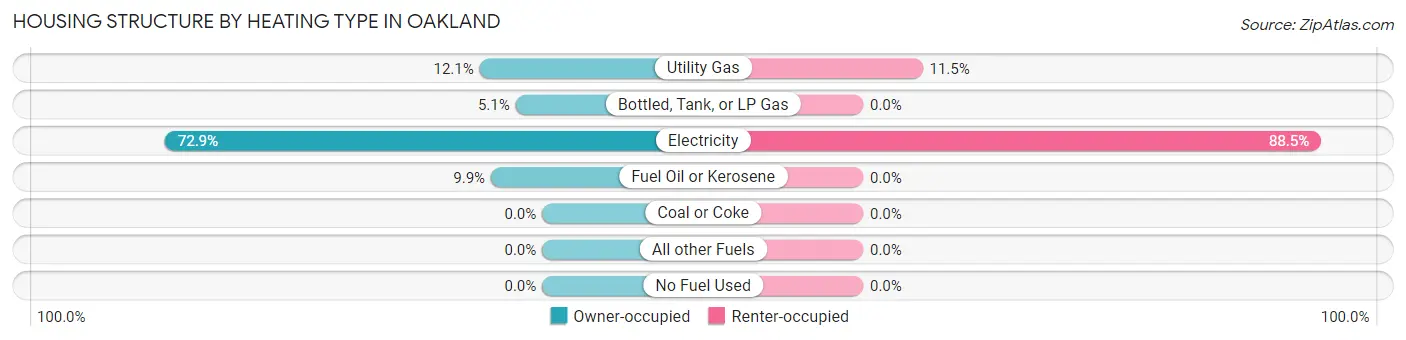
| Heating Type | Owner-occupied | Renter-occupied |
| Utility Gas | 33 (12.1%) | 23 (11.5%) |
| Bottled, Tank, or LP Gas | 14 (5.1%) | 0 (0.0%) |
| Electricity | 199 (72.9%) | 177 (88.5%) |
| Fuel Oil or Kerosene | 27 (9.9%) | 0 (0.0%) |
| Coal or Coke | 0 (0.0%) | 0 (0.0%) |
| All other Fuels | 0 (0.0%) | 0 (0.0%) |
| No Fuel Used | 0 (0.0%) | 0 (0.0%) |
| Total | 273 (100.0%) | 200 (100.0%) |
Household Vehicle Usage in Oakland
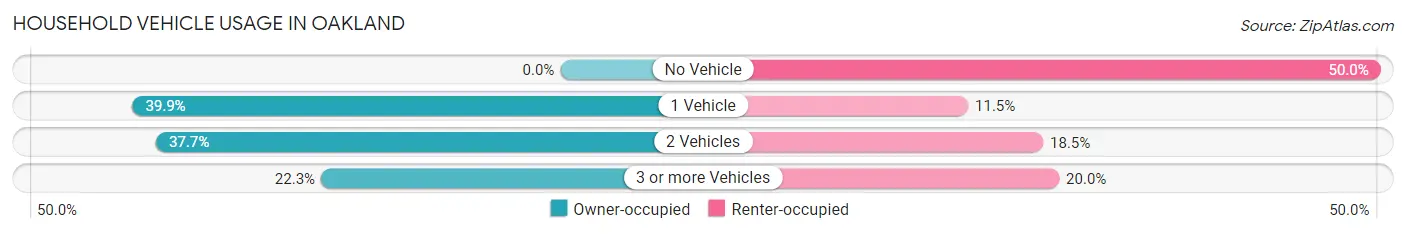
| Vehicles per Household | Owner-occupied | Renter-occupied |
| No Vehicle | 0 (0.0%) | 100 (50.0%) |
| 1 Vehicle | 109 (39.9%) | 23 (11.5%) |
| 2 Vehicles | 103 (37.7%) | 37 (18.5%) |
| 3 or more Vehicles | 61 (22.3%) | 40 (20.0%) |
| Total | 273 (100.0%) | 200 (100.0%) |
Real Estate & Mortgages in Oakland
Real Estate and Mortgage Overview in Oakland
| Characteristic | Without Mortgage | With Mortgage |
| Housing Units | 178 | 95 |
| Median Property Value | $116,200 | $101,000 |
| Median Household Income | $55,227 | $0 |
| Monthly Housing Costs | $475 | $0 |
| Real Estate Taxes | $451 | $12 |
Property Value by Mortgage Status in Oakland
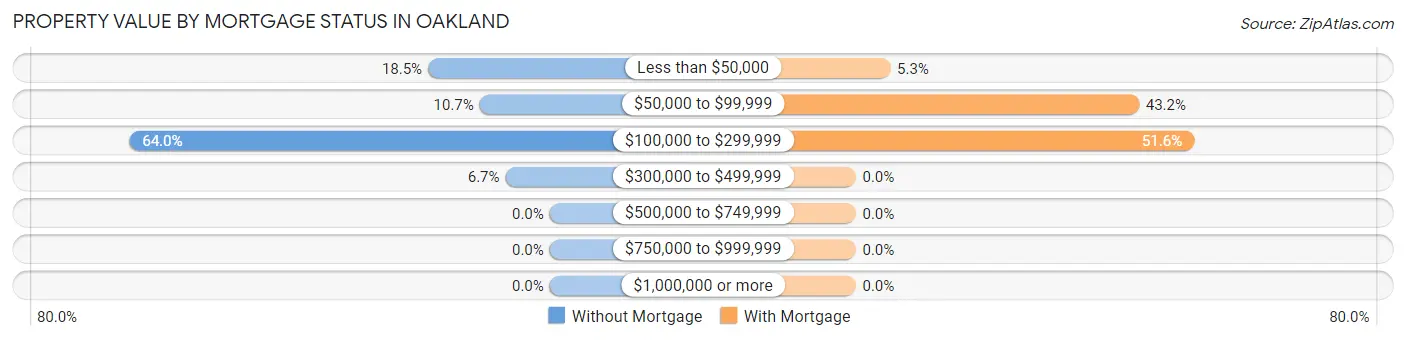
| Property Value | Without Mortgage | With Mortgage |
| Less than $50,000 | 33 (18.5%) | 5 (5.3%) |
| $50,000 to $99,999 | 19 (10.7%) | 41 (43.2%) |
| $100,000 to $299,999 | 114 (64.0%) | 49 (51.6%) |
| $300,000 to $499,999 | 12 (6.7%) | 0 (0.0%) |
| $500,000 to $749,999 | 0 (0.0%) | 0 (0.0%) |
| $750,000 to $999,999 | 0 (0.0%) | 0 (0.0%) |
| $1,000,000 or more | 0 (0.0%) | 0 (0.0%) |
| Total | 178 (100.0%) | 95 (100.0%) |
Household Income by Mortgage Status in Oakland
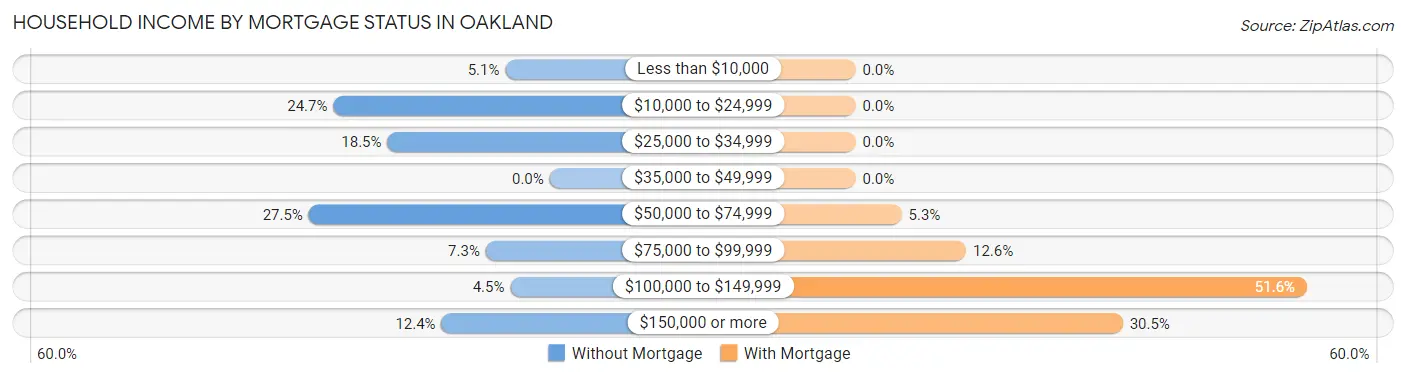
| Household Income | Without Mortgage | With Mortgage |
| Less than $10,000 | 9 (5.1%) | 0 (0.0%) |
| $10,000 to $24,999 | 44 (24.7%) | 0 (0.0%) |
| $25,000 to $34,999 | 33 (18.5%) | 0 (0.0%) |
| $35,000 to $49,999 | 0 (0.0%) | 0 (0.0%) |
| $50,000 to $74,999 | 49 (27.5%) | 5 (5.3%) |
| $75,000 to $99,999 | 13 (7.3%) | 12 (12.6%) |
| $100,000 to $149,999 | 8 (4.5%) | 49 (51.6%) |
| $150,000 or more | 22 (12.4%) | 29 (30.5%) |
| Total | 178 (100.0%) | 95 (100.0%) |
Property Value to Household Income Ratio in Oakland
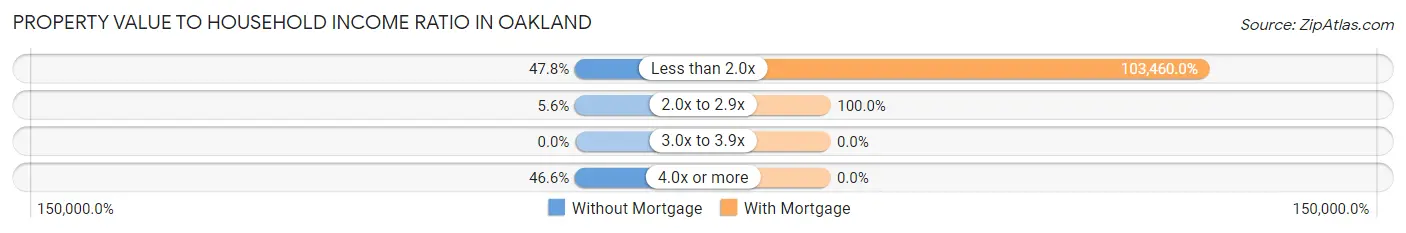
| Value-to-Income Ratio | Without Mortgage | With Mortgage |
| Less than 2.0x | 85 (47.7%) | 98,287 (103,460.0%) |
| 2.0x to 2.9x | 10 (5.6%) | 95 (100.0%) |
| 3.0x to 3.9x | 0 (0.0%) | 0 (0.0%) |
| 4.0x or more | 83 (46.6%) | 0 (0.0%) |
| Total | 178 (100.0%) | 95 (100.0%) |
Real Estate Taxes by Mortgage Status in Oakland
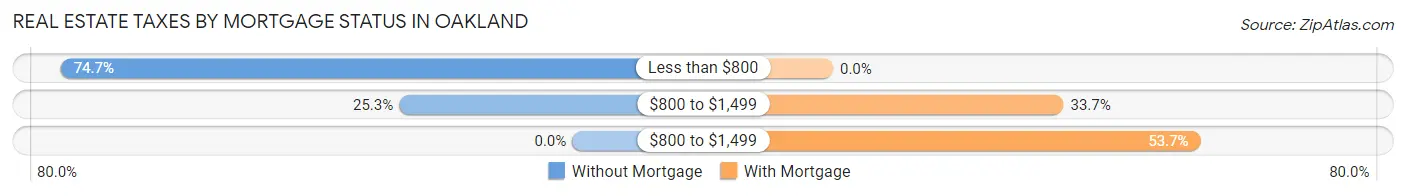
| Property Taxes | Without Mortgage | With Mortgage |
| Less than $800 | 133 (74.7%) | 0 (0.0%) |
| $800 to $1,499 | 45 (25.3%) | 32 (33.7%) |
| $800 to $1,499 | 0 (0.0%) | 51 (53.7%) |
| Total | 178 (100.0%) | 95 (100.0%) |
Health & Disability in Oakland
Health Insurance Coverage by Age in Oakland
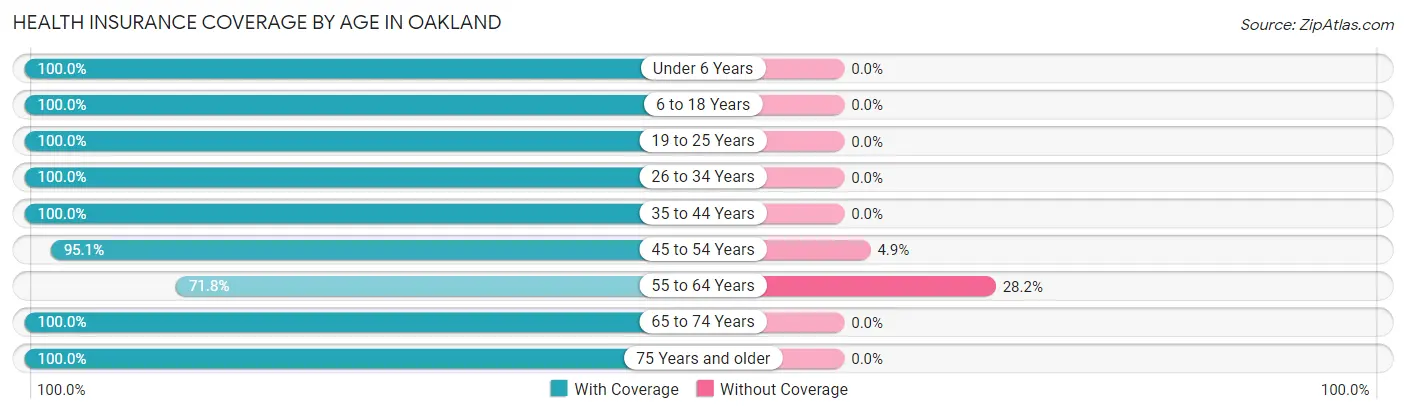
| Age Bracket | With Coverage | Without Coverage |
| Under 6 Years | 71 (100.0%) | 0 (0.0%) |
| 6 to 18 Years | 200 (100.0%) | 0 (0.0%) |
| 19 to 25 Years | 56 (100.0%) | 0 (0.0%) |
| 26 to 34 Years | 70 (100.0%) | 0 (0.0%) |
| 35 to 44 Years | 76 (100.0%) | 0 (0.0%) |
| 45 to 54 Years | 156 (95.1%) | 8 (4.9%) |
| 55 to 64 Years | 94 (71.8%) | 37 (28.2%) |
| 65 to 74 Years | 51 (100.0%) | 0 (0.0%) |
| 75 Years and older | 125 (100.0%) | 0 (0.0%) |
| Total | 899 (95.2%) | 45 (4.8%) |
Health Insurance Coverage by Citizenship Status in Oakland
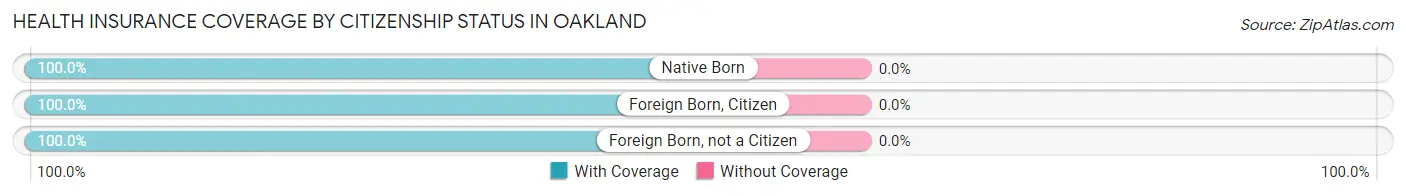
| Citizenship Status | With Coverage | Without Coverage |
| Native Born | 71 (100.0%) | 0 (0.0%) |
| Foreign Born, Citizen | 200 (100.0%) | 0 (0.0%) |
| Foreign Born, not a Citizen | 56 (100.0%) | 0 (0.0%) |
Health Insurance Coverage by Household Income in Oakland
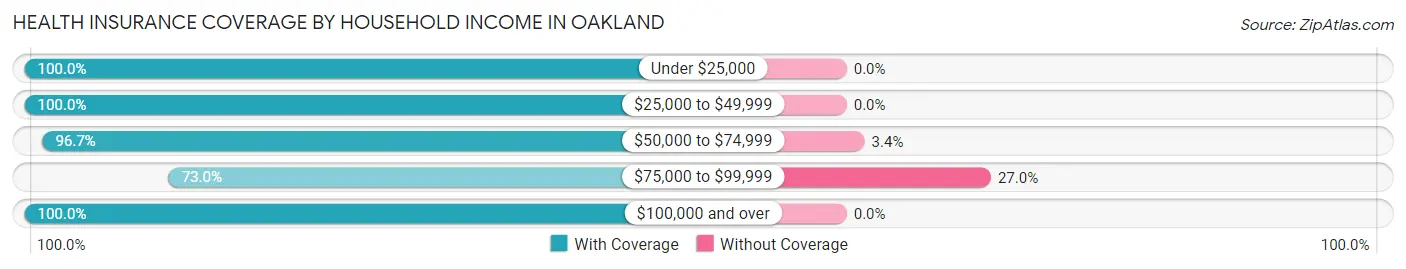
| Household Income | With Coverage | Without Coverage |
| Under $25,000 | 256 (100.0%) | 0 (0.0%) |
| $25,000 to $49,999 | 54 (100.0%) | 0 (0.0%) |
| $50,000 to $74,999 | 231 (96.7%) | 8 (3.4%) |
| $75,000 to $99,999 | 100 (73.0%) | 37 (27.0%) |
| $100,000 and over | 258 (100.0%) | 0 (0.0%) |
Public vs Private Health Insurance Coverage by Age in Oakland
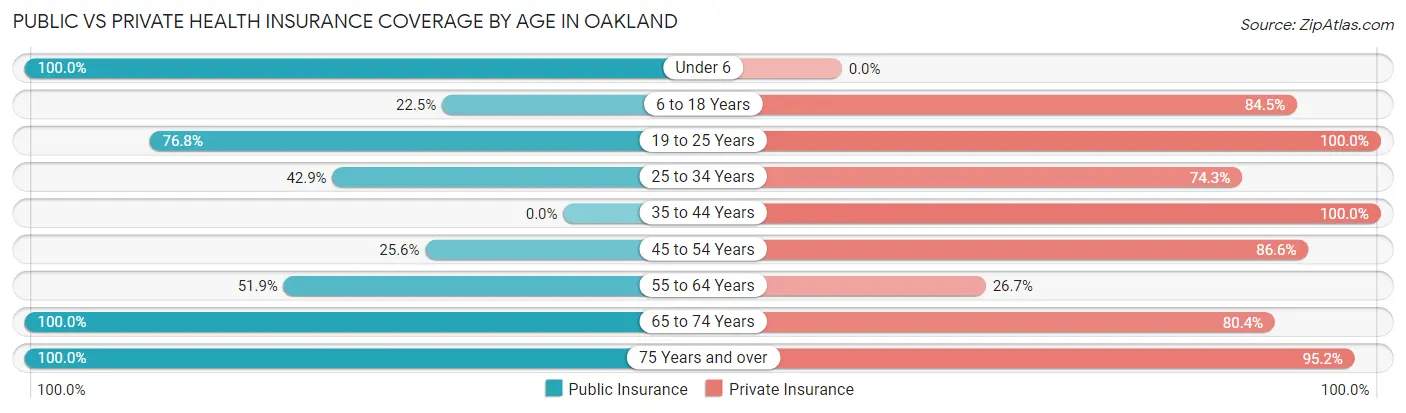
| Age Bracket | Public Insurance | Private Insurance |
| Under 6 | 71 (100.0%) | 0 (0.0%) |
| 6 to 18 Years | 45 (22.5%) | 169 (84.5%) |
| 19 to 25 Years | 43 (76.8%) | 56 (100.0%) |
| 25 to 34 Years | 30 (42.9%) | 52 (74.3%) |
| 35 to 44 Years | 0 (0.0%) | 76 (100.0%) |
| 45 to 54 Years | 42 (25.6%) | 142 (86.6%) |
| 55 to 64 Years | 68 (51.9%) | 35 (26.7%) |
| 65 to 74 Years | 51 (100.0%) | 41 (80.4%) |
| 75 Years and over | 125 (100.0%) | 119 (95.2%) |
| Total | 475 (50.3%) | 690 (73.1%) |
Disability Status by Sex by Age in Oakland
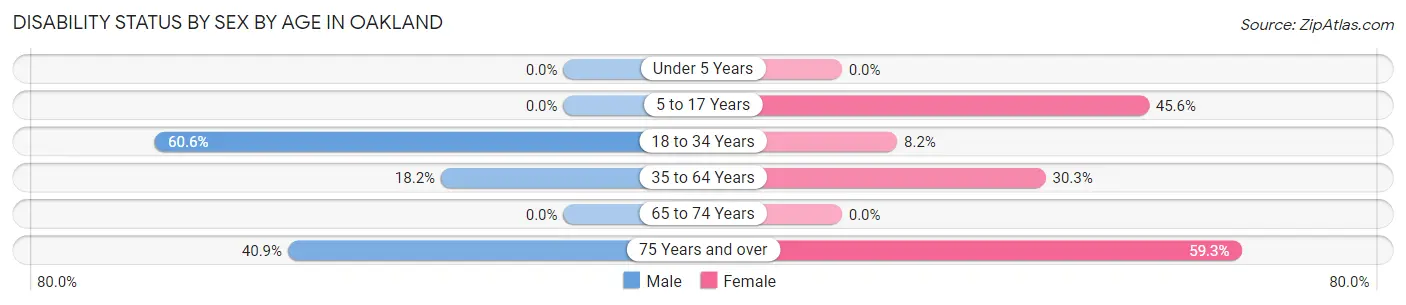
| Age Bracket | Male | Female |
| Under 5 Years | 0 (0.0%) | 0 (0.0%) |
| 5 to 17 Years | 0 (0.0%) | 31 (45.6%) |
| 18 to 34 Years | 20 (60.6%) | 11 (8.2%) |
| 35 to 64 Years | 32 (18.2%) | 59 (30.3%) |
| 65 to 74 Years | 0 (0.0%) | 0 (0.0%) |
| 75 Years and over | 27 (40.9%) | 35 (59.3%) |
Disability Class by Sex by Age in Oakland
Disability Class: Hearing Difficulty
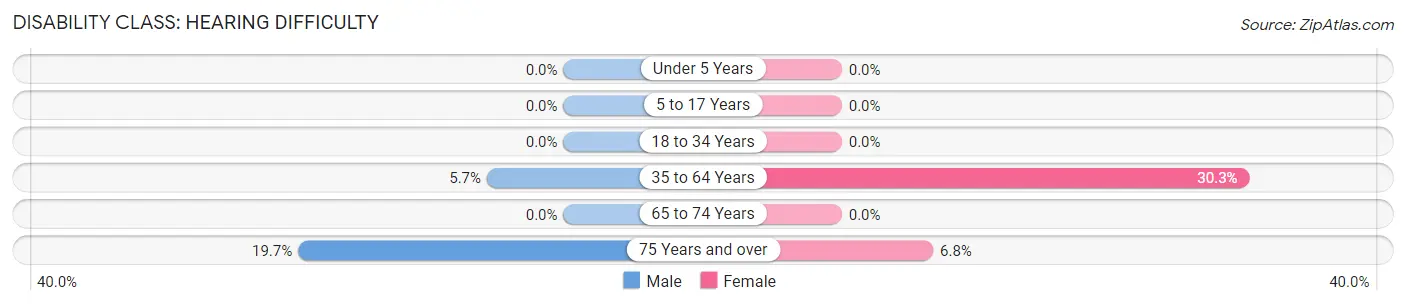
| Age Bracket | Male | Female |
| Under 5 Years | 0 (0.0%) | 0 (0.0%) |
| 5 to 17 Years | 0 (0.0%) | 0 (0.0%) |
| 18 to 34 Years | 0 (0.0%) | 0 (0.0%) |
| 35 to 64 Years | 10 (5.7%) | 59 (30.3%) |
| 65 to 74 Years | 0 (0.0%) | 0 (0.0%) |
| 75 Years and over | 13 (19.7%) | 4 (6.8%) |
Disability Class: Vision Difficulty
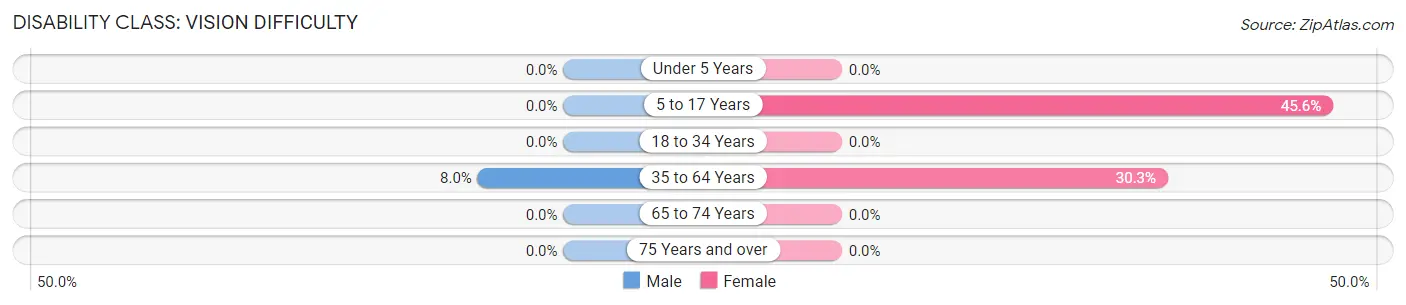
| Age Bracket | Male | Female |
| Under 5 Years | 0 (0.0%) | 0 (0.0%) |
| 5 to 17 Years | 0 (0.0%) | 31 (45.6%) |
| 18 to 34 Years | 0 (0.0%) | 0 (0.0%) |
| 35 to 64 Years | 14 (8.0%) | 59 (30.3%) |
| 65 to 74 Years | 0 (0.0%) | 0 (0.0%) |
| 75 Years and over | 0 (0.0%) | 0 (0.0%) |
Disability Class: Cognitive Difficulty
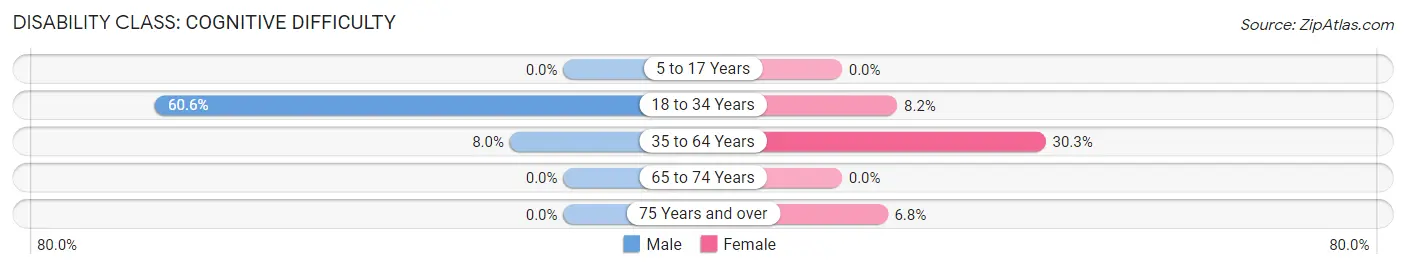
| Age Bracket | Male | Female |
| 5 to 17 Years | 0 (0.0%) | 0 (0.0%) |
| 18 to 34 Years | 20 (60.6%) | 11 (8.2%) |
| 35 to 64 Years | 14 (8.0%) | 59 (30.3%) |
| 65 to 74 Years | 0 (0.0%) | 0 (0.0%) |
| 75 Years and over | 0 (0.0%) | 4 (6.8%) |
Disability Class: Ambulatory Difficulty
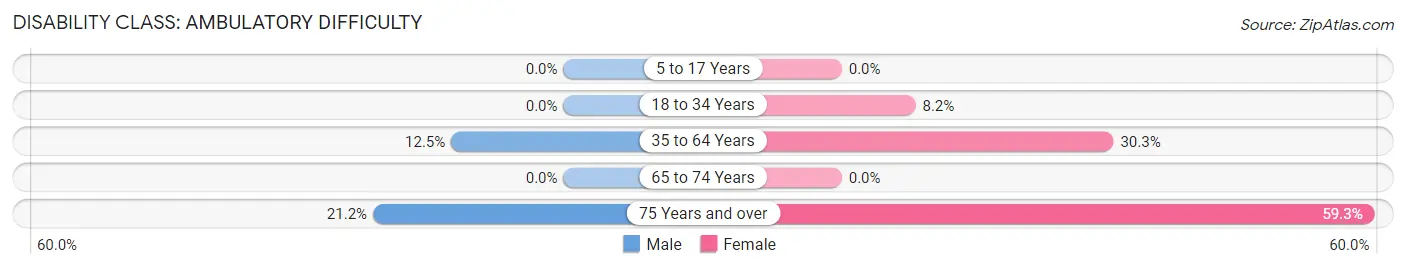
| Age Bracket | Male | Female |
| 5 to 17 Years | 0 (0.0%) | 0 (0.0%) |
| 18 to 34 Years | 0 (0.0%) | 11 (8.2%) |
| 35 to 64 Years | 22 (12.5%) | 59 (30.3%) |
| 65 to 74 Years | 0 (0.0%) | 0 (0.0%) |
| 75 Years and over | 14 (21.2%) | 35 (59.3%) |
Disability Class: Self-Care Difficulty
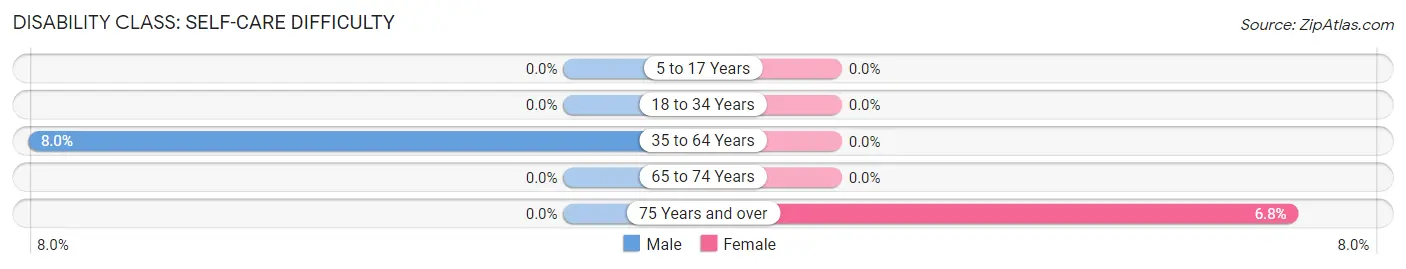
| Age Bracket | Male | Female |
| 5 to 17 Years | 0 (0.0%) | 0 (0.0%) |
| 18 to 34 Years | 0 (0.0%) | 0 (0.0%) |
| 35 to 64 Years | 14 (8.0%) | 0 (0.0%) |
| 65 to 74 Years | 0 (0.0%) | 0 (0.0%) |
| 75 Years and over | 0 (0.0%) | 4 (6.8%) |
Technology Access in Oakland
Computing Device Access in Oakland
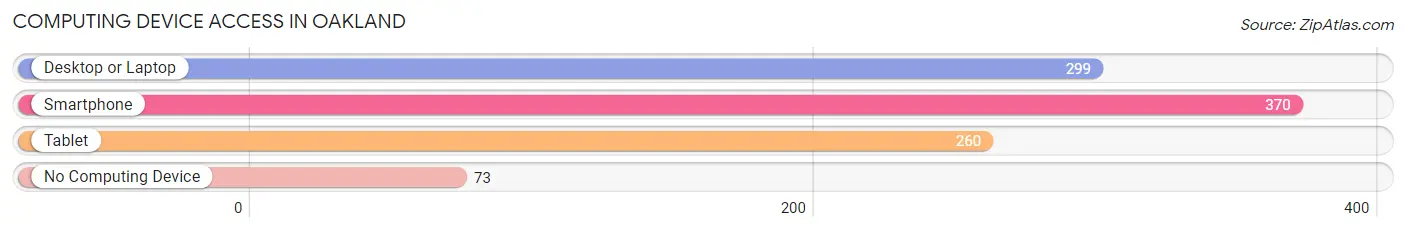
| Device Type | # Households | % Households |
| Desktop or Laptop | 299 | 63.2% |
| Smartphone | 370 | 78.2% |
| Tablet | 260 | 55.0% |
| No Computing Device | 73 | 15.4% |
| Total | 473 | 100.0% |
Internet Access in Oakland
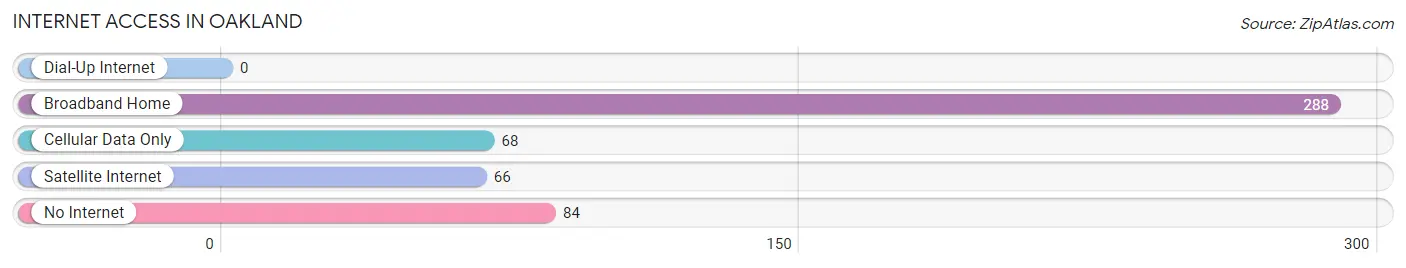
| Internet Type | # Households | % Households |
| Dial-Up Internet | 0 | 0.0% |
| Broadband Home | 288 | 60.9% |
| Cellular Data Only | 68 | 14.4% |
| Satellite Internet | 66 | 14.0% |
| No Internet | 84 | 17.8% |
| Total | 473 | 100.0% |
Oakland Summary
Oakland is a small town located in the Upstate region of South Carolina. It is situated in the foothills of the Blue Ridge Mountains, approximately 25 miles from Greenville. The town has a population of just over 1,000 people and is known for its rural charm and small-town atmosphere.
History
Oakland was first settled in the late 1700s by a group of settlers from North Carolina. The town was originally known as “Oakland Crossroads” due to its location at the intersection of two major roads. The town was officially incorporated in 1872 and was named after the many oak trees that grew in the area.
In the late 1800s, Oakland was a thriving agricultural community. The town was home to several cotton mills, a grist mill, and a sawmill. The town also had a thriving business district, with several stores, a hotel, and a post office.
In the early 1900s, Oakland began to decline as the cotton industry moved away from the area. The town’s population decreased and many of the businesses closed. However, in the late 1900s, Oakland began to experience a resurgence. The town was revitalized with the opening of a new shopping center and the construction of a new school.
Geography
Oakland is located in the foothills of the Blue Ridge Mountains in the Upstate region of South Carolina. The town is situated at the intersection of two major roads, US Highway 25 and SC Highway 11. The town is surrounded by rolling hills and forests, and is located approximately 25 miles from Greenville.
Economy
Oakland’s economy is largely based on agriculture and tourism. The town is home to several farms, which produce a variety of crops, including corn, soybeans, and wheat. The town also has several wineries and vineyards, which attract tourists from all over the region.
In addition to agriculture and tourism, Oakland is home to several small businesses, including restaurants, retail stores, and professional services. The town also has a small manufacturing sector, which produces a variety of products, including furniture and textiles.
Demographics
As of the 2010 census, Oakland had a population of 1,072 people. The town is predominantly white, with a small African American population. The median household income is $37,000, and the median home value is $125,000.
Oakland is a small town with a rural charm and a friendly atmosphere. The town is home to a diverse population and a thriving economy. Oakland is a great place to live, work, and raise a family.
Common Questions
What is Per Capita Income in Oakland?
Per Capita income in Oakland is $30,295.
What is the Median Family Income in Oakland?
Median Family Income in Oakland is $57,167.
What is the Median Household income in Oakland?
Median Household Income in Oakland is $55,104.
What is Inequality or Gini Index in Oakland?
Inequality or Gini Index in Oakland is 0.45.
What is the Total Population of Oakland?
Total Population of Oakland is 958.
What is the Total Male Population of Oakland?
Total Male Population of Oakland is 417.
What is the Total Female Population of Oakland?
Total Female Population of Oakland is 541.
What is the Ratio of Males per 100 Females in Oakland?
There are 77.08 Males per 100 Females in Oakland.
What is the Ratio of Females per 100 Males in Oakland?
There are 129.74 Females per 100 Males in Oakland.
What is the Median Population Age in Oakland?
Median Population Age in Oakland is 42.2 Years.
What is the Average Family Size in Oakland
Average Family Size in Oakland is 3.4 People.
What is the Average Household Size in Oakland
Average Household Size in Oakland is 2.0 People.
How Large is the Labor Force in Oakland?
There are 337 People in the Labor Forcein in Oakland.
What is the Percentage of People in the Labor Force in Oakland?
45.7% of People are in the Labor Force in Oakland.
What is the Unemployment Rate in Oakland?
Unemployment Rate in Oakland is 8.4%.