Slater Marietta, SC Map & Demographics
Slater Marietta Map
Slater Marietta Overview
$24,298
PER CAPITA INCOME
$54,881
AVG FAMILY INCOME
$46,797
AVG HOUSEHOLD INCOME
2.7%
WAGE / INCOME GAP [ % ]
97.3¢/ $1
WAGE / INCOME GAP [ $ ]
0.43
INEQUALITY / GINI INDEX
2,199
TOTAL POPULATION
1,162
MALE POPULATION
1,037
FEMALE POPULATION
112.05
MALES / 100 FEMALES
89.24
FEMALES / 100 MALES
49.0
MEDIAN AGE
2.9
AVG FAMILY SIZE
2.5
AVG HOUSEHOLD SIZE
1,016
LABOR FORCE [ PEOPLE ]
56.4%
PERCENT IN LABOR FORCE
5.5%
UNEMPLOYMENT RATE
Income in Slater Marietta
Income Overview in Slater Marietta
Per Capita Income in Slater Marietta is $24,298, while median incomes of families and households are $54,881 and $46,797 respectively.
| Characteristic | Number | Measure |
| Per Capita Income | 2,199 | $24,298 |
| Median Family Income | 598 | $54,881 |
| Mean Family Income | 598 | $72,588 |
| Median Household Income | 856 | $46,797 |
| Mean Household Income | 856 | $59,626 |
| Income Deficit | 598 | $0 |
| Wage / Income Gap (%) | 2,199 | 2.71% |
| Wage / Income Gap ($) | 2,199 | 97.29¢ per $1 |
| Gini / Inequality Index | 2,199 | 0.43 |
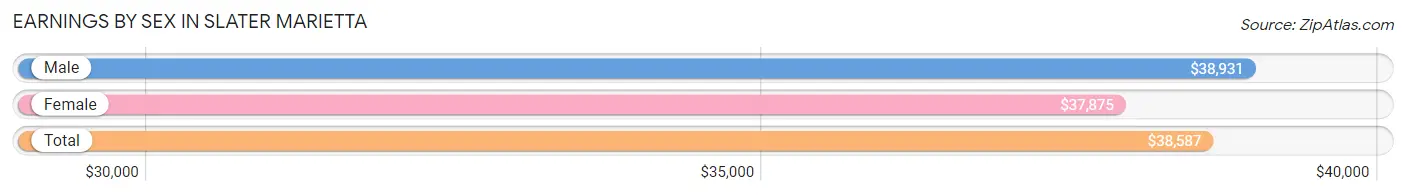
Earnings by Sex in Slater Marietta
Average Earnings in Slater Marietta are $38,587, $38,931 for men and $37,875 for women, a difference of 2.7%.
| Sex | Number | Average Earnings |
| Male | 567 (54.9%) | $38,931 |
| Female | 466 (45.1%) | $37,875 |
| Total | 1,033 (100.0%) | $38,587 |
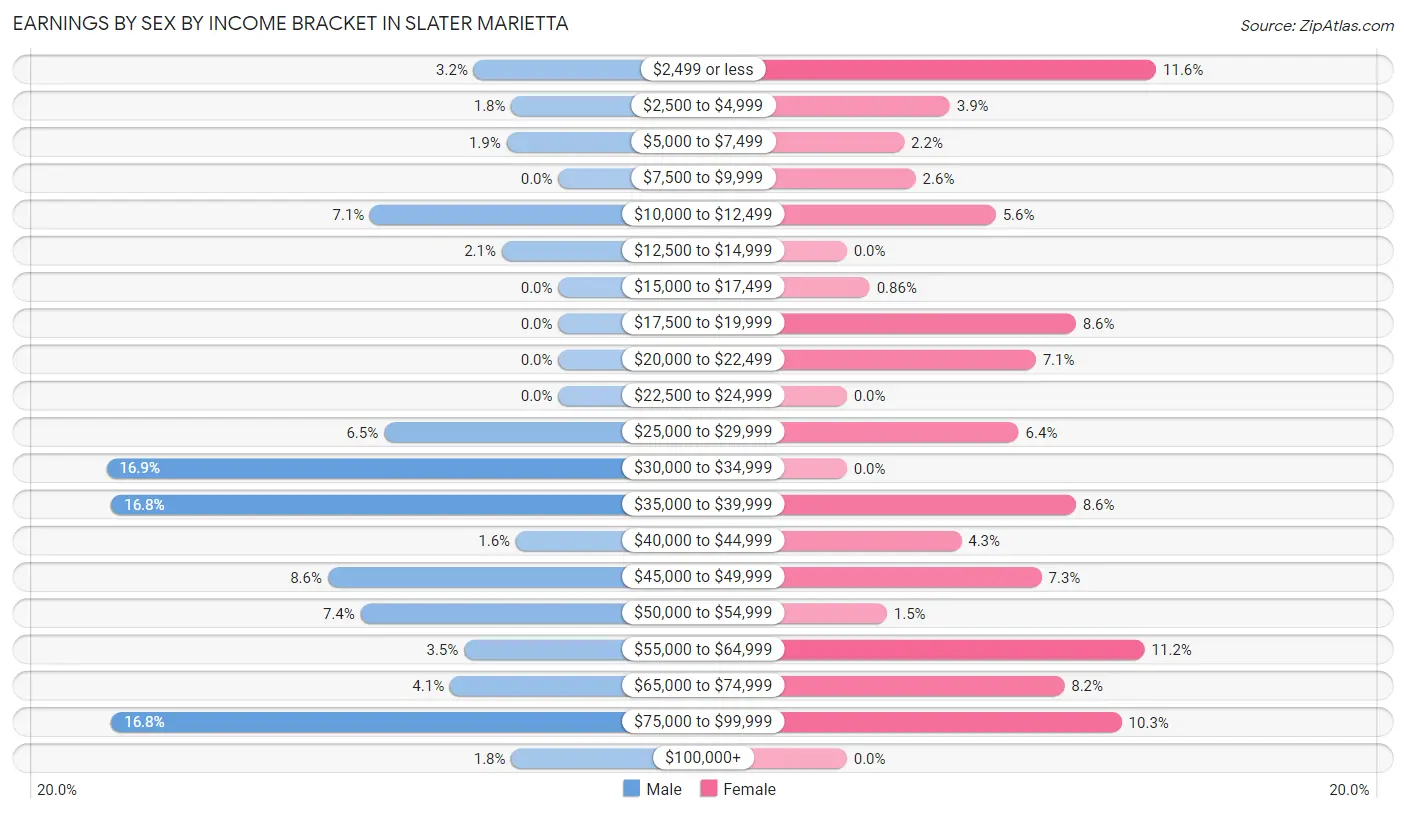
Earnings by Sex by Income Bracket in Slater Marietta
The most common earnings brackets in Slater Marietta are $30,000 to $34,999 for men (96 | 16.9%) and $2,499 or less for women (54 | 11.6%).
| Income | Male | Female |
| $2,499 or less | 18 (3.2%) | 54 (11.6%) |
| $2,500 to $4,999 | 10 (1.8%) | 18 (3.9%) |
| $5,000 to $7,499 | 11 (1.9%) | 10 (2.1%) |
| $7,500 to $9,999 | 0 (0.0%) | 12 (2.6%) |
| $10,000 to $12,499 | 40 (7.0%) | 26 (5.6%) |
| $12,500 to $14,999 | 12 (2.1%) | 0 (0.0%) |
| $15,000 to $17,499 | 0 (0.0%) | 4 (0.9%) |
| $17,500 to $19,999 | 0 (0.0%) | 40 (8.6%) |
| $20,000 to $22,499 | 0 (0.0%) | 33 (7.1%) |
| $22,500 to $24,999 | 0 (0.0%) | 0 (0.0%) |
| $25,000 to $29,999 | 37 (6.5%) | 30 (6.4%) |
| $30,000 to $34,999 | 96 (16.9%) | 0 (0.0%) |
| $35,000 to $39,999 | 95 (16.8%) | 40 (8.6%) |
| $40,000 to $44,999 | 9 (1.6%) | 20 (4.3%) |
| $45,000 to $49,999 | 49 (8.6%) | 34 (7.3%) |
| $50,000 to $54,999 | 42 (7.4%) | 7 (1.5%) |
| $55,000 to $64,999 | 20 (3.5%) | 52 (11.2%) |
| $65,000 to $74,999 | 23 (4.1%) | 38 (8.2%) |
| $75,000 to $99,999 | 95 (16.8%) | 48 (10.3%) |
| $100,000+ | 10 (1.8%) | 0 (0.0%) |
| Total | 567 (100.0%) | 466 (100.0%) |
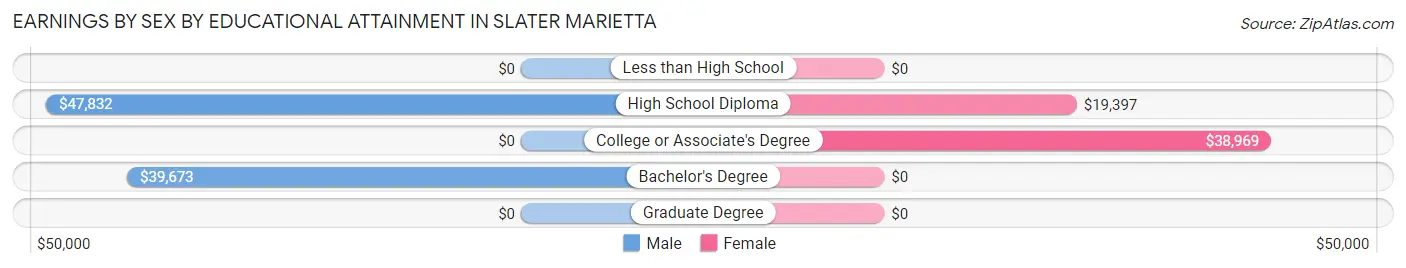
Earnings by Sex by Educational Attainment in Slater Marietta
Average earnings in Slater Marietta are $39,819 for men and $38,500 for women, a difference of 3.3%. Men with an educational attainment of high school diploma enjoy the highest average annual earnings of $47,832, while those with bachelor's degree education earn the least with $39,673. Women with an educational attainment of college or associate's degree earn the most with the average annual earnings of $38,969, while those with high school diploma education have the smallest earnings of $19,397.
| Educational Attainment | Male Income | Female Income |
| Less than High School | - | - |
| High School Diploma | $47,832 | $19,397 |
| College or Associate's Degree | - | - |
| Bachelor's Degree | $39,673 | $0 |
| Graduate Degree | - | - |
| Total | $39,819 | $38,500 |
Family Income in Slater Marietta
Family Income Brackets in Slater Marietta
According to the Slater Marietta family income data, there are 146 families falling into the $35,000 to $49,999 income range, which is the most common income bracket and makes up 24.4% of all families.
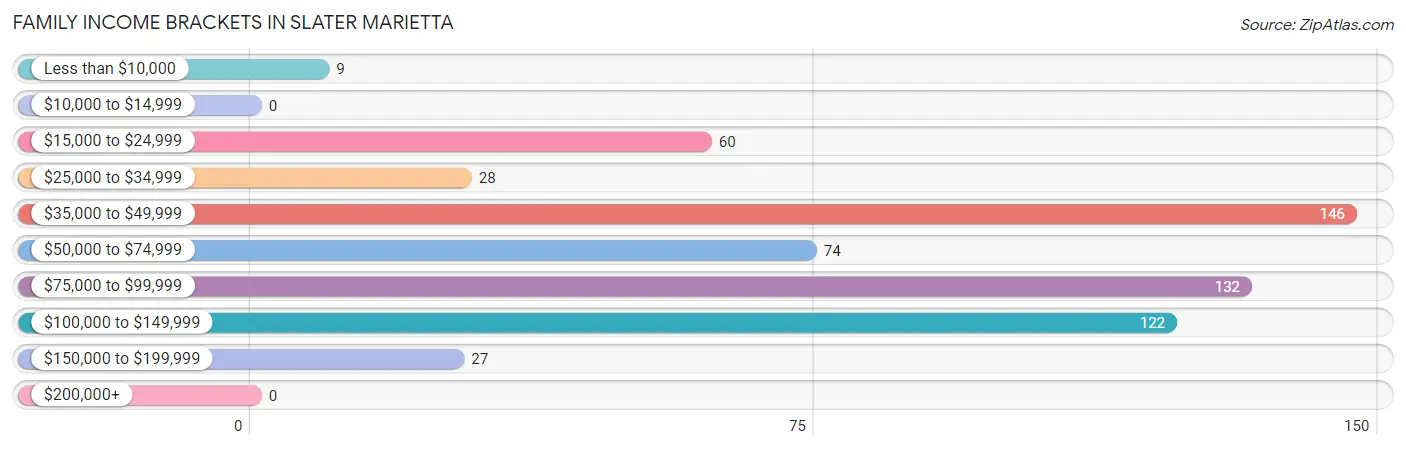
| Income Bracket | # Families | % Families |
| Less than $10,000 | 9 | 1.5% |
| $10,000 to $14,999 | 0 | 0.0% |
| $15,000 to $24,999 | 60 | 10.0% |
| $25,000 to $34,999 | 28 | 4.7% |
| $35,000 to $49,999 | 146 | 24.4% |
| $50,000 to $74,999 | 74 | 12.4% |
| $75,000 to $99,999 | 132 | 22.1% |
| $100,000 to $149,999 | 122 | 20.4% |
| $150,000 to $199,999 | 27 | 4.5% |
| $200,000+ | 0 | 0.0% |
Family Income by Famaliy Size in Slater Marietta
3-person families (93 | 15.5%) account for the highest median family income in Slater Marietta with $75,230 per family, while 2-person families (330 | 55.2%) have the highest median income of $26,310 per family member.
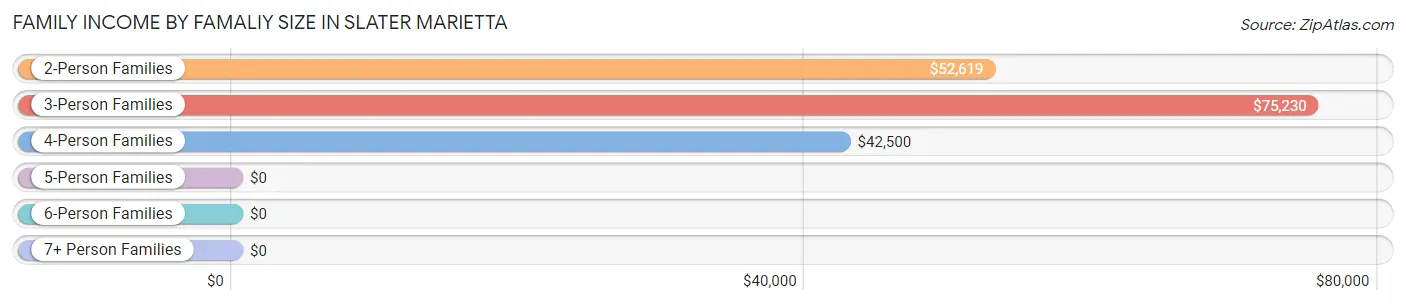
| Income Bracket | # Families | Median Income |
| 2-Person Families | 330 (55.2%) | $52,619 |
| 3-Person Families | 93 (15.5%) | $75,230 |
| 4-Person Families | 116 (19.4%) | $42,500 |
| 5-Person Families | 49 (8.2%) | $0 |
| 6-Person Families | 0 (0.0%) | $0 |
| 7+ Person Families | 10 (1.7%) | $0 |
| Total | 598 (100.0%) | $54,881 |
Family Income by Number of Earners in Slater Marietta
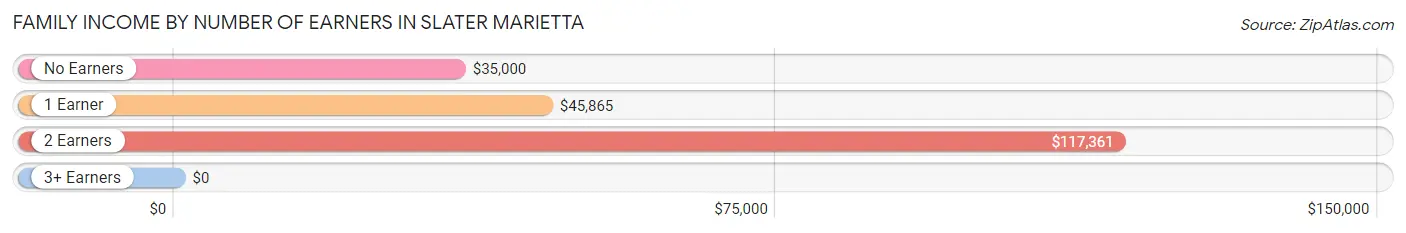
| Number of Earners | # Families | Median Income |
| No Earners | 96 (16.1%) | $35,000 |
| 1 Earner | 239 (40.0%) | $45,865 |
| 2 Earners | 247 (41.3%) | $117,361 |
| 3+ Earners | 16 (2.7%) | $0 |
| Total | 598 (100.0%) | $54,881 |
Household Income in Slater Marietta
Household Income Brackets in Slater Marietta
With 164 households falling in the category, the $35,000 to $49,999 income range is the most frequent in Slater Marietta, accounting for 19.2% of all households.
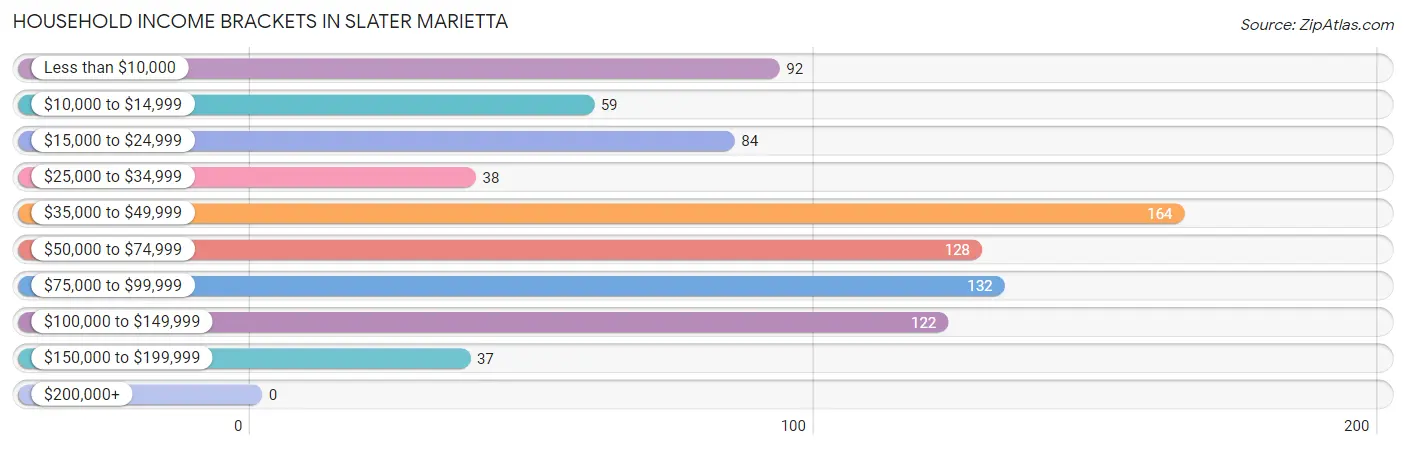
| Income Bracket | # Households | % Households |
| Less than $10,000 | 92 | 10.7% |
| $10,000 to $14,999 | 59 | 6.9% |
| $15,000 to $24,999 | 84 | 9.8% |
| $25,000 to $34,999 | 38 | 4.4% |
| $35,000 to $49,999 | 164 | 19.2% |
| $50,000 to $74,999 | 128 | 15.0% |
| $75,000 to $99,999 | 132 | 15.4% |
| $100,000 to $149,999 | 122 | 14.3% |
| $150,000 to $199,999 | 37 | 4.3% |
| $200,000+ | 0 | 0.0% |
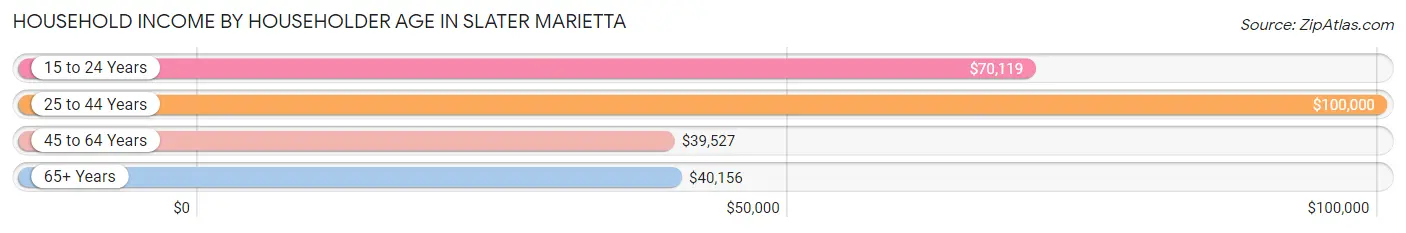
Household Income by Householder Age in Slater Marietta
The median household income in Slater Marietta is $46,797, with the highest median household income of $100,000 found in the 25 to 44 years age bracket for the primary householder. A total of 142 households (16.6%) fall into this category. Meanwhile, the 45 to 64 years age bracket for the primary householder has the lowest median household income of $39,527, with 457 households (53.4%) in this group.
| Income Bracket | # Households | Median Income |
| 15 to 24 Years | 40 (4.7%) | $70,119 |
| 25 to 44 Years | 142 (16.6%) | $100,000 |
| 45 to 64 Years | 457 (53.4%) | $39,527 |
| 65+ Years | 217 (25.4%) | $40,156 |
| Total | 856 (100.0%) | $46,797 |
Poverty in Slater Marietta
Income Below Poverty by Sex and Age in Slater Marietta
With 15.4% poverty level for males and 25.5% for females among the residents of Slater Marietta, under 5 year old males and 75 year old and over females are the most vulnerable to poverty, with 28 males (65.1%) and 32 females (57.1%) in their respective age groups living below the poverty level.
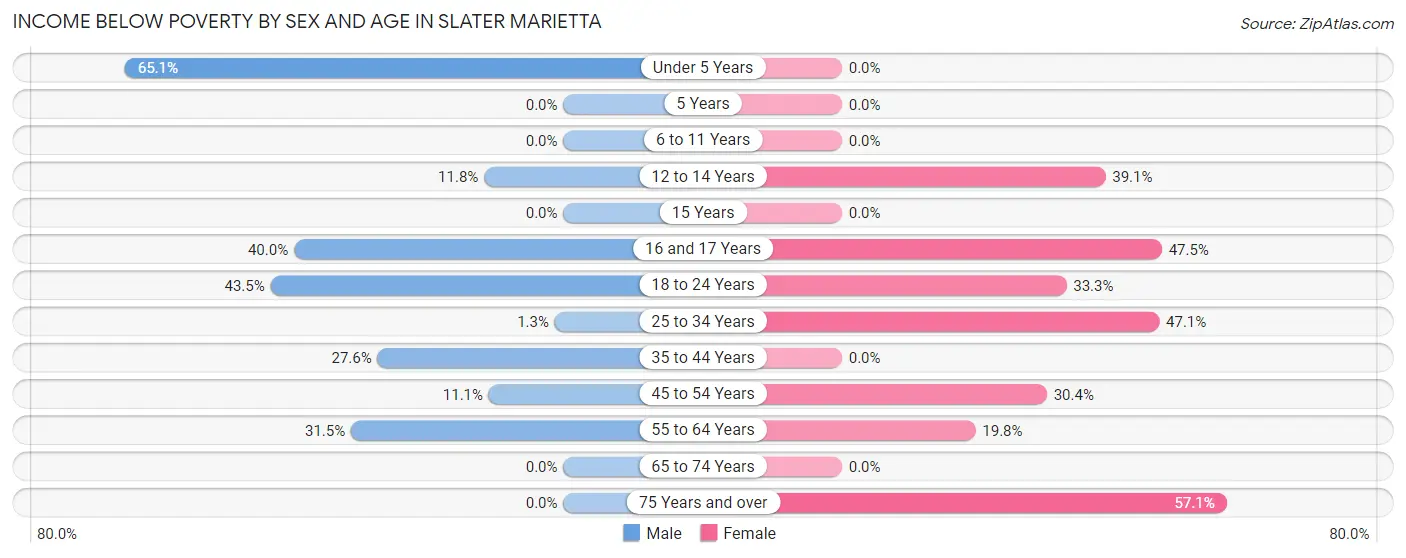
| Age Bracket | Male | Female |
| Under 5 Years | 28 (65.1%) | 0 (0.0%) |
| 5 Years | 0 (0.0%) | 0 (0.0%) |
| 6 to 11 Years | 0 (0.0%) | 0 (0.0%) |
| 12 to 14 Years | 10 (11.8%) | 9 (39.1%) |
| 15 Years | 0 (0.0%) | 0 (0.0%) |
| 16 and 17 Years | 10 (40.0%) | 19 (47.5%) |
| 18 to 24 Years | 30 (43.5%) | 20 (33.3%) |
| 25 to 34 Years | 2 (1.3%) | 49 (47.1%) |
| 35 to 44 Years | 8 (27.6%) | 0 (0.0%) |
| 45 to 54 Years | 22 (11.1%) | 98 (30.4%) |
| 55 to 64 Years | 64 (31.5%) | 24 (19.8%) |
| 65 to 74 Years | 0 (0.0%) | 0 (0.0%) |
| 75 Years and over | 0 (0.0%) | 32 (57.1%) |
| Total | 174 (15.4%) | 251 (25.5%) |
Income Above Poverty by Sex and Age in Slater Marietta
According to the poverty statistics in Slater Marietta, males aged 5 years and females aged under 5 years are the age groups that are most secure financially, with 100.0% of males and 100.0% of females in these age groups living above the poverty line.
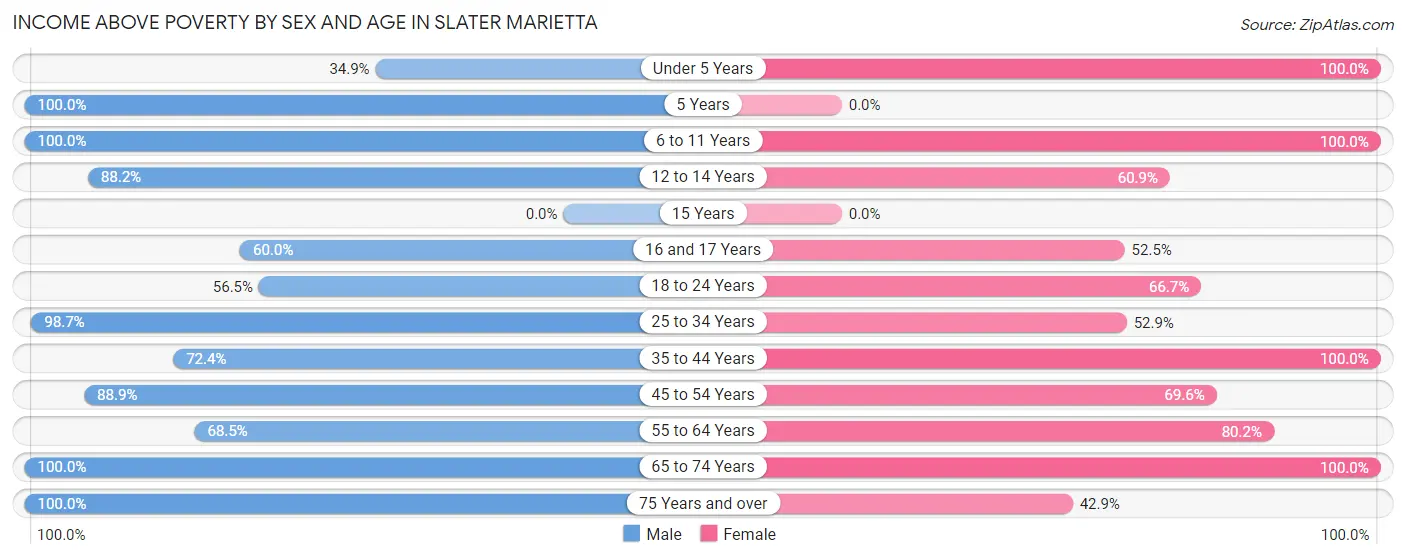
| Age Bracket | Male | Female |
| Under 5 Years | 15 (34.9%) | 8 (100.0%) |
| 5 Years | 2 (100.0%) | 0 (0.0%) |
| 6 to 11 Years | 140 (100.0%) | 54 (100.0%) |
| 12 to 14 Years | 75 (88.2%) | 14 (60.9%) |
| 15 Years | 0 (0.0%) | 0 (0.0%) |
| 16 and 17 Years | 15 (60.0%) | 21 (52.5%) |
| 18 to 24 Years | 39 (56.5%) | 40 (66.7%) |
| 25 to 34 Years | 155 (98.7%) | 55 (52.9%) |
| 35 to 44 Years | 21 (72.4%) | 51 (100.0%) |
| 45 to 54 Years | 177 (88.9%) | 224 (69.6%) |
| 55 to 64 Years | 139 (68.5%) | 97 (80.2%) |
| 65 to 74 Years | 142 (100.0%) | 145 (100.0%) |
| 75 Years and over | 33 (100.0%) | 24 (42.9%) |
| Total | 953 (84.6%) | 733 (74.5%) |
Income Below Poverty Among Married-Couple Families in Slater Marietta
The poverty statistics for married-couple families in Slater Marietta show that 2.0% or 10 of the total 501 families live below the poverty line. Families with 3 or 4 children have the highest poverty rate of 17.0%, comprising of 10 families. On the other hand, families with no children have the lowest poverty rate of 0.0%, which includes 0 families.
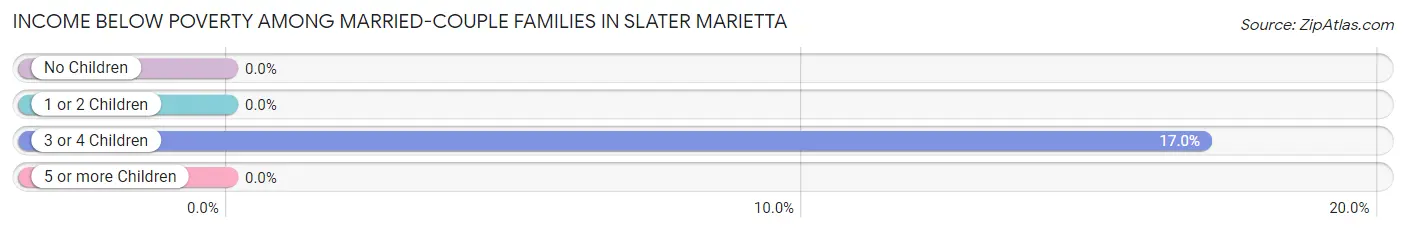
| Children | Above Poverty | Below Poverty |
| No Children | 328 (100.0%) | 0 (0.0%) |
| 1 or 2 Children | 114 (100.0%) | 0 (0.0%) |
| 3 or 4 Children | 49 (83.1%) | 10 (17.0%) |
| 5 or more Children | 0 (0.0%) | 0 (0.0%) |
| Total | 491 (98.0%) | 10 (2.0%) |
Income Below Poverty Among Single-Parent Households in Slater Marietta
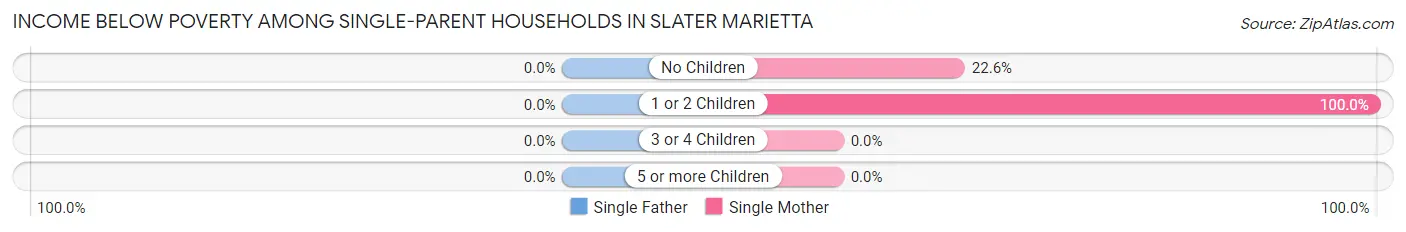
| Children | Single Father | Single Mother |
| No Children | 0 (0.0%) | 7 (22.6%) |
| 1 or 2 Children | 0 (0.0%) | 38 (100.0%) |
| 3 or 4 Children | 0 (0.0%) | 0 (0.0%) |
| 5 or more Children | 0 (0.0%) | 0 (0.0%) |
| Total | 0 (0.0%) | 45 (54.9%) |
Income Below Poverty Among Married-Couple vs Single-Parent Households in Slater Marietta
The poverty data for Slater Marietta shows that 10 of the married-couple family households (2.0%) and 45 of the single-parent households (46.4%) are living below the poverty level. Within the married-couple family households, those with 3 or 4 children have the highest poverty rate, with 10 households (17.0%) falling below the poverty line. Among the single-parent households, those with 1 or 2 children have the highest poverty rate, with 38 household (71.7%) living below poverty.
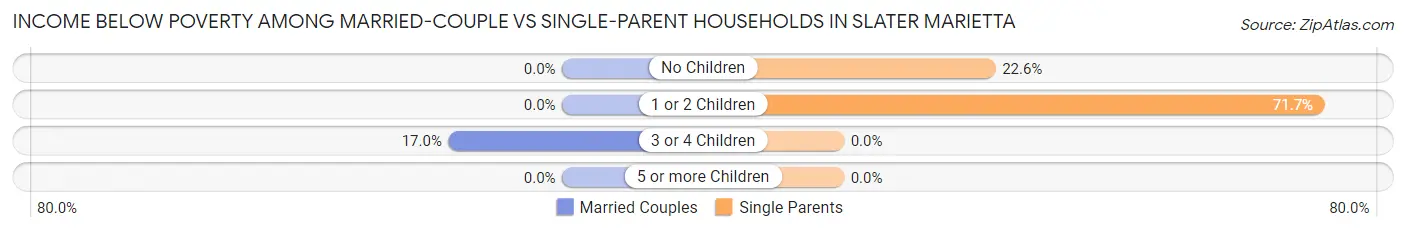
| Children | Married-Couple Families | Single-Parent Households |
| No Children | 0 (0.0%) | 7 (22.6%) |
| 1 or 2 Children | 0 (0.0%) | 38 (71.7%) |
| 3 or 4 Children | 10 (17.0%) | 0 (0.0%) |
| 5 or more Children | 0 (0.0%) | 0 (0.0%) |
| Total | 10 (2.0%) | 45 (46.4%) |
Race in Slater Marietta
The most populous races in Slater Marietta are White / Caucasian (2,081 | 94.6%), Two or more Races (74 | 3.4%), and Black / African American (34 | 1.5%).
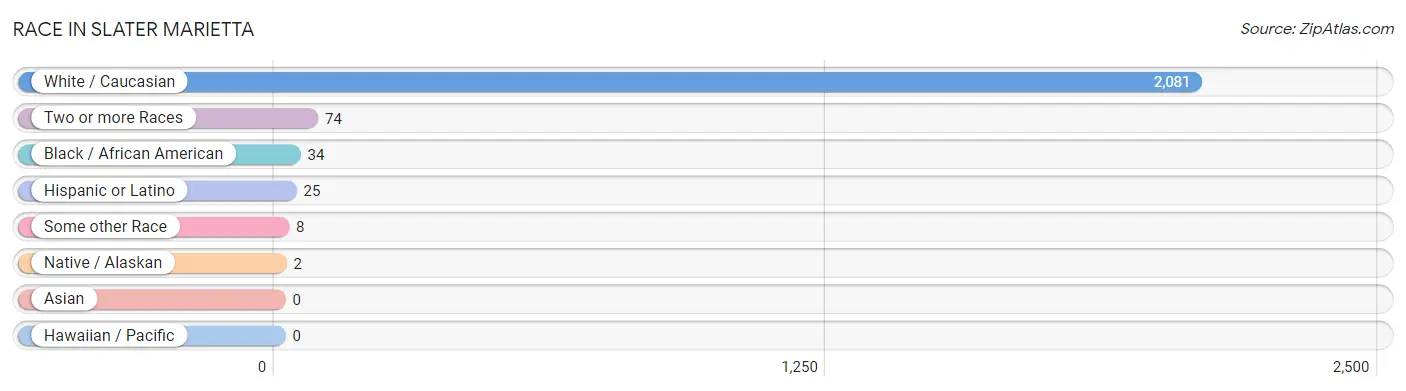
| Race | # Population | % Population |
| Asian | 0 | 0.0% |
| Black / African American | 34 | 1.5% |
| Hawaiian / Pacific | 0 | 0.0% |
| Hispanic or Latino | 25 | 1.1% |
| Native / Alaskan | 2 | 0.1% |
| White / Caucasian | 2,081 | 94.6% |
| Two or more Races | 74 | 3.4% |
| Some other Race | 8 | 0.4% |
| Total | 2,199 | 100.0% |
Ancestry in Slater Marietta
The most populous ancestries reported in Slater Marietta are American (613 | 27.9%), English (264 | 12.0%), German (147 | 6.7%), Irish (97 | 4.4%), and European (88 | 4.0%), together accounting for 55.0% of all Slater Marietta residents.
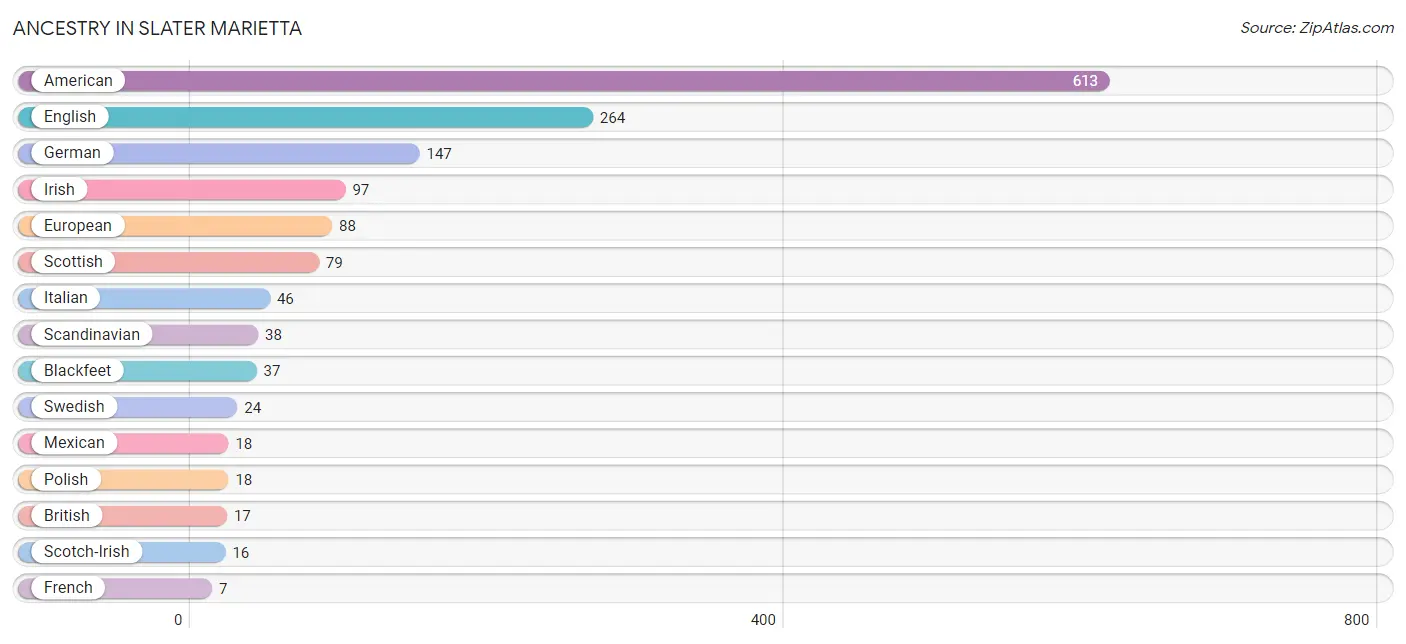
| Ancestry | # Population | % Population |
| American | 613 | 27.9% |
| Blackfeet | 37 | 1.7% |
| British | 17 | 0.8% |
| English | 264 | 12.0% |
| European | 88 | 4.0% |
| French | 7 | 0.3% |
| German | 147 | 6.7% |
| Irish | 97 | 4.4% |
| Italian | 46 | 2.1% |
| Mexican | 18 | 0.8% |
| Polish | 18 | 0.8% |
| Puerto Rican | 7 | 0.3% |
| Scandinavian | 38 | 1.7% |
| Scotch-Irish | 16 | 0.7% |
| Scottish | 79 | 3.6% |
| Swedish | 24 | 1.1% | View All 16 Rows |
Immigrants in Slater Marietta
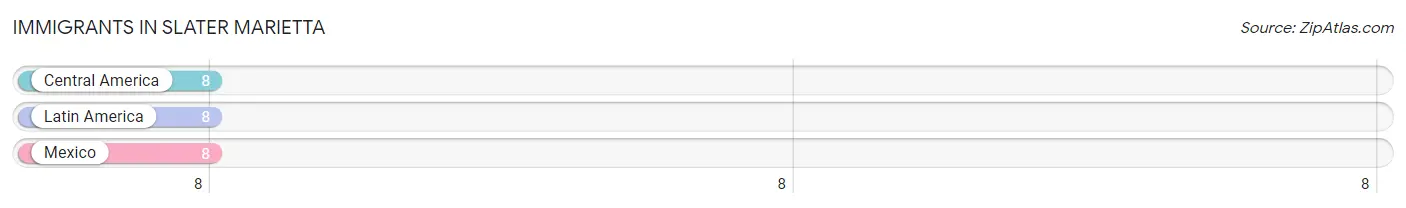
The most numerous immigrant groups reported in Slater Marietta came from Central America (8 | 0.4%), Latin America (8 | 0.4%), and Mexico (8 | 0.4%), together accounting for 1.1% of all Slater Marietta residents.
| Immigration Origin | # Population | % Population |
| Central America | 8 | 0.4% |
| Latin America | 8 | 0.4% |
| Mexico | 8 | 0.4% | View All 3 Rows |
Sex and Age in Slater Marietta
Sex and Age in Slater Marietta
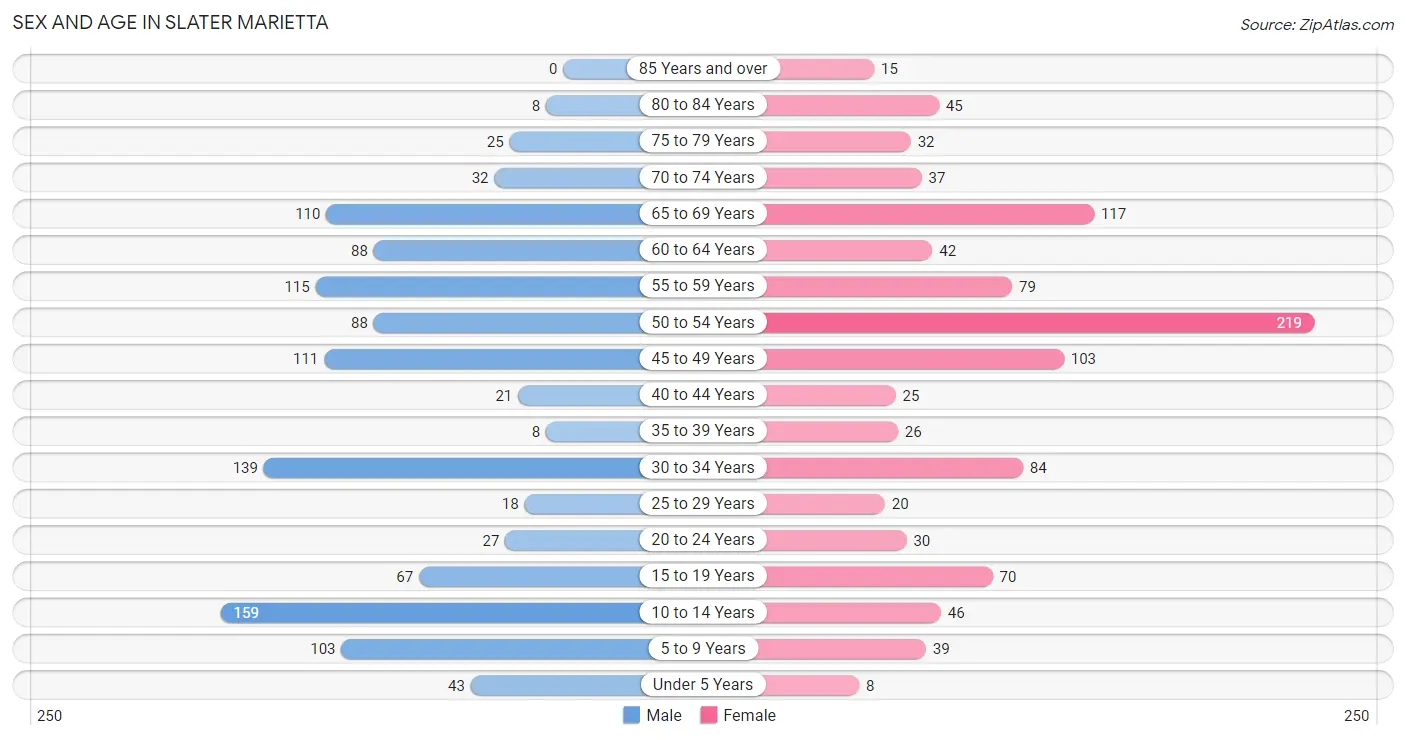
The most populous age groups in Slater Marietta are 10 to 14 Years (159 | 13.7%) for men and 50 to 54 Years (219 | 21.1%) for women.
| Age Bracket | Male | Female |
| Under 5 Years | 43 (3.7%) | 8 (0.8%) |
| 5 to 9 Years | 103 (8.9%) | 39 (3.8%) |
| 10 to 14 Years | 159 (13.7%) | 46 (4.4%) |
| 15 to 19 Years | 67 (5.8%) | 70 (6.8%) |
| 20 to 24 Years | 27 (2.3%) | 30 (2.9%) |
| 25 to 29 Years | 18 (1.5%) | 20 (1.9%) |
| 30 to 34 Years | 139 (12.0%) | 84 (8.1%) |
| 35 to 39 Years | 8 (0.7%) | 26 (2.5%) |
| 40 to 44 Years | 21 (1.8%) | 25 (2.4%) |
| 45 to 49 Years | 111 (9.6%) | 103 (9.9%) |
| 50 to 54 Years | 88 (7.6%) | 219 (21.1%) |
| 55 to 59 Years | 115 (9.9%) | 79 (7.6%) |
| 60 to 64 Years | 88 (7.6%) | 42 (4.1%) |
| 65 to 69 Years | 110 (9.5%) | 117 (11.3%) |
| 70 to 74 Years | 32 (2.8%) | 37 (3.6%) |
| 75 to 79 Years | 25 (2.1%) | 32 (3.1%) |
| 80 to 84 Years | 8 (0.7%) | 45 (4.3%) |
| 85 Years and over | 0 (0.0%) | 15 (1.5%) |
| Total | 1,162 (100.0%) | 1,037 (100.0%) |
Families and Households in Slater Marietta
Median Family Size in Slater Marietta
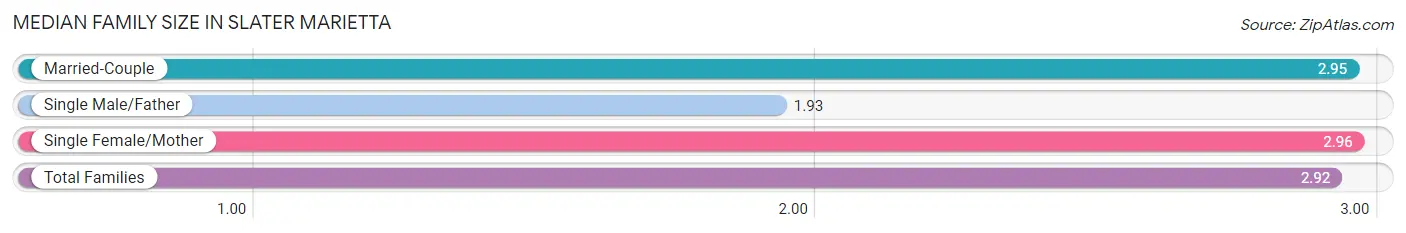
The median family size in Slater Marietta is 2.92 persons per family, with single female/mother families (82 | 13.7%) accounting for the largest median family size of 2.96 persons per family. On the other hand, single male/father families (15 | 2.5%) represent the smallest median family size with 1.93 persons per family.
| Family Type | # Families | Family Size |
| Married-Couple | 501 (83.8%) | 2.95 |
| Single Male/Father | 15 (2.5%) | 1.93 |
| Single Female/Mother | 82 (13.7%) | 2.96 |
| Total Families | 598 (100.0%) | 2.92 |
Median Household Size in Slater Marietta
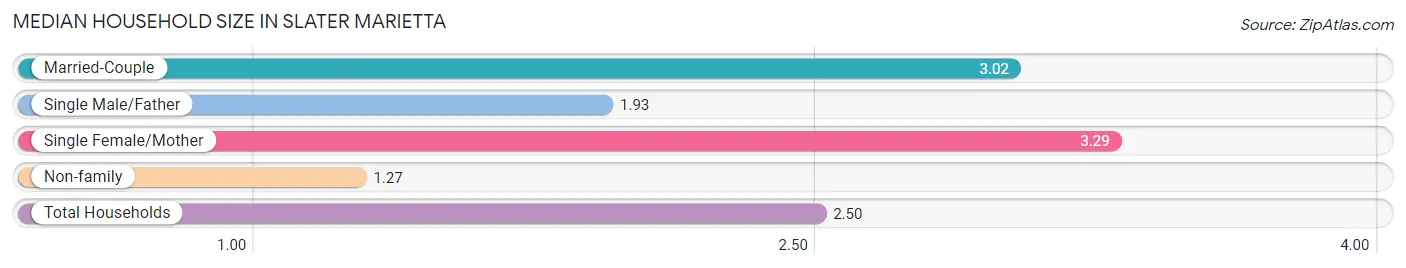
The median household size in Slater Marietta is 2.50 persons per household, with single female/mother households (82 | 9.6%) accounting for the largest median household size of 3.29 persons per household. non-family households (258 | 30.1%) represent the smallest median household size with 1.27 persons per household.
| Household Type | # Households | Household Size |
| Married-Couple | 501 (58.5%) | 3.02 |
| Single Male/Father | 15 (1.8%) | 1.93 |
| Single Female/Mother | 82 (9.6%) | 3.29 |
| Non-family | 258 (30.1%) | 1.27 |
| Total Households | 856 (100.0%) | 2.50 |
Household Size by Marriage Status in Slater Marietta
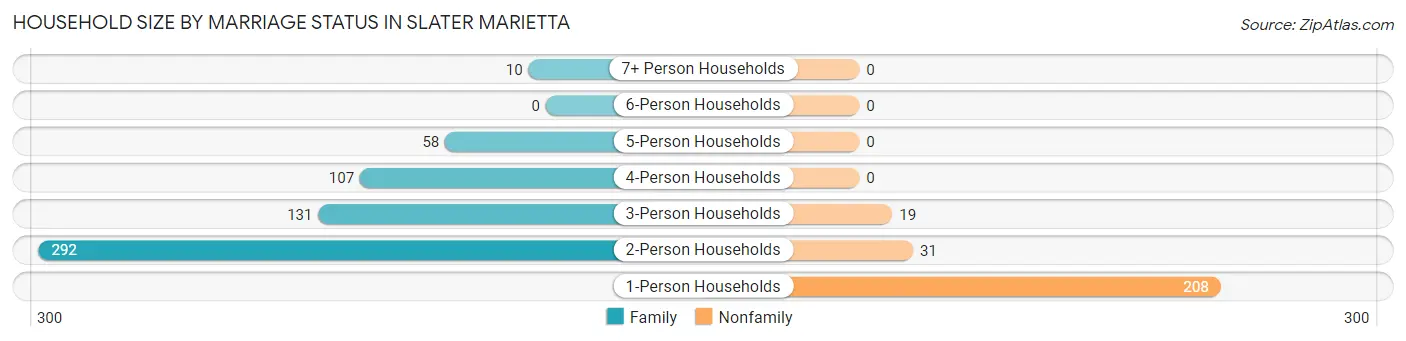
Out of a total of 856 households in Slater Marietta, 598 (69.9%) are family households, while 258 (30.1%) are nonfamily households. The most numerous type of family households are 2-person households, comprising 292, and the most common type of nonfamily households are 1-person households, comprising 208.
| Household Size | Family Households | Nonfamily Households |
| 1-Person Households | - | 208 (24.3%) |
| 2-Person Households | 292 (34.1%) | 31 (3.6%) |
| 3-Person Households | 131 (15.3%) | 19 (2.2%) |
| 4-Person Households | 107 (12.5%) | 0 (0.0%) |
| 5-Person Households | 58 (6.8%) | 0 (0.0%) |
| 6-Person Households | 0 (0.0%) | 0 (0.0%) |
| 7+ Person Households | 10 (1.2%) | 0 (0.0%) |
| Total | 598 (69.9%) | 258 (30.1%) |
Female Fertility in Slater Marietta
Fertility by Age in Slater Marietta
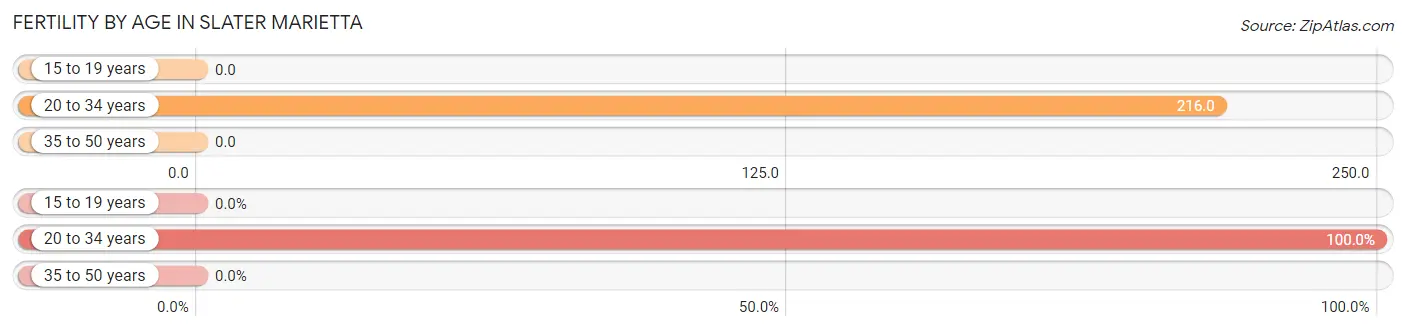
Average fertility rate in Slater Marietta is 79.0 births per 1,000 women. Women in the age bracket of 20 to 34 years have the highest fertility rate with 216.0 births per 1,000 women. Women in the age bracket of 20 to 34 years acount for 100.0% of all women with births.
| Age Bracket | Women with Births | Births / 1,000 Women |
| 15 to 19 years | 0 (0.0%) | 0.0 |
| 20 to 34 years | 29 (100.0%) | 216.0 |
| 35 to 50 years | 0 (0.0%) | 0.0 |
| Total | 29 (100.0%) | 79.0 |
Fertility by Age by Marriage Status in Slater Marietta
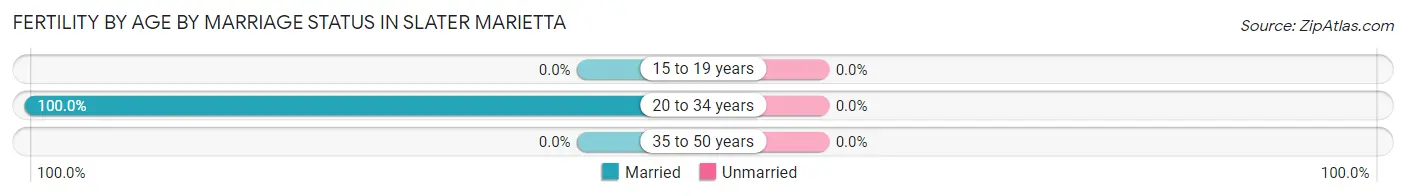
| Age Bracket | Married | Unmarried |
| 15 to 19 years | 0 (0.0%) | 0 (0.0%) |
| 20 to 34 years | 29 (100.0%) | 0 (0.0%) |
| 35 to 50 years | 0 (0.0%) | 0 (0.0%) |
| Total | 29 (100.0%) | 0 (0.0%) |
Fertility by Education in Slater Marietta
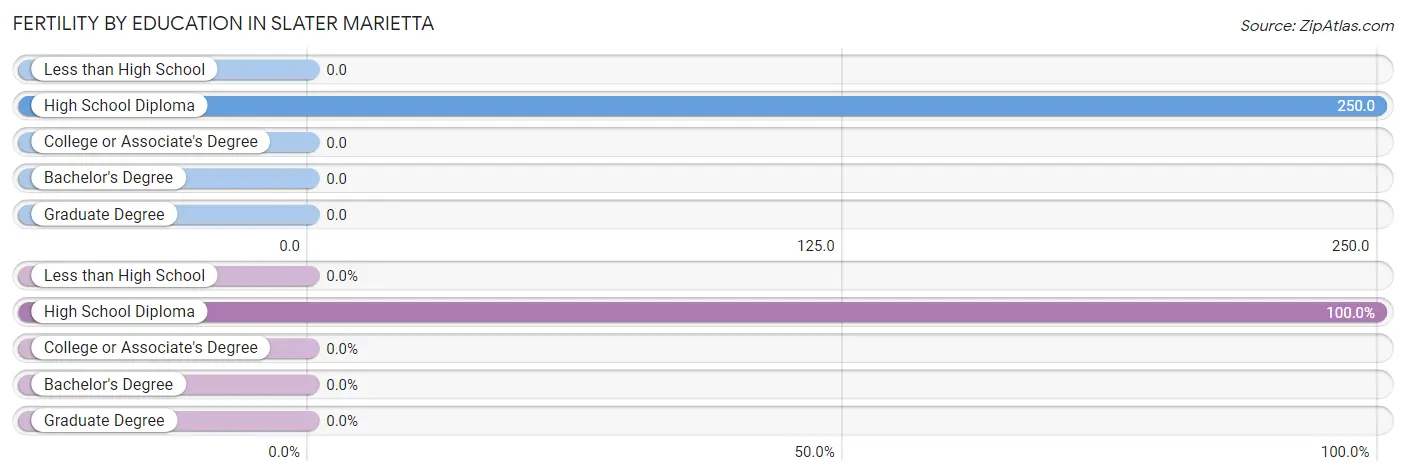
| Educational Attainment | Women with Births | Births / 1,000 Women |
| Less than High School | 0 (0.0%) | 0.0 |
| High School Diploma | 29 (100.0%) | 250.0 |
| College or Associate's Degree | 0 (0.0%) | 0.0 |
| Bachelor's Degree | 0 (0.0%) | 0.0 |
| Graduate Degree | 0 (0.0%) | 0.0 |
| Total | 29 (100.0%) | 79.0 |
Fertility by Education by Marriage Status in Slater Marietta
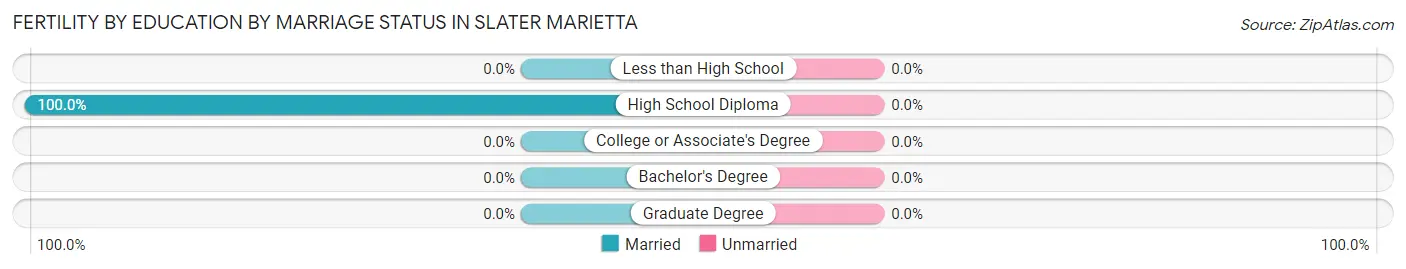
| Educational Attainment | Married | Unmarried |
| Less than High School | 0 (0.0%) | 0 (0.0%) |
| High School Diploma | 29 (100.0%) | 0 (0.0%) |
| College or Associate's Degree | 0 (0.0%) | 0 (0.0%) |
| Bachelor's Degree | 0 (0.0%) | 0 (0.0%) |
| Graduate Degree | 0 (0.0%) | 0 (0.0%) |
| Total | 29 (100.0%) | 0 (0.0%) |
Employment Characteristics in Slater Marietta
Employment by Class of Employer in Slater Marietta
Among the 962 employed individuals in Slater Marietta, private company employees (646 | 67.1%), not-for-profit organizations (131 | 13.6%), and federal government employees (73 | 7.6%) make up the most common classes of employment.
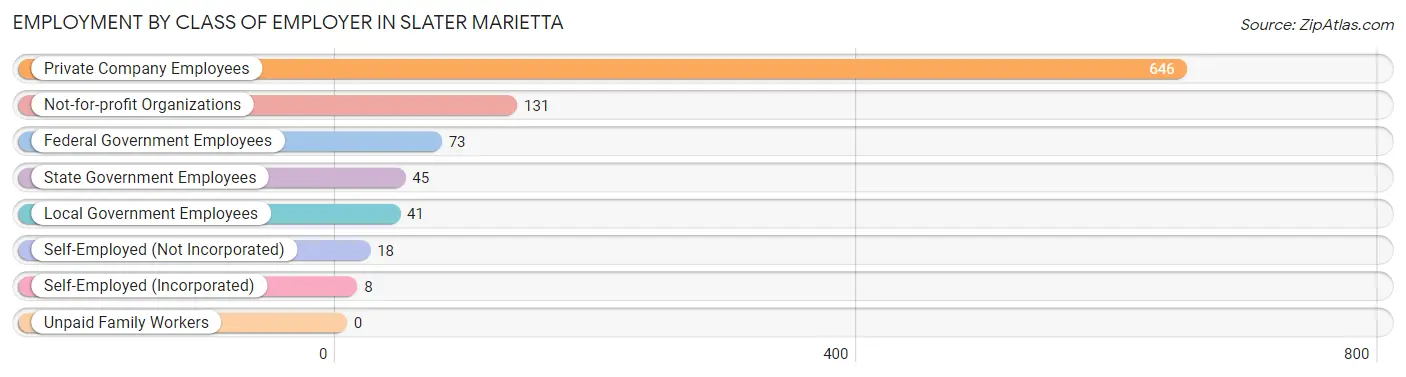
| Employer Class | # Employees | % Employees |
| Private Company Employees | 646 | 67.1% |
| Self-Employed (Incorporated) | 8 | 0.8% |
| Self-Employed (Not Incorporated) | 18 | 1.9% |
| Not-for-profit Organizations | 131 | 13.6% |
| Local Government Employees | 41 | 4.3% |
| State Government Employees | 45 | 4.7% |
| Federal Government Employees | 73 | 7.6% |
| Unpaid Family Workers | 0 | 0.0% |
| Total | 962 | 100.0% |
Employment Status by Age in Slater Marietta
According to the labor force statistics for Slater Marietta, out of the total population over 16 years of age (1,801), 56.4% or 1,016 individuals are in the labor force, with 5.5% or 56 of them unemployed. The age group with the highest labor force participation rate is 30 to 34 years, with 96.9% or 216 individuals in the labor force. Within the labor force, the 25 to 29 years age range has the highest percentage of unemployed individuals, with 30.8% or 8 of them being unemployed.
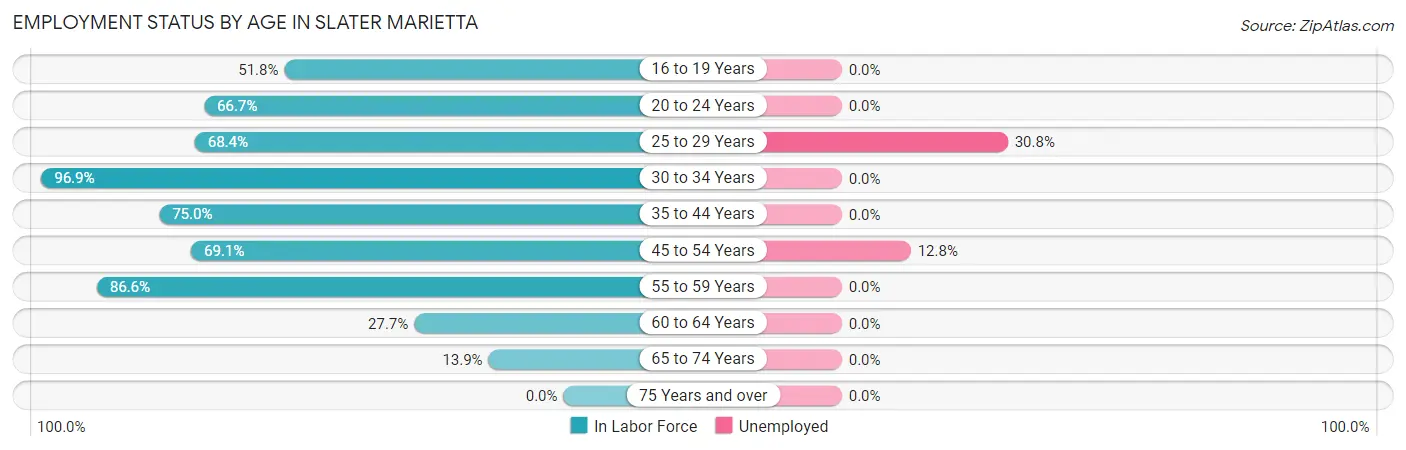
| Age Bracket | In Labor Force | Unemployed |
| 16 to 19 Years | 71 (51.8%) | 0 (0.0%) |
| 20 to 24 Years | 38 (66.7%) | 0 (0.0%) |
| 25 to 29 Years | 26 (68.4%) | 8 (30.8%) |
| 30 to 34 Years | 216 (96.9%) | 0 (0.0%) |
| 35 to 44 Years | 60 (75.0%) | 0 (0.0%) |
| 45 to 54 Years | 360 (69.1%) | 46 (12.8%) |
| 55 to 59 Years | 168 (86.6%) | 0 (0.0%) |
| 60 to 64 Years | 36 (27.7%) | 0 (0.0%) |
| 65 to 74 Years | 41 (13.9%) | 0 (0.0%) |
| 75 Years and over | 0 (0.0%) | 0 (0.0%) |
| Total | 1,016 (56.4%) | 56 (5.5%) |
Employment Status by Educational Attainment in Slater Marietta
According to labor force statistics for Slater Marietta, 73.0% of individuals (866) out of the total population between 25 and 64 years of age (1,186) are in the labor force, with 6.4% or 55 of them being unemployed. The group with the highest labor force participation rate are those with the educational attainment of high school diploma, with 91.9% or 352 individuals in the labor force. Within the labor force, individuals with college / associate degree education have the highest percentage of unemployment, with 13.7% or 44 of them being unemployed.
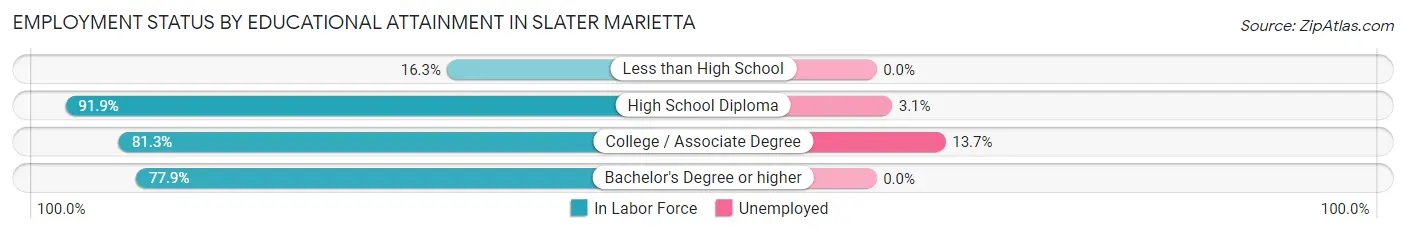
| Educational Attainment | In Labor Force | Unemployed |
| Less than High School | 33 (16.3%) | 0 (0.0%) |
| High School Diploma | 352 (91.9%) | 12 (3.1%) |
| College / Associate Degree | 322 (81.3%) | 54 (13.7%) |
| Bachelor's Degree or higher | 159 (77.9%) | 0 (0.0%) |
| Total | 866 (73.0%) | 76 (6.4%) |
Employment Occupations by Sex in Slater Marietta
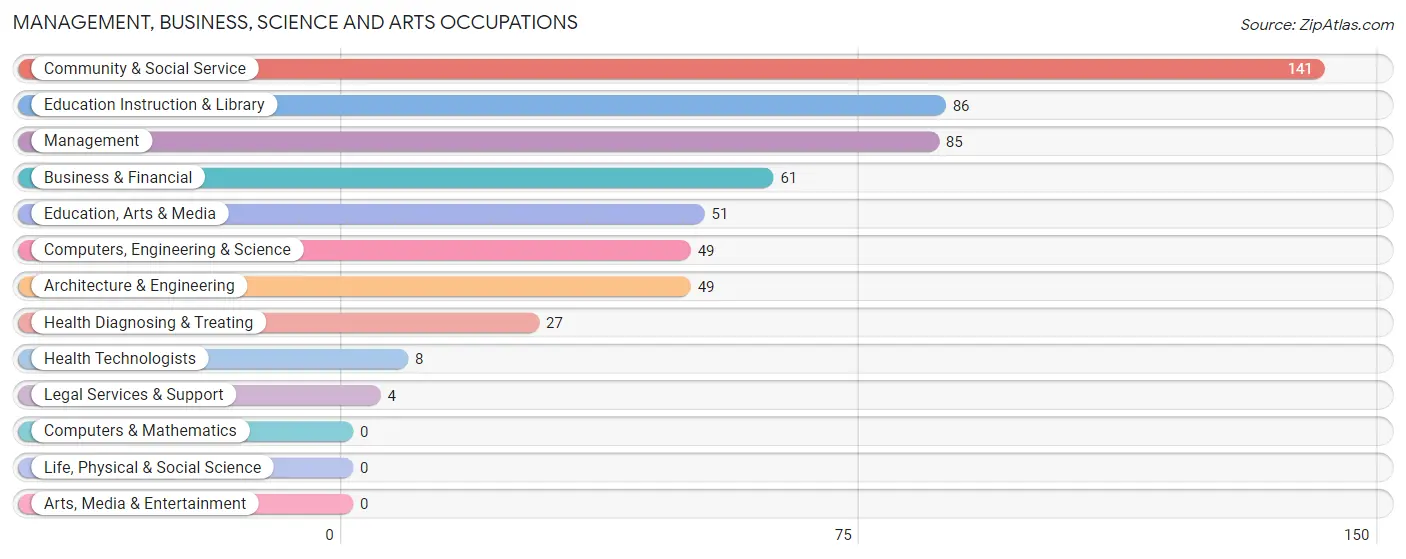
Management, Business, Science and Arts Occupations
The most common Management, Business, Science and Arts occupations in Slater Marietta are Community & Social Service (141 | 15.1%), Education Instruction & Library (86 | 9.2%), Management (85 | 9.1%), Business & Financial (61 | 6.5%), and Education, Arts & Media (51 | 5.4%).
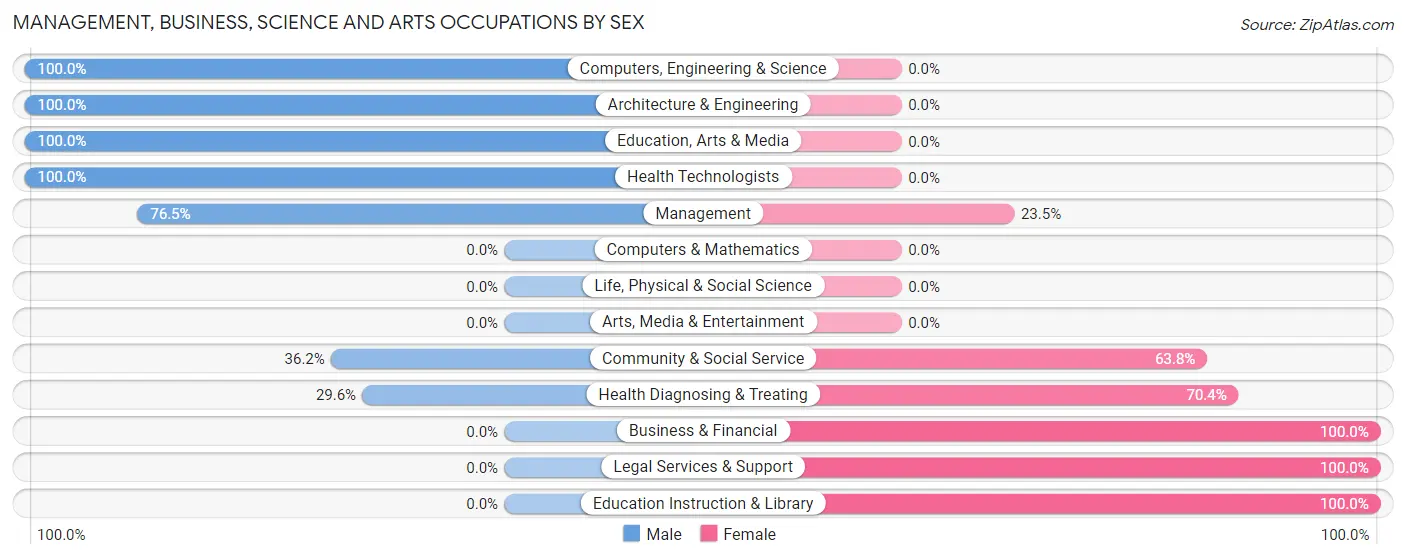
Management, Business, Science and Arts Occupations by Sex
Within the Management, Business, Science and Arts occupations in Slater Marietta, the most male-oriented occupations are Computers, Engineering & Science (100.0%), Architecture & Engineering (100.0%), and Education, Arts & Media (100.0%), while the most female-oriented occupations are Business & Financial (100.0%), Legal Services & Support (100.0%), and Education Instruction & Library (100.0%).
| Occupation | Male | Female |
| Management | 65 (76.5%) | 20 (23.5%) |
| Business & Financial | 0 (0.0%) | 61 (100.0%) |
| Computers, Engineering & Science | 49 (100.0%) | 0 (0.0%) |
| Computers & Mathematics | 0 (0.0%) | 0 (0.0%) |
| Architecture & Engineering | 49 (100.0%) | 0 (0.0%) |
| Life, Physical & Social Science | 0 (0.0%) | 0 (0.0%) |
| Community & Social Service | 51 (36.2%) | 90 (63.8%) |
| Education, Arts & Media | 51 (100.0%) | 0 (0.0%) |
| Legal Services & Support | 0 (0.0%) | 4 (100.0%) |
| Education Instruction & Library | 0 (0.0%) | 86 (100.0%) |
| Arts, Media & Entertainment | 0 (0.0%) | 0 (0.0%) |
| Health Diagnosing & Treating | 8 (29.6%) | 19 (70.4%) |
| Health Technologists | 8 (100.0%) | 0 (0.0%) |
| Total (Category) | 173 (47.7%) | 190 (52.3%) |
| Total (Overall) | 507 (54.2%) | 429 (45.8%) |
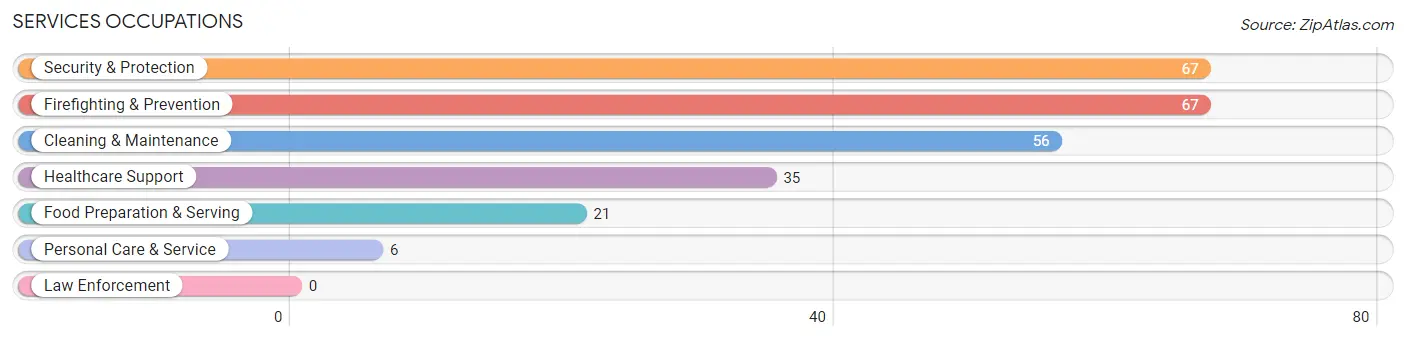
Services Occupations
The most common Services occupations in Slater Marietta are Security & Protection (67 | 7.2%), Firefighting & Prevention (67 | 7.2%), Cleaning & Maintenance (56 | 6.0%), Healthcare Support (35 | 3.7%), and Food Preparation & Serving (21 | 2.2%).
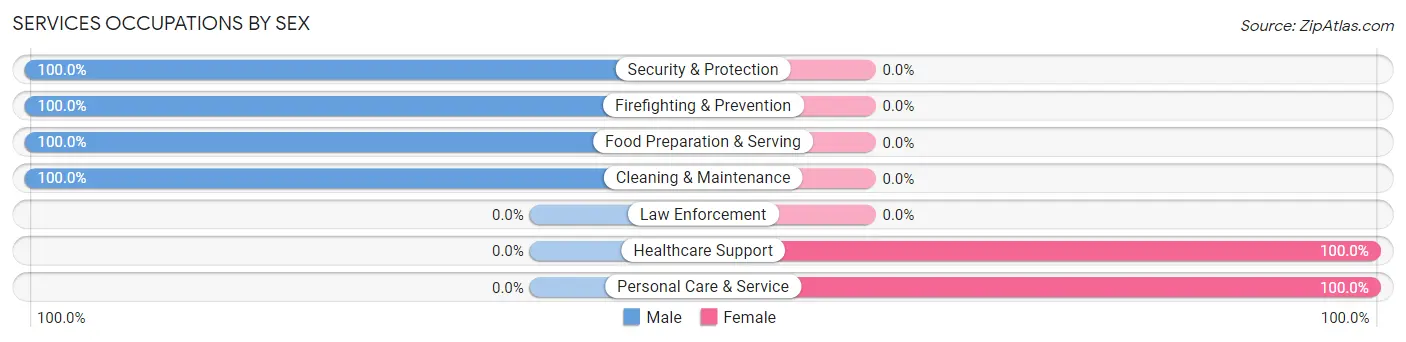
Services Occupations by Sex
Within the Services occupations in Slater Marietta, the most male-oriented occupations are Security & Protection (100.0%), Firefighting & Prevention (100.0%), and Food Preparation & Serving (100.0%), while the most female-oriented occupations are Healthcare Support (100.0%), and Personal Care & Service (100.0%).
| Occupation | Male | Female |
| Healthcare Support | 0 (0.0%) | 35 (100.0%) |
| Security & Protection | 67 (100.0%) | 0 (0.0%) |
| Firefighting & Prevention | 67 (100.0%) | 0 (0.0%) |
| Law Enforcement | 0 (0.0%) | 0 (0.0%) |
| Food Preparation & Serving | 21 (100.0%) | 0 (0.0%) |
| Cleaning & Maintenance | 56 (100.0%) | 0 (0.0%) |
| Personal Care & Service | 0 (0.0%) | 6 (100.0%) |
| Total (Category) | 144 (77.8%) | 41 (22.2%) |
| Total (Overall) | 507 (54.2%) | 429 (45.8%) |
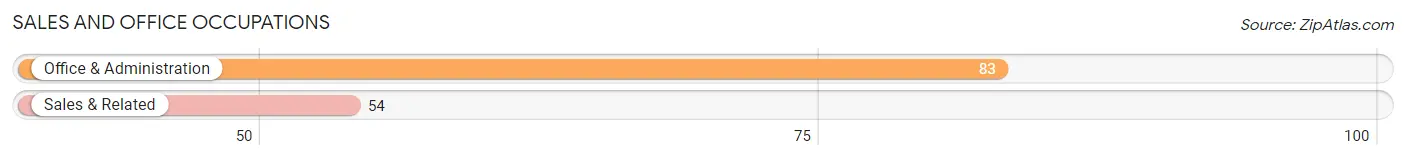
Sales and Office Occupations
The most common Sales and Office occupations in Slater Marietta are Office & Administration (83 | 8.9%), and Sales & Related (54 | 5.8%).
Sales and Office Occupations by Sex
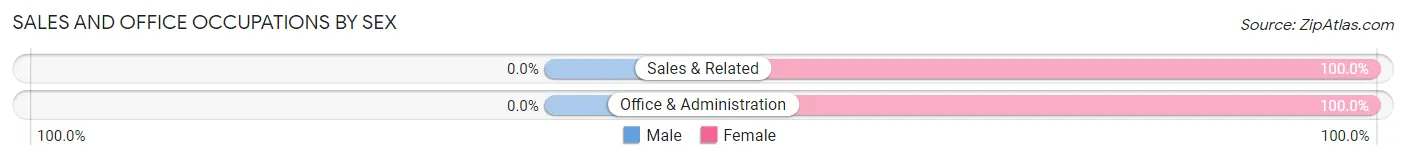
| Occupation | Male | Female |
| Sales & Related | 0 (0.0%) | 54 (100.0%) |
| Office & Administration | 0 (0.0%) | 83 (100.0%) |
| Total (Category) | 0 (0.0%) | 137 (100.0%) |
| Total (Overall) | 507 (54.2%) | 429 (45.8%) |
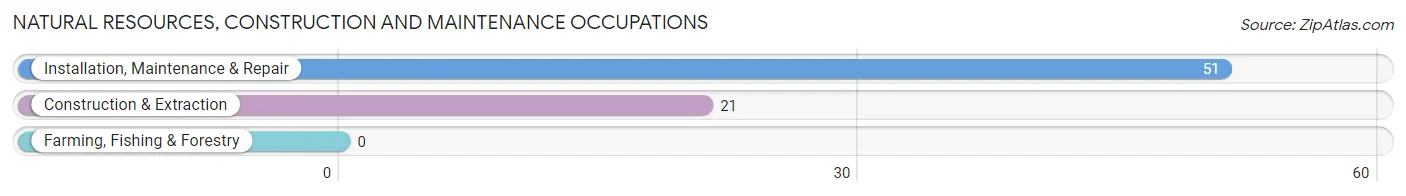
Natural Resources, Construction and Maintenance Occupations
The most common Natural Resources, Construction and Maintenance occupations in Slater Marietta are Installation, Maintenance & Repair (51 | 5.4%), and Construction & Extraction (21 | 2.2%).
Natural Resources, Construction and Maintenance Occupations by Sex
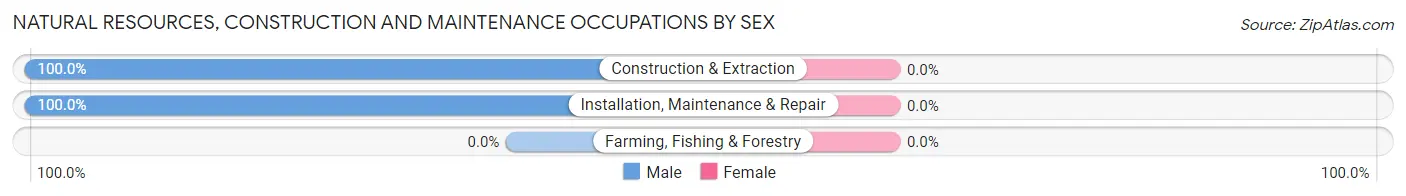
| Occupation | Male | Female |
| Farming, Fishing & Forestry | 0 (0.0%) | 0 (0.0%) |
| Construction & Extraction | 21 (100.0%) | 0 (0.0%) |
| Installation, Maintenance & Repair | 51 (100.0%) | 0 (0.0%) |
| Total (Category) | 72 (100.0%) | 0 (0.0%) |
| Total (Overall) | 507 (54.2%) | 429 (45.8%) |
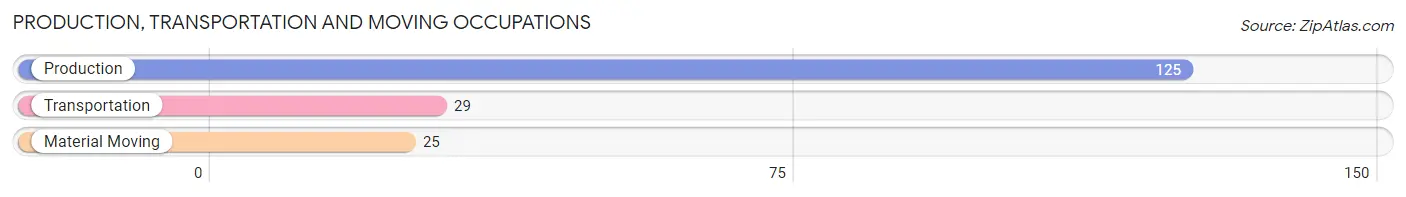
Production, Transportation and Moving Occupations
The most common Production, Transportation and Moving occupations in Slater Marietta are Production (125 | 13.4%), Transportation (29 | 3.1%), and Material Moving (25 | 2.7%).
Production, Transportation and Moving Occupations by Sex
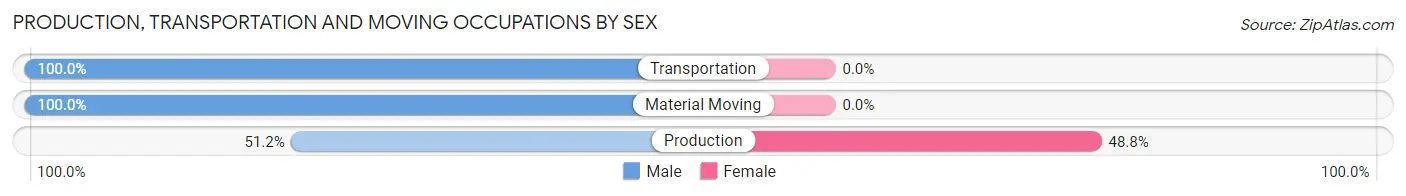
| Occupation | Male | Female |
| Production | 64 (51.2%) | 61 (48.8%) |
| Transportation | 29 (100.0%) | 0 (0.0%) |
| Material Moving | 25 (100.0%) | 0 (0.0%) |
| Total (Category) | 118 (65.9%) | 61 (34.1%) |
| Total (Overall) | 507 (54.2%) | 429 (45.8%) |
Employment Industries by Sex in Slater Marietta
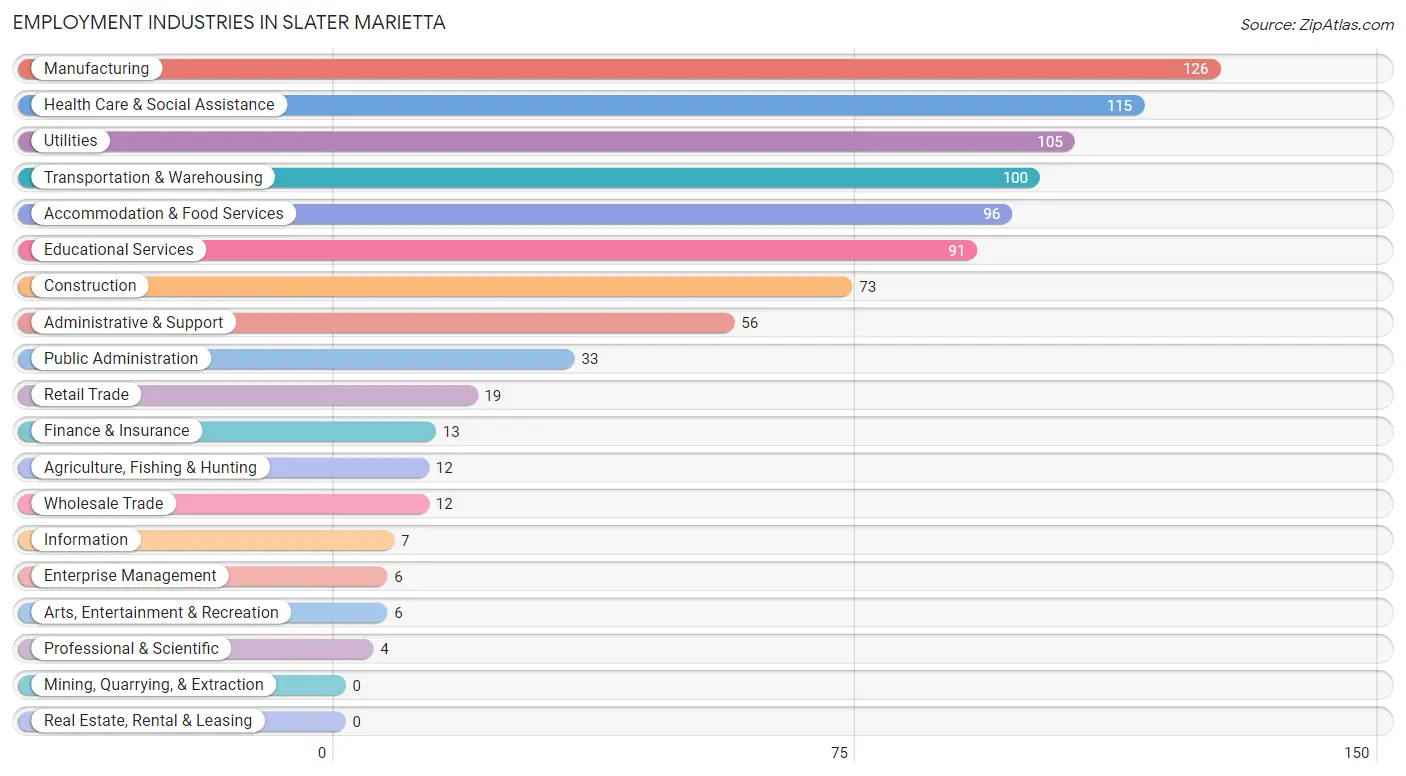
Employment Industries in Slater Marietta
The major employment industries in Slater Marietta include Manufacturing (126 | 13.5%), Health Care & Social Assistance (115 | 12.3%), Utilities (105 | 11.2%), Transportation & Warehousing (100 | 10.7%), and Accommodation & Food Services (96 | 10.3%).
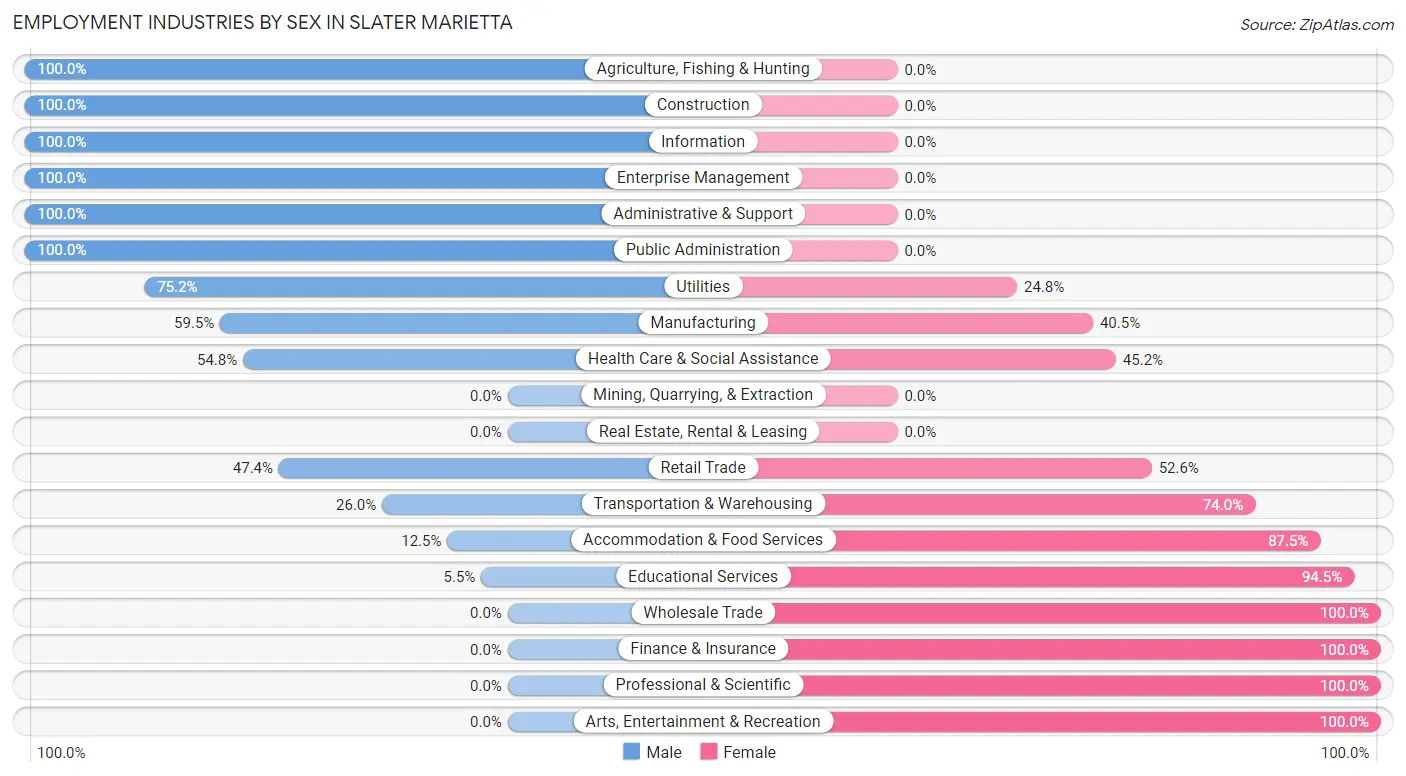
Employment Industries by Sex in Slater Marietta
The Slater Marietta industries that see more men than women are Agriculture, Fishing & Hunting (100.0%), Construction (100.0%), and Information (100.0%), whereas the industries that tend to have a higher number of women are Wholesale Trade (100.0%), Finance & Insurance (100.0%), and Professional & Scientific (100.0%).
| Industry | Male | Female |
| Agriculture, Fishing & Hunting | 12 (100.0%) | 0 (0.0%) |
| Mining, Quarrying, & Extraction | 0 (0.0%) | 0 (0.0%) |
| Construction | 73 (100.0%) | 0 (0.0%) |
| Manufacturing | 75 (59.5%) | 51 (40.5%) |
| Wholesale Trade | 0 (0.0%) | 12 (100.0%) |
| Retail Trade | 9 (47.4%) | 10 (52.6%) |
| Transportation & Warehousing | 26 (26.0%) | 74 (74.0%) |
| Utilities | 79 (75.2%) | 26 (24.8%) |
| Information | 7 (100.0%) | 0 (0.0%) |
| Finance & Insurance | 0 (0.0%) | 13 (100.0%) |
| Real Estate, Rental & Leasing | 0 (0.0%) | 0 (0.0%) |
| Professional & Scientific | 0 (0.0%) | 4 (100.0%) |
| Enterprise Management | 6 (100.0%) | 0 (0.0%) |
| Administrative & Support | 56 (100.0%) | 0 (0.0%) |
| Educational Services | 5 (5.5%) | 86 (94.5%) |
| Health Care & Social Assistance | 63 (54.8%) | 52 (45.2%) |
| Arts, Entertainment & Recreation | 0 (0.0%) | 6 (100.0%) |
| Accommodation & Food Services | 12 (12.5%) | 84 (87.5%) |
| Public Administration | 33 (100.0%) | 0 (0.0%) |
| Total | 507 (54.2%) | 429 (45.8%) |
Education in Slater Marietta
School Enrollment in Slater Marietta
The most common levels of schooling among the 529 students in Slater Marietta are middle school (182 | 34.4%), elementary school (163 | 30.8%), and high school (86 | 16.3%).
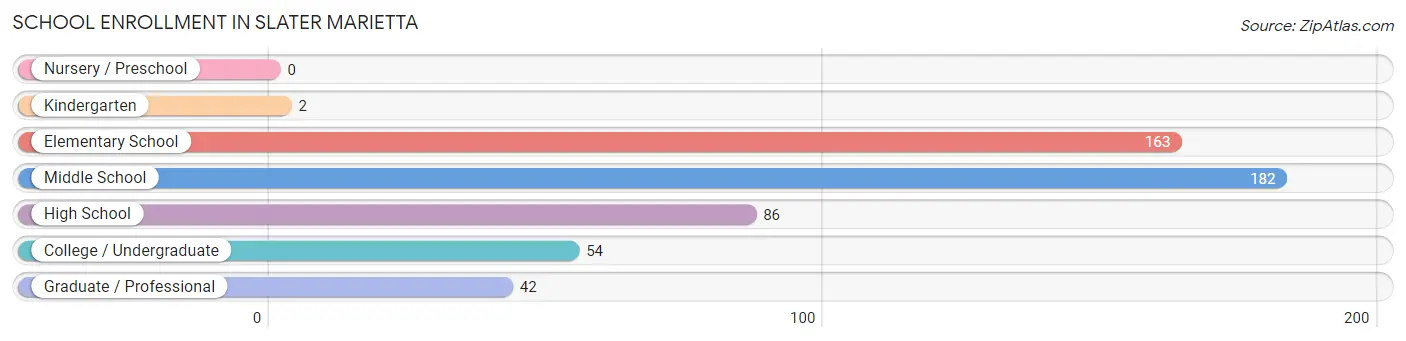
| School Level | # Students | % Students |
| Nursery / Preschool | 0 | 0.0% |
| Kindergarten | 2 | 0.4% |
| Elementary School | 163 | 30.8% |
| Middle School | 182 | 34.4% |
| High School | 86 | 16.3% |
| College / Undergraduate | 54 | 10.2% |
| Graduate / Professional | 42 | 7.9% |
| Total | 529 | 100.0% |
School Enrollment by Age by Funding Source in Slater Marietta
Out of a total of 529 students who are enrolled in schools in Slater Marietta, 110 (20.8%) attend a private institution, while the remaining 419 (79.2%) are enrolled in public schools. The age group of 25 to 34 year olds has the highest likelihood of being enrolled in private schools, with 48 (100.0% in the age bracket) enrolled. Conversely, the age group of 5 to 9 year old has the lowest likelihood of being enrolled in a private school, with 142 (100.0% in the age bracket) attending a public institution.
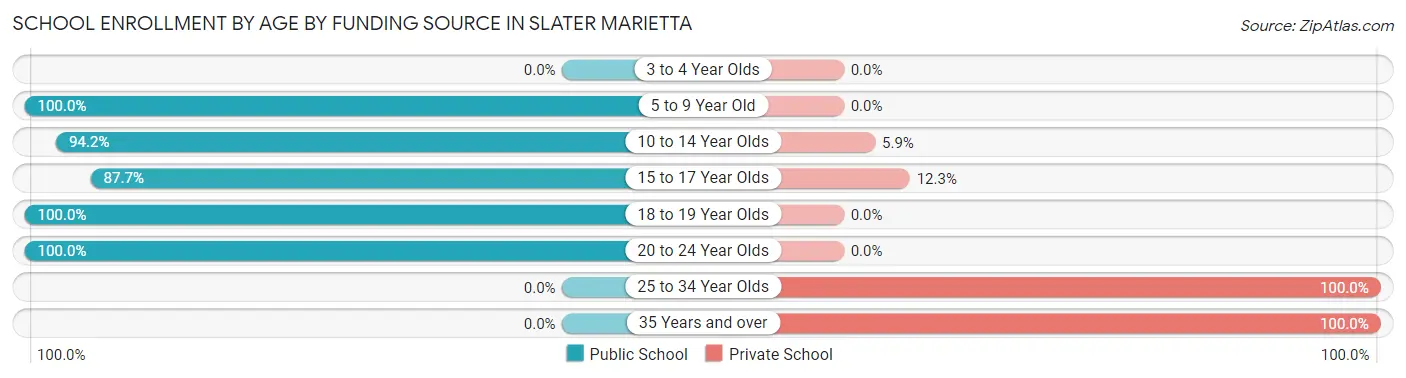
| Age Bracket | Public School | Private School |
| 3 to 4 Year Olds | 0 (0.0%) | 0 (0.0%) |
| 5 to 9 Year Old | 142 (100.0%) | 0 (0.0%) |
| 10 to 14 Year Olds | 193 (94.2%) | 12 (5.9%) |
| 15 to 17 Year Olds | 57 (87.7%) | 8 (12.3%) |
| 18 to 19 Year Olds | 21 (100.0%) | 0 (0.0%) |
| 20 to 24 Year Olds | 6 (100.0%) | 0 (0.0%) |
| 25 to 34 Year Olds | 0 (0.0%) | 48 (100.0%) |
| 35 Years and over | 0 (0.0%) | 42 (100.0%) |
| Total | 419 (79.2%) | 110 (20.8%) |
Educational Attainment by Field of Study in Slater Marietta
Education (85 | 27.2%), business (69 | 22.0%), liberal arts & history (49 | 15.7%), science & technology (37 | 11.8%), and physical & health sciences (26 | 8.3%) are the most common fields of study among 313 individuals in Slater Marietta who have obtained a bachelor's degree or higher.
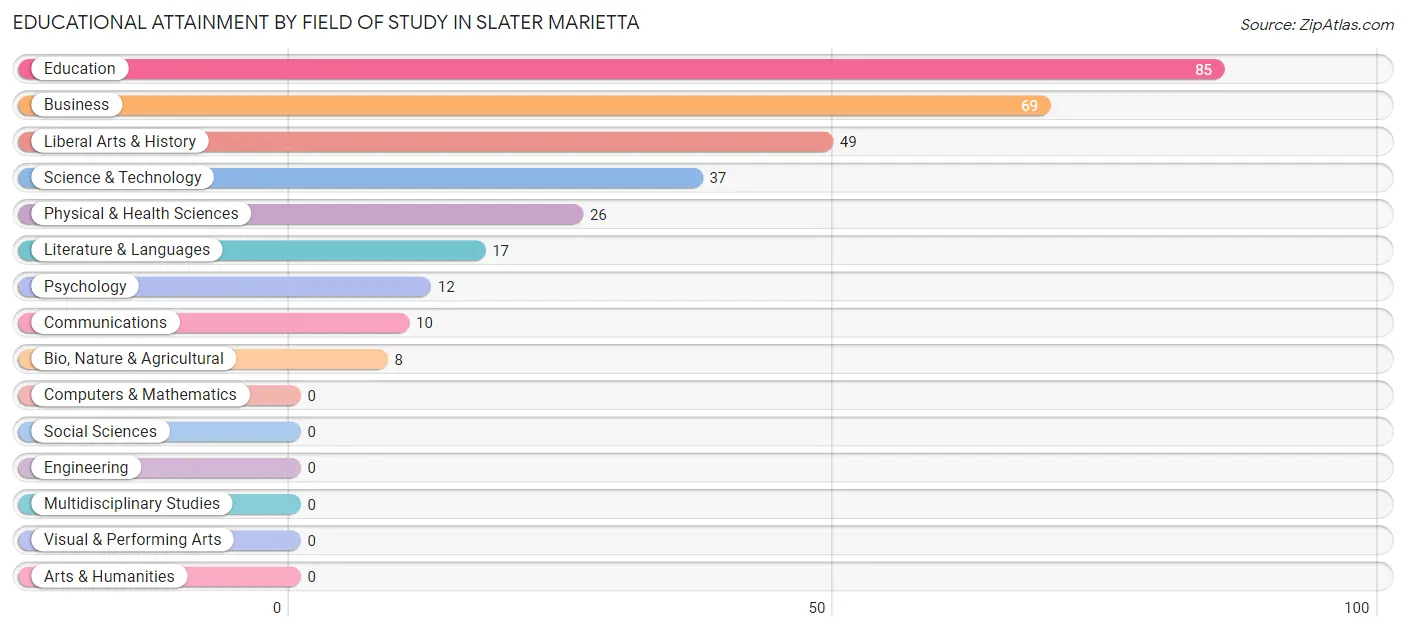
| Field of Study | # Graduates | % Graduates |
| Computers & Mathematics | 0 | 0.0% |
| Bio, Nature & Agricultural | 8 | 2.6% |
| Physical & Health Sciences | 26 | 8.3% |
| Psychology | 12 | 3.8% |
| Social Sciences | 0 | 0.0% |
| Engineering | 0 | 0.0% |
| Multidisciplinary Studies | 0 | 0.0% |
| Science & Technology | 37 | 11.8% |
| Business | 69 | 22.0% |
| Education | 85 | 27.2% |
| Literature & Languages | 17 | 5.4% |
| Liberal Arts & History | 49 | 15.7% |
| Visual & Performing Arts | 0 | 0.0% |
| Communications | 10 | 3.2% |
| Arts & Humanities | 0 | 0.0% |
| Total | 313 | 100.0% |
Transportation & Commute in Slater Marietta
Vehicle Availability by Sex in Slater Marietta
The most prevalent vehicle ownership categories in Slater Marietta are males with 3 vehicles (295, accounting for 56.2%) and females with 3 vehicles (167, making up 68.8%).
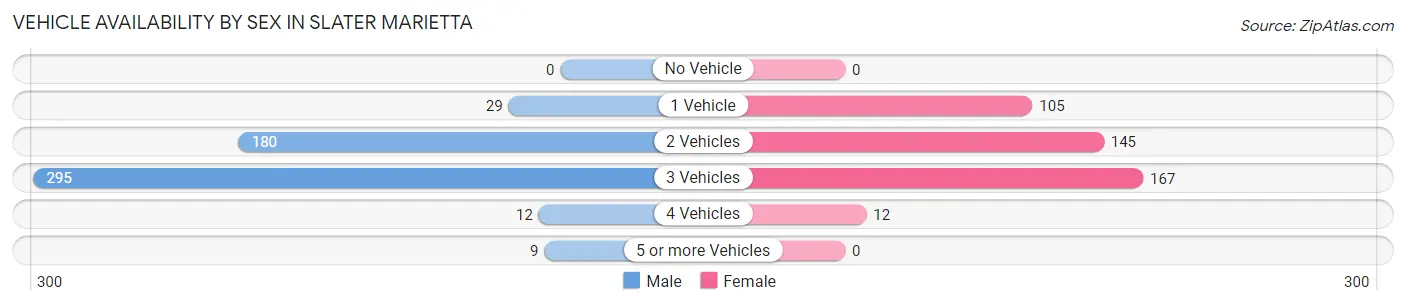
| Vehicles Available | Male | Female |
| No Vehicle | 0 (0.0%) | 0 (0.0%) |
| 1 Vehicle | 29 (5.5%) | 105 (24.5%) |
| 2 Vehicles | 180 (34.3%) | 145 (33.8%) |
| 3 Vehicles | 295 (56.2%) | 167 (38.9%) |
| 4 Vehicles | 12 (2.3%) | 12 (2.8%) |
| 5 or more Vehicles | 9 (1.7%) | 0 (0.0%) |
| Total | 525 (100.0%) | 429 (100.0%) |
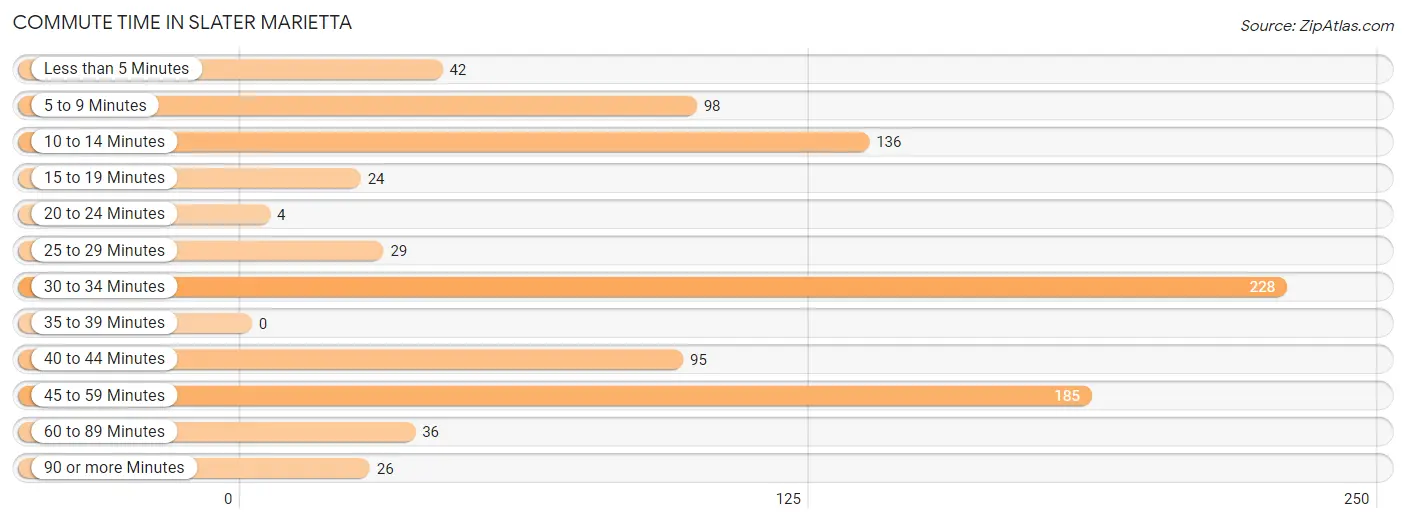
Commute Time in Slater Marietta
The most frequently occuring commute durations in Slater Marietta are 30 to 34 minutes (228 commuters, 25.3%), 45 to 59 minutes (185 commuters, 20.5%), and 10 to 14 minutes (136 commuters, 15.1%).
| Commute Time | # Commuters | % Commuters |
| Less than 5 Minutes | 42 | 4.6% |
| 5 to 9 Minutes | 98 | 10.8% |
| 10 to 14 Minutes | 136 | 15.1% |
| 15 to 19 Minutes | 24 | 2.7% |
| 20 to 24 Minutes | 4 | 0.4% |
| 25 to 29 Minutes | 29 | 3.2% |
| 30 to 34 Minutes | 228 | 25.3% |
| 35 to 39 Minutes | 0 | 0.0% |
| 40 to 44 Minutes | 95 | 10.5% |
| 45 to 59 Minutes | 185 | 20.5% |
| 60 to 89 Minutes | 36 | 4.0% |
| 90 or more Minutes | 26 | 2.9% |
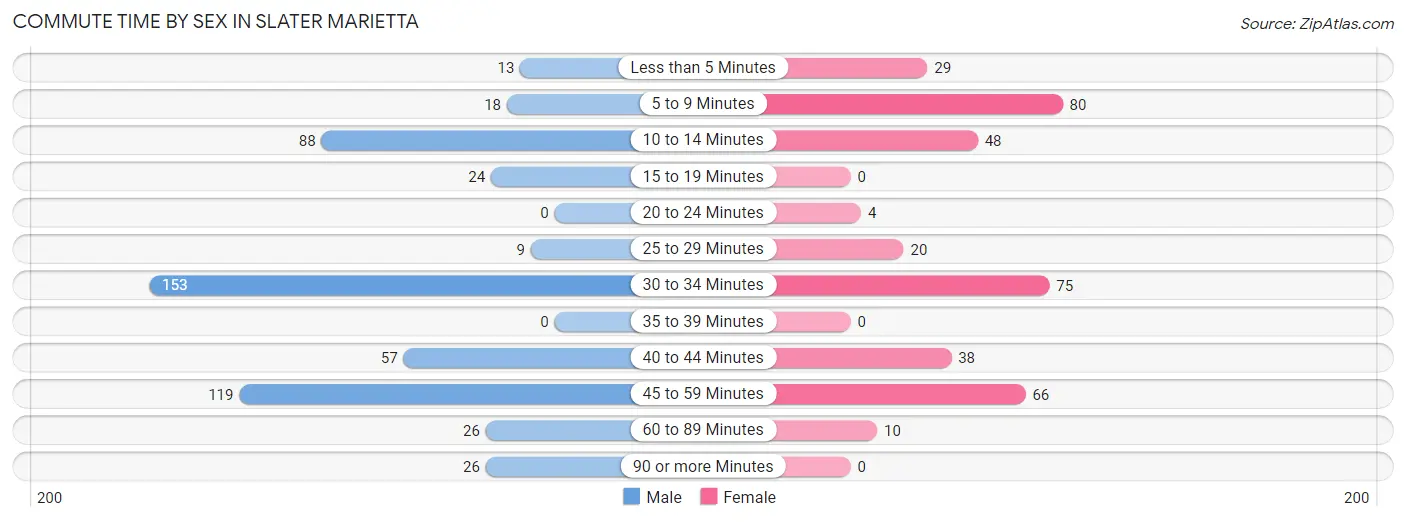
Commute Time by Sex in Slater Marietta
The most common commute times in Slater Marietta are 30 to 34 minutes (153 commuters, 28.7%) for males and 5 to 9 minutes (80 commuters, 21.6%) for females.
| Commute Time | Male | Female |
| Less than 5 Minutes | 13 (2.4%) | 29 (7.8%) |
| 5 to 9 Minutes | 18 (3.4%) | 80 (21.6%) |
| 10 to 14 Minutes | 88 (16.5%) | 48 (13.0%) |
| 15 to 19 Minutes | 24 (4.5%) | 0 (0.0%) |
| 20 to 24 Minutes | 0 (0.0%) | 4 (1.1%) |
| 25 to 29 Minutes | 9 (1.7%) | 20 (5.4%) |
| 30 to 34 Minutes | 153 (28.7%) | 75 (20.3%) |
| 35 to 39 Minutes | 0 (0.0%) | 0 (0.0%) |
| 40 to 44 Minutes | 57 (10.7%) | 38 (10.3%) |
| 45 to 59 Minutes | 119 (22.3%) | 66 (17.8%) |
| 60 to 89 Minutes | 26 (4.9%) | 10 (2.7%) |
| 90 or more Minutes | 26 (4.9%) | 0 (0.0%) |
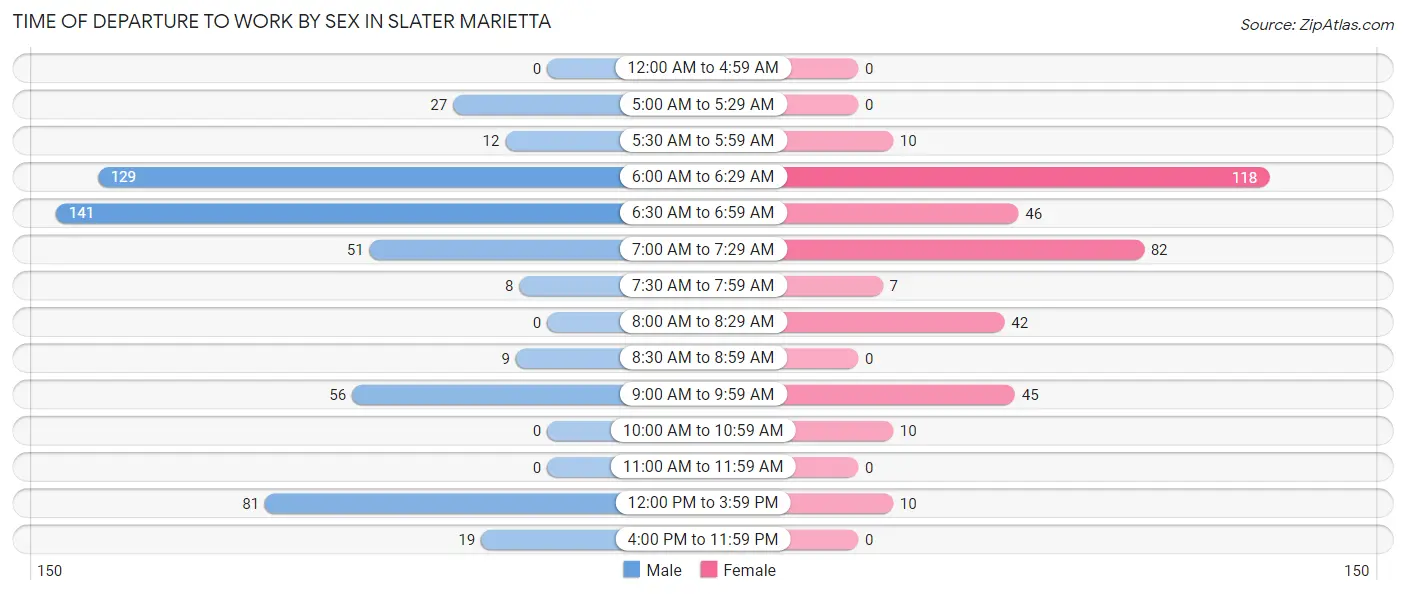
Time of Departure to Work by Sex in Slater Marietta
The most frequent times of departure to work in Slater Marietta are 6:30 AM to 6:59 AM (141, 26.5%) for males and 6:00 AM to 6:29 AM (118, 31.9%) for females.
| Time of Departure | Male | Female |
| 12:00 AM to 4:59 AM | 0 (0.0%) | 0 (0.0%) |
| 5:00 AM to 5:29 AM | 27 (5.1%) | 0 (0.0%) |
| 5:30 AM to 5:59 AM | 12 (2.2%) | 10 (2.7%) |
| 6:00 AM to 6:29 AM | 129 (24.2%) | 118 (31.9%) |
| 6:30 AM to 6:59 AM | 141 (26.5%) | 46 (12.4%) |
| 7:00 AM to 7:29 AM | 51 (9.6%) | 82 (22.2%) |
| 7:30 AM to 7:59 AM | 8 (1.5%) | 7 (1.9%) |
| 8:00 AM to 8:29 AM | 0 (0.0%) | 42 (11.4%) |
| 8:30 AM to 8:59 AM | 9 (1.7%) | 0 (0.0%) |
| 9:00 AM to 9:59 AM | 56 (10.5%) | 45 (12.2%) |
| 10:00 AM to 10:59 AM | 0 (0.0%) | 10 (2.7%) |
| 11:00 AM to 11:59 AM | 0 (0.0%) | 0 (0.0%) |
| 12:00 PM to 3:59 PM | 81 (15.2%) | 10 (2.7%) |
| 4:00 PM to 11:59 PM | 19 (3.6%) | 0 (0.0%) |
| Total | 533 (100.0%) | 370 (100.0%) |
Housing Occupancy in Slater Marietta
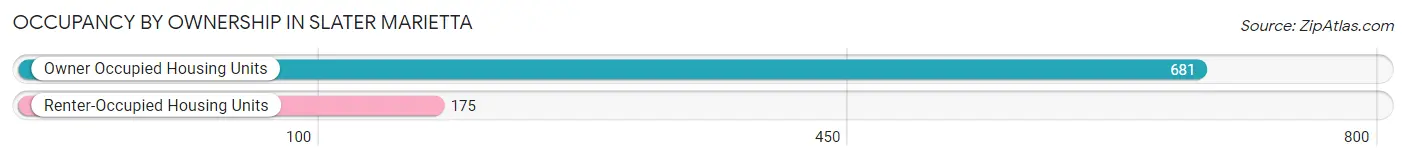
Occupancy by Ownership in Slater Marietta
Of the total 856 dwellings in Slater Marietta, owner-occupied units account for 681 (79.6%), while renter-occupied units make up 175 (20.4%).
| Occupancy | # Housing Units | % Housing Units |
| Owner Occupied Housing Units | 681 | 79.6% |
| Renter-Occupied Housing Units | 175 | 20.4% |
| Total Occupied Housing Units | 856 | 100.0% |
Occupancy by Household Size in Slater Marietta
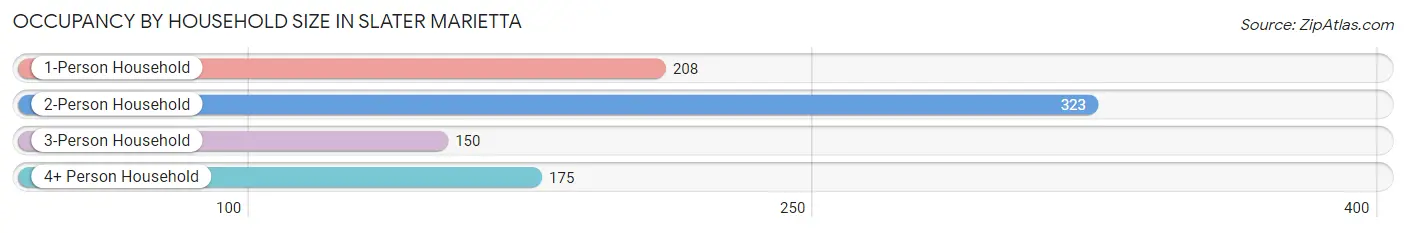
| Household Size | # Housing Units | % Housing Units |
| 1-Person Household | 208 | 24.3% |
| 2-Person Household | 323 | 37.7% |
| 3-Person Household | 150 | 17.5% |
| 4+ Person Household | 175 | 20.4% |
| Total Housing Units | 856 | 100.0% |
Occupancy by Ownership by Household Size in Slater Marietta
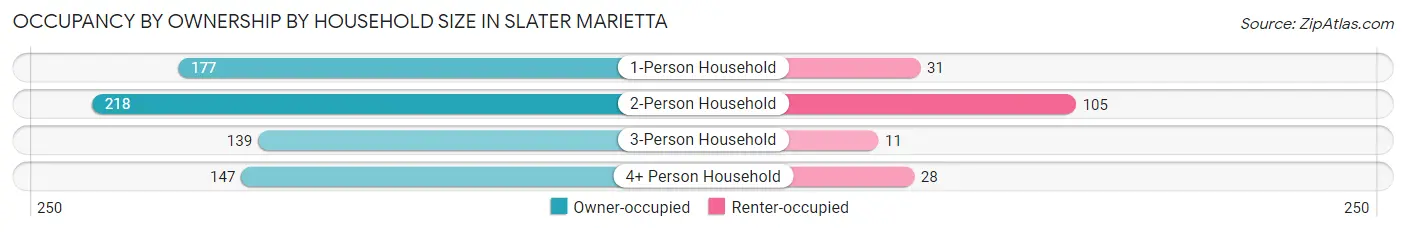
| Household Size | Owner-occupied | Renter-occupied |
| 1-Person Household | 177 (85.1%) | 31 (14.9%) |
| 2-Person Household | 218 (67.5%) | 105 (32.5%) |
| 3-Person Household | 139 (92.7%) | 11 (7.3%) |
| 4+ Person Household | 147 (84.0%) | 28 (16.0%) |
| Total Housing Units | 681 (79.6%) | 175 (20.4%) |
Occupancy by Educational Attainment in Slater Marietta
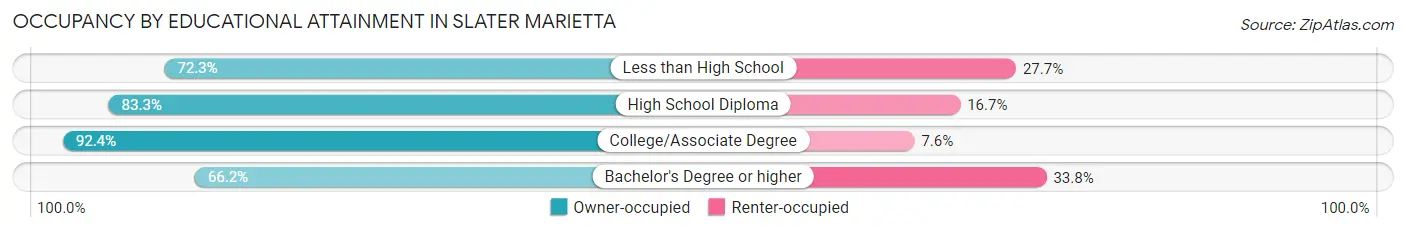
| Household Size | Owner-occupied | Renter-occupied |
| Less than High School | 133 (72.3%) | 51 (27.7%) |
| High School Diploma | 300 (83.3%) | 60 (16.7%) |
| College/Associate Degree | 146 (92.4%) | 12 (7.6%) |
| Bachelor's Degree or higher | 102 (66.2%) | 52 (33.8%) |
Occupancy by Age of Householder in Slater Marietta
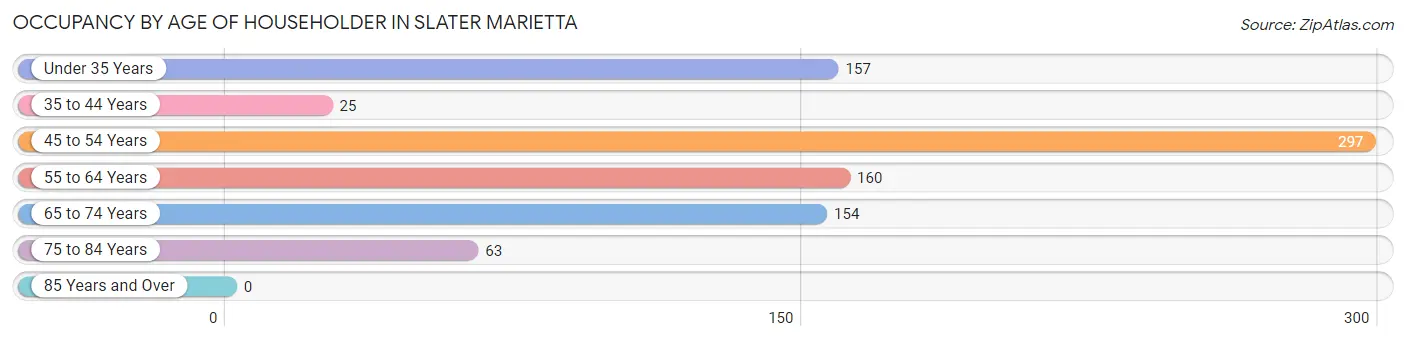
| Age Bracket | # Households | % Households |
| Under 35 Years | 157 | 18.3% |
| 35 to 44 Years | 25 | 2.9% |
| 45 to 54 Years | 297 | 34.7% |
| 55 to 64 Years | 160 | 18.7% |
| 65 to 74 Years | 154 | 18.0% |
| 75 to 84 Years | 63 | 7.4% |
| 85 Years and Over | 0 | 0.0% |
| Total | 856 | 100.0% |
Housing Finances in Slater Marietta
Median Income by Occupancy in Slater Marietta
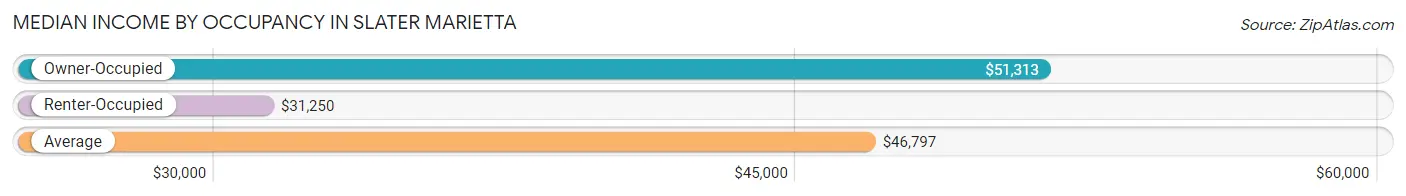
| Occupancy Type | # Households | Median Income |
| Owner-Occupied | 681 (79.6%) | $51,313 |
| Renter-Occupied | 175 (20.4%) | $31,250 |
| Average | 856 (100.0%) | $46,797 |
Occupancy by Householder Income Bracket in Slater Marietta
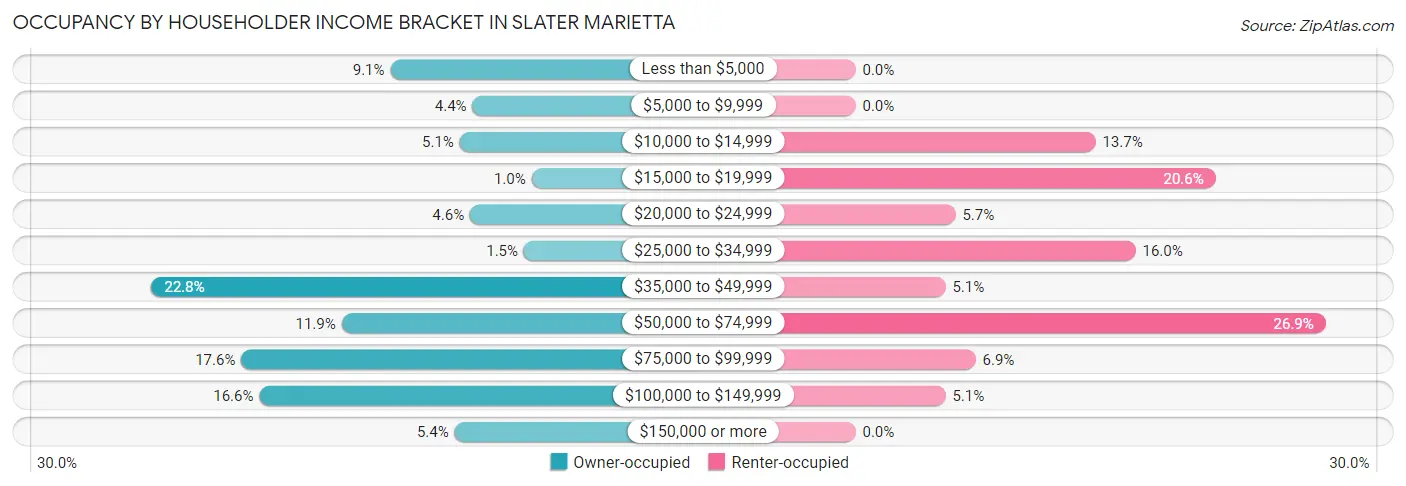
| Income Bracket | Owner-occupied | Renter-occupied |
| Less than $5,000 | 62 (9.1%) | 0 (0.0%) |
| $5,000 to $9,999 | 30 (4.4%) | 0 (0.0%) |
| $10,000 to $14,999 | 35 (5.1%) | 24 (13.7%) |
| $15,000 to $19,999 | 7 (1.0%) | 36 (20.6%) |
| $20,000 to $24,999 | 31 (4.5%) | 10 (5.7%) |
| $25,000 to $34,999 | 10 (1.5%) | 28 (16.0%) |
| $35,000 to $49,999 | 155 (22.8%) | 9 (5.1%) |
| $50,000 to $74,999 | 81 (11.9%) | 47 (26.9%) |
| $75,000 to $99,999 | 120 (17.6%) | 12 (6.9%) |
| $100,000 to $149,999 | 113 (16.6%) | 9 (5.1%) |
| $150,000 or more | 37 (5.4%) | 0 (0.0%) |
| Total | 681 (100.0%) | 175 (100.0%) |
Monthly Housing Cost Tiers in Slater Marietta
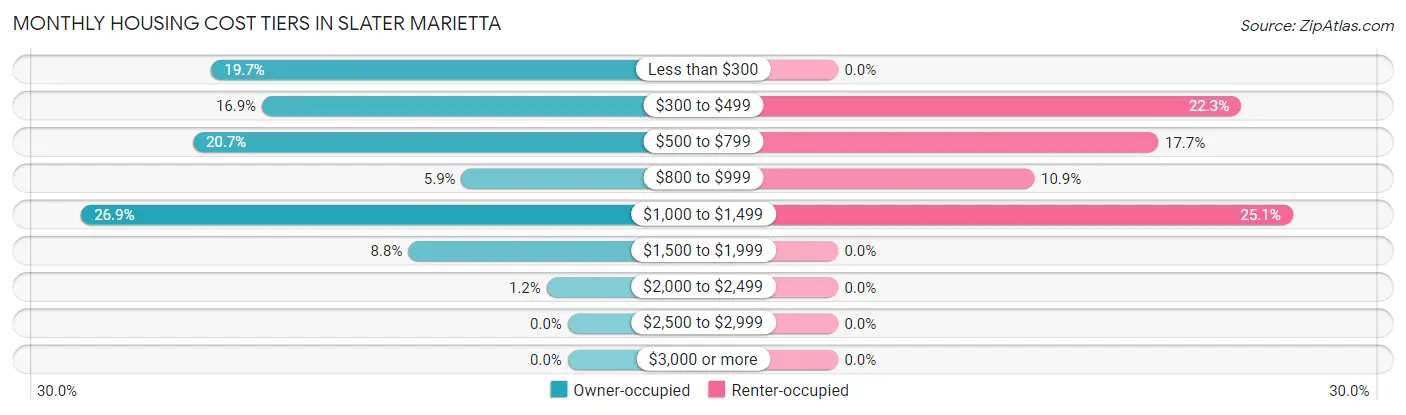
| Monthly Cost | Owner-occupied | Renter-occupied |
| Less than $300 | 134 (19.7%) | 0 (0.0%) |
| $300 to $499 | 115 (16.9%) | 39 (22.3%) |
| $500 to $799 | 141 (20.7%) | 31 (17.7%) |
| $800 to $999 | 40 (5.9%) | 19 (10.9%) |
| $1,000 to $1,499 | 183 (26.9%) | 44 (25.1%) |
| $1,500 to $1,999 | 60 (8.8%) | 0 (0.0%) |
| $2,000 to $2,499 | 8 (1.2%) | 0 (0.0%) |
| $2,500 to $2,999 | 0 (0.0%) | 0 (0.0%) |
| $3,000 or more | 0 (0.0%) | 0 (0.0%) |
| Total | 681 (100.0%) | 175 (100.0%) |
Physical Housing Characteristics in Slater Marietta
Housing Structures in Slater Marietta
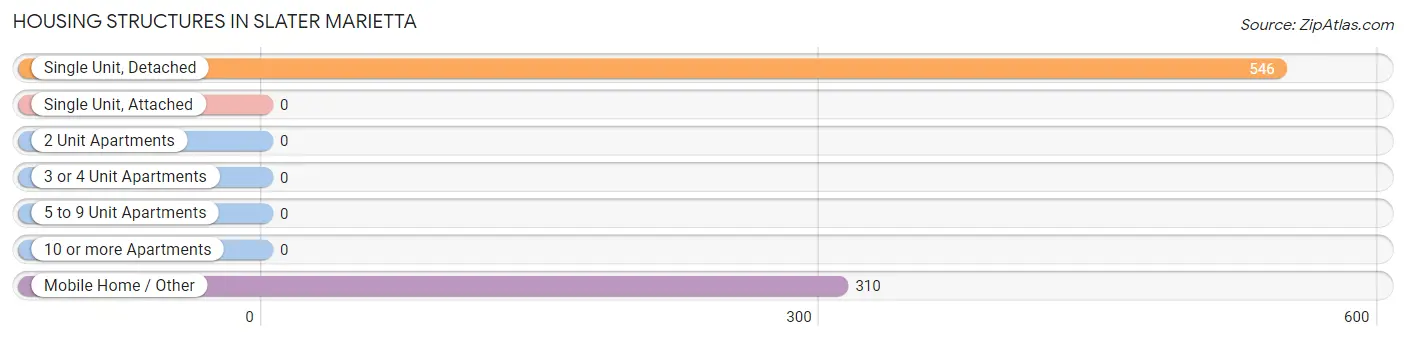
| Structure Type | # Housing Units | % Housing Units |
| Single Unit, Detached | 546 | 63.8% |
| Single Unit, Attached | 0 | 0.0% |
| 2 Unit Apartments | 0 | 0.0% |
| 3 or 4 Unit Apartments | 0 | 0.0% |
| 5 to 9 Unit Apartments | 0 | 0.0% |
| 10 or more Apartments | 0 | 0.0% |
| Mobile Home / Other | 310 | 36.2% |
| Total | 856 | 100.0% |
Housing Structures by Occupancy in Slater Marietta
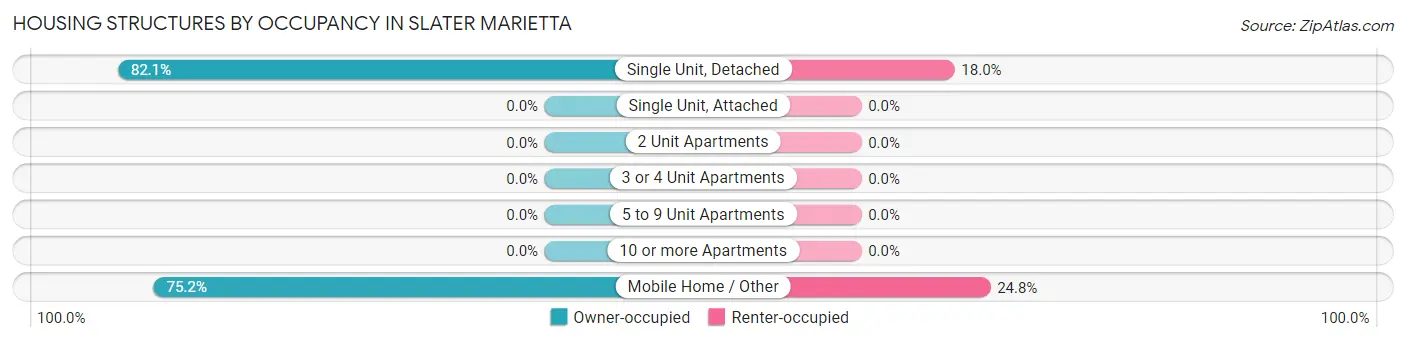
| Structure Type | Owner-occupied | Renter-occupied |
| Single Unit, Detached | 448 (82.1%) | 98 (17.9%) |
| Single Unit, Attached | 0 (0.0%) | 0 (0.0%) |
| 2 Unit Apartments | 0 (0.0%) | 0 (0.0%) |
| 3 or 4 Unit Apartments | 0 (0.0%) | 0 (0.0%) |
| 5 to 9 Unit Apartments | 0 (0.0%) | 0 (0.0%) |
| 10 or more Apartments | 0 (0.0%) | 0 (0.0%) |
| Mobile Home / Other | 233 (75.2%) | 77 (24.8%) |
| Total | 681 (79.6%) | 175 (20.4%) |
Housing Structures by Number of Rooms in Slater Marietta
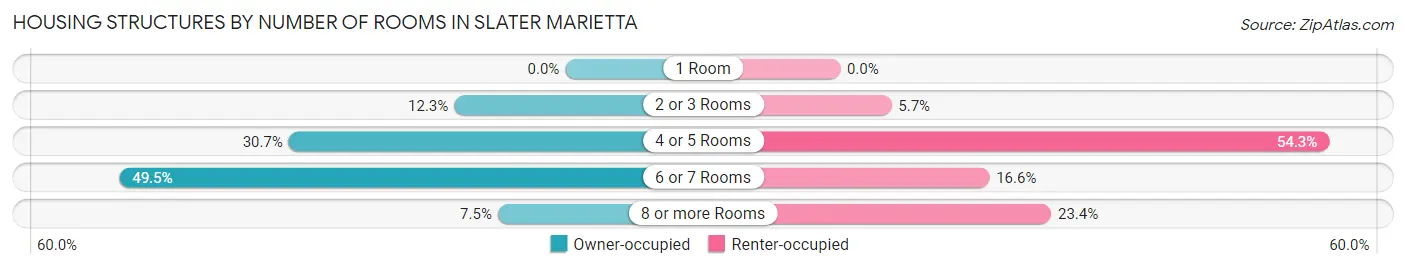
| Number of Rooms | Owner-occupied | Renter-occupied |
| 1 Room | 0 (0.0%) | 0 (0.0%) |
| 2 or 3 Rooms | 84 (12.3%) | 10 (5.7%) |
| 4 or 5 Rooms | 209 (30.7%) | 95 (54.3%) |
| 6 or 7 Rooms | 337 (49.5%) | 29 (16.6%) |
| 8 or more Rooms | 51 (7.5%) | 41 (23.4%) |
| Total | 681 (100.0%) | 175 (100.0%) |
Housing Structure by Heating Type in Slater Marietta
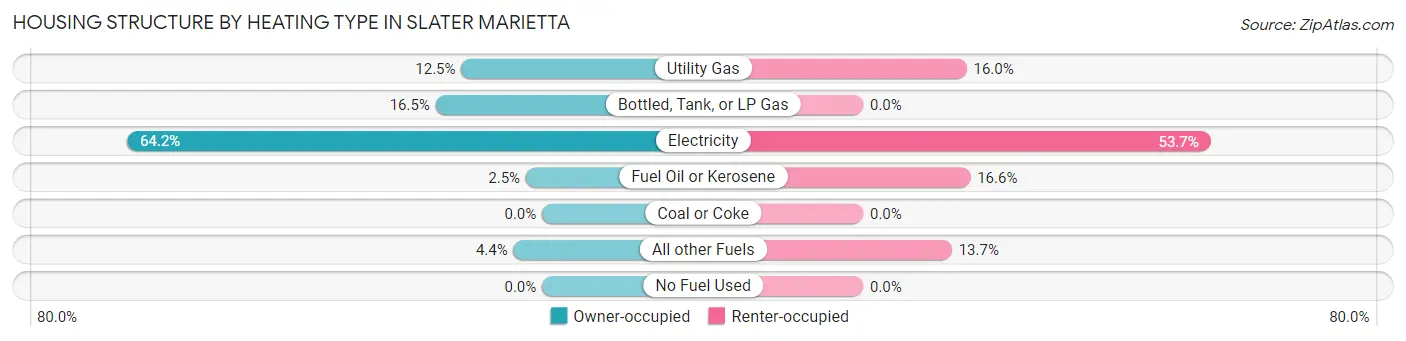
| Heating Type | Owner-occupied | Renter-occupied |
| Utility Gas | 85 (12.5%) | 28 (16.0%) |
| Bottled, Tank, or LP Gas | 112 (16.5%) | 0 (0.0%) |
| Electricity | 437 (64.2%) | 94 (53.7%) |
| Fuel Oil or Kerosene | 17 (2.5%) | 29 (16.6%) |
| Coal or Coke | 0 (0.0%) | 0 (0.0%) |
| All other Fuels | 30 (4.4%) | 24 (13.7%) |
| No Fuel Used | 0 (0.0%) | 0 (0.0%) |
| Total | 681 (100.0%) | 175 (100.0%) |
Household Vehicle Usage in Slater Marietta
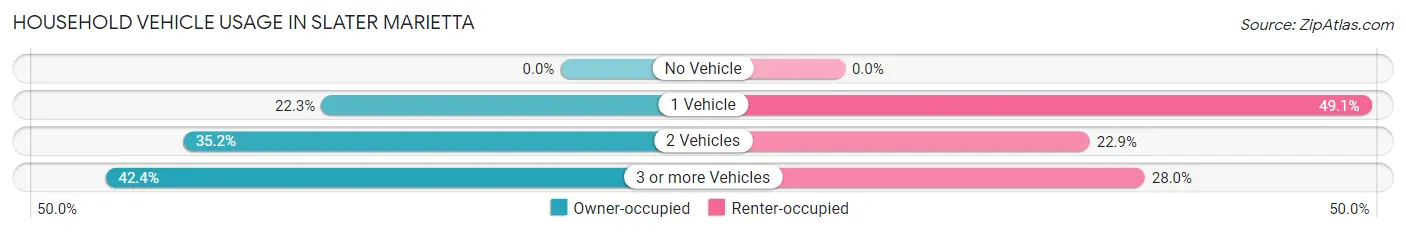
| Vehicles per Household | Owner-occupied | Renter-occupied |
| No Vehicle | 0 (0.0%) | 0 (0.0%) |
| 1 Vehicle | 152 (22.3%) | 86 (49.1%) |
| 2 Vehicles | 240 (35.2%) | 40 (22.9%) |
| 3 or more Vehicles | 289 (42.4%) | 49 (28.0%) |
| Total | 681 (100.0%) | 175 (100.0%) |
Real Estate & Mortgages in Slater Marietta
Real Estate and Mortgage Overview in Slater Marietta
| Characteristic | Without Mortgage | With Mortgage |
| Housing Units | 277 | 404 |
| Median Property Value | - | - |
| Median Household Income | $39,149 | $37 |
| Monthly Housing Costs | $306 | $0 |
| Real Estate Taxes | $299 | $9 |
Property Value by Mortgage Status in Slater Marietta
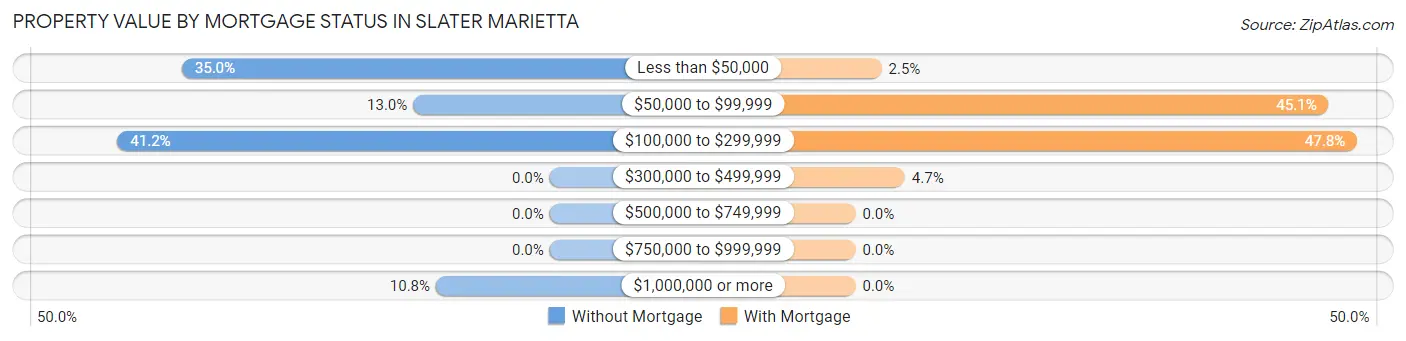
| Property Value | Without Mortgage | With Mortgage |
| Less than $50,000 | 97 (35.0%) | 10 (2.5%) |
| $50,000 to $99,999 | 36 (13.0%) | 182 (45.1%) |
| $100,000 to $299,999 | 114 (41.2%) | 193 (47.8%) |
| $300,000 to $499,999 | 0 (0.0%) | 19 (4.7%) |
| $500,000 to $749,999 | 0 (0.0%) | 0 (0.0%) |
| $750,000 to $999,999 | 0 (0.0%) | 0 (0.0%) |
| $1,000,000 or more | 30 (10.8%) | 0 (0.0%) |
| Total | 277 (100.0%) | 404 (100.0%) |
Household Income by Mortgage Status in Slater Marietta
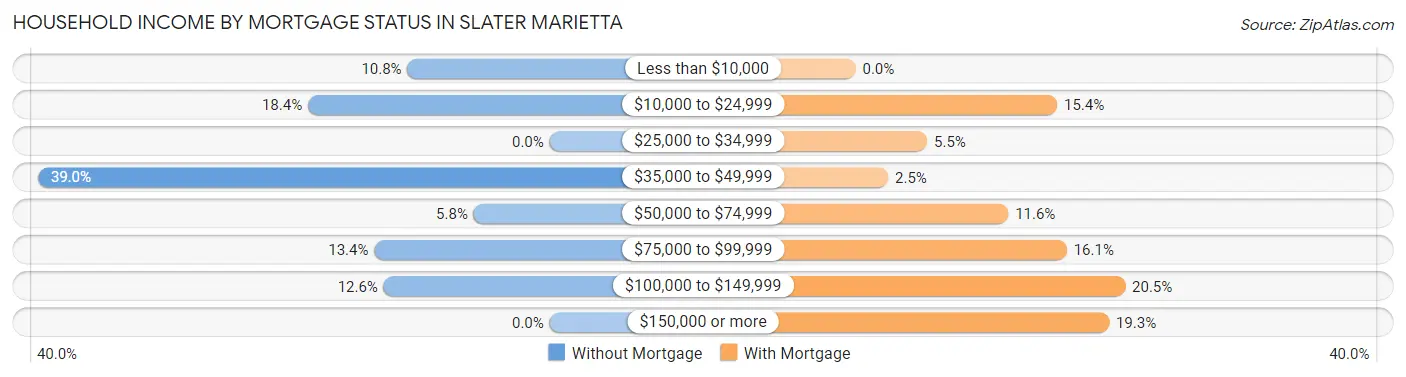
| Household Income | Without Mortgage | With Mortgage |
| Less than $10,000 | 30 (10.8%) | 0 (0.0%) |
| $10,000 to $24,999 | 51 (18.4%) | 62 (15.3%) |
| $25,000 to $34,999 | 0 (0.0%) | 22 (5.4%) |
| $35,000 to $49,999 | 108 (39.0%) | 10 (2.5%) |
| $50,000 to $74,999 | 16 (5.8%) | 47 (11.6%) |
| $75,000 to $99,999 | 37 (13.4%) | 65 (16.1%) |
| $100,000 to $149,999 | 35 (12.6%) | 83 (20.5%) |
| $150,000 or more | 0 (0.0%) | 78 (19.3%) |
| Total | 277 (100.0%) | 404 (100.0%) |
Property Value to Household Income Ratio in Slater Marietta
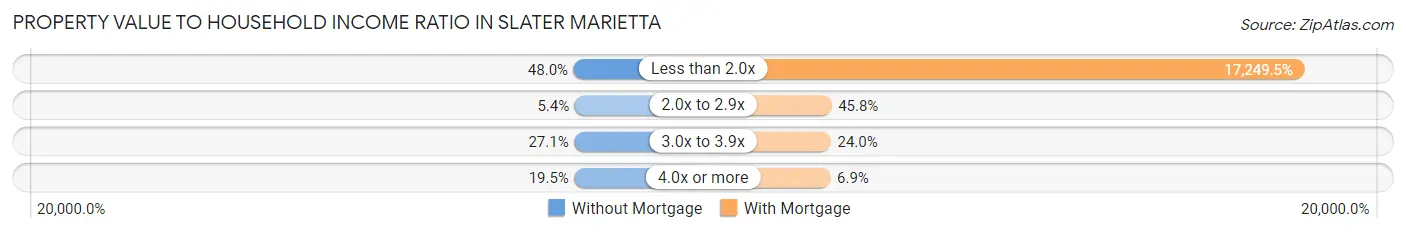
| Value-to-Income Ratio | Without Mortgage | With Mortgage |
| Less than 2.0x | 133 (48.0%) | 69,688 (17,249.5%) |
| 2.0x to 2.9x | 15 (5.4%) | 185 (45.8%) |
| 3.0x to 3.9x | 75 (27.1%) | 97 (24.0%) |
| 4.0x or more | 54 (19.5%) | 28 (6.9%) |
| Total | 277 (100.0%) | 404 (100.0%) |
Real Estate Taxes by Mortgage Status in Slater Marietta
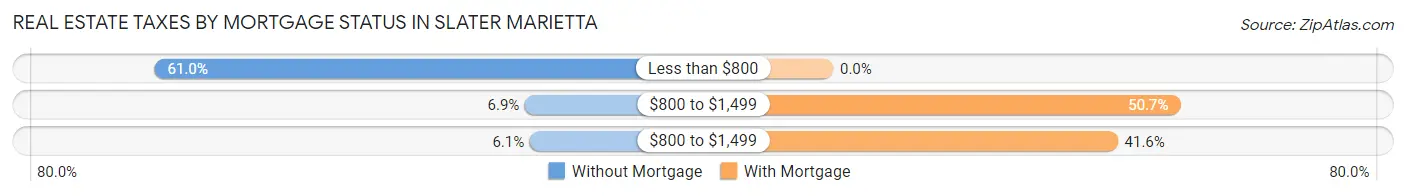
| Property Taxes | Without Mortgage | With Mortgage |
| Less than $800 | 169 (61.0%) | 0 (0.0%) |
| $800 to $1,499 | 19 (6.9%) | 205 (50.7%) |
| $800 to $1,499 | 17 (6.1%) | 168 (41.6%) |
| Total | 277 (100.0%) | 404 (100.0%) |
Health & Disability in Slater Marietta
Health Insurance Coverage by Age in Slater Marietta
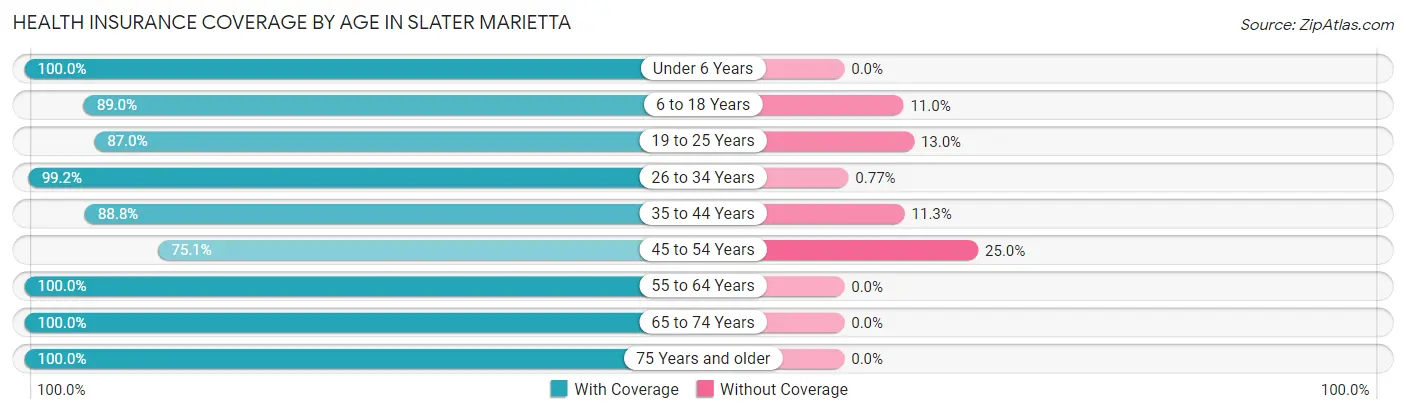
| Age Bracket | With Coverage | Without Coverage |
| Under 6 Years | 53 (100.0%) | 0 (0.0%) |
| 6 to 18 Years | 411 (89.0%) | 51 (11.0%) |
| 19 to 25 Years | 67 (87.0%) | 10 (13.0%) |
| 26 to 34 Years | 259 (99.2%) | 2 (0.8%) |
| 35 to 44 Years | 71 (88.7%) | 9 (11.3%) |
| 45 to 54 Years | 391 (75.0%) | 130 (24.9%) |
| 55 to 64 Years | 298 (100.0%) | 0 (0.0%) |
| 65 to 74 Years | 287 (100.0%) | 0 (0.0%) |
| 75 Years and older | 89 (100.0%) | 0 (0.0%) |
| Total | 1,926 (90.5%) | 202 (9.5%) |
Health Insurance Coverage by Citizenship Status in Slater Marietta
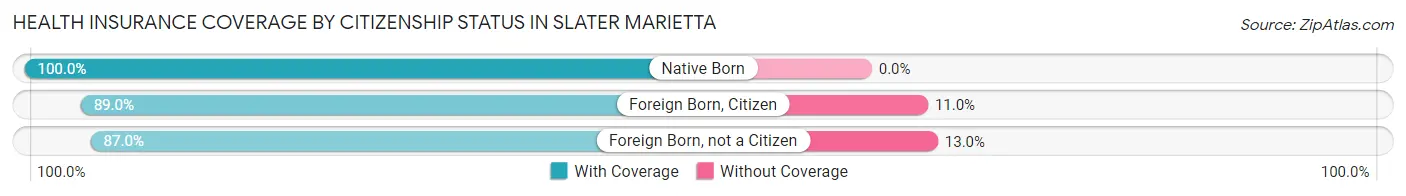
| Citizenship Status | With Coverage | Without Coverage |
| Native Born | 53 (100.0%) | 0 (0.0%) |
| Foreign Born, Citizen | 411 (89.0%) | 51 (11.0%) |
| Foreign Born, not a Citizen | 67 (87.0%) | 10 (13.0%) |
Health Insurance Coverage by Household Income in Slater Marietta
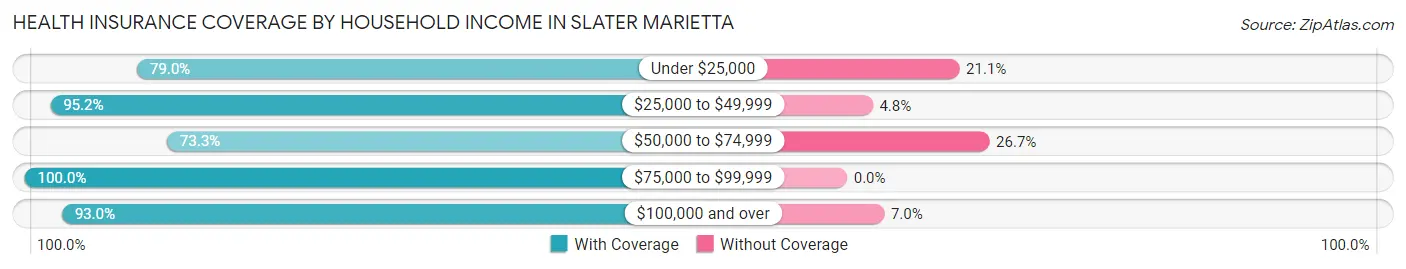
| Household Income | With Coverage | Without Coverage |
| Under $25,000 | 240 (78.9%) | 64 (21.0%) |
| $25,000 to $49,999 | 554 (95.2%) | 28 (4.8%) |
| $50,000 to $74,999 | 187 (73.3%) | 68 (26.7%) |
| $75,000 to $99,999 | 396 (100.0%) | 0 (0.0%) |
| $100,000 and over | 535 (93.0%) | 40 (7.0%) |
Public vs Private Health Insurance Coverage by Age in Slater Marietta
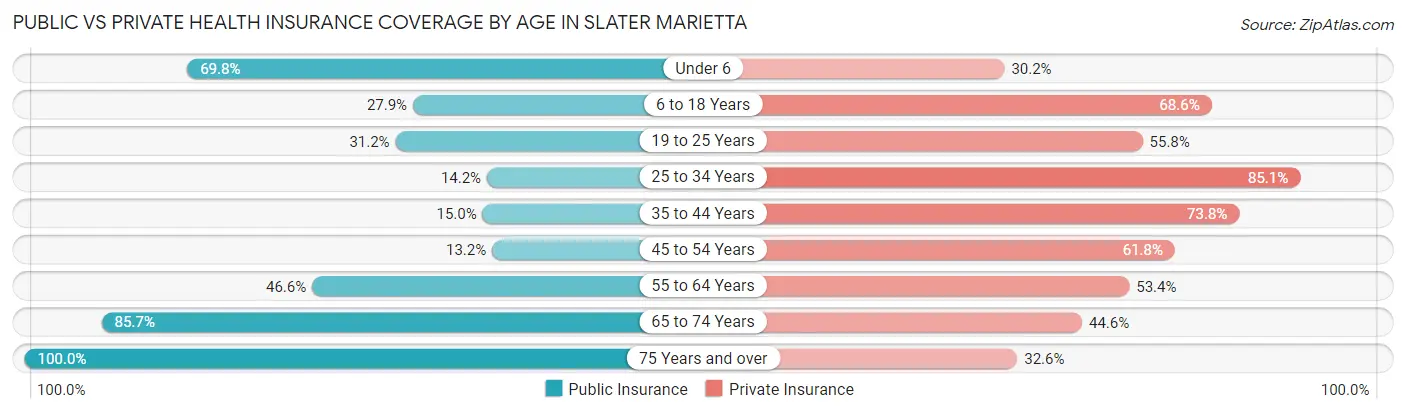
| Age Bracket | Public Insurance | Private Insurance |
| Under 6 | 37 (69.8%) | 16 (30.2%) |
| 6 to 18 Years | 129 (27.9%) | 317 (68.6%) |
| 19 to 25 Years | 24 (31.2%) | 43 (55.8%) |
| 25 to 34 Years | 37 (14.2%) | 222 (85.1%) |
| 35 to 44 Years | 12 (15.0%) | 59 (73.8%) |
| 45 to 54 Years | 69 (13.2%) | 322 (61.8%) |
| 55 to 64 Years | 139 (46.6%) | 159 (53.4%) |
| 65 to 74 Years | 246 (85.7%) | 128 (44.6%) |
| 75 Years and over | 89 (100.0%) | 29 (32.6%) |
| Total | 782 (36.7%) | 1,295 (60.9%) |
Disability Status by Sex by Age in Slater Marietta
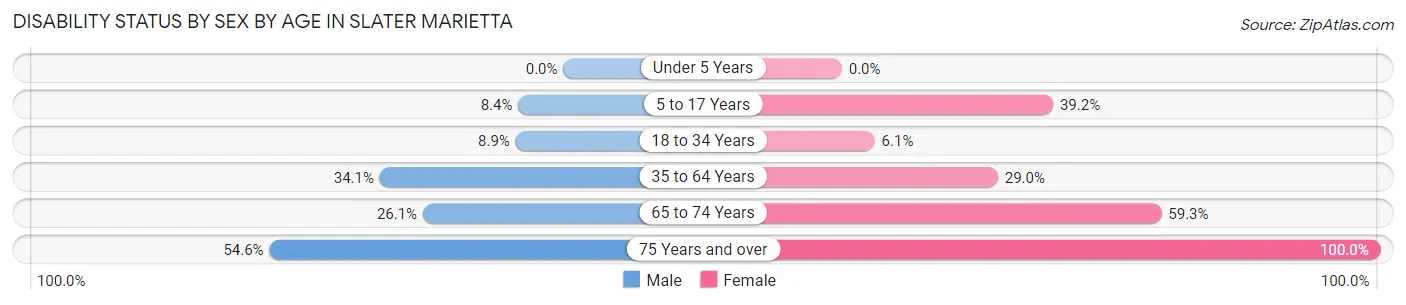
| Age Bracket | Male | Female |
| Under 5 Years | 0 (0.0%) | 0 (0.0%) |
| 5 to 17 Years | 24 (8.4%) | 49 (39.2%) |
| 18 to 34 Years | 20 (8.8%) | 10 (6.1%) |
| 35 to 64 Years | 138 (34.1%) | 143 (28.9%) |
| 65 to 74 Years | 37 (26.1%) | 86 (59.3%) |
| 75 Years and over | 18 (54.5%) | 56 (100.0%) |
Disability Class by Sex by Age in Slater Marietta
Disability Class: Hearing Difficulty
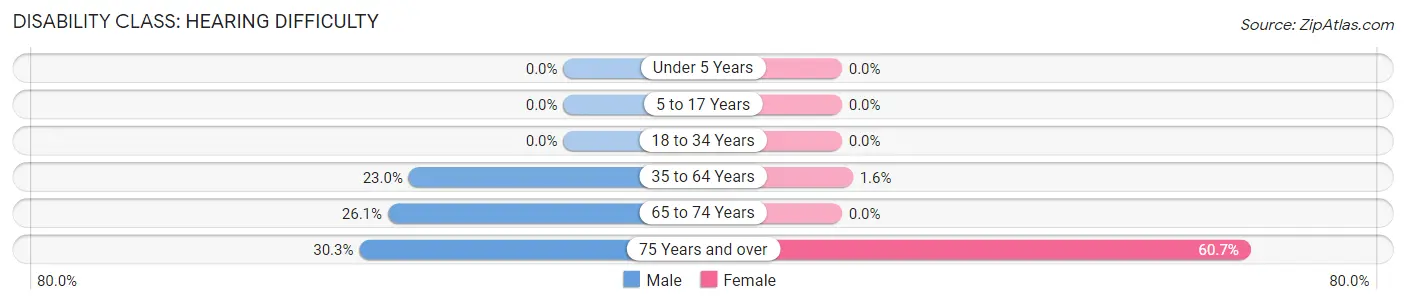
| Age Bracket | Male | Female |
| Under 5 Years | 0 (0.0%) | 0 (0.0%) |
| 5 to 17 Years | 0 (0.0%) | 0 (0.0%) |
| 18 to 34 Years | 0 (0.0%) | 0 (0.0%) |
| 35 to 64 Years | 93 (23.0%) | 8 (1.6%) |
| 65 to 74 Years | 37 (26.1%) | 0 (0.0%) |
| 75 Years and over | 10 (30.3%) | 34 (60.7%) |
Disability Class: Vision Difficulty
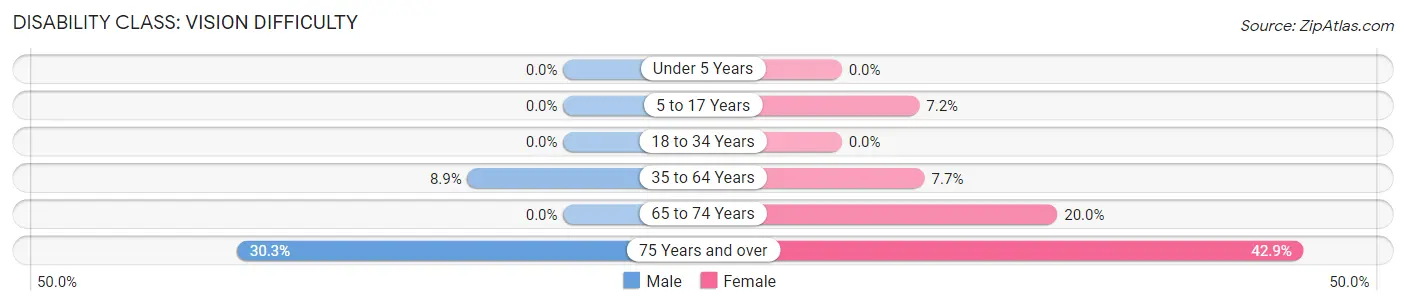
| Age Bracket | Male | Female |
| Under 5 Years | 0 (0.0%) | 0 (0.0%) |
| 5 to 17 Years | 0 (0.0%) | 9 (7.2%) |
| 18 to 34 Years | 0 (0.0%) | 0 (0.0%) |
| 35 to 64 Years | 36 (8.9%) | 38 (7.7%) |
| 65 to 74 Years | 0 (0.0%) | 29 (20.0%) |
| 75 Years and over | 10 (30.3%) | 24 (42.9%) |
Disability Class: Cognitive Difficulty
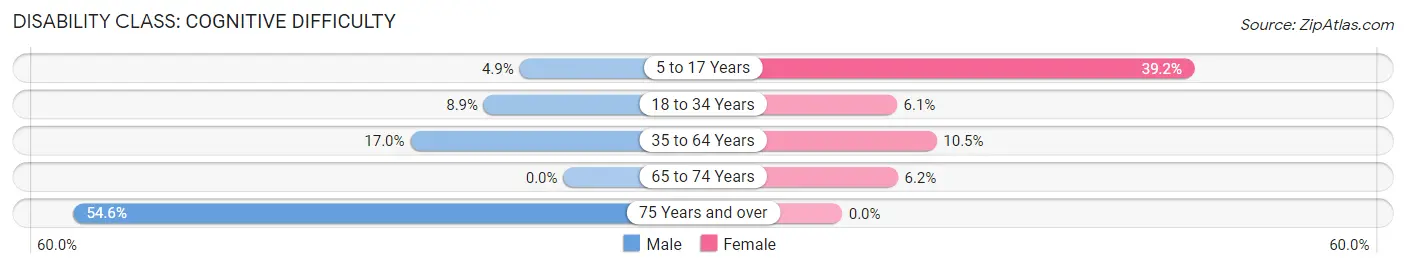
| Age Bracket | Male | Female |
| 5 to 17 Years | 14 (4.9%) | 49 (39.2%) |
| 18 to 34 Years | 20 (8.8%) | 10 (6.1%) |
| 35 to 64 Years | 69 (17.0%) | 52 (10.5%) |
| 65 to 74 Years | 0 (0.0%) | 9 (6.2%) |
| 75 Years and over | 18 (54.5%) | 0 (0.0%) |
Disability Class: Ambulatory Difficulty
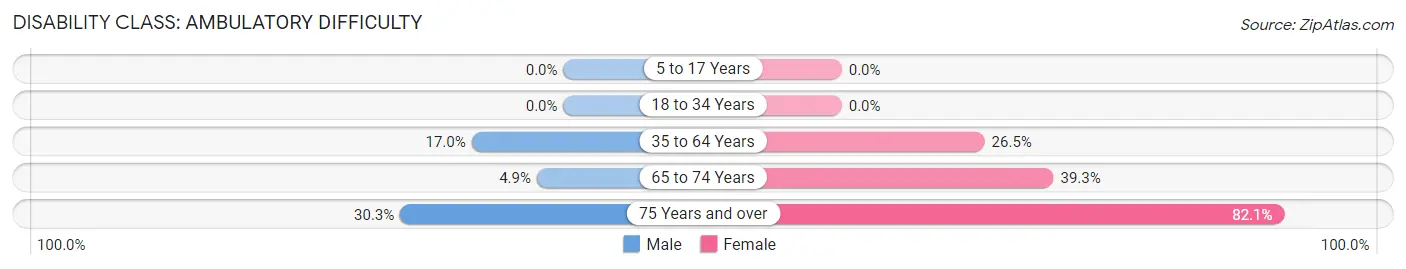
| Age Bracket | Male | Female |
| 5 to 17 Years | 0 (0.0%) | 0 (0.0%) |
| 18 to 34 Years | 0 (0.0%) | 0 (0.0%) |
| 35 to 64 Years | 69 (17.0%) | 131 (26.5%) |
| 65 to 74 Years | 7 (4.9%) | 57 (39.3%) |
| 75 Years and over | 10 (30.3%) | 46 (82.1%) |
Disability Class: Self-Care Difficulty
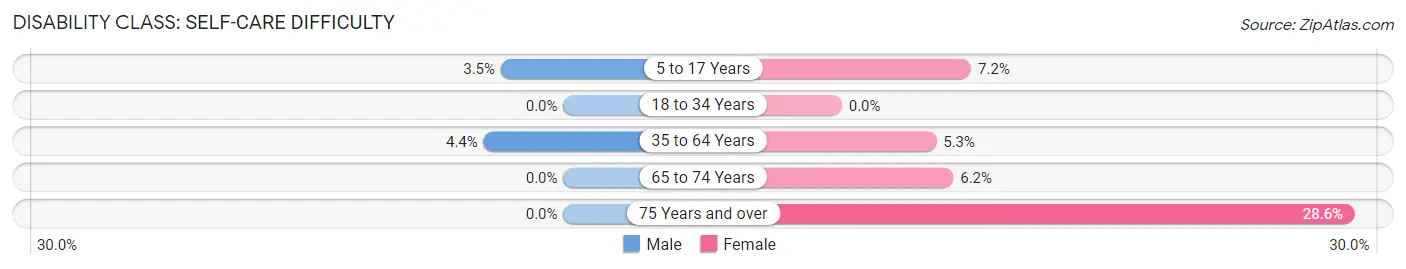
| Age Bracket | Male | Female |
| 5 to 17 Years | 10 (3.5%) | 9 (7.2%) |
| 18 to 34 Years | 0 (0.0%) | 0 (0.0%) |
| 35 to 64 Years | 18 (4.4%) | 26 (5.3%) |
| 65 to 74 Years | 0 (0.0%) | 9 (6.2%) |
| 75 Years and over | 0 (0.0%) | 16 (28.6%) |
Technology Access in Slater Marietta
Computing Device Access in Slater Marietta
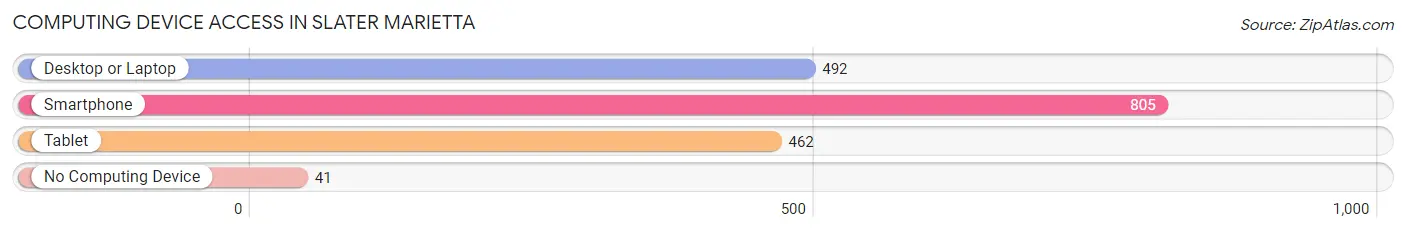
| Device Type | # Households | % Households |
| Desktop or Laptop | 492 | 57.5% |
| Smartphone | 805 | 94.0% |
| Tablet | 462 | 54.0% |
| No Computing Device | 41 | 4.8% |
| Total | 856 | 100.0% |
Internet Access in Slater Marietta
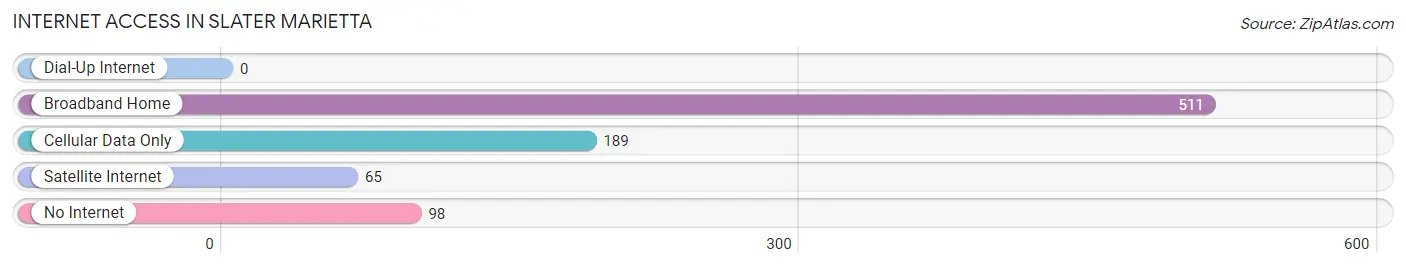
| Internet Type | # Households | % Households |
| Dial-Up Internet | 0 | 0.0% |
| Broadband Home | 511 | 59.7% |
| Cellular Data Only | 189 | 22.1% |
| Satellite Internet | 65 | 7.6% |
| No Internet | 98 | 11.5% |
| Total | 856 | 100.0% |
Slater Marietta Summary
Marietta, South Carolina is a small town located in the Piedmont region of the state. It is situated in Anderson County, approximately 20 miles northeast of Anderson and 25 miles southwest of Greenville. The town was founded in 1820 and named after the daughter of a local landowner. The population of Marietta was estimated to be 1,845 in 2020.
History
Marietta was founded in 1820 by a group of settlers from North Carolina. The town was named after the daughter of a local landowner, Marietta Smith. The town was originally a farming community, but it soon developed into a small industrial center. The town was incorporated in 1872 and the first mayor was elected in 1873.
The town experienced a period of growth in the late 19th and early 20th centuries. The railroad arrived in 1881, and the town was connected to the larger cities of Anderson and Greenville. The town also had a cotton mill, a grist mill, and a sawmill.
In the early 20th century, Marietta was a popular tourist destination. The town was known for its mineral springs, which were believed to have healing properties. The town also had a number of hotels and resorts, as well as a golf course.
Geography
Marietta is located in the Piedmont region of South Carolina. The town is situated in Anderson County, approximately 20 miles northeast of Anderson and 25 miles southwest of Greenville. The town is located on the banks of the Saluda River.
The town has a total area of 1.3 square miles, all of which is land. The town is located at an elevation of 845 feet above sea level. The climate is humid subtropical, with hot, humid summers and mild winters.
Economy
Marietta’s economy is largely based on agriculture and manufacturing. The town is home to several small businesses, including a lumber mill, a feed mill, and a furniture factory. The town also has a number of retail stores, restaurants, and other services.
The town is also home to a number of tourist attractions, including the Marietta Mineral Springs, the Marietta Museum, and the Marietta Golf Course.
Demographics
The population of Marietta was estimated to be 1,845 in 2020. The town has a population density of 1,400 people per square mile. The median age of the population is 43.7 years, and the median household income is $41,945.
The racial makeup of the town is 87.3% White, 8.2% African American, 0.7% Asian, 0.2% Native American, and 3.6% from other races. The town has a large Hispanic population, with 8.2% of the population identifying as Hispanic or Latino.
Marietta is a small town with a rich history and a diverse population. The town is home to a number of businesses and tourist attractions, and it is a great place to live and work.
Common Questions
What is Per Capita Income in Slater Marietta?
Per Capita income in Slater Marietta is $24,298.
What is the Median Family Income in Slater Marietta?
Median Family Income in Slater Marietta is $54,881.
What is the Median Household income in Slater Marietta?
Median Household Income in Slater Marietta is $46,797.
What is Income or Wage Gap in Slater Marietta?
Income or Wage Gap in Slater Marietta is 2.7%.
Women in Slater Marietta earn 97.3 cents for every dollar earned by a man.
What is Inequality or Gini Index in Slater Marietta?
Inequality or Gini Index in Slater Marietta is 0.43.
What is the Total Population of Slater Marietta?
Total Population of Slater Marietta is 2,199.
What is the Total Male Population of Slater Marietta?
Total Male Population of Slater Marietta is 1,162.
What is the Total Female Population of Slater Marietta?
Total Female Population of Slater Marietta is 1,037.
What is the Ratio of Males per 100 Females in Slater Marietta?
There are 112.05 Males per 100 Females in Slater Marietta.
What is the Ratio of Females per 100 Males in Slater Marietta?
There are 89.24 Females per 100 Males in Slater Marietta.
What is the Median Population Age in Slater Marietta?
Median Population Age in Slater Marietta is 49.0 Years.
What is the Average Family Size in Slater Marietta
Average Family Size in Slater Marietta is 2.9 People.
What is the Average Household Size in Slater Marietta
Average Household Size in Slater Marietta is 2.5 People.
How Large is the Labor Force in Slater Marietta?
There are 1,016 People in the Labor Forcein in Slater Marietta.
What is the Percentage of People in the Labor Force in Slater Marietta?
56.4% of People are in the Labor Force in Slater Marietta.
What is the Unemployment Rate in Slater Marietta?
Unemployment Rate in Slater Marietta is 5.5%.