Zip Codes with the Highest Percentage of Population Employed in Security & Protection in Fort Mill, SC
RELATED REPORTS & OPTIONS
Security & Protection
Fort Mill
Compare Zip Codes
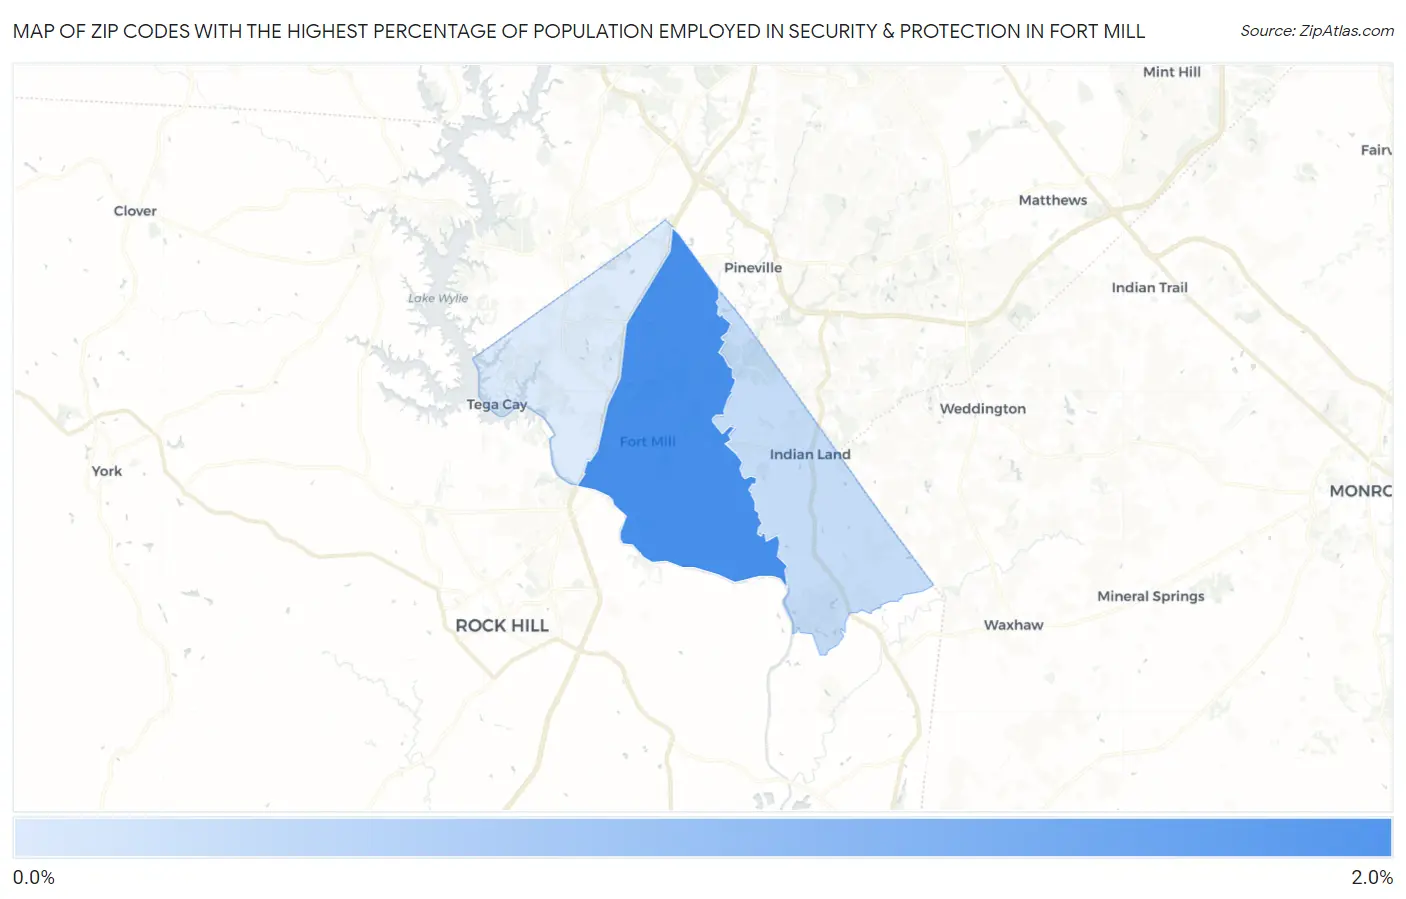
Map of Zip Codes with the Highest Percentage of Population Employed in Security & Protection in Fort Mill
0.99%
1.7%
Zip Codes with the Highest Percentage of Population Employed in Security & Protection in Fort Mill, SC
| Zip Code | % Employed | vs State | vs National | |
| 1. | 29715 | 1.7% | 2.1%(-0.363)#205 | 2.1%(-0.412)#14,415 |
| 2. | 29707 | 1.1% | 2.1%(-0.994)#276 | 2.1%(-1.04)#19,235 |
| 3. | 29708 | 0.99% | 2.1%(-1.11)#291 | 2.1%(-1.16)#20,115 |
1
Common Questions
What are the Top Zip Codes with the Highest Percentage of Population Employed in Security & Protection in Fort Mill, SC?
Top Zip Codes with the Highest Percentage of Population Employed in Security & Protection in Fort Mill, SC are:
What zip code has the Highest Percentage of Population Employed in Security & Protection in Fort Mill, SC?
29715 has the Highest Percentage of Population Employed in Security & Protection in Fort Mill, SC with 1.7%.
What is the Percentage of Population Employed in Security & Protection in Fort Mill, SC?
Percentage of Population Employed in Security & Protection in Fort Mill is 0.82%.
What is the Percentage of Population Employed in Security & Protection in South Carolina?
Percentage of Population Employed in Security & Protection in South Carolina is 2.1%.
What is the Percentage of Population Employed in Security & Protection in the United States?
Percentage of Population Employed in Security & Protection in the United States is 2.1%.