Laurel Bay, SC Map & Demographics
Laurel Bay Map
Laurel Bay Overview
$23,716
PER CAPITA INCOME
$57,089
AVG FAMILY INCOME
$55,658
AVG HOUSEHOLD INCOME
36.3%
WAGE / INCOME GAP [ % ]
63.7¢/ $1
WAGE / INCOME GAP [ $ ]
$9,661
FAMILY INCOME DEFICIT
0.40
INEQUALITY / GINI INDEX
5,513
TOTAL POPULATION
2,883
MALE POPULATION
2,630
FEMALE POPULATION
109.62
MALES / 100 FEMALES
91.22
FEMALES / 100 MALES
22.9
MEDIAN AGE
3.4
AVG FAMILY SIZE
3.1
AVG HOUSEHOLD SIZE
2,505
LABOR FORCE [ PEOPLE ]
65.4%
PERCENT IN LABOR FORCE
2.3%
UNEMPLOYMENT RATE
Income in Laurel Bay
Income Overview in Laurel Bay
Per Capita Income in Laurel Bay is $23,716, while median incomes of families and households are $57,089 and $55,658 respectively.
| Characteristic | Number | Measure |
| Per Capita Income | 5,513 | $23,716 |
| Median Family Income | 1,511 | $57,089 |
| Mean Family Income | 1,511 | $73,038 |
| Median Household Income | 1,778 | $55,658 |
| Mean Household Income | 1,778 | $69,033 |
| Income Deficit | 1,511 | $9,661 |
| Wage / Income Gap (%) | 5,513 | 36.34% |
| Wage / Income Gap ($) | 5,513 | 63.66¢ per $1 |
| Gini / Inequality Index | 5,513 | 0.40 |
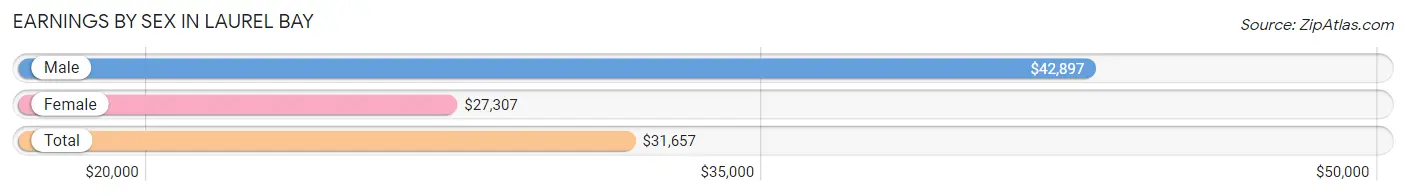
Earnings by Sex in Laurel Bay
Average Earnings in Laurel Bay are $31,657, $42,897 for men and $27,307 for women, a difference of 36.3%.
| Sex | Number | Average Earnings |
| Male | 1,453 (54.4%) | $42,897 |
| Female | 1,217 (45.6%) | $27,307 |
| Total | 2,670 (100.0%) | $31,657 |
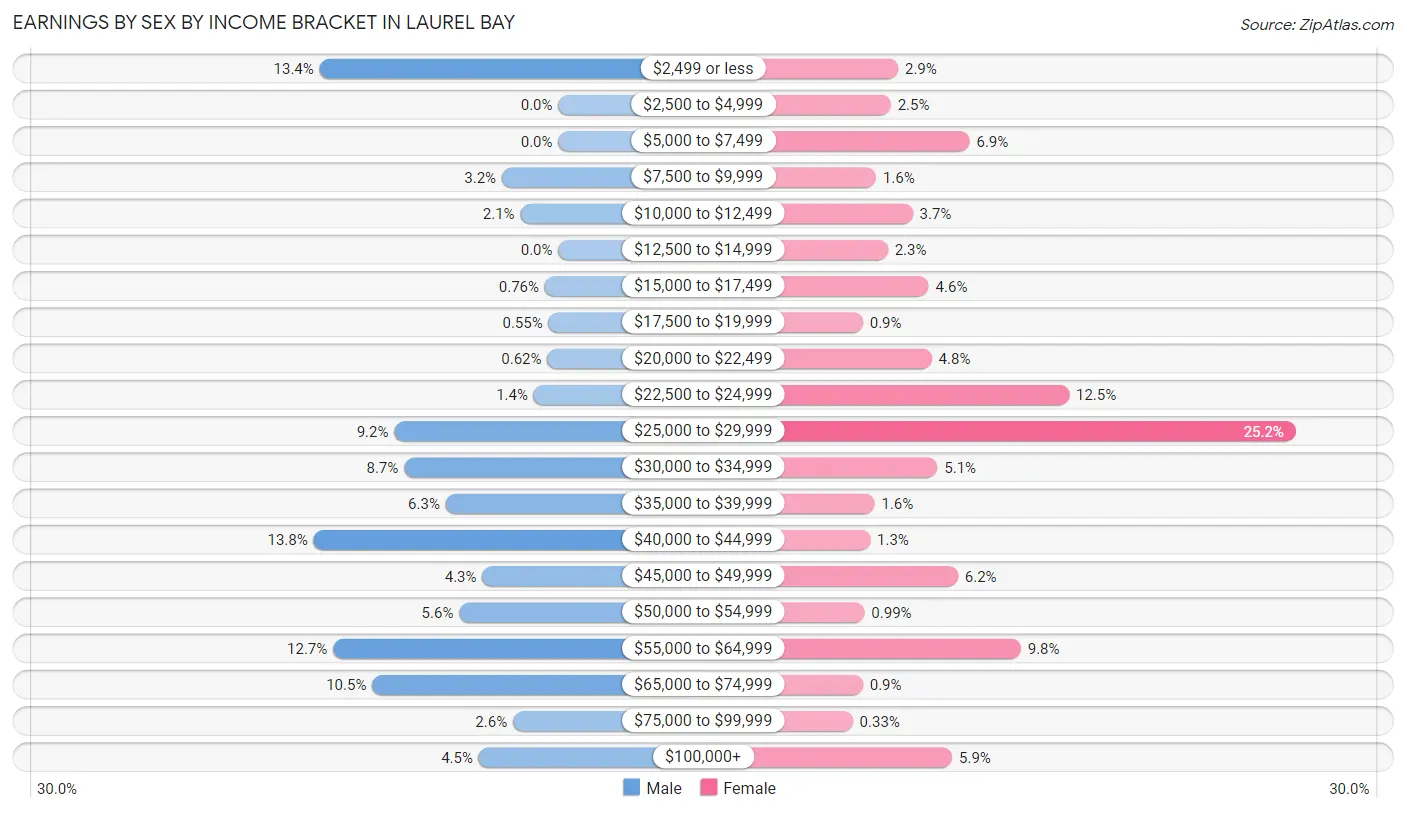
Earnings by Sex by Income Bracket in Laurel Bay
The most common earnings brackets in Laurel Bay are $40,000 to $44,999 for men (200 | 13.8%) and $25,000 to $29,999 for women (307 | 25.2%).
| Income | Male | Female |
| $2,499 or less | 195 (13.4%) | 35 (2.9%) |
| $2,500 to $4,999 | 0 (0.0%) | 30 (2.5%) |
| $5,000 to $7,499 | 0 (0.0%) | 84 (6.9%) |
| $7,500 to $9,999 | 46 (3.2%) | 20 (1.6%) |
| $10,000 to $12,499 | 31 (2.1%) | 45 (3.7%) |
| $12,500 to $14,999 | 0 (0.0%) | 28 (2.3%) |
| $15,000 to $17,499 | 11 (0.8%) | 56 (4.6%) |
| $17,500 to $19,999 | 8 (0.5%) | 11 (0.9%) |
| $20,000 to $22,499 | 9 (0.6%) | 58 (4.8%) |
| $22,500 to $24,999 | 20 (1.4%) | 152 (12.5%) |
| $25,000 to $29,999 | 134 (9.2%) | 307 (25.2%) |
| $30,000 to $34,999 | 126 (8.7%) | 62 (5.1%) |
| $35,000 to $39,999 | 92 (6.3%) | 19 (1.6%) |
| $40,000 to $44,999 | 200 (13.8%) | 16 (1.3%) |
| $45,000 to $49,999 | 62 (4.3%) | 76 (6.2%) |
| $50,000 to $54,999 | 81 (5.6%) | 12 (1.0%) |
| $55,000 to $64,999 | 184 (12.7%) | 119 (9.8%) |
| $65,000 to $74,999 | 152 (10.5%) | 11 (0.9%) |
| $75,000 to $99,999 | 37 (2.5%) | 4 (0.3%) |
| $100,000+ | 65 (4.5%) | 72 (5.9%) |
| Total | 1,453 (100.0%) | 1,217 (100.0%) |
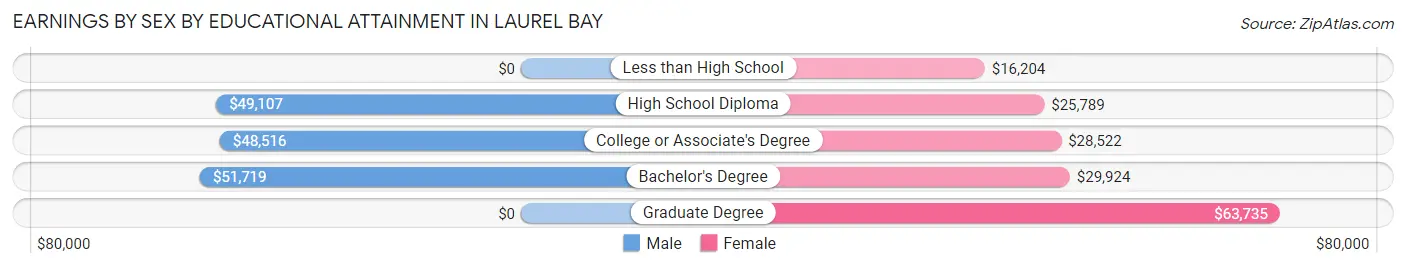
Earnings by Sex by Educational Attainment in Laurel Bay
Average earnings in Laurel Bay are $49,293 for men and $28,691 for women, a difference of 41.8%. Men with an educational attainment of bachelor's degree enjoy the highest average annual earnings of $51,719, while those with college or associate's degree education earn the least with $48,516. Women with an educational attainment of graduate degree earn the most with the average annual earnings of $63,735, while those with less than high school education have the smallest earnings of $16,204.
| Educational Attainment | Male Income | Female Income |
| Less than High School | - | - |
| High School Diploma | $49,107 | $25,789 |
| College or Associate's Degree | $48,516 | $28,522 |
| Bachelor's Degree | $51,719 | $29,924 |
| Graduate Degree | - | - |
| Total | $49,293 | $28,691 |
Family Income in Laurel Bay
Family Income Brackets in Laurel Bay
According to the Laurel Bay family income data, there are 314 families falling into the $25,000 to $34,999 income range, which is the most common income bracket and makes up 20.8% of all families. Conversely, the $150,000 to $199,999 income bracket is the least frequent group with only 11 families (0.7%) belonging to this category.
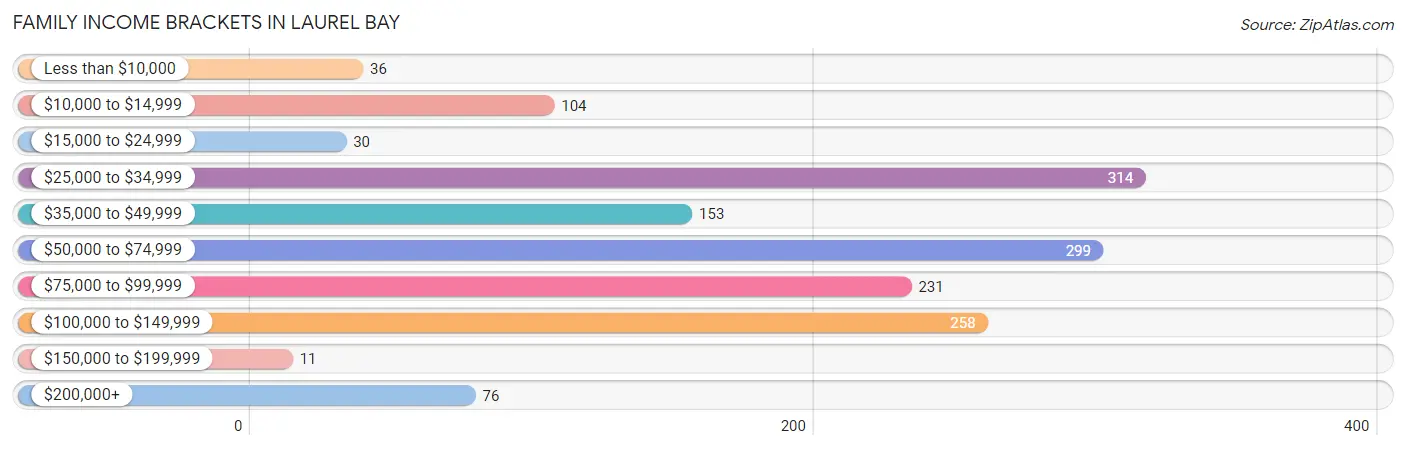
| Income Bracket | # Families | % Families |
| Less than $10,000 | 36 | 2.4% |
| $10,000 to $14,999 | 104 | 6.9% |
| $15,000 to $24,999 | 30 | 2.0% |
| $25,000 to $34,999 | 314 | 20.8% |
| $35,000 to $49,999 | 153 | 10.1% |
| $50,000 to $74,999 | 299 | 19.8% |
| $75,000 to $99,999 | 231 | 15.3% |
| $100,000 to $149,999 | 258 | 17.1% |
| $150,000 to $199,999 | 11 | 0.7% |
| $200,000+ | 76 | 5.0% |
Family Income by Famaliy Size in Laurel Bay
4-person families (330 | 21.8%) account for the highest median family income in Laurel Bay with $100,588 per family, while 2-person families (579 | 38.3%) have the highest median income of $27,094 per family member.
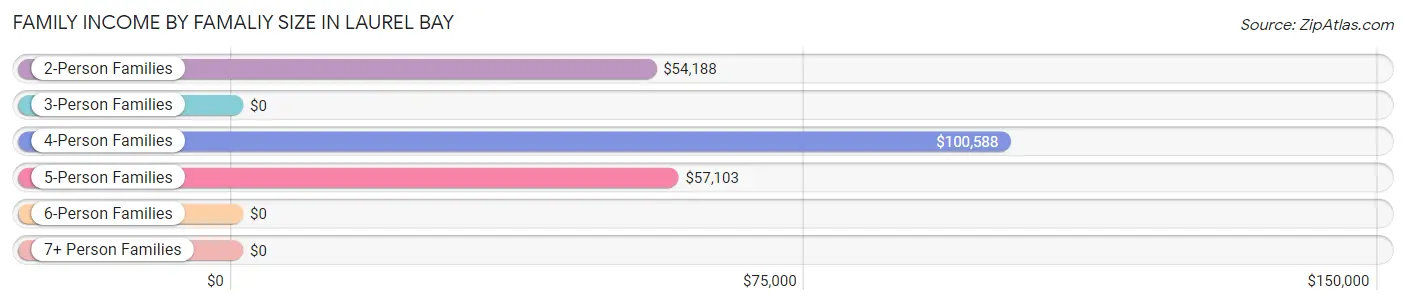
| Income Bracket | # Families | Median Income |
| 2-Person Families | 579 (38.3%) | $54,188 |
| 3-Person Families | 421 (27.9%) | $0 |
| 4-Person Families | 330 (21.8%) | $100,588 |
| 5-Person Families | 106 (7.0%) | $57,103 |
| 6-Person Families | 54 (3.6%) | $0 |
| 7+ Person Families | 21 (1.4%) | $0 |
| Total | 1,511 (100.0%) | $57,089 |
Family Income by Number of Earners in Laurel Bay
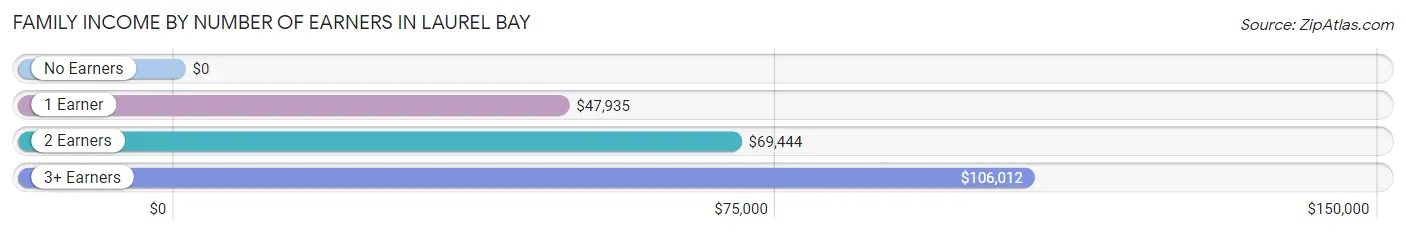
| Number of Earners | # Families | Median Income |
| No Earners | 142 (9.4%) | $0 |
| 1 Earner | 674 (44.6%) | $47,935 |
| 2 Earners | 522 (34.5%) | $69,444 |
| 3+ Earners | 173 (11.5%) | $106,012 |
| Total | 1,511 (100.0%) | $57,089 |
Household Income in Laurel Bay
Household Income Brackets in Laurel Bay
With 377 households falling in the category, the $25,000 to $34,999 income range is the most frequent in Laurel Bay, accounting for 21.2% of all households. In contrast, only 11 households (0.6%) fall into the $150,000 to $199,999 income bracket, making it the least populous group.
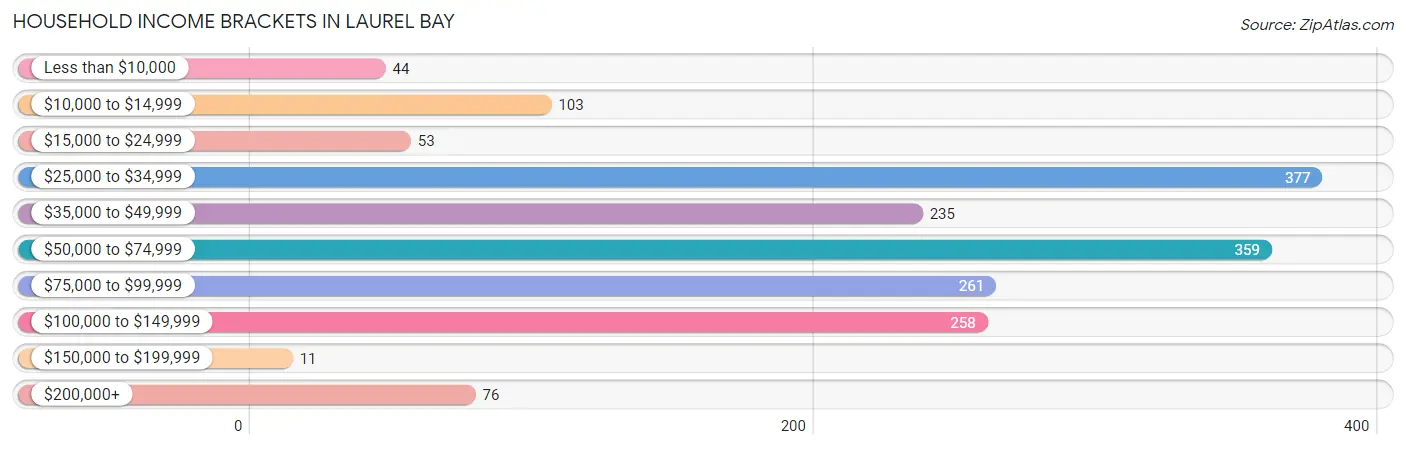
| Income Bracket | # Households | % Households |
| Less than $10,000 | 44 | 2.5% |
| $10,000 to $14,999 | 103 | 5.8% |
| $15,000 to $24,999 | 53 | 3.0% |
| $25,000 to $34,999 | 377 | 21.2% |
| $35,000 to $49,999 | 235 | 13.2% |
| $50,000 to $74,999 | 359 | 20.2% |
| $75,000 to $99,999 | 261 | 14.7% |
| $100,000 to $149,999 | 258 | 14.5% |
| $150,000 to $199,999 | 11 | 0.6% |
| $200,000+ | 76 | 4.3% |
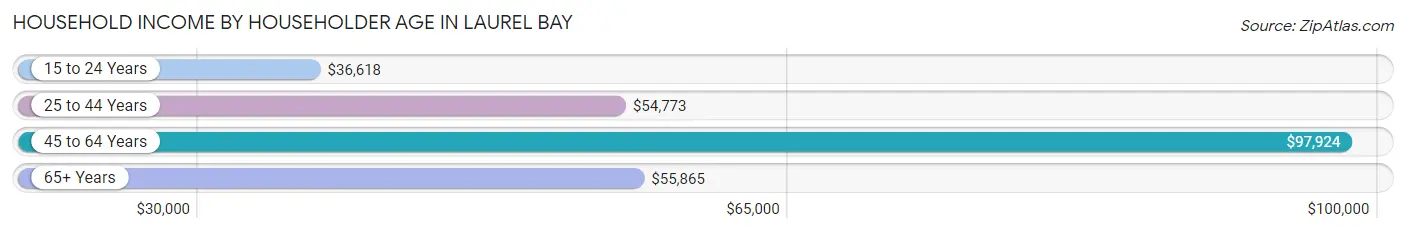
Household Income by Householder Age in Laurel Bay
The median household income in Laurel Bay is $55,658, with the highest median household income of $97,924 found in the 45 to 64 years age bracket for the primary householder. A total of 357 households (20.1%) fall into this category. Meanwhile, the 15 to 24 years age bracket for the primary householder has the lowest median household income of $36,618, with 468 households (26.3%) in this group.
| Income Bracket | # Households | Median Income |
| 15 to 24 Years | 468 (26.3%) | $36,618 |
| 25 to 44 Years | 810 (45.6%) | $54,773 |
| 45 to 64 Years | 357 (20.1%) | $97,924 |
| 65+ Years | 143 (8.0%) | $55,865 |
| Total | 1,778 (100.0%) | $55,658 |
Poverty in Laurel Bay
Income Below Poverty by Sex and Age in Laurel Bay
With 12.7% poverty level for males and 12.2% for females among the residents of Laurel Bay, 75 year old and over males and 75 year old and over females are the most vulnerable to poverty, with 35 males (53.0%) and 39 females (59.1%) in their respective age groups living below the poverty level.
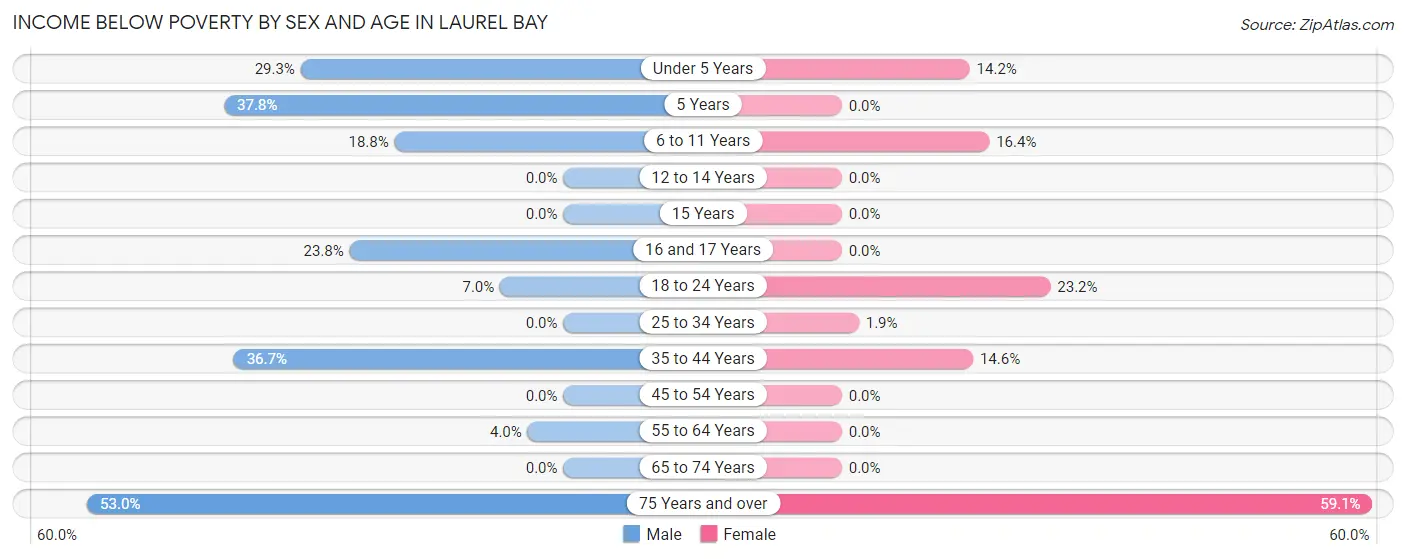
| Age Bracket | Male | Female |
| Under 5 Years | 74 (29.2%) | 49 (14.2%) |
| 5 Years | 17 (37.8%) | 0 (0.0%) |
| 6 to 11 Years | 66 (18.8%) | 45 (16.4%) |
| 12 to 14 Years | 0 (0.0%) | 0 (0.0%) |
| 15 Years | 0 (0.0%) | 0 (0.0%) |
| 16 and 17 Years | 25 (23.8%) | 0 (0.0%) |
| 18 to 24 Years | 56 (7.0%) | 115 (23.2%) |
| 25 to 34 Years | 0 (0.0%) | 8 (1.9%) |
| 35 to 44 Years | 87 (36.7%) | 64 (14.6%) |
| 45 to 54 Years | 0 (0.0%) | 0 (0.0%) |
| 55 to 64 Years | 7 (4.0%) | 0 (0.0%) |
| 65 to 74 Years | 0 (0.0%) | 0 (0.0%) |
| 75 Years and over | 35 (53.0%) | 39 (59.1%) |
| Total | 367 (12.7%) | 320 (12.2%) |
Income Above Poverty by Sex and Age in Laurel Bay
According to the poverty statistics in Laurel Bay, males aged 12 to 14 years and females aged 5 years are the age groups that are most secure financially, with 100.0% of males and 100.0% of females in these age groups living above the poverty line.
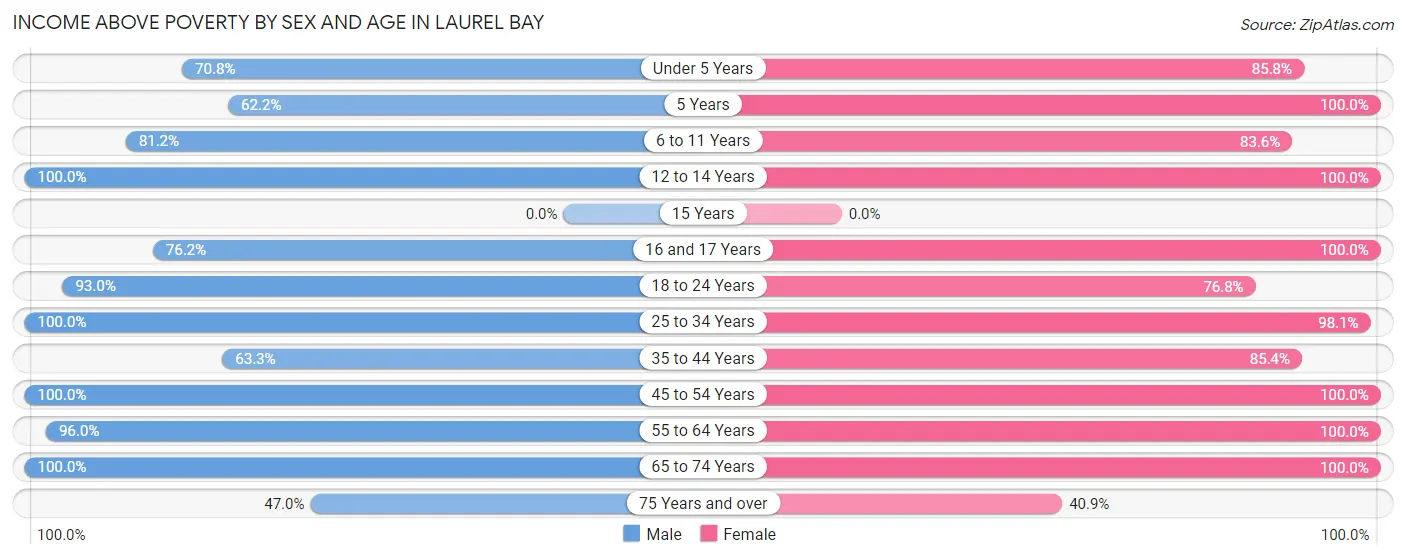
| Age Bracket | Male | Female |
| Under 5 Years | 179 (70.8%) | 295 (85.8%) |
| 5 Years | 28 (62.2%) | 40 (100.0%) |
| 6 to 11 Years | 285 (81.2%) | 229 (83.6%) |
| 12 to 14 Years | 296 (100.0%) | 80 (100.0%) |
| 15 Years | 0 (0.0%) | 0 (0.0%) |
| 16 and 17 Years | 80 (76.2%) | 46 (100.0%) |
| 18 to 24 Years | 740 (93.0%) | 380 (76.8%) |
| 25 to 34 Years | 318 (100.0%) | 415 (98.1%) |
| 35 to 44 Years | 150 (63.3%) | 374 (85.4%) |
| 45 to 54 Years | 235 (100.0%) | 120 (100.0%) |
| 55 to 64 Years | 169 (96.0%) | 217 (100.0%) |
| 65 to 74 Years | 5 (100.0%) | 87 (100.0%) |
| 75 Years and over | 31 (47.0%) | 27 (40.9%) |
| Total | 2,516 (87.3%) | 2,310 (87.8%) |
Income Below Poverty Among Married-Couple Families in Laurel Bay
The poverty statistics for married-couple families in Laurel Bay show that 11.4% or 128 of the total 1,122 families live below the poverty line. Families with 1 or 2 children have the highest poverty rate of 16.9%, comprising of 85 families. On the other hand, families with 3 or 4 children have the lowest poverty rate of 0.0%, which includes 0 families.
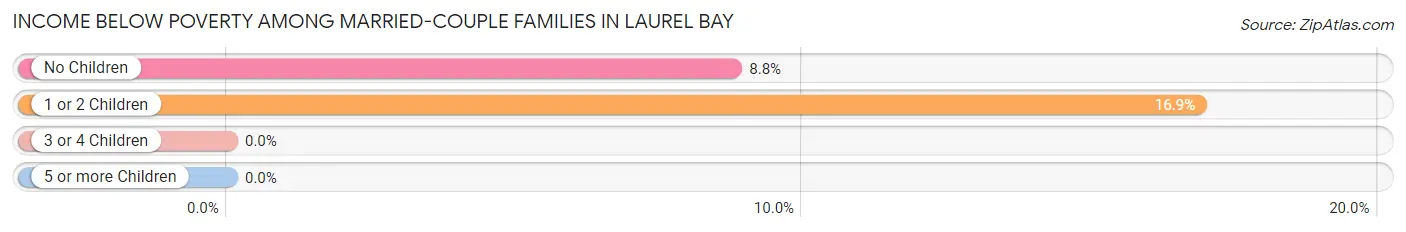
| Children | Above Poverty | Below Poverty |
| No Children | 447 (91.2%) | 43 (8.8%) |
| 1 or 2 Children | 419 (83.1%) | 85 (16.9%) |
| 3 or 4 Children | 107 (100.0%) | 0 (0.0%) |
| 5 or more Children | 21 (100.0%) | 0 (0.0%) |
| Total | 994 (88.6%) | 128 (11.4%) |
Income Below Poverty Among Single-Parent Households in Laurel Bay
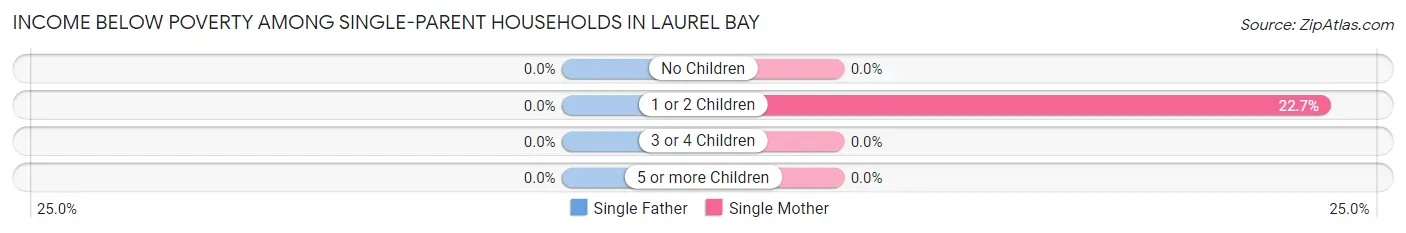
| Children | Single Father | Single Mother |
| No Children | 0 (0.0%) | 0 (0.0%) |
| 1 or 2 Children | 0 (0.0%) | 66 (22.7%) |
| 3 or 4 Children | 0 (0.0%) | 0 (0.0%) |
| 5 or more Children | 0 (0.0%) | 0 (0.0%) |
| Total | 0 (0.0%) | 66 (17.7%) |
Income Below Poverty Among Married-Couple vs Single-Parent Households in Laurel Bay
The poverty data for Laurel Bay shows that 128 of the married-couple family households (11.4%) and 66 of the single-parent households (17.0%) are living below the poverty level. Within the married-couple family households, those with 1 or 2 children have the highest poverty rate, with 85 households (16.9%) falling below the poverty line. Among the single-parent households, those with 1 or 2 children have the highest poverty rate, with 66 household (21.4%) living below poverty.
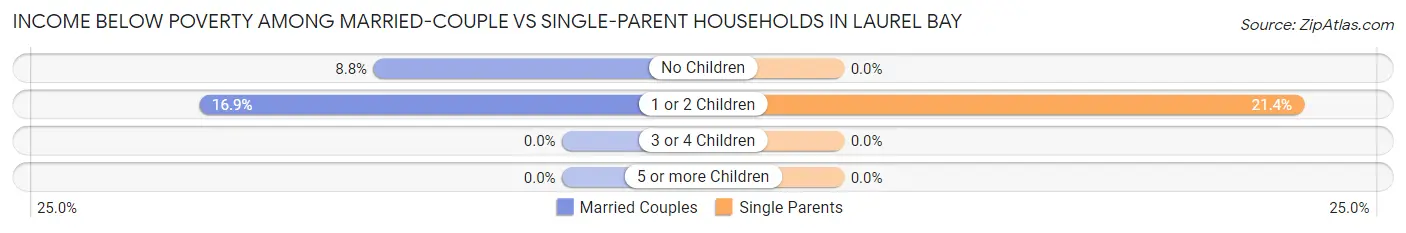
| Children | Married-Couple Families | Single-Parent Households |
| No Children | 43 (8.8%) | 0 (0.0%) |
| 1 or 2 Children | 85 (16.9%) | 66 (21.4%) |
| 3 or 4 Children | 0 (0.0%) | 0 (0.0%) |
| 5 or more Children | 0 (0.0%) | 0 (0.0%) |
| Total | 128 (11.4%) | 66 (17.0%) |
Race in Laurel Bay
The most populous races in Laurel Bay are White / Caucasian (3,022 | 54.8%), Black / African American (1,900 | 34.5%), and Hispanic or Latino (692 | 12.6%).
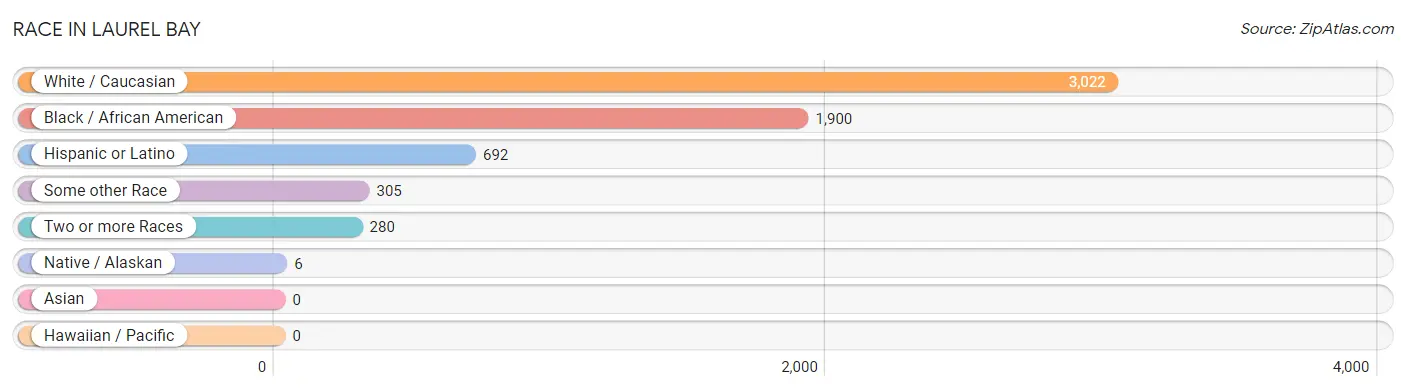
| Race | # Population | % Population |
| Asian | 0 | 0.0% |
| Black / African American | 1,900 | 34.5% |
| Hawaiian / Pacific | 0 | 0.0% |
| Hispanic or Latino | 692 | 12.6% |
| Native / Alaskan | 6 | 0.1% |
| White / Caucasian | 3,022 | 54.8% |
| Two or more Races | 280 | 5.1% |
| Some other Race | 305 | 5.5% |
| Total | 5,513 | 100.0% |
Ancestry in Laurel Bay
The most populous ancestries reported in Laurel Bay are American (678 | 12.3%), Irish (243 | 4.4%), Dutch (223 | 4.0%), Puerto Rican (223 | 4.0%), and German (202 | 3.7%), together accounting for 28.4% of all Laurel Bay residents.
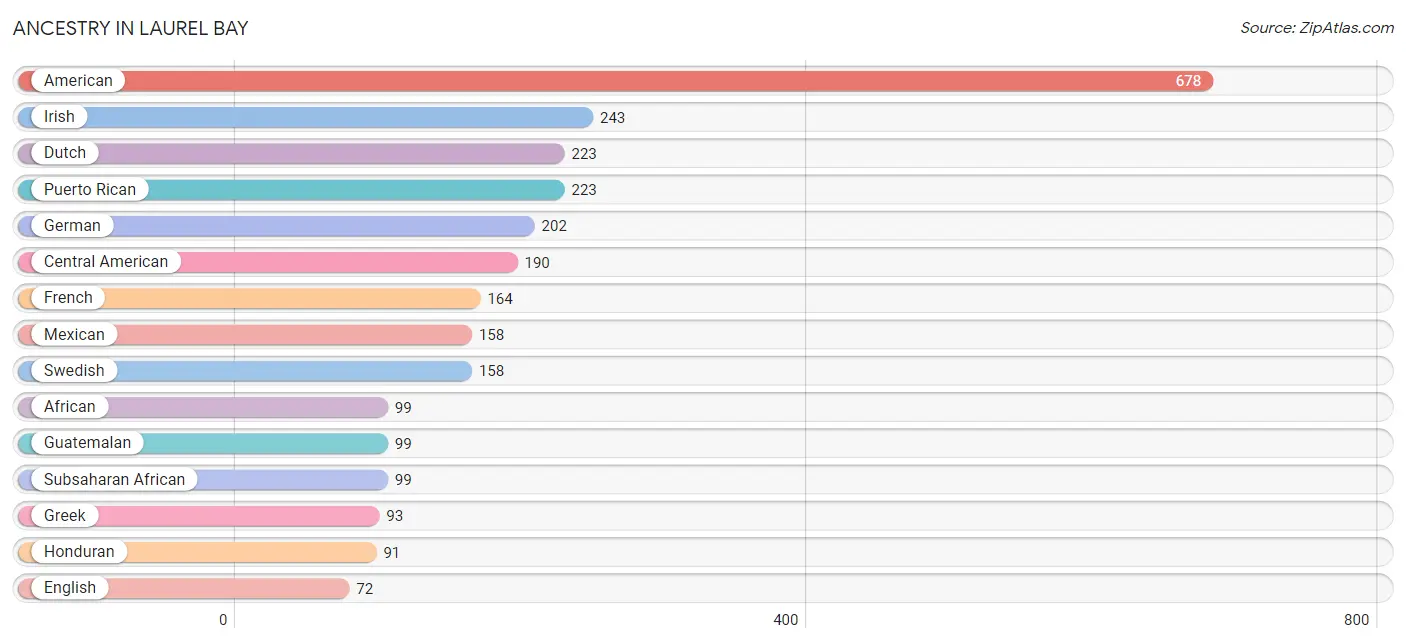
| Ancestry | # Population | % Population |
| African | 99 | 1.8% |
| American | 678 | 12.3% |
| Arab | 22 | 0.4% |
| Brazilian | 58 | 1.1% |
| British | 8 | 0.2% |
| Central American | 190 | 3.5% |
| Cherokee | 16 | 0.3% |
| Chickasaw | 2 | 0.0% |
| Chilean | 13 | 0.2% |
| Colombian | 27 | 0.5% |
| Czech | 1 | 0.0% |
| Dominican | 43 | 0.8% |
| Dutch | 223 | 4.0% |
| Eastern European | 8 | 0.2% |
| English | 72 | 1.3% |
| European | 10 | 0.2% |
| French | 164 | 3.0% |
| French Canadian | 20 | 0.4% |
| German | 202 | 3.7% |
| Greek | 93 | 1.7% |
| Guatemalan | 99 | 1.8% |
| Honduran | 91 | 1.7% |
| Hungarian | 10 | 0.2% |
| Irish | 243 | 4.4% |
| Italian | 42 | 0.8% |
| Lebanese | 22 | 0.4% |
| Mexican | 158 | 2.9% |
| Norwegian | 21 | 0.4% |
| Polish | 57 | 1.0% |
| Puerto Rican | 223 | 4.0% |
| Russian | 7 | 0.1% |
| Scottish | 31 | 0.6% |
| Sioux | 3 | 0.1% |
| South American | 40 | 0.7% |
| Spaniard | 8 | 0.2% |
| Spanish | 9 | 0.2% |
| Subsaharan African | 99 | 1.8% |
| Swedish | 158 | 2.9% |
| Ukrainian | 9 | 0.2% |
| Welsh | 9 | 0.2% | View All 40 Rows |
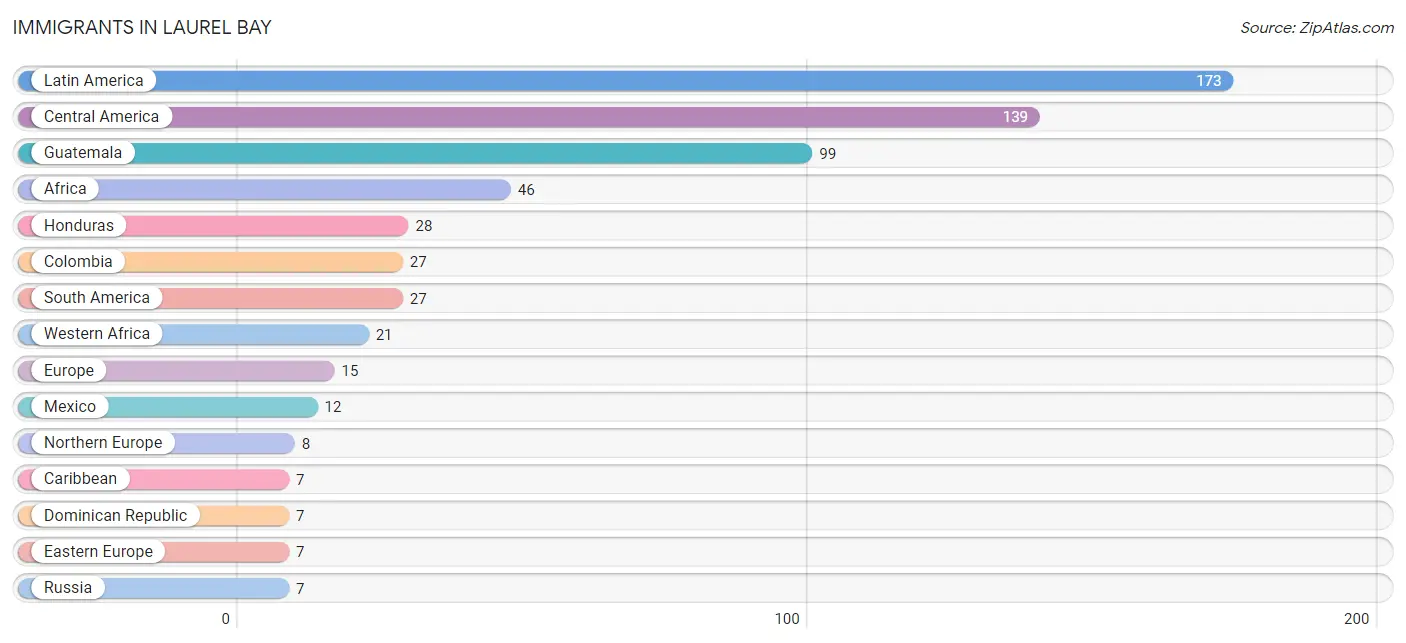
Immigrants in Laurel Bay
The most numerous immigrant groups reported in Laurel Bay came from Latin America (173 | 3.1%), Central America (139 | 2.5%), Guatemala (99 | 1.8%), Africa (46 | 0.8%), and Honduras (28 | 0.5%), together accounting for 8.8% of all Laurel Bay residents.
| Immigration Origin | # Population | % Population |
| Africa | 46 | 0.8% |
| Caribbean | 7 | 0.1% |
| Central America | 139 | 2.5% |
| Colombia | 27 | 0.5% |
| Dominican Republic | 7 | 0.1% |
| Eastern Europe | 7 | 0.1% |
| Europe | 15 | 0.3% |
| Guatemala | 99 | 1.8% |
| Honduras | 28 | 0.5% |
| Latin America | 173 | 3.1% |
| Mexico | 12 | 0.2% |
| Northern Europe | 8 | 0.2% |
| Russia | 7 | 0.1% |
| South America | 27 | 0.5% |
| Western Africa | 21 | 0.4% | View All 15 Rows |
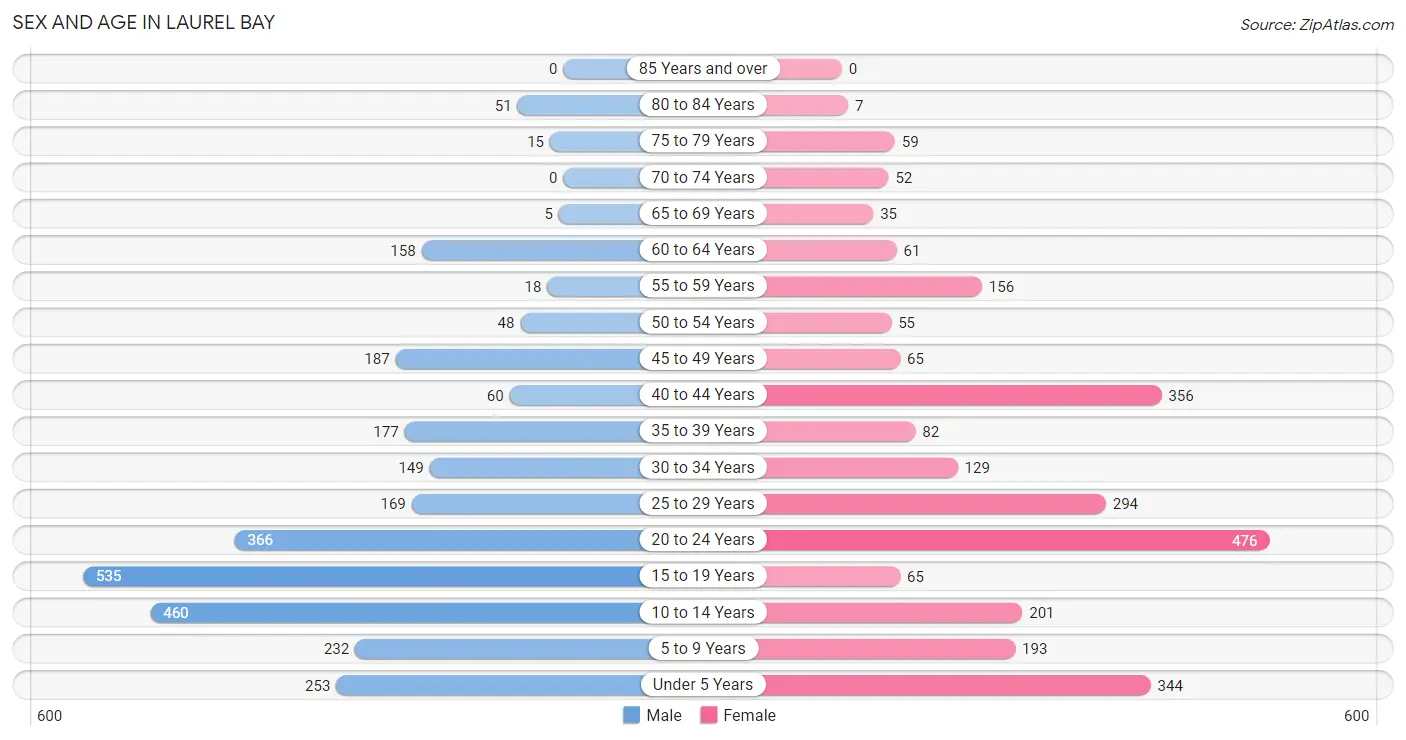
Sex and Age in Laurel Bay
Sex and Age in Laurel Bay
The most populous age groups in Laurel Bay are 15 to 19 Years (535 | 18.6%) for men and 20 to 24 Years (476 | 18.1%) for women.
| Age Bracket | Male | Female |
| Under 5 Years | 253 (8.8%) | 344 (13.1%) |
| 5 to 9 Years | 232 (8.1%) | 193 (7.3%) |
| 10 to 14 Years | 460 (16.0%) | 201 (7.6%) |
| 15 to 19 Years | 535 (18.6%) | 65 (2.5%) |
| 20 to 24 Years | 366 (12.7%) | 476 (18.1%) |
| 25 to 29 Years | 169 (5.9%) | 294 (11.2%) |
| 30 to 34 Years | 149 (5.2%) | 129 (4.9%) |
| 35 to 39 Years | 177 (6.1%) | 82 (3.1%) |
| 40 to 44 Years | 60 (2.1%) | 356 (13.5%) |
| 45 to 49 Years | 187 (6.5%) | 65 (2.5%) |
| 50 to 54 Years | 48 (1.7%) | 55 (2.1%) |
| 55 to 59 Years | 18 (0.6%) | 156 (5.9%) |
| 60 to 64 Years | 158 (5.5%) | 61 (2.3%) |
| 65 to 69 Years | 5 (0.2%) | 35 (1.3%) |
| 70 to 74 Years | 0 (0.0%) | 52 (2.0%) |
| 75 to 79 Years | 15 (0.5%) | 59 (2.2%) |
| 80 to 84 Years | 51 (1.8%) | 7 (0.3%) |
| 85 Years and over | 0 (0.0%) | 0 (0.0%) |
| Total | 2,883 (100.0%) | 2,630 (100.0%) |
Families and Households in Laurel Bay
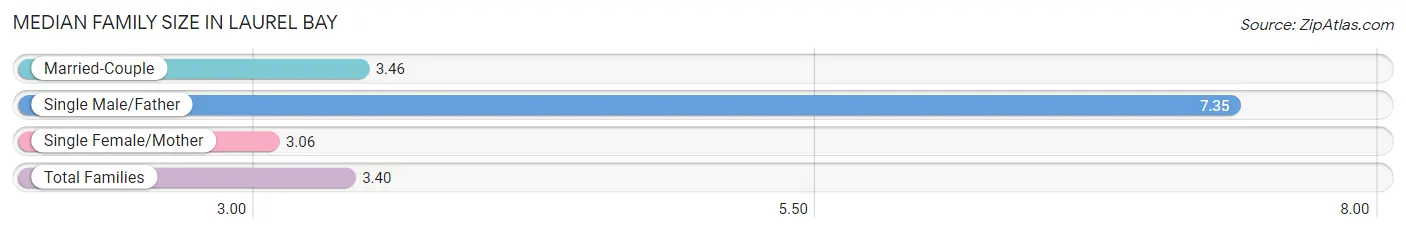
Median Family Size in Laurel Bay
The median family size in Laurel Bay is 3.40 persons per family, with single male/father families (17 | 1.1%) accounting for the largest median family size of 7.35 persons per family. On the other hand, single female/mother families (372 | 24.6%) represent the smallest median family size with 3.06 persons per family.
| Family Type | # Families | Family Size |
| Married-Couple | 1,122 (74.3%) | 3.46 |
| Single Male/Father | 17 (1.1%) | 7.35 |
| Single Female/Mother | 372 (24.6%) | 3.06 |
| Total Families | 1,511 (100.0%) | 3.40 |
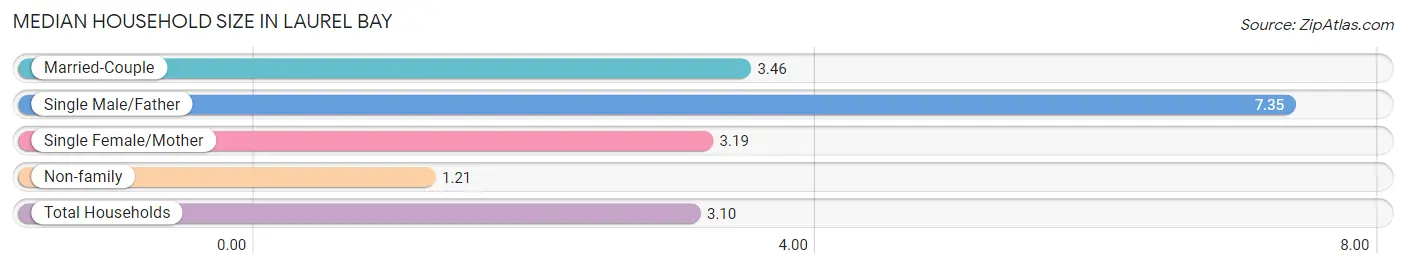
Median Household Size in Laurel Bay
The median household size in Laurel Bay is 3.10 persons per household, with single male/father households (17 | 1.0%) accounting for the largest median household size of 7.35 persons per household. non-family households (267 | 15.0%) represent the smallest median household size with 1.21 persons per household.
| Household Type | # Households | Household Size |
| Married-Couple | 1,122 (63.1%) | 3.46 |
| Single Male/Father | 17 (1.0%) | 7.35 |
| Single Female/Mother | 372 (20.9%) | 3.19 |
| Non-family | 267 (15.0%) | 1.21 |
| Total Households | 1,778 (100.0%) | 3.10 |
Household Size by Marriage Status in Laurel Bay
Out of a total of 1,778 households in Laurel Bay, 1,511 (85.0%) are family households, while 267 (15.0%) are nonfamily households. The most numerous type of family households are 2-person households, comprising 552, and the most common type of nonfamily households are 1-person households, comprising 215.
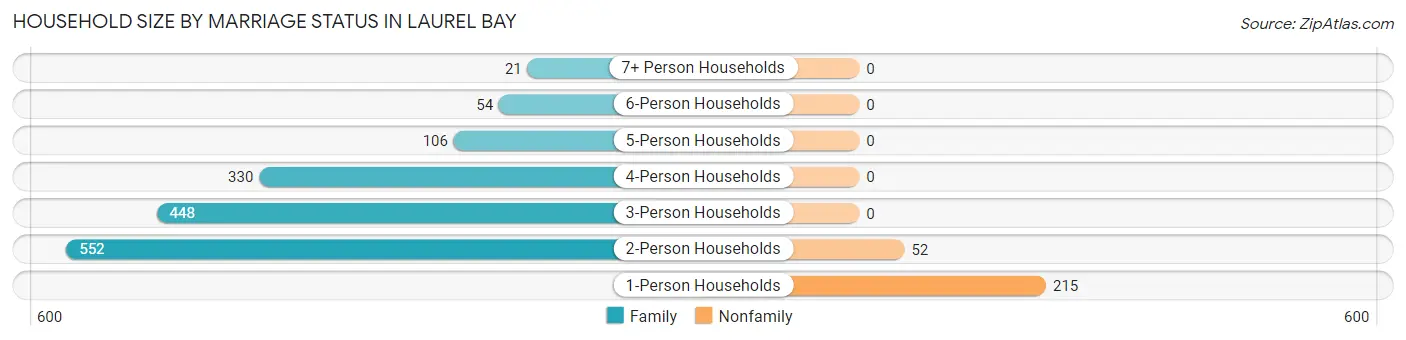
| Household Size | Family Households | Nonfamily Households |
| 1-Person Households | - | 215 (12.1%) |
| 2-Person Households | 552 (31.0%) | 52 (2.9%) |
| 3-Person Households | 448 (25.2%) | 0 (0.0%) |
| 4-Person Households | 330 (18.6%) | 0 (0.0%) |
| 5-Person Households | 106 (6.0%) | 0 (0.0%) |
| 6-Person Households | 54 (3.0%) | 0 (0.0%) |
| 7+ Person Households | 21 (1.2%) | 0 (0.0%) |
| Total | 1,511 (85.0%) | 267 (15.0%) |
Female Fertility in Laurel Bay
Fertility by Age in Laurel Bay
Average fertility rate in Laurel Bay is 101.0 births per 1,000 women. Women in the age bracket of 20 to 34 years have the highest fertility rate with 166.0 births per 1,000 women. Women in the age bracket of 20 to 34 years acount for 100.0% of all women with births.
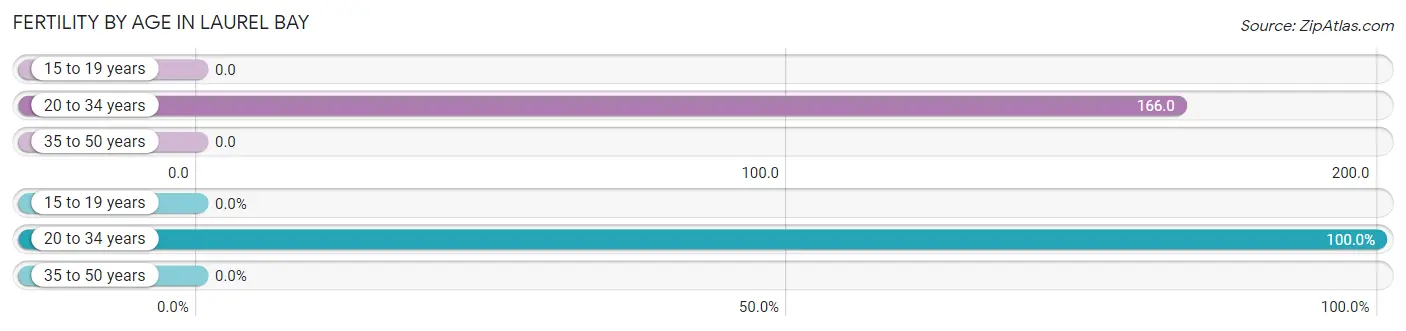
| Age Bracket | Women with Births | Births / 1,000 Women |
| 15 to 19 years | 0 (0.0%) | 0.0 |
| 20 to 34 years | 149 (100.0%) | 166.0 |
| 35 to 50 years | 0 (0.0%) | 0.0 |
| Total | 149 (100.0%) | 101.0 |
Fertility by Age by Marriage Status in Laurel Bay
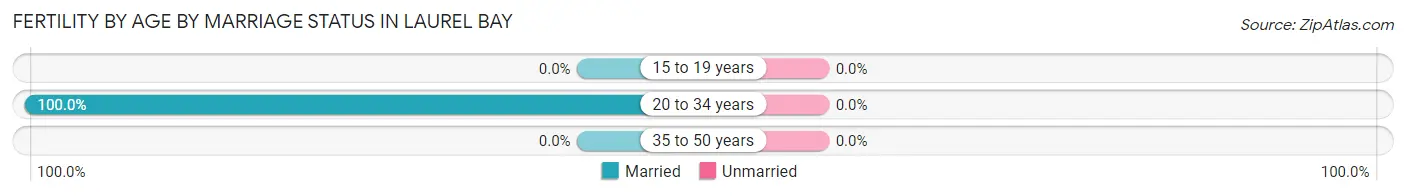
| Age Bracket | Married | Unmarried |
| 15 to 19 years | 0 (0.0%) | 0 (0.0%) |
| 20 to 34 years | 149 (100.0%) | 0 (0.0%) |
| 35 to 50 years | 0 (0.0%) | 0 (0.0%) |
| Total | 149 (100.0%) | 0 (0.0%) |
Fertility by Education in Laurel Bay
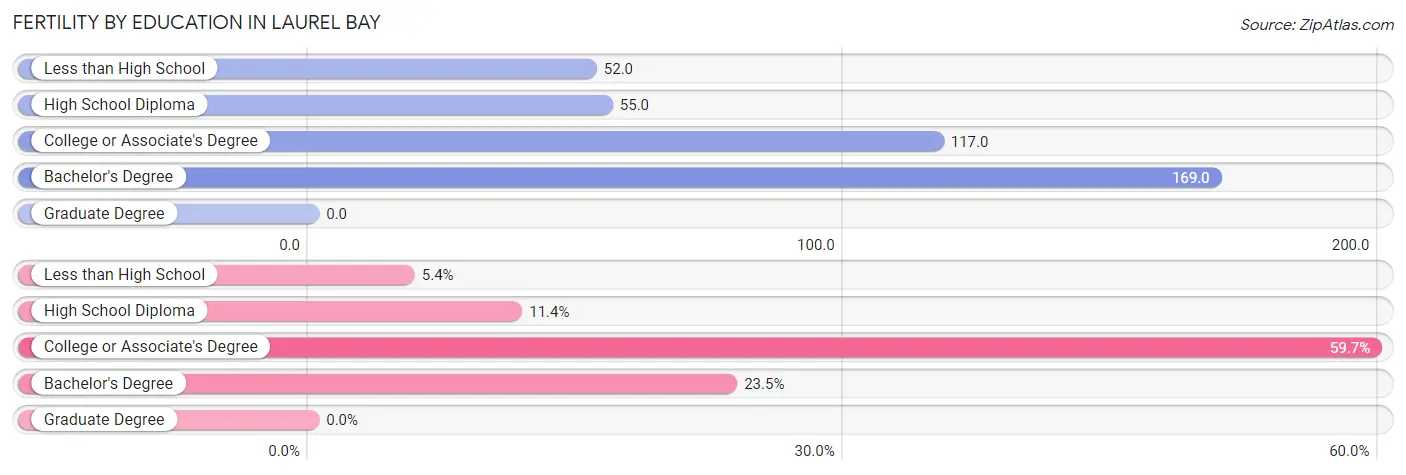
| Educational Attainment | Women with Births | Births / 1,000 Women |
| Less than High School | 8 (5.4%) | 52.0 |
| High School Diploma | 17 (11.4%) | 55.0 |
| College or Associate's Degree | 89 (59.7%) | 117.0 |
| Bachelor's Degree | 35 (23.5%) | 169.0 |
| Graduate Degree | 0 (0.0%) | 0.0 |
| Total | 149 (100.0%) | 101.0 |
Fertility by Education by Marriage Status in Laurel Bay
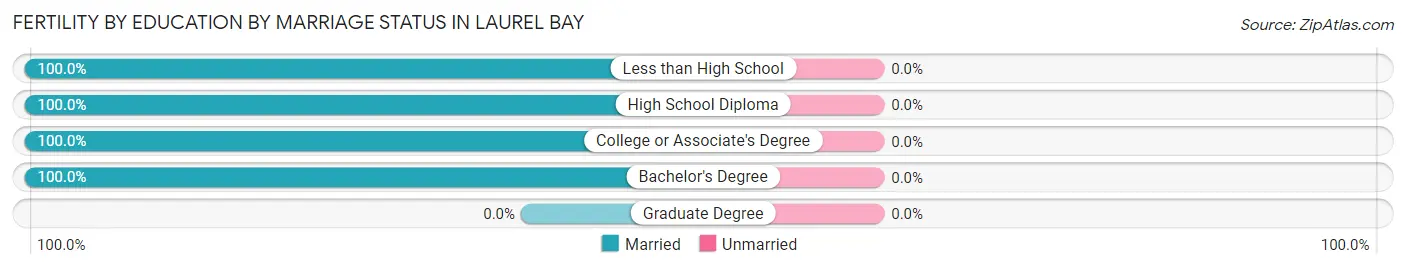
| Educational Attainment | Married | Unmarried |
| Less than High School | 8 (100.0%) | 0 (0.0%) |
| High School Diploma | 17 (100.0%) | 0 (0.0%) |
| College or Associate's Degree | 89 (100.0%) | 0 (0.0%) |
| Bachelor's Degree | 35 (100.0%) | 0 (0.0%) |
| Graduate Degree | 0 (0.0%) | 0 (0.0%) |
| Total | 149 (100.0%) | 0 (0.0%) |
Employment Characteristics in Laurel Bay
Employment by Class of Employer in Laurel Bay
Among the 2,462 employed individuals in Laurel Bay, private company employees (1,278 | 51.9%), federal government employees (809 | 32.9%), and local government employees (154 | 6.3%) make up the most common classes of employment.
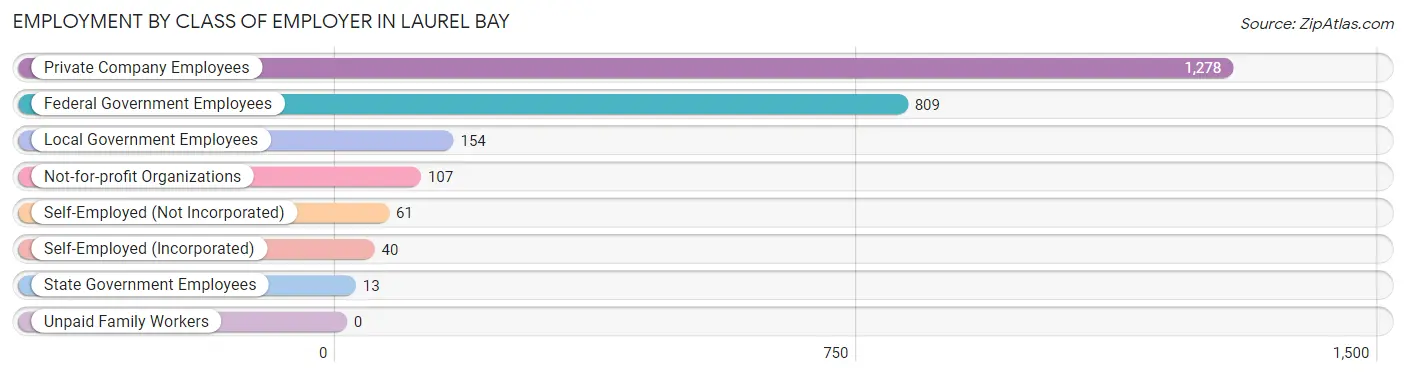
| Employer Class | # Employees | % Employees |
| Private Company Employees | 1,278 | 51.9% |
| Self-Employed (Incorporated) | 40 | 1.6% |
| Self-Employed (Not Incorporated) | 61 | 2.5% |
| Not-for-profit Organizations | 107 | 4.3% |
| Local Government Employees | 154 | 6.3% |
| State Government Employees | 13 | 0.5% |
| Federal Government Employees | 809 | 32.9% |
| Unpaid Family Workers | 0 | 0.0% |
| Total | 2,462 | 100.0% |
Employment Status by Age in Laurel Bay
According to the labor force statistics for Laurel Bay, out of the total population over 16 years of age (3,830), 65.4% or 2,505 individuals are in the labor force, with 2.3% or 58 of them unemployed. The age group with the highest labor force participation rate is 45 to 54 years, with 96.1% or 341 individuals in the labor force. Within the labor force, the 16 to 19 years age range has the highest percentage of unemployed individuals, with 8.5% or 29 of them being unemployed.
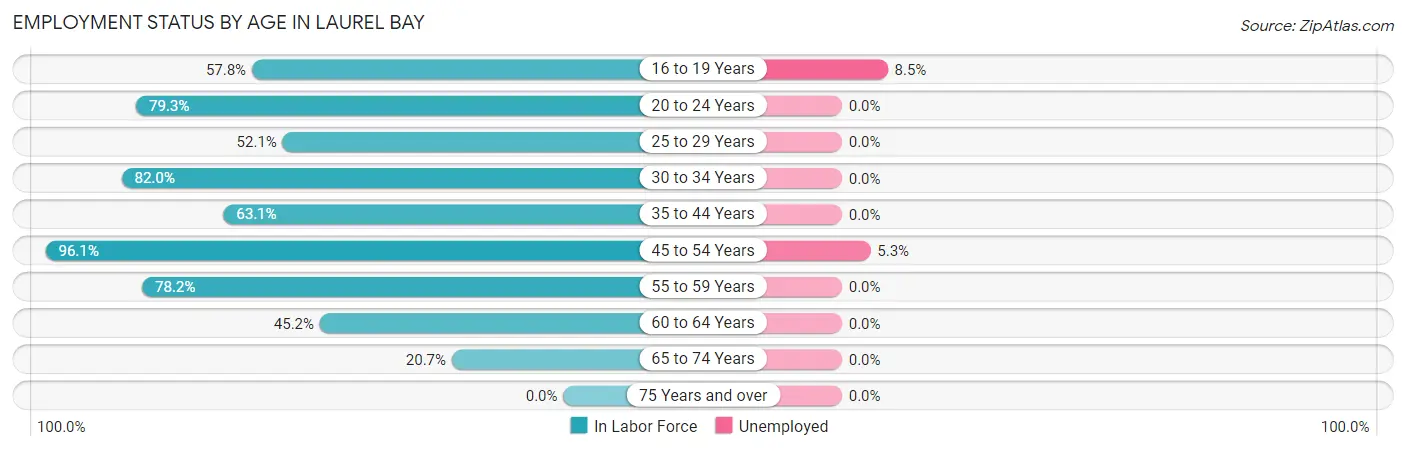
| Age Bracket | In Labor Force | Unemployed |
| 16 to 19 Years | 347 (57.8%) | 29 (8.5%) |
| 20 to 24 Years | 668 (79.3%) | 0 (0.0%) |
| 25 to 29 Years | 241 (52.1%) | 0 (0.0%) |
| 30 to 34 Years | 228 (82.0%) | 0 (0.0%) |
| 35 to 44 Years | 426 (63.1%) | 0 (0.0%) |
| 45 to 54 Years | 341 (96.1%) | 18 (5.3%) |
| 55 to 59 Years | 136 (78.2%) | 0 (0.0%) |
| 60 to 64 Years | 99 (45.2%) | 0 (0.0%) |
| 65 to 74 Years | 19 (20.7%) | 0 (0.0%) |
| 75 Years and over | 0 (0.0%) | 0 (0.0%) |
| Total | 2,505 (65.4%) | 58 (2.3%) |
Employment Status by Educational Attainment in Laurel Bay
According to labor force statistics for Laurel Bay, 68.0% of individuals (1,472) out of the total population between 25 and 64 years of age (2,164) are in the labor force, with 1.5% or 22 of them being unemployed. The group with the highest labor force participation rate are those with the educational attainment of bachelor's degree or higher, with 75.1% or 304 individuals in the labor force. Within the labor force, individuals with college / associate degree education have the highest percentage of unemployment, with 2.9% or 24 of them being unemployed.
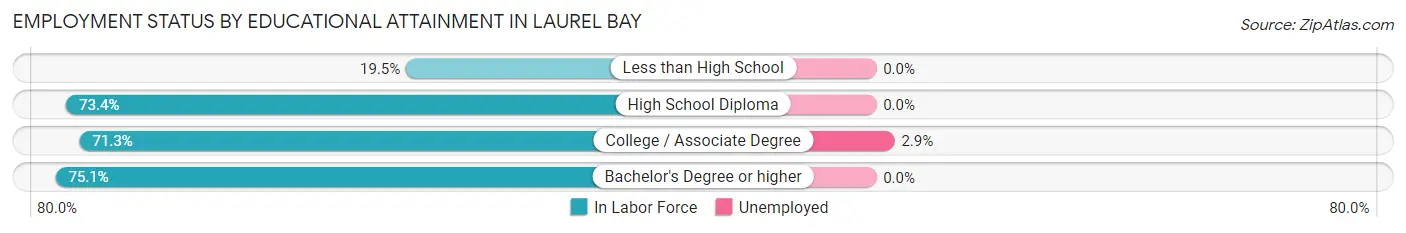
| Educational Attainment | In Labor Force | Unemployed |
| Less than High School | 36 (19.5%) | 0 (0.0%) |
| High School Diploma | 314 (73.4%) | 0 (0.0%) |
| College / Associate Degree | 817 (71.3%) | 33 (2.9%) |
| Bachelor's Degree or higher | 304 (75.1%) | 0 (0.0%) |
| Total | 1,472 (68.0%) | 32 (1.5%) |
Employment Occupations by Sex in Laurel Bay
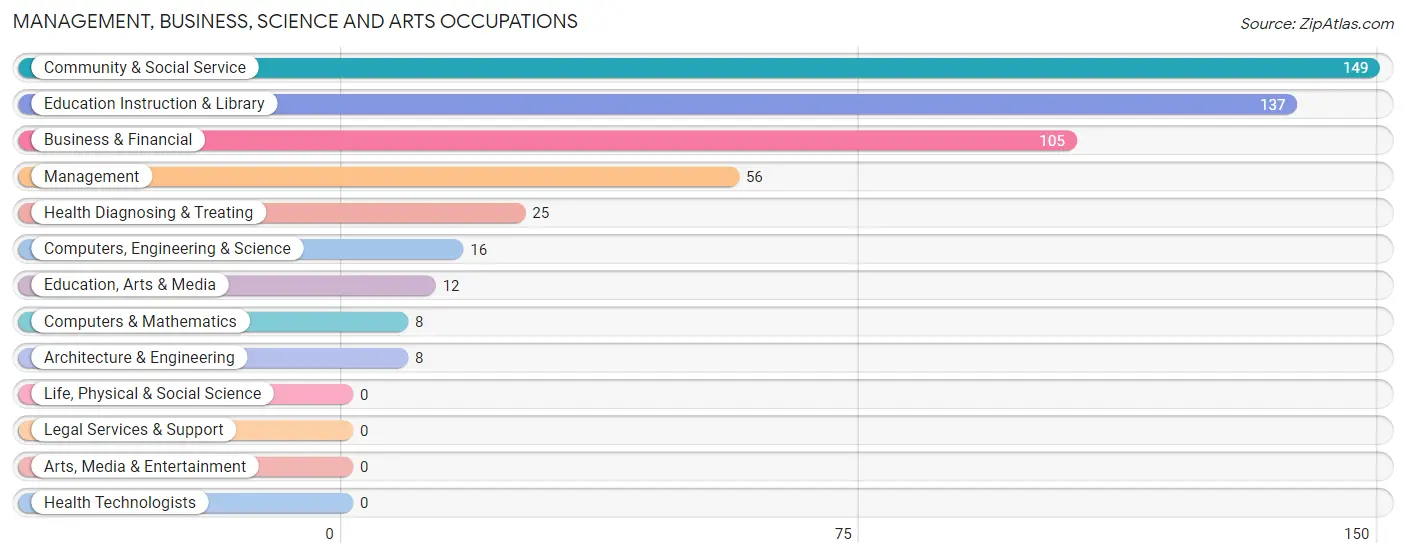
Management, Business, Science and Arts Occupations
The most common Management, Business, Science and Arts occupations in Laurel Bay are Community & Social Service (149 | 8.2%), Education Instruction & Library (137 | 7.6%), Business & Financial (105 | 5.8%), Management (56 | 3.1%), and Health Diagnosing & Treating (25 | 1.4%).
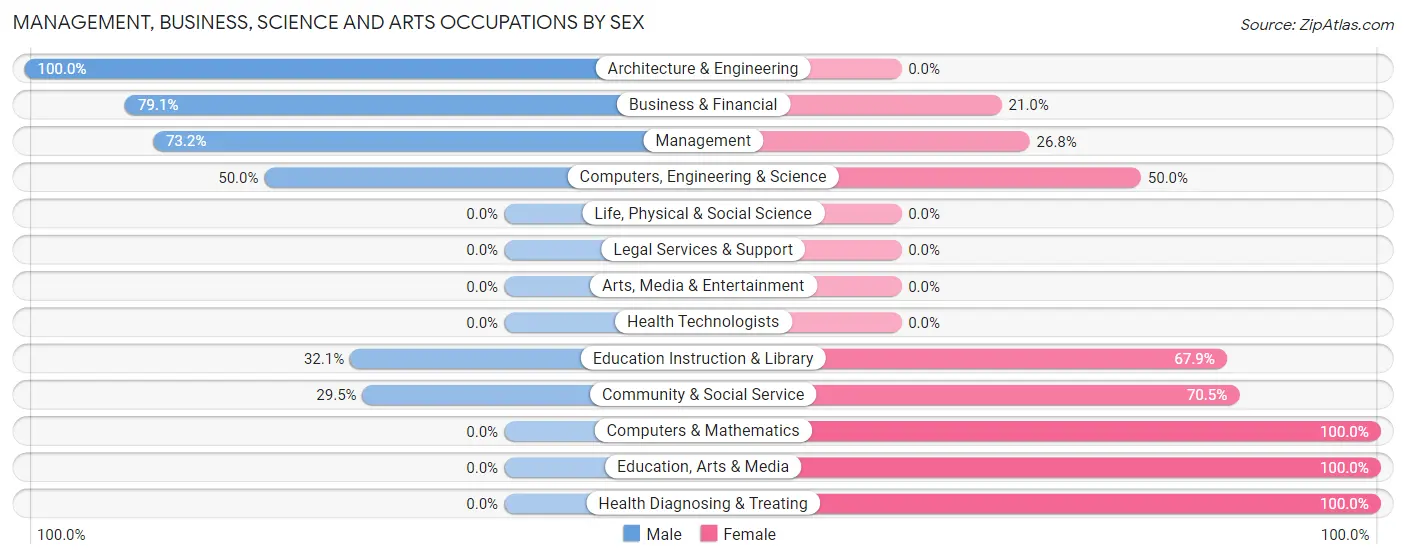
Management, Business, Science and Arts Occupations by Sex
Within the Management, Business, Science and Arts occupations in Laurel Bay, the most male-oriented occupations are Architecture & Engineering (100.0%), Business & Financial (79.0%), and Management (73.2%), while the most female-oriented occupations are Computers & Mathematics (100.0%), Education, Arts & Media (100.0%), and Health Diagnosing & Treating (100.0%).
| Occupation | Male | Female |
| Management | 41 (73.2%) | 15 (26.8%) |
| Business & Financial | 83 (79.0%) | 22 (20.9%) |
| Computers, Engineering & Science | 8 (50.0%) | 8 (50.0%) |
| Computers & Mathematics | 0 (0.0%) | 8 (100.0%) |
| Architecture & Engineering | 8 (100.0%) | 0 (0.0%) |
| Life, Physical & Social Science | 0 (0.0%) | 0 (0.0%) |
| Community & Social Service | 44 (29.5%) | 105 (70.5%) |
| Education, Arts & Media | 0 (0.0%) | 12 (100.0%) |
| Legal Services & Support | 0 (0.0%) | 0 (0.0%) |
| Education Instruction & Library | 44 (32.1%) | 93 (67.9%) |
| Arts, Media & Entertainment | 0 (0.0%) | 0 (0.0%) |
| Health Diagnosing & Treating | 0 (0.0%) | 25 (100.0%) |
| Health Technologists | 0 (0.0%) | 0 (0.0%) |
| Total (Category) | 176 (50.1%) | 175 (49.9%) |
| Total (Overall) | 802 (44.3%) | 1,008 (55.7%) |
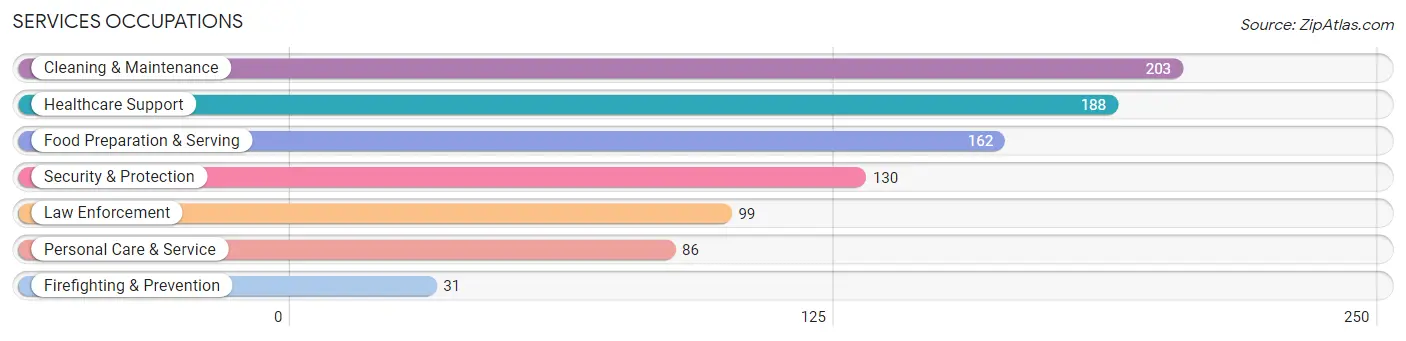
Services Occupations
The most common Services occupations in Laurel Bay are Cleaning & Maintenance (203 | 11.2%), Healthcare Support (188 | 10.4%), Food Preparation & Serving (162 | 8.9%), Security & Protection (130 | 7.2%), and Law Enforcement (99 | 5.5%).
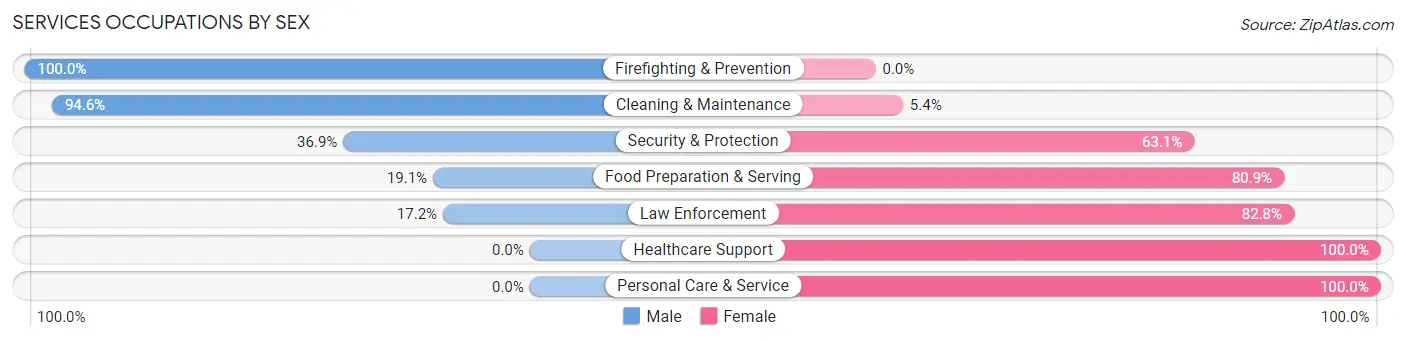
Services Occupations by Sex
Within the Services occupations in Laurel Bay, the most male-oriented occupations are Firefighting & Prevention (100.0%), Cleaning & Maintenance (94.6%), and Security & Protection (36.9%), while the most female-oriented occupations are Healthcare Support (100.0%), Personal Care & Service (100.0%), and Law Enforcement (82.8%).
| Occupation | Male | Female |
| Healthcare Support | 0 (0.0%) | 188 (100.0%) |
| Security & Protection | 48 (36.9%) | 82 (63.1%) |
| Firefighting & Prevention | 31 (100.0%) | 0 (0.0%) |
| Law Enforcement | 17 (17.2%) | 82 (82.8%) |
| Food Preparation & Serving | 31 (19.1%) | 131 (80.9%) |
| Cleaning & Maintenance | 192 (94.6%) | 11 (5.4%) |
| Personal Care & Service | 0 (0.0%) | 86 (100.0%) |
| Total (Category) | 271 (35.2%) | 498 (64.8%) |
| Total (Overall) | 802 (44.3%) | 1,008 (55.7%) |
Sales and Office Occupations
The most common Sales and Office occupations in Laurel Bay are Sales & Related (195 | 10.8%), and Office & Administration (125 | 6.9%).
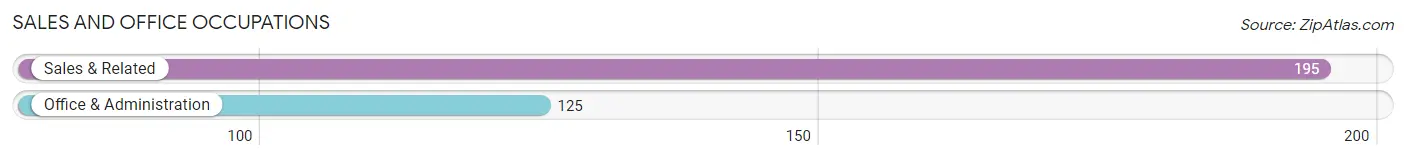
Sales and Office Occupations by Sex
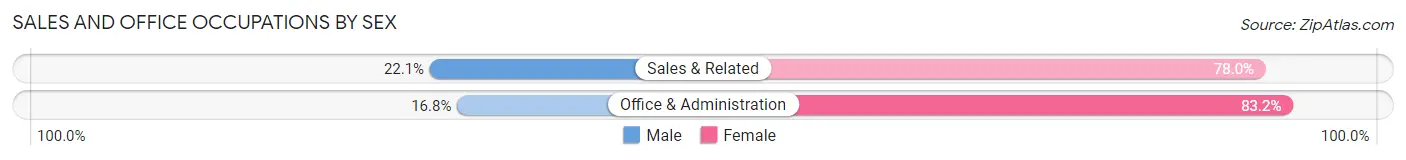
| Occupation | Male | Female |
| Sales & Related | 43 (22.1%) | 152 (77.9%) |
| Office & Administration | 21 (16.8%) | 104 (83.2%) |
| Total (Category) | 64 (20.0%) | 256 (80.0%) |
| Total (Overall) | 802 (44.3%) | 1,008 (55.7%) |
Natural Resources, Construction and Maintenance Occupations
The most common Natural Resources, Construction and Maintenance occupations in Laurel Bay are Installation, Maintenance & Repair (27 | 1.5%), and Construction & Extraction (23 | 1.3%).
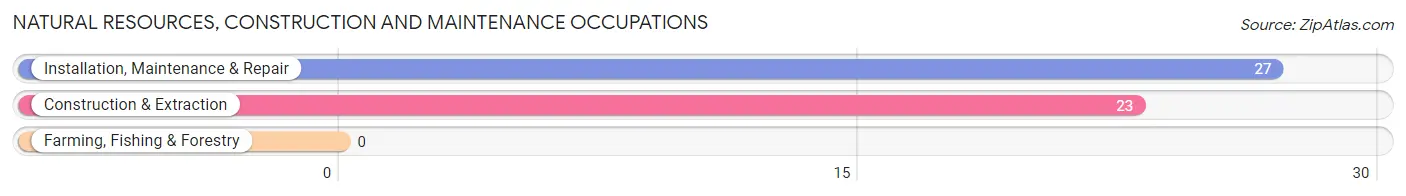
Natural Resources, Construction and Maintenance Occupations by Sex
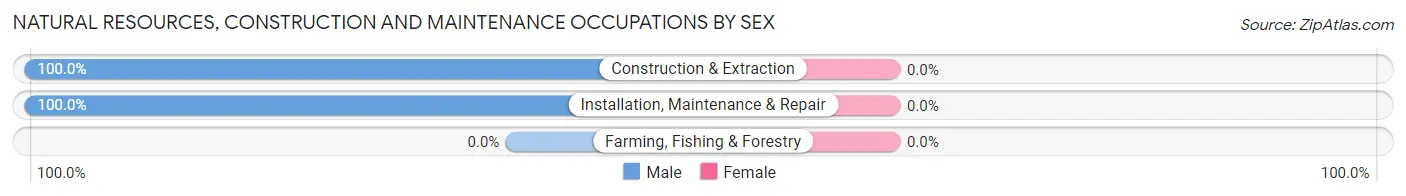
| Occupation | Male | Female |
| Farming, Fishing & Forestry | 0 (0.0%) | 0 (0.0%) |
| Construction & Extraction | 23 (100.0%) | 0 (0.0%) |
| Installation, Maintenance & Repair | 27 (100.0%) | 0 (0.0%) |
| Total (Category) | 50 (100.0%) | 0 (0.0%) |
| Total (Overall) | 802 (44.3%) | 1,008 (55.7%) |
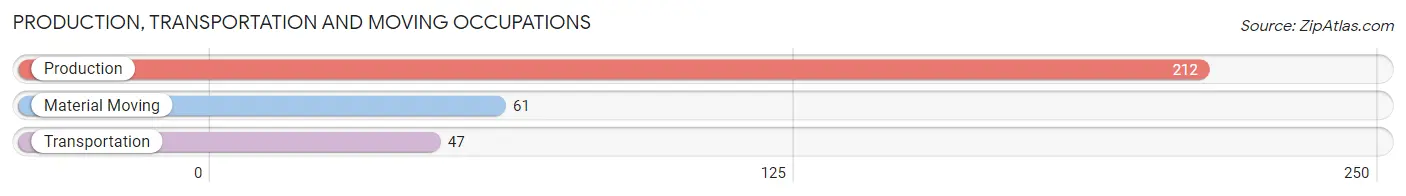
Production, Transportation and Moving Occupations
The most common Production, Transportation and Moving occupations in Laurel Bay are Production (212 | 11.7%), Material Moving (61 | 3.4%), and Transportation (47 | 2.6%).
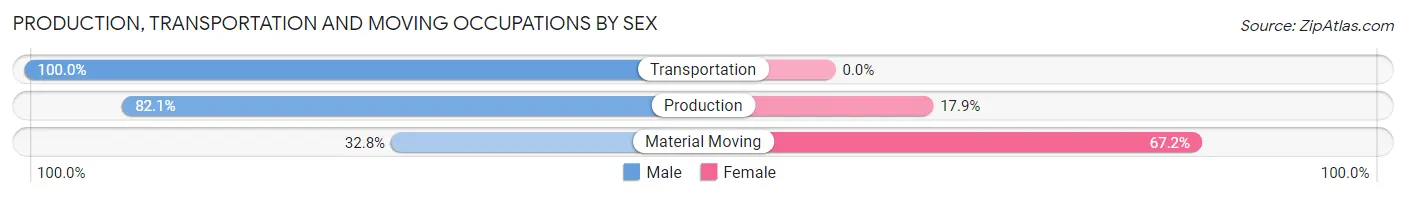
Production, Transportation and Moving Occupations by Sex
| Occupation | Male | Female |
| Production | 174 (82.1%) | 38 (17.9%) |
| Transportation | 47 (100.0%) | 0 (0.0%) |
| Material Moving | 20 (32.8%) | 41 (67.2%) |
| Total (Category) | 241 (75.3%) | 79 (24.7%) |
| Total (Overall) | 802 (44.3%) | 1,008 (55.7%) |
Employment Industries by Sex in Laurel Bay
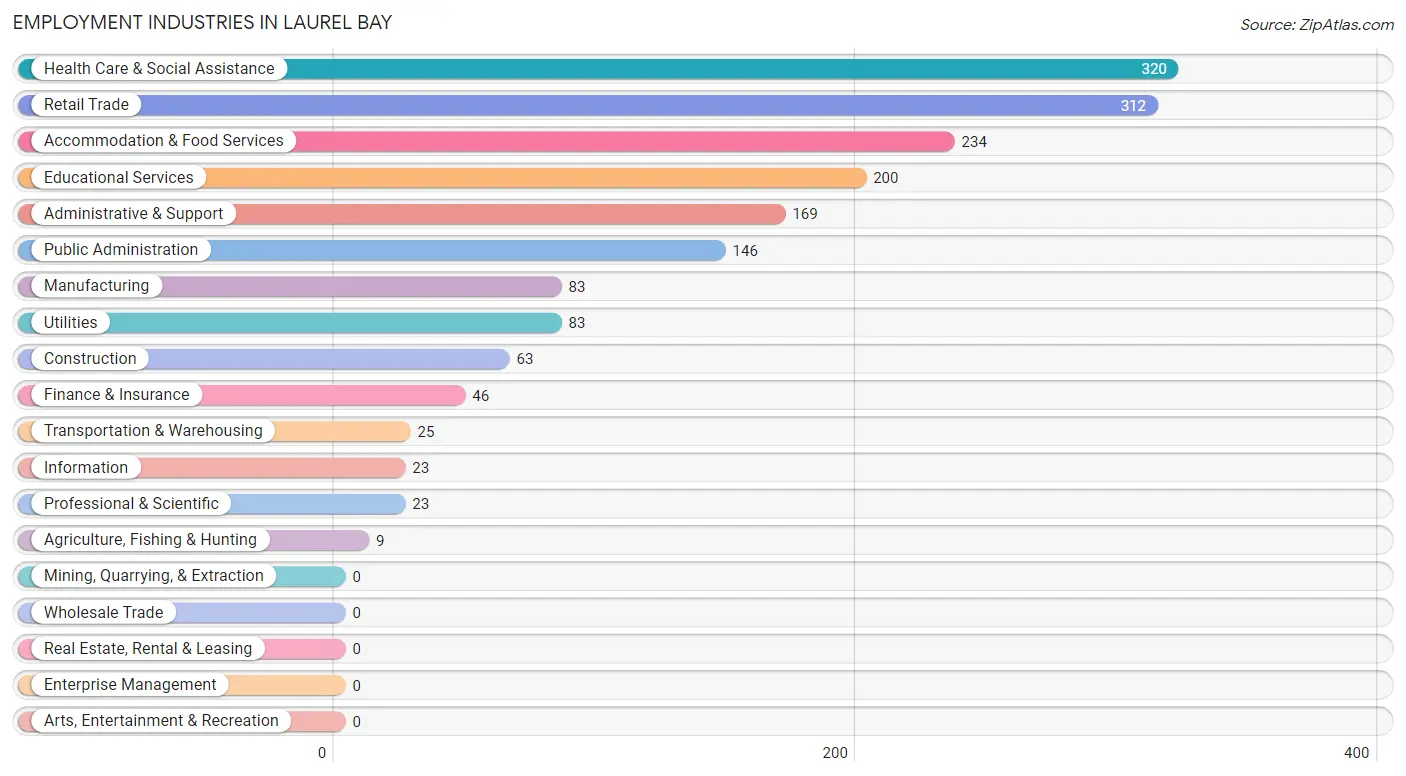
Employment Industries in Laurel Bay
The major employment industries in Laurel Bay include Health Care & Social Assistance (320 | 17.7%), Retail Trade (312 | 17.2%), Accommodation & Food Services (234 | 12.9%), Educational Services (200 | 11.1%), and Administrative & Support (169 | 9.3%).
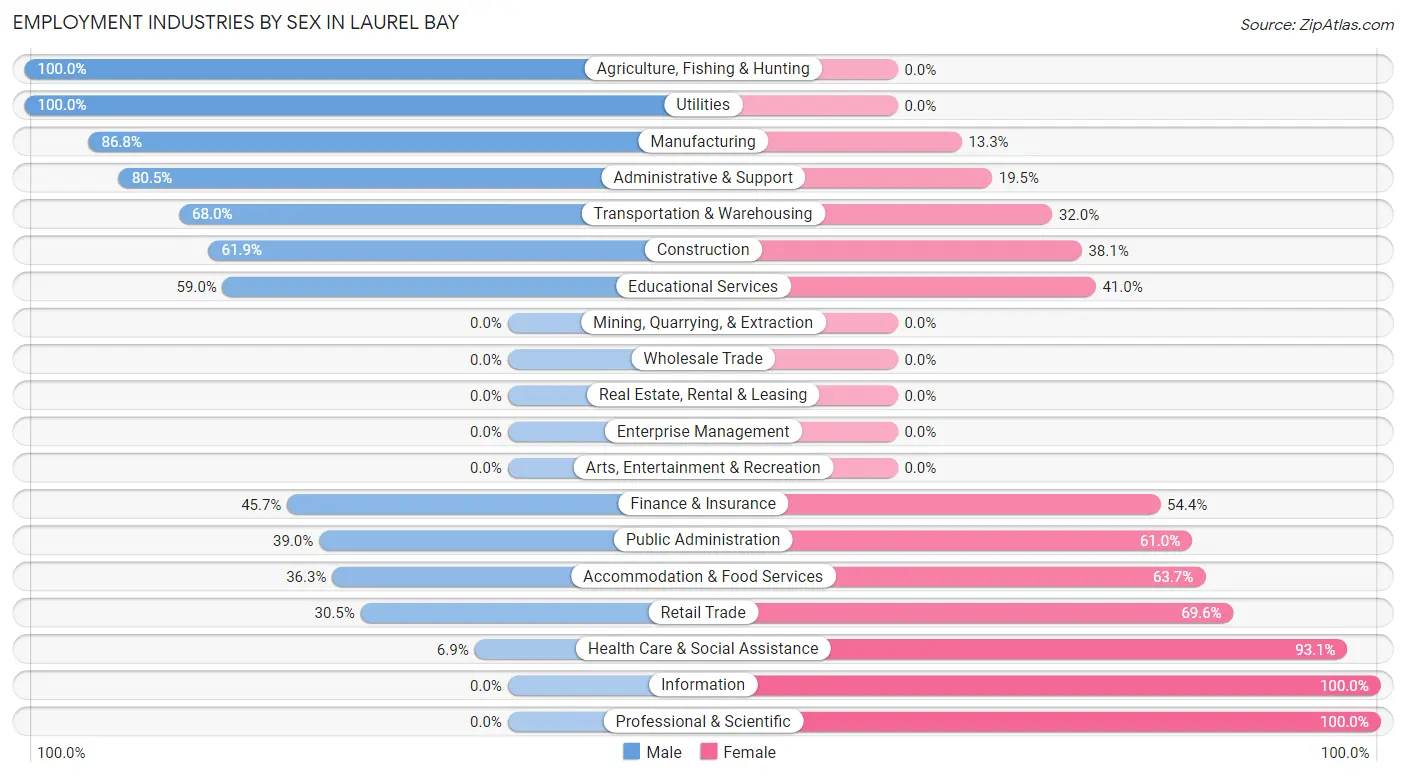
Employment Industries by Sex in Laurel Bay
The Laurel Bay industries that see more men than women are Agriculture, Fishing & Hunting (100.0%), Utilities (100.0%), and Manufacturing (86.8%), whereas the industries that tend to have a higher number of women are Information (100.0%), Professional & Scientific (100.0%), and Health Care & Social Assistance (93.1%).
| Industry | Male | Female |
| Agriculture, Fishing & Hunting | 9 (100.0%) | 0 (0.0%) |
| Mining, Quarrying, & Extraction | 0 (0.0%) | 0 (0.0%) |
| Construction | 39 (61.9%) | 24 (38.1%) |
| Manufacturing | 72 (86.8%) | 11 (13.3%) |
| Wholesale Trade | 0 (0.0%) | 0 (0.0%) |
| Retail Trade | 95 (30.4%) | 217 (69.6%) |
| Transportation & Warehousing | 17 (68.0%) | 8 (32.0%) |
| Utilities | 83 (100.0%) | 0 (0.0%) |
| Information | 0 (0.0%) | 23 (100.0%) |
| Finance & Insurance | 21 (45.7%) | 25 (54.3%) |
| Real Estate, Rental & Leasing | 0 (0.0%) | 0 (0.0%) |
| Professional & Scientific | 0 (0.0%) | 23 (100.0%) |
| Enterprise Management | 0 (0.0%) | 0 (0.0%) |
| Administrative & Support | 136 (80.5%) | 33 (19.5%) |
| Educational Services | 118 (59.0%) | 82 (41.0%) |
| Health Care & Social Assistance | 22 (6.9%) | 298 (93.1%) |
| Arts, Entertainment & Recreation | 0 (0.0%) | 0 (0.0%) |
| Accommodation & Food Services | 85 (36.3%) | 149 (63.7%) |
| Public Administration | 57 (39.0%) | 89 (61.0%) |
| Total | 802 (44.3%) | 1,008 (55.7%) |
Education in Laurel Bay
School Enrollment in Laurel Bay
The most common levels of schooling among the 1,739 students in Laurel Bay are middle school (608 | 35.0%), college / undergraduate (363 | 20.9%), and high school (310 | 17.8%).
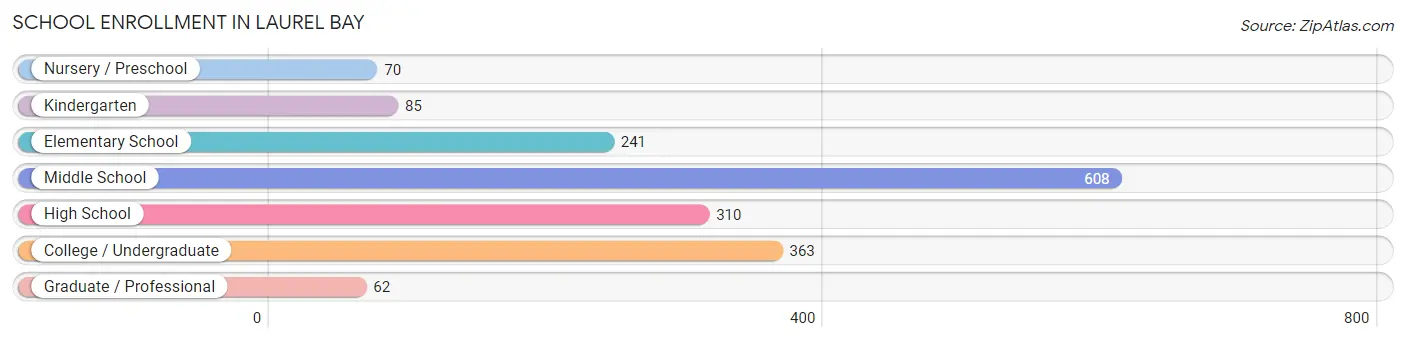
| School Level | # Students | % Students |
| Nursery / Preschool | 70 | 4.0% |
| Kindergarten | 85 | 4.9% |
| Elementary School | 241 | 13.9% |
| Middle School | 608 | 35.0% |
| High School | 310 | 17.8% |
| College / Undergraduate | 363 | 20.9% |
| Graduate / Professional | 62 | 3.6% |
| Total | 1,739 | 100.0% |
School Enrollment by Age by Funding Source in Laurel Bay
Out of a total of 1,739 students who are enrolled in schools in Laurel Bay, 332 (19.1%) attend a private institution, while the remaining 1,407 (80.9%) are enrolled in public schools. The age group of 35 years and over has the highest likelihood of being enrolled in private schools, with 35 (44.9% in the age bracket) enrolled. Conversely, the age group of 15 to 17 year olds has the lowest likelihood of being enrolled in a private school, with 151 (100.0% in the age bracket) attending a public institution.
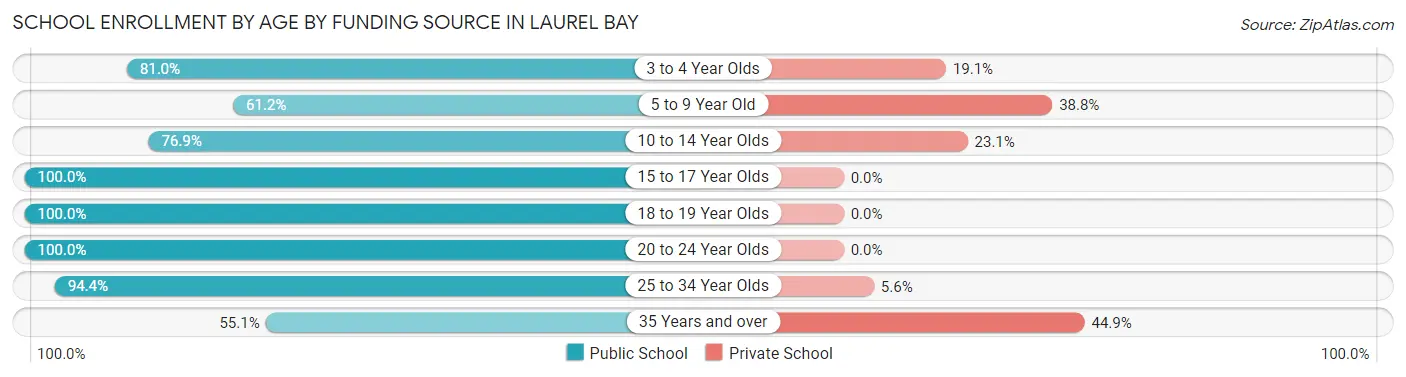
| Age Bracket | Public School | Private School |
| 3 to 4 Year Olds | 34 (80.9%) | 8 (19.1%) |
| 5 to 9 Year Old | 222 (61.2%) | 141 (38.8%) |
| 10 to 14 Year Olds | 470 (76.9%) | 141 (23.1%) |
| 15 to 17 Year Olds | 151 (100.0%) | 0 (0.0%) |
| 18 to 19 Year Olds | 249 (100.0%) | 0 (0.0%) |
| 20 to 24 Year Olds | 103 (100.0%) | 0 (0.0%) |
| 25 to 34 Year Olds | 134 (94.4%) | 8 (5.6%) |
| 35 Years and over | 43 (55.1%) | 35 (44.9%) |
| Total | 1,407 (80.9%) | 332 (19.1%) |
Educational Attainment by Field of Study in Laurel Bay
Science & technology (116 | 27.8%), education (91 | 21.8%), bio, nature & agricultural (48 | 11.5%), business (45 | 10.8%), and arts & humanities (36 | 8.6%) are the most common fields of study among 417 individuals in Laurel Bay who have obtained a bachelor's degree or higher.
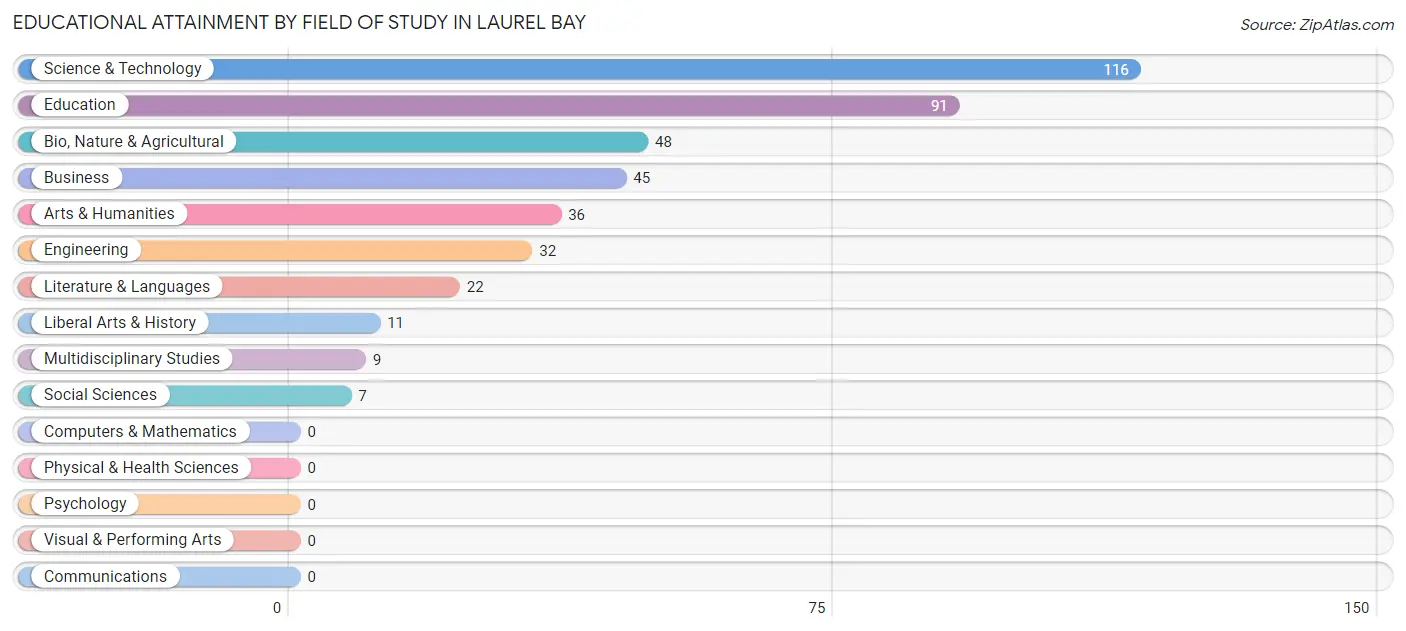
| Field of Study | # Graduates | % Graduates |
| Computers & Mathematics | 0 | 0.0% |
| Bio, Nature & Agricultural | 48 | 11.5% |
| Physical & Health Sciences | 0 | 0.0% |
| Psychology | 0 | 0.0% |
| Social Sciences | 7 | 1.7% |
| Engineering | 32 | 7.7% |
| Multidisciplinary Studies | 9 | 2.2% |
| Science & Technology | 116 | 27.8% |
| Business | 45 | 10.8% |
| Education | 91 | 21.8% |
| Literature & Languages | 22 | 5.3% |
| Liberal Arts & History | 11 | 2.6% |
| Visual & Performing Arts | 0 | 0.0% |
| Communications | 0 | 0.0% |
| Arts & Humanities | 36 | 8.6% |
| Total | 417 | 100.0% |
Transportation & Commute in Laurel Bay
Vehicle Availability by Sex in Laurel Bay
The most prevalent vehicle ownership categories in Laurel Bay are males with 2 vehicles (776, accounting for 55.0%) and females with 2 vehicles (480, making up 73.8%).
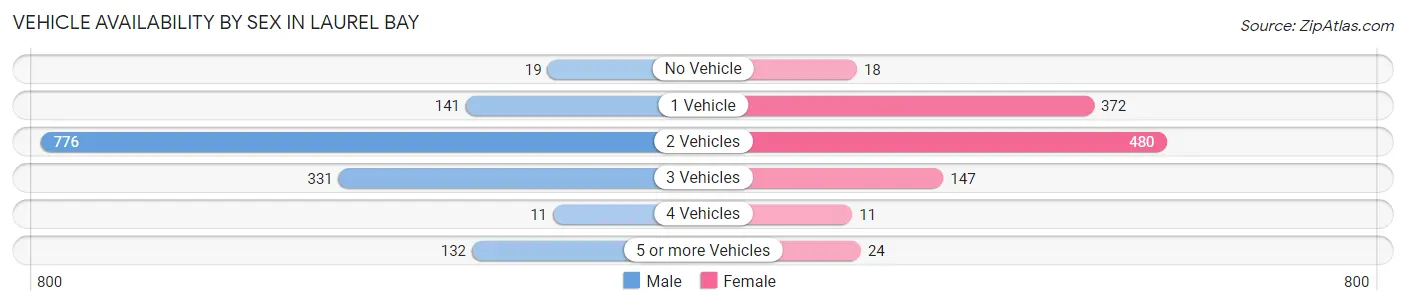
| Vehicles Available | Male | Female |
| No Vehicle | 19 (1.3%) | 18 (1.7%) |
| 1 Vehicle | 141 (10.0%) | 372 (35.4%) |
| 2 Vehicles | 776 (55.0%) | 480 (45.6%) |
| 3 Vehicles | 331 (23.5%) | 147 (14.0%) |
| 4 Vehicles | 11 (0.8%) | 11 (1.1%) |
| 5 or more Vehicles | 132 (9.4%) | 24 (2.3%) |
| Total | 1,410 (100.0%) | 1,052 (100.0%) |
Commute Time in Laurel Bay
The most frequently occuring commute durations in Laurel Bay are 30 to 34 minutes (496 commuters, 20.5%), 20 to 24 minutes (421 commuters, 17.4%), and 15 to 19 minutes (420 commuters, 17.3%).
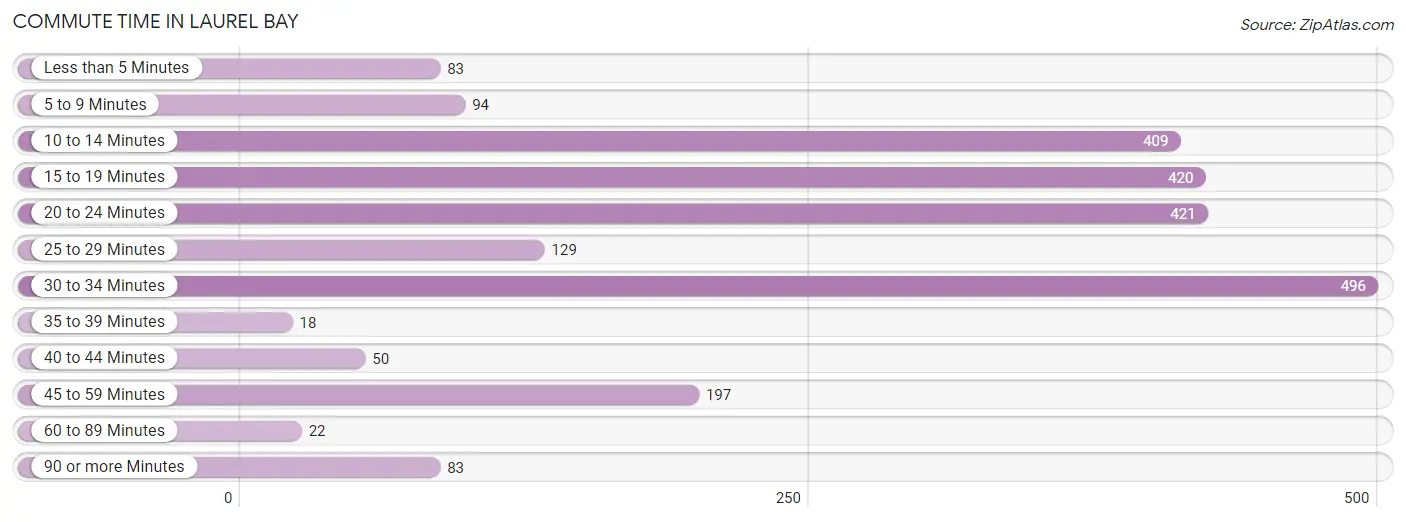
| Commute Time | # Commuters | % Commuters |
| Less than 5 Minutes | 83 | 3.4% |
| 5 to 9 Minutes | 94 | 3.9% |
| 10 to 14 Minutes | 409 | 16.9% |
| 15 to 19 Minutes | 420 | 17.3% |
| 20 to 24 Minutes | 421 | 17.4% |
| 25 to 29 Minutes | 129 | 5.3% |
| 30 to 34 Minutes | 496 | 20.5% |
| 35 to 39 Minutes | 18 | 0.7% |
| 40 to 44 Minutes | 50 | 2.1% |
| 45 to 59 Minutes | 197 | 8.1% |
| 60 to 89 Minutes | 22 | 0.9% |
| 90 or more Minutes | 83 | 3.4% |
Commute Time by Sex in Laurel Bay
The most common commute times in Laurel Bay are 10 to 14 minutes (284 commuters, 20.1%) for males and 20 to 24 minutes (255 commuters, 25.2%) for females.
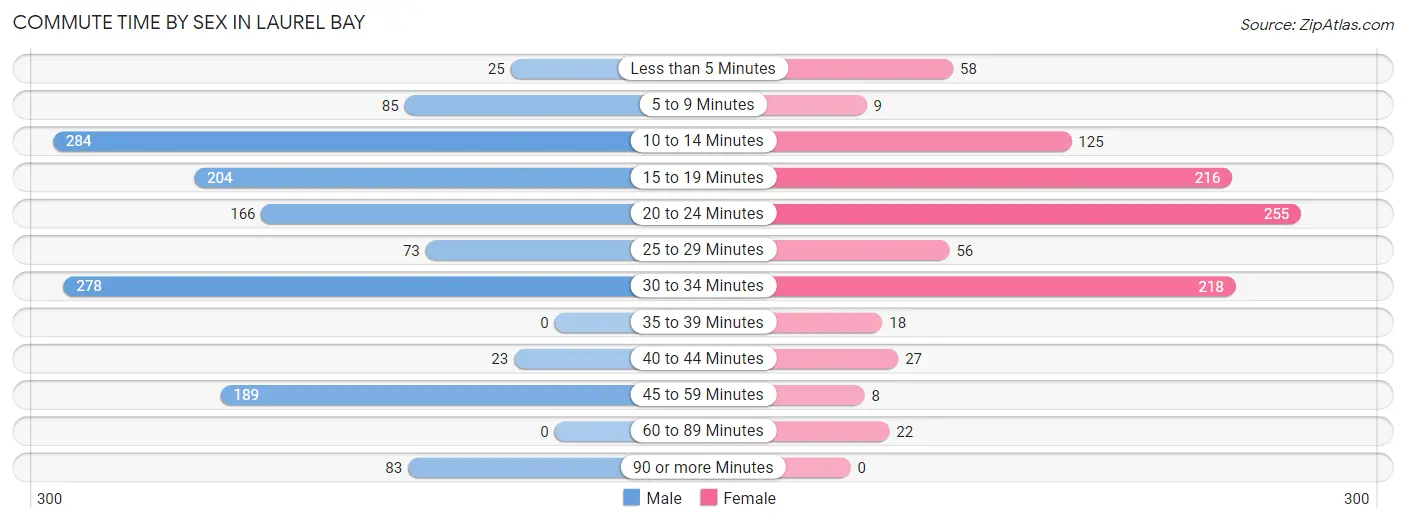
| Commute Time | Male | Female |
| Less than 5 Minutes | 25 (1.8%) | 58 (5.7%) |
| 5 to 9 Minutes | 85 (6.0%) | 9 (0.9%) |
| 10 to 14 Minutes | 284 (20.1%) | 125 (12.3%) |
| 15 to 19 Minutes | 204 (14.5%) | 216 (21.3%) |
| 20 to 24 Minutes | 166 (11.8%) | 255 (25.2%) |
| 25 to 29 Minutes | 73 (5.2%) | 56 (5.5%) |
| 30 to 34 Minutes | 278 (19.7%) | 218 (21.5%) |
| 35 to 39 Minutes | 0 (0.0%) | 18 (1.8%) |
| 40 to 44 Minutes | 23 (1.6%) | 27 (2.7%) |
| 45 to 59 Minutes | 189 (13.4%) | 8 (0.8%) |
| 60 to 89 Minutes | 0 (0.0%) | 22 (2.2%) |
| 90 or more Minutes | 83 (5.9%) | 0 (0.0%) |
Time of Departure to Work by Sex in Laurel Bay
The most frequent times of departure to work in Laurel Bay are 6:30 AM to 6:59 AM (443, 31.4%) for males and 6:30 AM to 6:59 AM (215, 21.2%) for females.
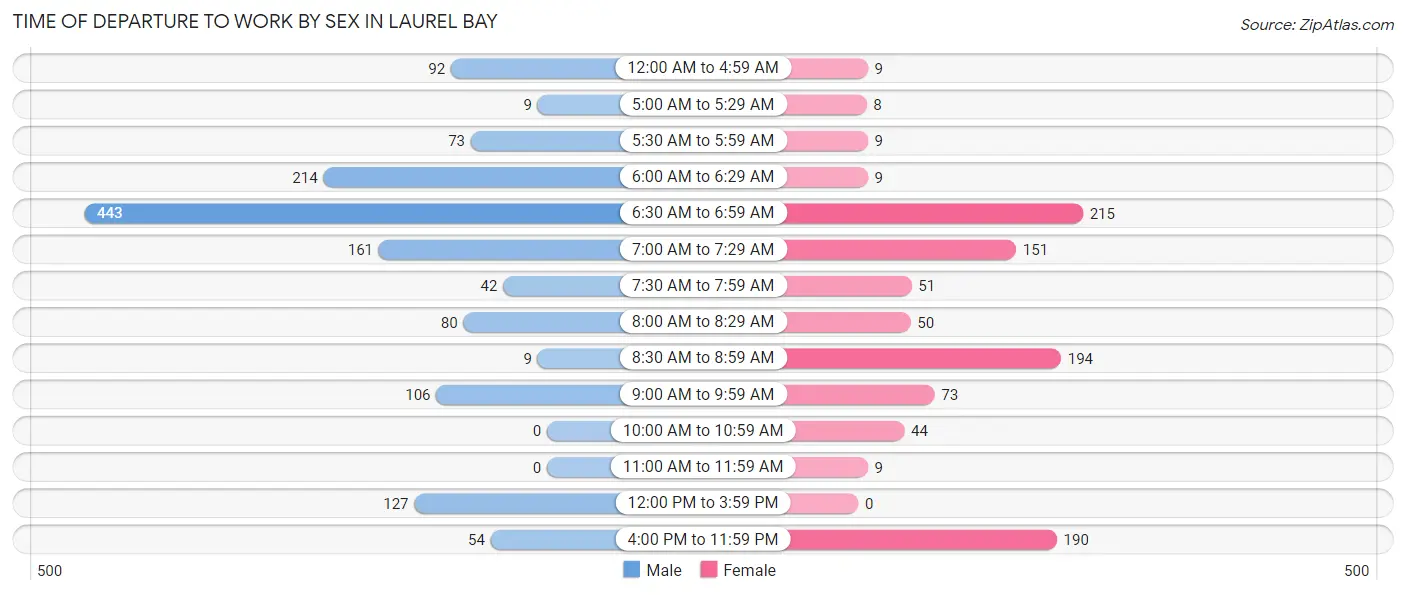
| Time of Departure | Male | Female |
| 12:00 AM to 4:59 AM | 92 (6.5%) | 9 (0.9%) |
| 5:00 AM to 5:29 AM | 9 (0.6%) | 8 (0.8%) |
| 5:30 AM to 5:59 AM | 73 (5.2%) | 9 (0.9%) |
| 6:00 AM to 6:29 AM | 214 (15.2%) | 9 (0.9%) |
| 6:30 AM to 6:59 AM | 443 (31.4%) | 215 (21.2%) |
| 7:00 AM to 7:29 AM | 161 (11.4%) | 151 (14.9%) |
| 7:30 AM to 7:59 AM | 42 (3.0%) | 51 (5.0%) |
| 8:00 AM to 8:29 AM | 80 (5.7%) | 50 (4.9%) |
| 8:30 AM to 8:59 AM | 9 (0.6%) | 194 (19.2%) |
| 9:00 AM to 9:59 AM | 106 (7.5%) | 73 (7.2%) |
| 10:00 AM to 10:59 AM | 0 (0.0%) | 44 (4.3%) |
| 11:00 AM to 11:59 AM | 0 (0.0%) | 9 (0.9%) |
| 12:00 PM to 3:59 PM | 127 (9.0%) | 0 (0.0%) |
| 4:00 PM to 11:59 PM | 54 (3.8%) | 190 (18.8%) |
| Total | 1,410 (100.0%) | 1,012 (100.0%) |
Housing Occupancy in Laurel Bay
Occupancy by Ownership in Laurel Bay
Of the total 1,778 dwellings in Laurel Bay, owner-occupied units account for 455 (25.6%), while renter-occupied units make up 1,323 (74.4%).
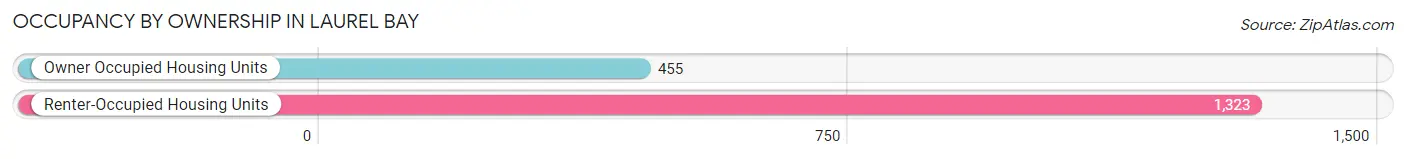
| Occupancy | # Housing Units | % Housing Units |
| Owner Occupied Housing Units | 455 | 25.6% |
| Renter-Occupied Housing Units | 1,323 | 74.4% |
| Total Occupied Housing Units | 1,778 | 100.0% |
Occupancy by Household Size in Laurel Bay
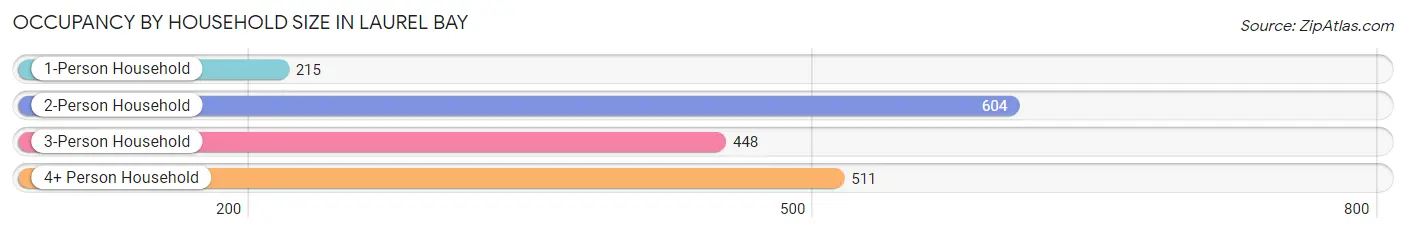
| Household Size | # Housing Units | % Housing Units |
| 1-Person Household | 215 | 12.1% |
| 2-Person Household | 604 | 34.0% |
| 3-Person Household | 448 | 25.2% |
| 4+ Person Household | 511 | 28.7% |
| Total Housing Units | 1,778 | 100.0% |
Occupancy by Ownership by Household Size in Laurel Bay
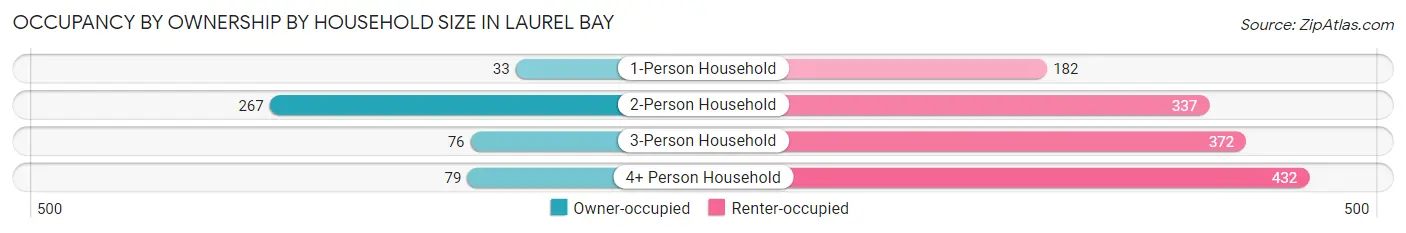
| Household Size | Owner-occupied | Renter-occupied |
| 1-Person Household | 33 (15.3%) | 182 (84.7%) |
| 2-Person Household | 267 (44.2%) | 337 (55.8%) |
| 3-Person Household | 76 (17.0%) | 372 (83.0%) |
| 4+ Person Household | 79 (15.5%) | 432 (84.5%) |
| Total Housing Units | 455 (25.6%) | 1,323 (74.4%) |
Occupancy by Educational Attainment in Laurel Bay
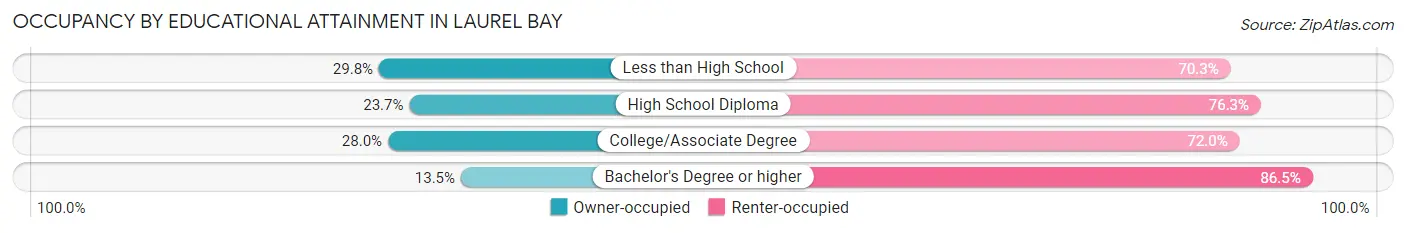
| Household Size | Owner-occupied | Renter-occupied |
| Less than High School | 36 (29.7%) | 85 (70.3%) |
| High School Diploma | 117 (23.7%) | 376 (76.3%) |
| College/Associate Degree | 280 (28.0%) | 721 (72.0%) |
| Bachelor's Degree or higher | 22 (13.5%) | 141 (86.5%) |
Occupancy by Age of Householder in Laurel Bay
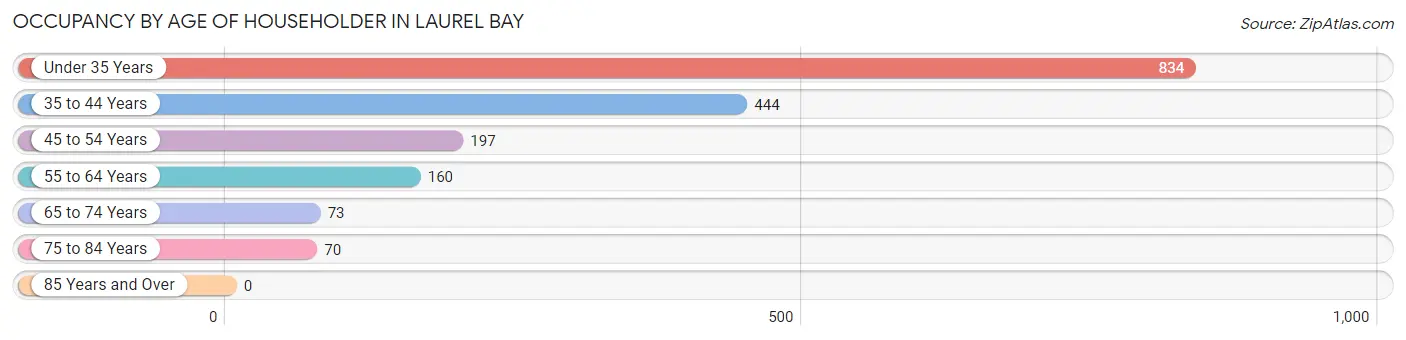
| Age Bracket | # Households | % Households |
| Under 35 Years | 834 | 46.9% |
| 35 to 44 Years | 444 | 25.0% |
| 45 to 54 Years | 197 | 11.1% |
| 55 to 64 Years | 160 | 9.0% |
| 65 to 74 Years | 73 | 4.1% |
| 75 to 84 Years | 70 | 3.9% |
| 85 Years and Over | 0 | 0.0% |
| Total | 1,778 | 100.0% |
Housing Finances in Laurel Bay
Median Income by Occupancy in Laurel Bay
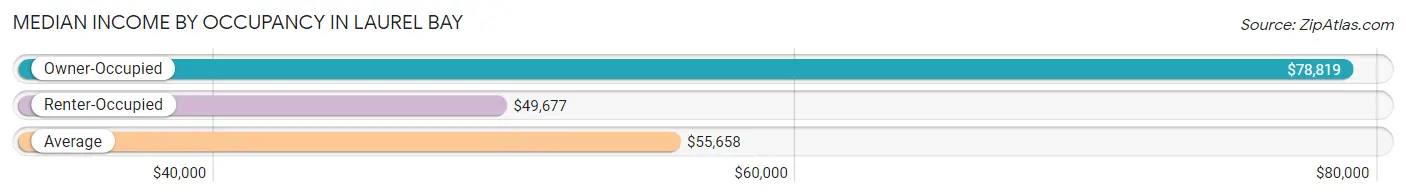
| Occupancy Type | # Households | Median Income |
| Owner-Occupied | 455 (25.6%) | $78,819 |
| Renter-Occupied | 1,323 (74.4%) | $49,677 |
| Average | 1,778 (100.0%) | $55,658 |
Occupancy by Householder Income Bracket in Laurel Bay
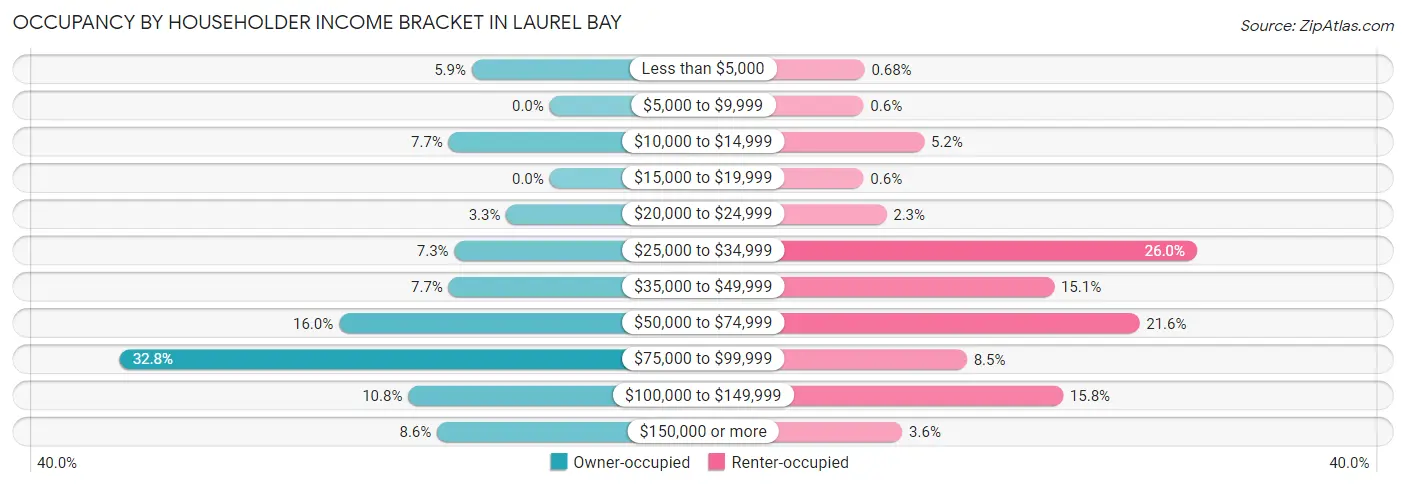
| Income Bracket | Owner-occupied | Renter-occupied |
| Less than $5,000 | 27 (5.9%) | 9 (0.7%) |
| $5,000 to $9,999 | 0 (0.0%) | 8 (0.6%) |
| $10,000 to $14,999 | 35 (7.7%) | 69 (5.2%) |
| $15,000 to $19,999 | 0 (0.0%) | 8 (0.6%) |
| $20,000 to $24,999 | 15 (3.3%) | 31 (2.3%) |
| $25,000 to $34,999 | 33 (7.2%) | 344 (26.0%) |
| $35,000 to $49,999 | 35 (7.7%) | 200 (15.1%) |
| $50,000 to $74,999 | 73 (16.0%) | 286 (21.6%) |
| $75,000 to $99,999 | 149 (32.8%) | 112 (8.5%) |
| $100,000 to $149,999 | 49 (10.8%) | 209 (15.8%) |
| $150,000 or more | 39 (8.6%) | 47 (3.5%) |
| Total | 455 (100.0%) | 1,323 (100.0%) |
Monthly Housing Cost Tiers in Laurel Bay
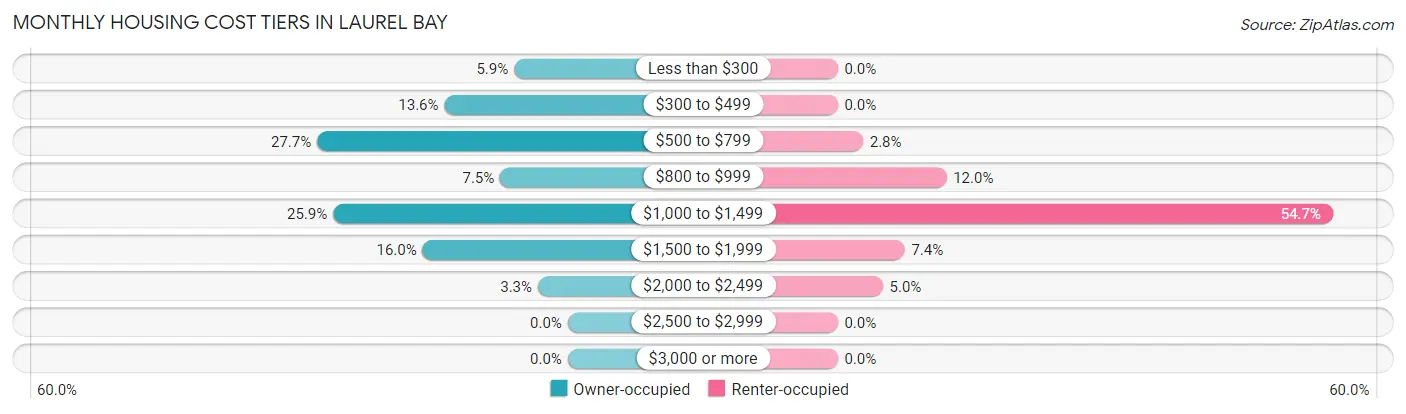
| Monthly Cost | Owner-occupied | Renter-occupied |
| Less than $300 | 27 (5.9%) | 0 (0.0%) |
| $300 to $499 | 62 (13.6%) | 0 (0.0%) |
| $500 to $799 | 126 (27.7%) | 37 (2.8%) |
| $800 to $999 | 34 (7.5%) | 159 (12.0%) |
| $1,000 to $1,499 | 118 (25.9%) | 724 (54.7%) |
| $1,500 to $1,999 | 73 (16.0%) | 98 (7.4%) |
| $2,000 to $2,499 | 15 (3.3%) | 66 (5.0%) |
| $2,500 to $2,999 | 0 (0.0%) | 0 (0.0%) |
| $3,000 or more | 0 (0.0%) | 0 (0.0%) |
| Total | 455 (100.0%) | 1,323 (100.0%) |
Physical Housing Characteristics in Laurel Bay
Housing Structures in Laurel Bay
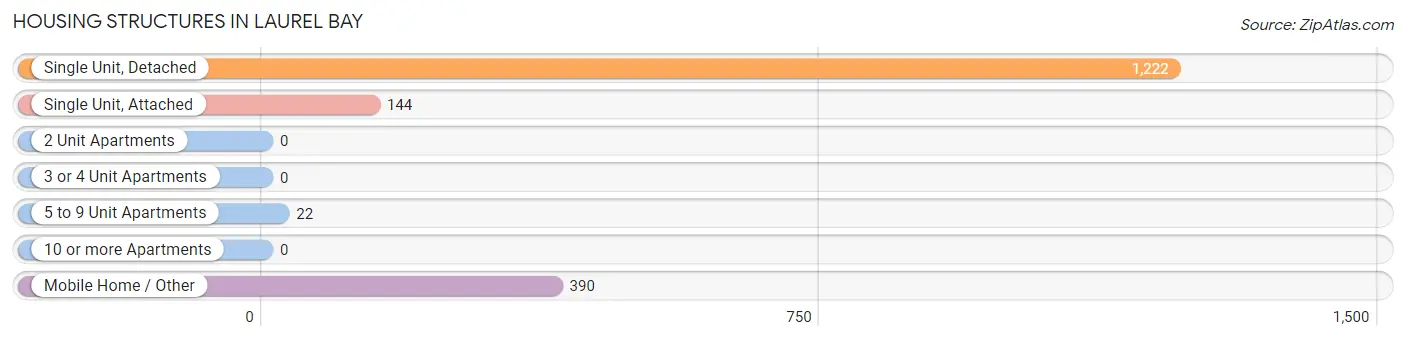
| Structure Type | # Housing Units | % Housing Units |
| Single Unit, Detached | 1,222 | 68.7% |
| Single Unit, Attached | 144 | 8.1% |
| 2 Unit Apartments | 0 | 0.0% |
| 3 or 4 Unit Apartments | 0 | 0.0% |
| 5 to 9 Unit Apartments | 22 | 1.2% |
| 10 or more Apartments | 0 | 0.0% |
| Mobile Home / Other | 390 | 21.9% |
| Total | 1,778 | 100.0% |
Housing Structures by Occupancy in Laurel Bay
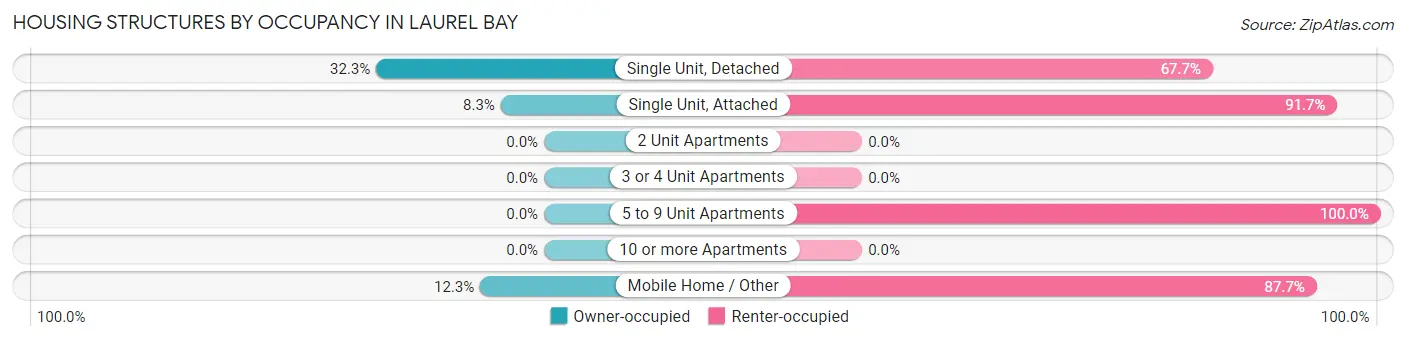
| Structure Type | Owner-occupied | Renter-occupied |
| Single Unit, Detached | 395 (32.3%) | 827 (67.7%) |
| Single Unit, Attached | 12 (8.3%) | 132 (91.7%) |
| 2 Unit Apartments | 0 (0.0%) | 0 (0.0%) |
| 3 or 4 Unit Apartments | 0 (0.0%) | 0 (0.0%) |
| 5 to 9 Unit Apartments | 0 (0.0%) | 22 (100.0%) |
| 10 or more Apartments | 0 (0.0%) | 0 (0.0%) |
| Mobile Home / Other | 48 (12.3%) | 342 (87.7%) |
| Total | 455 (25.6%) | 1,323 (74.4%) |
Housing Structures by Number of Rooms in Laurel Bay
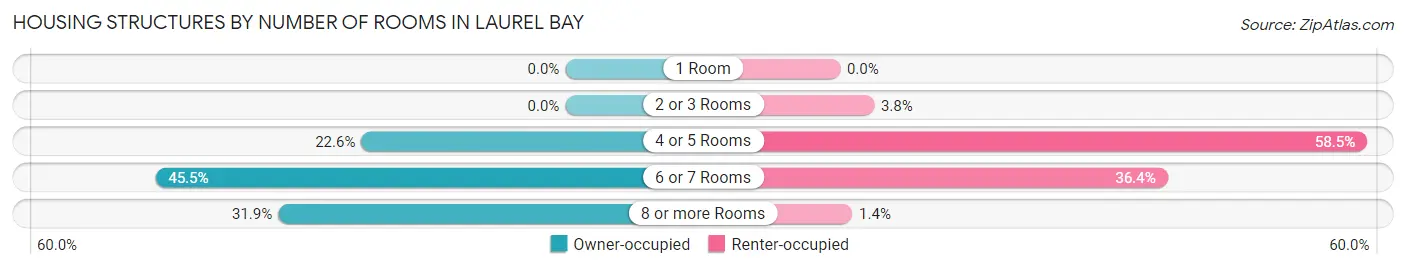
| Number of Rooms | Owner-occupied | Renter-occupied |
| 1 Room | 0 (0.0%) | 0 (0.0%) |
| 2 or 3 Rooms | 0 (0.0%) | 50 (3.8%) |
| 4 or 5 Rooms | 103 (22.6%) | 774 (58.5%) |
| 6 or 7 Rooms | 207 (45.5%) | 481 (36.4%) |
| 8 or more Rooms | 145 (31.9%) | 18 (1.4%) |
| Total | 455 (100.0%) | 1,323 (100.0%) |
Housing Structure by Heating Type in Laurel Bay
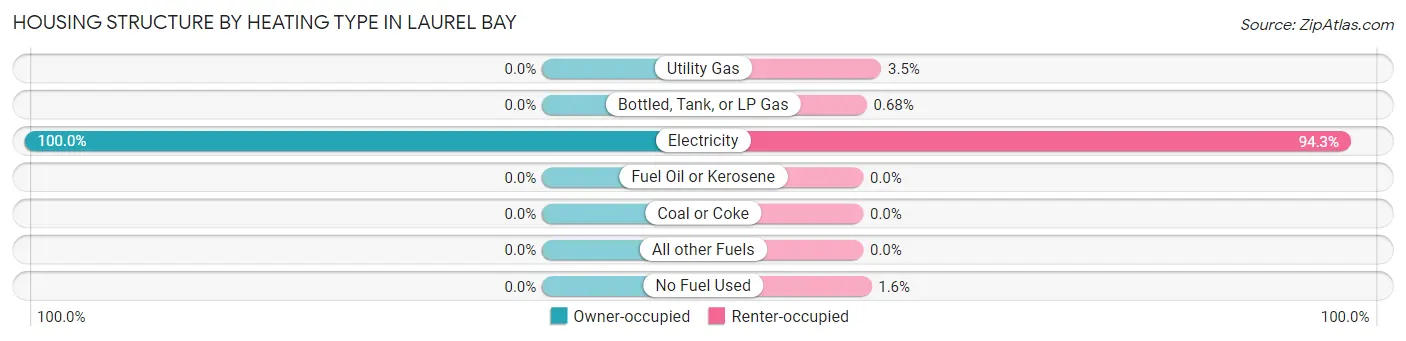
| Heating Type | Owner-occupied | Renter-occupied |
| Utility Gas | 0 (0.0%) | 46 (3.5%) |
| Bottled, Tank, or LP Gas | 0 (0.0%) | 9 (0.7%) |
| Electricity | 455 (100.0%) | 1,247 (94.3%) |
| Fuel Oil or Kerosene | 0 (0.0%) | 0 (0.0%) |
| Coal or Coke | 0 (0.0%) | 0 (0.0%) |
| All other Fuels | 0 (0.0%) | 0 (0.0%) |
| No Fuel Used | 0 (0.0%) | 21 (1.6%) |
| Total | 455 (100.0%) | 1,323 (100.0%) |
Household Vehicle Usage in Laurel Bay
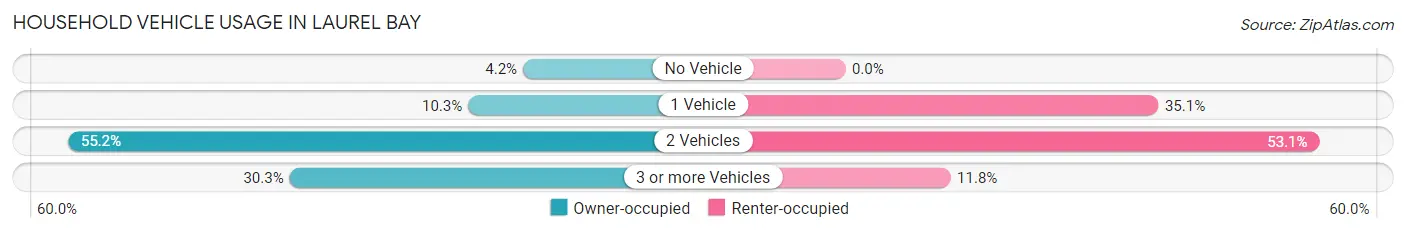
| Vehicles per Household | Owner-occupied | Renter-occupied |
| No Vehicle | 19 (4.2%) | 0 (0.0%) |
| 1 Vehicle | 47 (10.3%) | 464 (35.1%) |
| 2 Vehicles | 251 (55.2%) | 703 (53.1%) |
| 3 or more Vehicles | 138 (30.3%) | 156 (11.8%) |
| Total | 455 (100.0%) | 1,323 (100.0%) |
Real Estate & Mortgages in Laurel Bay
Real Estate and Mortgage Overview in Laurel Bay
| Characteristic | Without Mortgage | With Mortgage |
| Housing Units | 239 | 216 |
| Median Property Value | $222,700 | $206,900 |
| Median Household Income | $73,977 | $15 |
| Monthly Housing Costs | $531 | $0 |
| Real Estate Taxes | $1,269 | $0 |
Property Value by Mortgage Status in Laurel Bay
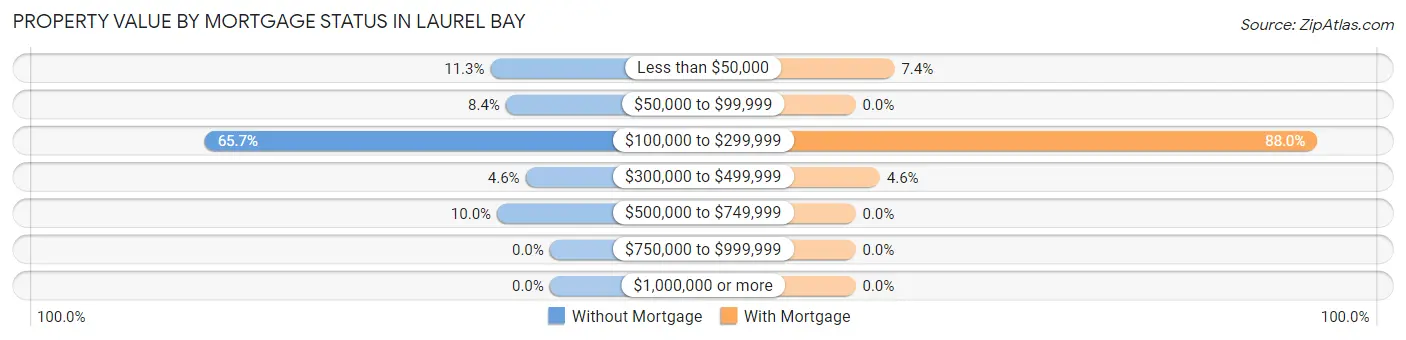
| Property Value | Without Mortgage | With Mortgage |
| Less than $50,000 | 27 (11.3%) | 16 (7.4%) |
| $50,000 to $99,999 | 20 (8.4%) | 0 (0.0%) |
| $100,000 to $299,999 | 157 (65.7%) | 190 (88.0%) |
| $300,000 to $499,999 | 11 (4.6%) | 10 (4.6%) |
| $500,000 to $749,999 | 24 (10.0%) | 0 (0.0%) |
| $750,000 to $999,999 | 0 (0.0%) | 0 (0.0%) |
| $1,000,000 or more | 0 (0.0%) | 0 (0.0%) |
| Total | 239 (100.0%) | 216 (100.0%) |
Household Income by Mortgage Status in Laurel Bay
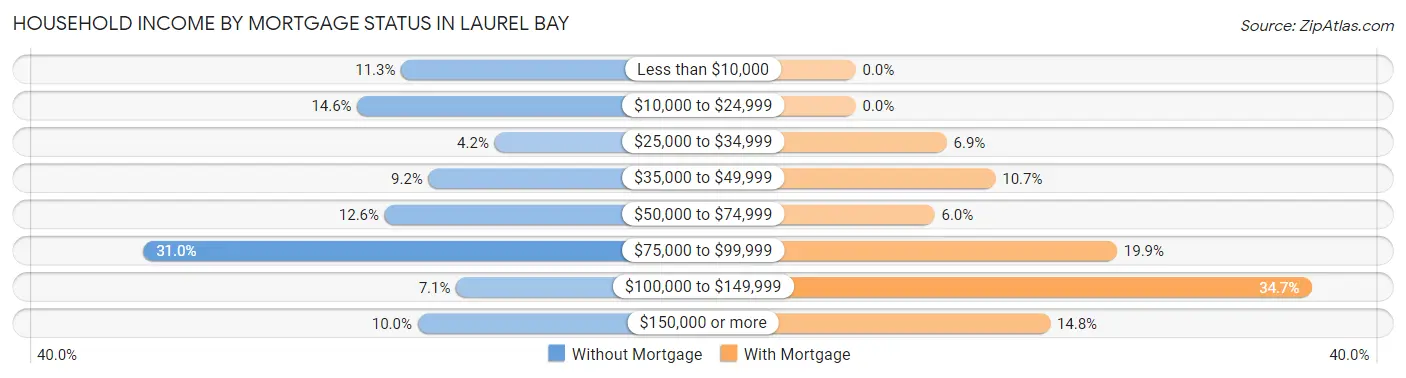
| Household Income | Without Mortgage | With Mortgage |
| Less than $10,000 | 27 (11.3%) | 0 (0.0%) |
| $10,000 to $24,999 | 35 (14.6%) | 0 (0.0%) |
| $25,000 to $34,999 | 10 (4.2%) | 15 (6.9%) |
| $35,000 to $49,999 | 22 (9.2%) | 23 (10.6%) |
| $50,000 to $74,999 | 30 (12.6%) | 13 (6.0%) |
| $75,000 to $99,999 | 74 (31.0%) | 43 (19.9%) |
| $100,000 to $149,999 | 17 (7.1%) | 75 (34.7%) |
| $150,000 or more | 24 (10.0%) | 32 (14.8%) |
| Total | 239 (100.0%) | 216 (100.0%) |
Property Value to Household Income Ratio in Laurel Bay
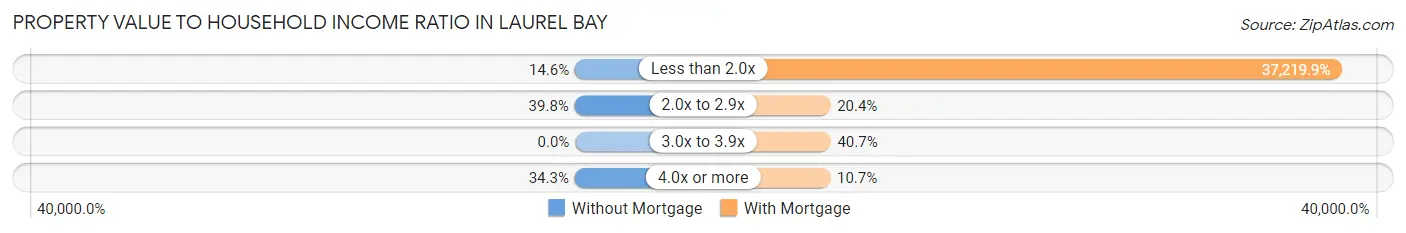
| Value-to-Income Ratio | Without Mortgage | With Mortgage |
| Less than 2.0x | 35 (14.6%) | 80,395 (37,219.9%) |
| 2.0x to 2.9x | 95 (39.8%) | 44 (20.4%) |
| 3.0x to 3.9x | 0 (0.0%) | 88 (40.7%) |
| 4.0x or more | 82 (34.3%) | 23 (10.6%) |
| Total | 239 (100.0%) | 216 (100.0%) |
Real Estate Taxes by Mortgage Status in Laurel Bay
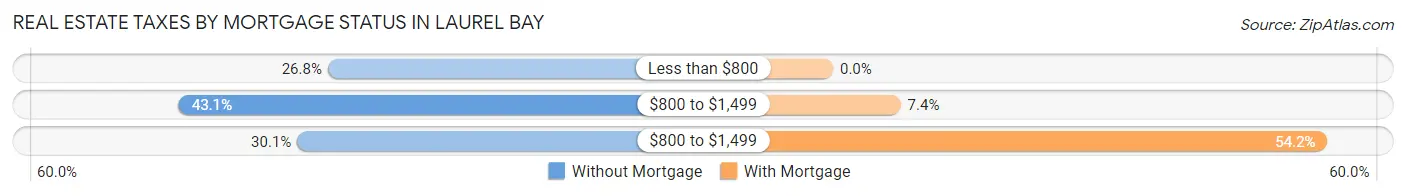
| Property Taxes | Without Mortgage | With Mortgage |
| Less than $800 | 64 (26.8%) | 0 (0.0%) |
| $800 to $1,499 | 103 (43.1%) | 16 (7.4%) |
| $800 to $1,499 | 72 (30.1%) | 117 (54.2%) |
| Total | 239 (100.0%) | 216 (100.0%) |
Health & Disability in Laurel Bay
Health Insurance Coverage by Age in Laurel Bay
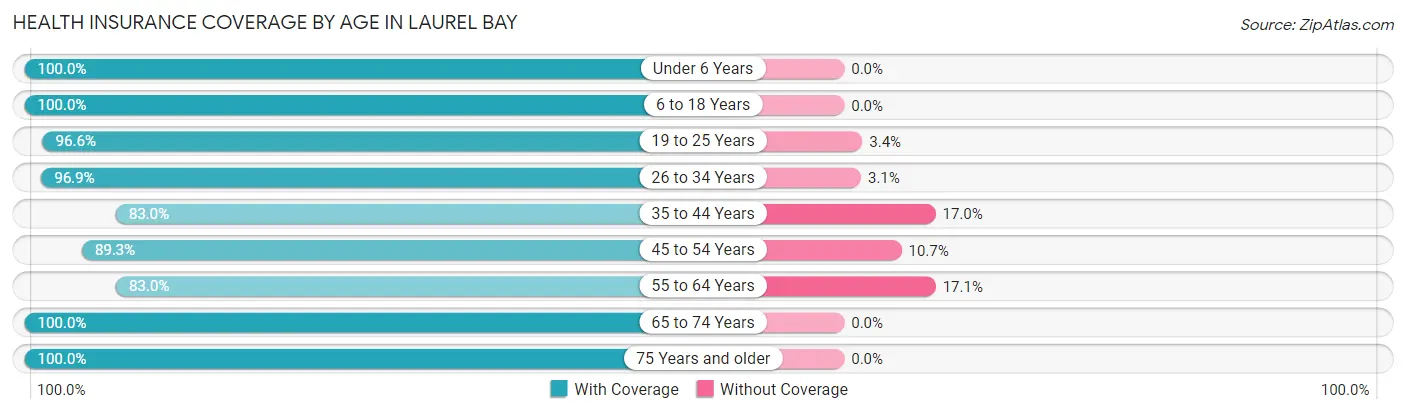
| Age Bracket | With Coverage | Without Coverage |
| Under 6 Years | 682 (100.0%) | 0 (0.0%) |
| 6 to 18 Years | 1,340 (100.0%) | 0 (0.0%) |
| 19 to 25 Years | 774 (96.6%) | 27 (3.4%) |
| 26 to 34 Years | 435 (96.9%) | 14 (3.1%) |
| 35 to 44 Years | 527 (83.0%) | 108 (17.0%) |
| 45 to 54 Years | 301 (89.3%) | 36 (10.7%) |
| 55 to 64 Years | 326 (83.0%) | 67 (17.1%) |
| 65 to 74 Years | 92 (100.0%) | 0 (0.0%) |
| 75 Years and older | 132 (100.0%) | 0 (0.0%) |
| Total | 4,609 (94.8%) | 252 (5.2%) |
Health Insurance Coverage by Citizenship Status in Laurel Bay
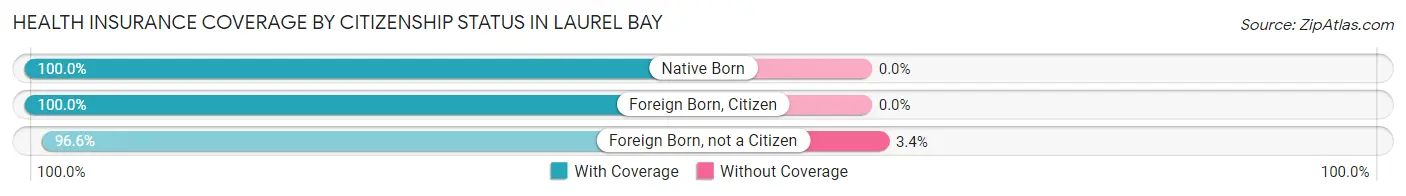
| Citizenship Status | With Coverage | Without Coverage |
| Native Born | 682 (100.0%) | 0 (0.0%) |
| Foreign Born, Citizen | 1,340 (100.0%) | 0 (0.0%) |
| Foreign Born, not a Citizen | 774 (96.6%) | 27 (3.4%) |
Health Insurance Coverage by Household Income in Laurel Bay
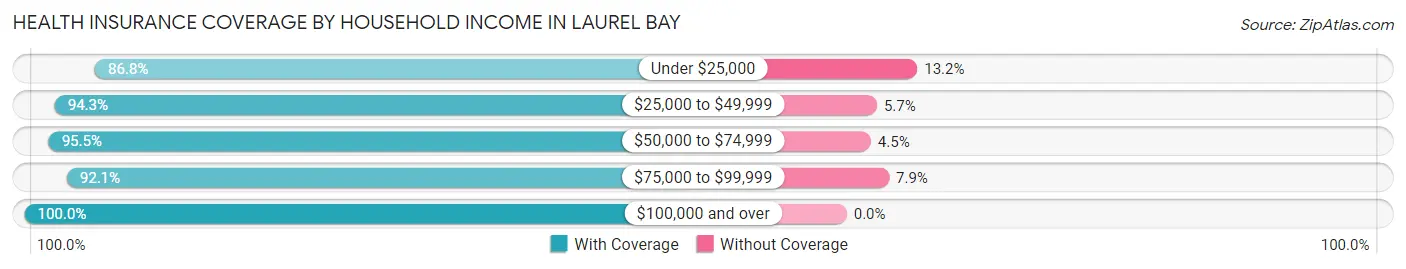
| Household Income | With Coverage | Without Coverage |
| Under $25,000 | 486 (86.8%) | 74 (13.2%) |
| $25,000 to $49,999 | 1,201 (94.3%) | 72 (5.7%) |
| $50,000 to $74,999 | 1,013 (95.5%) | 48 (4.5%) |
| $75,000 to $99,999 | 674 (92.1%) | 58 (7.9%) |
| $100,000 and over | 1,235 (100.0%) | 0 (0.0%) |
Public vs Private Health Insurance Coverage by Age in Laurel Bay
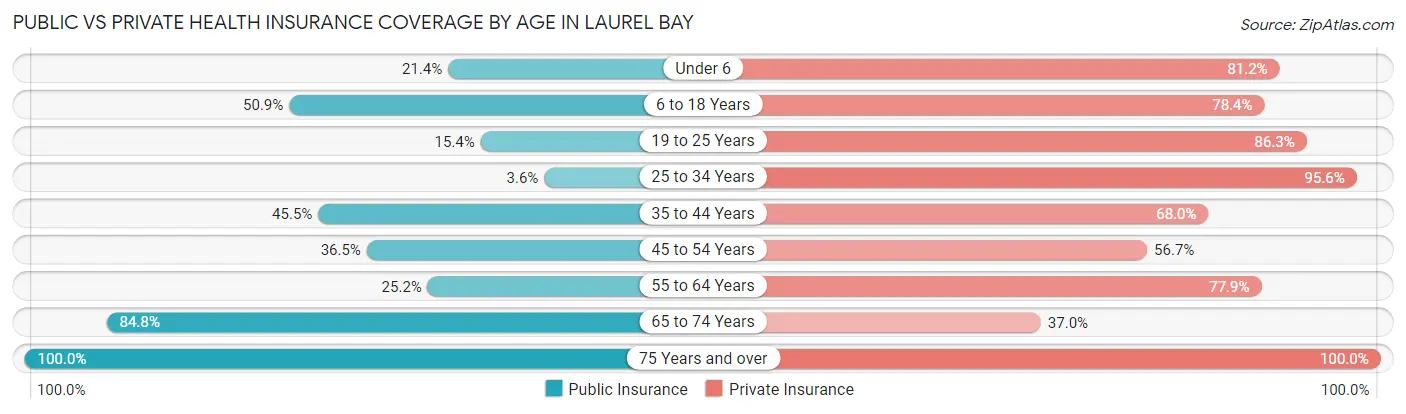
| Age Bracket | Public Insurance | Private Insurance |
| Under 6 | 146 (21.4%) | 554 (81.2%) |
| 6 to 18 Years | 682 (50.9%) | 1,051 (78.4%) |
| 19 to 25 Years | 123 (15.4%) | 691 (86.3%) |
| 25 to 34 Years | 16 (3.6%) | 429 (95.6%) |
| 35 to 44 Years | 289 (45.5%) | 432 (68.0%) |
| 45 to 54 Years | 123 (36.5%) | 191 (56.7%) |
| 55 to 64 Years | 99 (25.2%) | 306 (77.9%) |
| 65 to 74 Years | 78 (84.8%) | 34 (37.0%) |
| 75 Years and over | 132 (100.0%) | 132 (100.0%) |
| Total | 1,688 (34.7%) | 3,820 (78.6%) |
Disability Status by Sex by Age in Laurel Bay
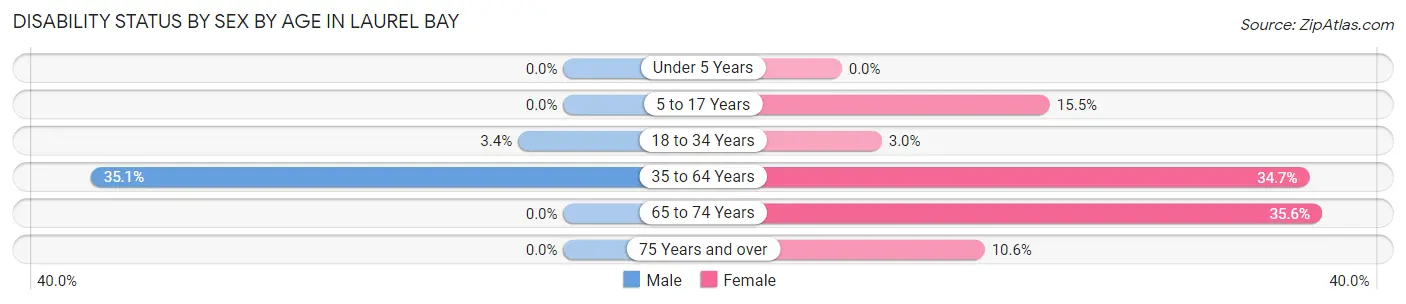
| Age Bracket | Male | Female |
| Under 5 Years | 0 (0.0%) | 0 (0.0%) |
| 5 to 17 Years | 0 (0.0%) | 68 (15.4%) |
| 18 to 34 Years | 19 (3.4%) | 26 (3.0%) |
| 35 to 64 Years | 207 (35.1%) | 269 (34.7%) |
| 65 to 74 Years | 0 (0.0%) | 31 (35.6%) |
| 75 Years and over | 0 (0.0%) | 7 (10.6%) |
Disability Class by Sex by Age in Laurel Bay
Disability Class: Hearing Difficulty
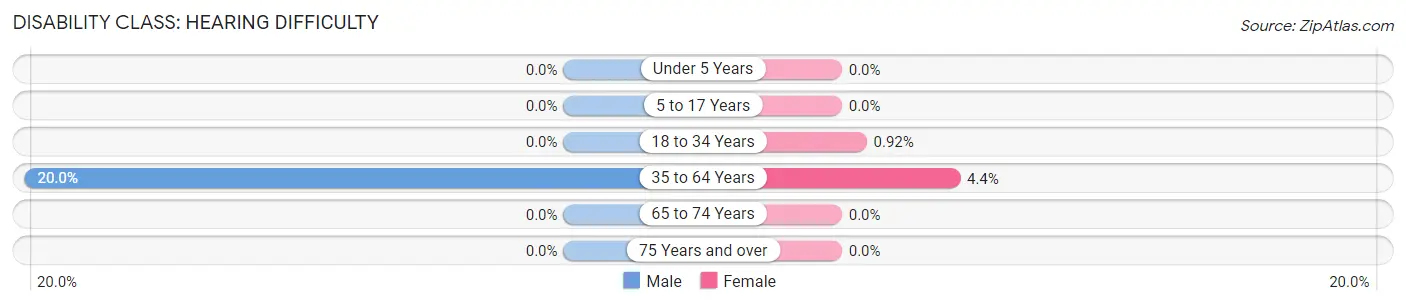
| Age Bracket | Male | Female |
| Under 5 Years | 0 (0.0%) | 0 (0.0%) |
| 5 to 17 Years | 0 (0.0%) | 0 (0.0%) |
| 18 to 34 Years | 0 (0.0%) | 8 (0.9%) |
| 35 to 64 Years | 118 (20.0%) | 34 (4.4%) |
| 65 to 74 Years | 0 (0.0%) | 0 (0.0%) |
| 75 Years and over | 0 (0.0%) | 0 (0.0%) |
Disability Class: Vision Difficulty
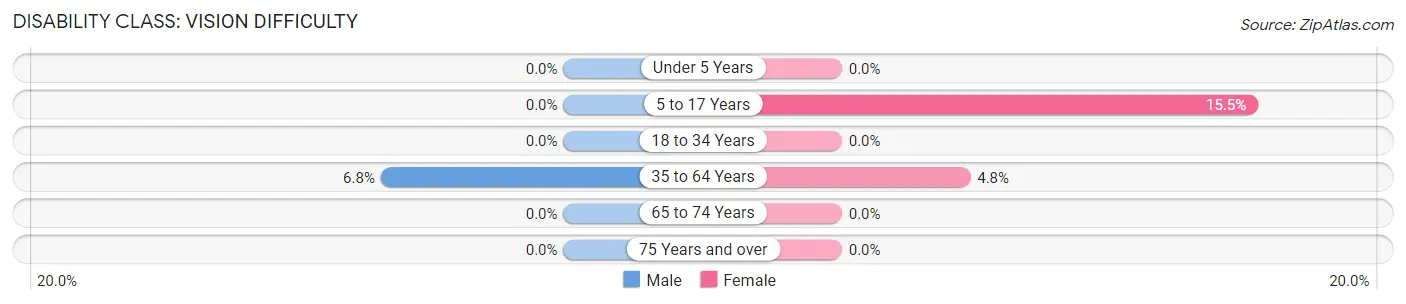
| Age Bracket | Male | Female |
| Under 5 Years | 0 (0.0%) | 0 (0.0%) |
| 5 to 17 Years | 0 (0.0%) | 68 (15.4%) |
| 18 to 34 Years | 0 (0.0%) | 0 (0.0%) |
| 35 to 64 Years | 40 (6.8%) | 37 (4.8%) |
| 65 to 74 Years | 0 (0.0%) | 0 (0.0%) |
| 75 Years and over | 0 (0.0%) | 0 (0.0%) |
Disability Class: Cognitive Difficulty
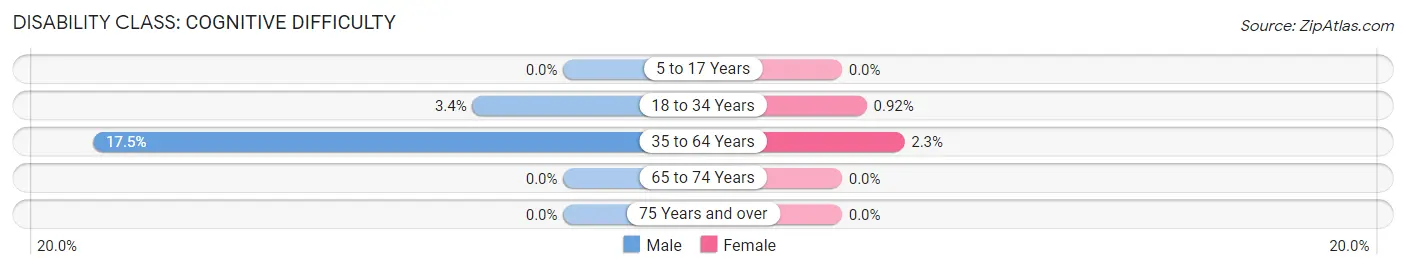
| Age Bracket | Male | Female |
| 5 to 17 Years | 0 (0.0%) | 0 (0.0%) |
| 18 to 34 Years | 19 (3.4%) | 8 (0.9%) |
| 35 to 64 Years | 103 (17.5%) | 18 (2.3%) |
| 65 to 74 Years | 0 (0.0%) | 0 (0.0%) |
| 75 Years and over | 0 (0.0%) | 0 (0.0%) |
Disability Class: Ambulatory Difficulty
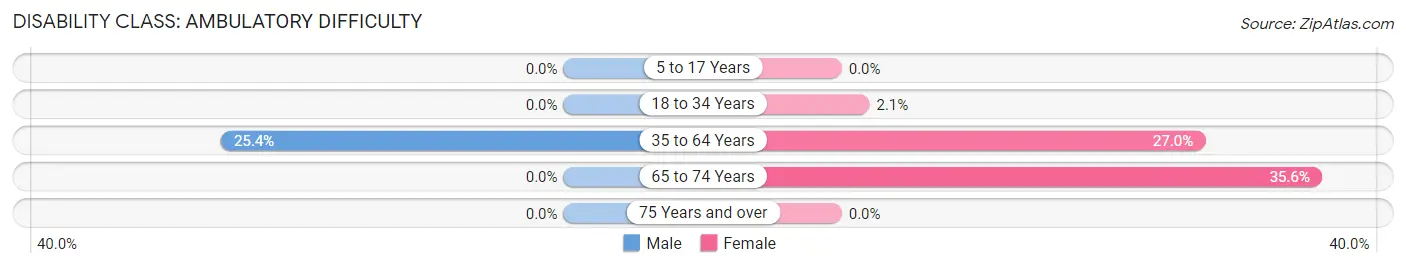
| Age Bracket | Male | Female |
| 5 to 17 Years | 0 (0.0%) | 0 (0.0%) |
| 18 to 34 Years | 0 (0.0%) | 18 (2.1%) |
| 35 to 64 Years | 150 (25.4%) | 209 (27.0%) |
| 65 to 74 Years | 0 (0.0%) | 31 (35.6%) |
| 75 Years and over | 0 (0.0%) | 0 (0.0%) |
Disability Class: Self-Care Difficulty
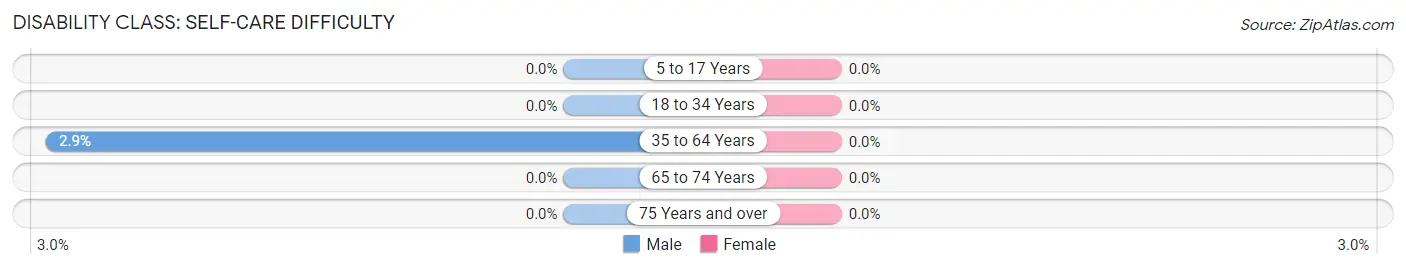
| Age Bracket | Male | Female |
| 5 to 17 Years | 0 (0.0%) | 0 (0.0%) |
| 18 to 34 Years | 0 (0.0%) | 0 (0.0%) |
| 35 to 64 Years | 17 (2.9%) | 0 (0.0%) |
| 65 to 74 Years | 0 (0.0%) | 0 (0.0%) |
| 75 Years and over | 0 (0.0%) | 0 (0.0%) |
Technology Access in Laurel Bay
Computing Device Access in Laurel Bay
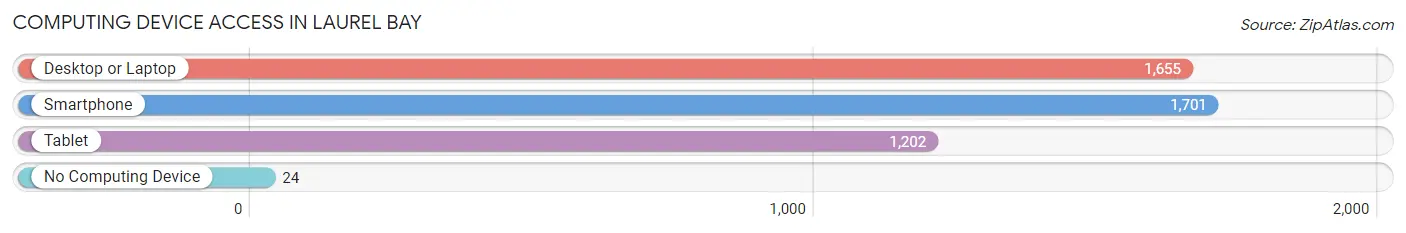
| Device Type | # Households | % Households |
| Desktop or Laptop | 1,655 | 93.1% |
| Smartphone | 1,701 | 95.7% |
| Tablet | 1,202 | 67.6% |
| No Computing Device | 24 | 1.3% |
| Total | 1,778 | 100.0% |
Internet Access in Laurel Bay
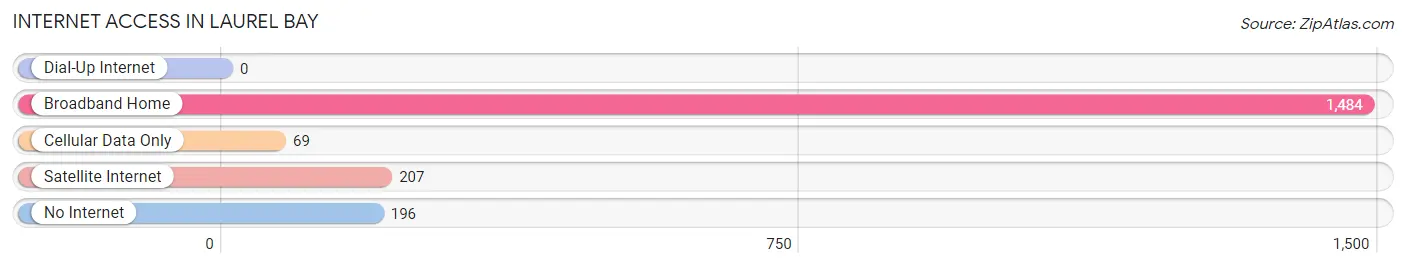
| Internet Type | # Households | % Households |
| Dial-Up Internet | 0 | 0.0% |
| Broadband Home | 1,484 | 83.5% |
| Cellular Data Only | 69 | 3.9% |
| Satellite Internet | 207 | 11.6% |
| No Internet | 196 | 11.0% |
| Total | 1,778 | 100.0% |
Laurel Bay Summary
Laurel Bay is a small unincorporated community located in Beaufort County, South Carolina. It is situated on the banks of the Broad River, just south of the city of Beaufort. The community is part of the Hilton Head Island-Beaufort Micropolitan Statistical Area.
History
The area that is now Laurel Bay was first settled in the late 1700s by a group of settlers from the British Isles. The settlers were attracted to the area due to its abundance of natural resources, including timber, fish, and game. The community was originally known as “Broad River Settlement” and was located on the banks of the Broad River.
In 1802, the settlement was renamed “Laurel Bay” after the laurel trees that grew in abundance in the area. The community grew slowly over the next few decades, and by the mid-1800s, it had become a thriving agricultural community. The community was home to several plantations, including the Laurel Bay Plantation, which was owned by the prominent local family of the same name.
Geography
Laurel Bay is located in Beaufort County, South Carolina, on the banks of the Broad River. The community is situated just south of the city of Beaufort and is part of the Hilton Head Island-Beaufort Micropolitan Statistical Area. The community is located in a rural area and is surrounded by forests and wetlands. The nearest major city is Savannah, Georgia, which is located approximately 50 miles to the south.
Economy
The economy of Laurel Bay is largely based on agriculture and tourism. The community is home to several farms, which produce a variety of crops, including corn, soybeans, and cotton. The community is also home to several tourist attractions, including the Laurel Bay Plantation, which is a popular destination for visitors.
In addition to agriculture and tourism, the community is also home to several small businesses, including restaurants, retail stores, and service providers. The community is also home to a number of government offices, including the Beaufort County Sheriff’s Office and the Beaufort County Courthouse.
Demographics
As of the 2010 census, the population of Laurel Bay was 1,845. The racial makeup of the community was 79.3% White, 15.2% African American, 0.3% Native American, 0.7% Asian, 0.1% Pacific Islander, and 4.4% from other races. The median household income in the community was $41,944, and the median family income was $50,944. The per capita income in the community was $20,944.
Conclusion
Laurel Bay is a small unincorporated community located in Beaufort County, South Carolina. The community is situated on the banks of the Broad River, just south of the city of Beaufort. The economy of Laurel Bay is largely based on agriculture and tourism, and the community is home to several small businesses, government offices, and tourist attractions. As of the 2010 census, the population of Laurel Bay was 1,845, and the median household income was $41,944.
Common Questions
What is Per Capita Income in Laurel Bay?
Per Capita income in Laurel Bay is $23,716.
What is the Median Family Income in Laurel Bay?
Median Family Income in Laurel Bay is $57,089.
What is the Median Household income in Laurel Bay?
Median Household Income in Laurel Bay is $55,658.
What is Income or Wage Gap in Laurel Bay?
Income or Wage Gap in Laurel Bay is 36.3%.
Women in Laurel Bay earn 63.7 cents for every dollar earned by a man.
What is Family Income Deficit in Laurel Bay?
Family Income Deficit in Laurel Bay is $9,661.
Families that are below poverty line in Laurel Bay earn $9,661 less on average than the poverty threshold level.
What is Inequality or Gini Index in Laurel Bay?
Inequality or Gini Index in Laurel Bay is 0.40.
What is the Total Population of Laurel Bay?
Total Population of Laurel Bay is 5,513.
What is the Total Male Population of Laurel Bay?
Total Male Population of Laurel Bay is 2,883.
What is the Total Female Population of Laurel Bay?
Total Female Population of Laurel Bay is 2,630.
What is the Ratio of Males per 100 Females in Laurel Bay?
There are 109.62 Males per 100 Females in Laurel Bay.
What is the Ratio of Females per 100 Males in Laurel Bay?
There are 91.22 Females per 100 Males in Laurel Bay.
What is the Median Population Age in Laurel Bay?
Median Population Age in Laurel Bay is 22.9 Years.
What is the Average Family Size in Laurel Bay
Average Family Size in Laurel Bay is 3.4 People.
What is the Average Household Size in Laurel Bay
Average Household Size in Laurel Bay is 3.1 People.
How Large is the Labor Force in Laurel Bay?
There are 2,505 People in the Labor Forcein in Laurel Bay.
What is the Percentage of People in the Labor Force in Laurel Bay?
65.4% of People are in the Labor Force in Laurel Bay.
What is the Unemployment Rate in Laurel Bay?
Unemployment Rate in Laurel Bay is 2.3%.