Ehrhardt, SC Map & Demographics
Ehrhardt Map
Ehrhardt Overview
$21,461
PER CAPITA INCOME
$36,131
AVG FAMILY INCOME
$35,923
AVG HOUSEHOLD INCOME
0.29
INEQUALITY / GINI INDEX
462
TOTAL POPULATION
204
MALE POPULATION
258
FEMALE POPULATION
79.07
MALES / 100 FEMALES
126.47
FEMALES / 100 MALES
63.5
MEDIAN AGE
2.5
AVG FAMILY SIZE
1.9
AVG HOUSEHOLD SIZE
83
LABOR FORCE [ PEOPLE ]
19.2%
PERCENT IN LABOR FORCE
Ehrhardt Zip Codes
Ehrhardt Area Codes
Income in Ehrhardt
Income Overview in Ehrhardt
Per Capita Income in Ehrhardt is $21,461, while median incomes of families and households are $36,131 and $35,923 respectively.
| Characteristic | Number | Measure |
| Per Capita Income | 462 | $21,461 |
| Median Family Income | 140 | $36,131 |
| Mean Family Income | 140 | $42,136 |
| Median Household Income | 239 | $35,923 |
| Mean Household Income | 239 | $40,109 |
| Income Deficit | 140 | $0 |
| Wage / Income Gap (%) | 462 | 0.00% |
| Wage / Income Gap ($) | 462 | 100.00¢ per $1 |
| Gini / Inequality Index | 462 | 0.29 |
Earnings by Sex in Ehrhardt
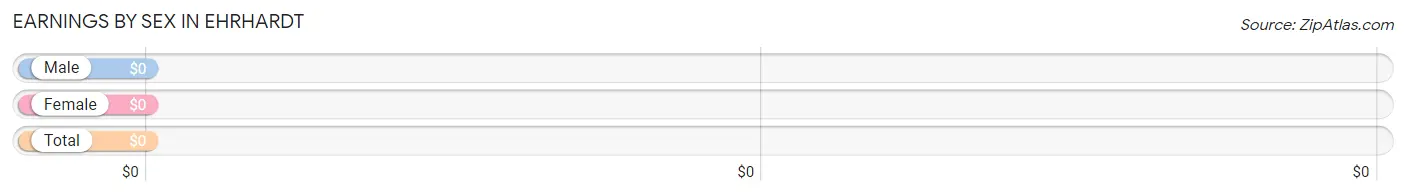
| Sex | Number | Average Earnings |
| Male | 42 (49.4%) | $0 |
| Female | 43 (50.6%) | $0 |
| Total | 85 (100.0%) | $0 |
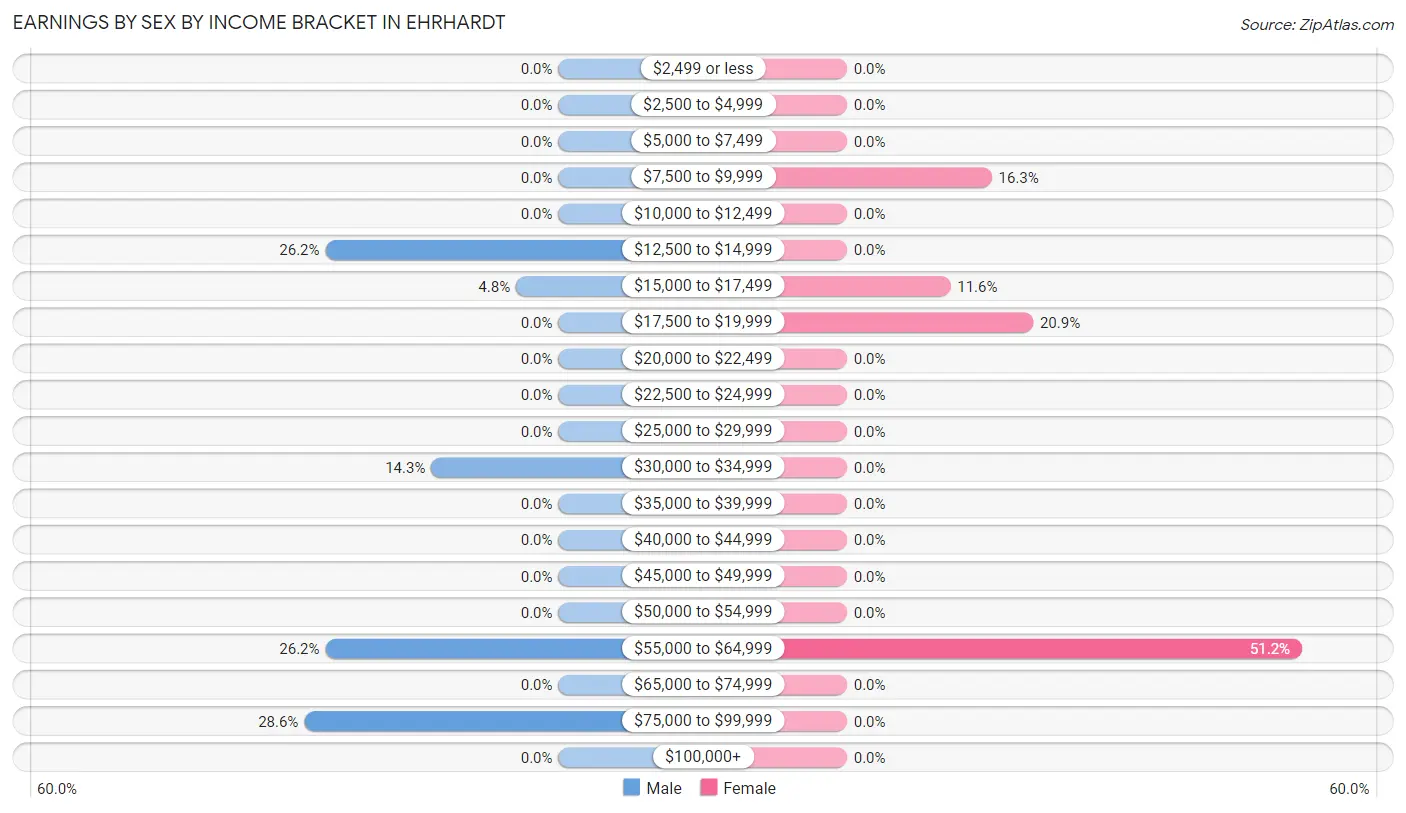
Earnings by Sex by Income Bracket in Ehrhardt
The most common earnings brackets in Ehrhardt are $75,000 to $99,999 for men (12 | 28.6%) and $55,000 to $64,999 for women (22 | 51.2%).
| Income | Male | Female |
| $2,499 or less | 0 (0.0%) | 0 (0.0%) |
| $2,500 to $4,999 | 0 (0.0%) | 0 (0.0%) |
| $5,000 to $7,499 | 0 (0.0%) | 0 (0.0%) |
| $7,500 to $9,999 | 0 (0.0%) | 7 (16.3%) |
| $10,000 to $12,499 | 0 (0.0%) | 0 (0.0%) |
| $12,500 to $14,999 | 11 (26.2%) | 0 (0.0%) |
| $15,000 to $17,499 | 2 (4.8%) | 5 (11.6%) |
| $17,500 to $19,999 | 0 (0.0%) | 9 (20.9%) |
| $20,000 to $22,499 | 0 (0.0%) | 0 (0.0%) |
| $22,500 to $24,999 | 0 (0.0%) | 0 (0.0%) |
| $25,000 to $29,999 | 0 (0.0%) | 0 (0.0%) |
| $30,000 to $34,999 | 6 (14.3%) | 0 (0.0%) |
| $35,000 to $39,999 | 0 (0.0%) | 0 (0.0%) |
| $40,000 to $44,999 | 0 (0.0%) | 0 (0.0%) |
| $45,000 to $49,999 | 0 (0.0%) | 0 (0.0%) |
| $50,000 to $54,999 | 0 (0.0%) | 0 (0.0%) |
| $55,000 to $64,999 | 11 (26.2%) | 22 (51.2%) |
| $65,000 to $74,999 | 0 (0.0%) | 0 (0.0%) |
| $75,000 to $99,999 | 12 (28.6%) | 0 (0.0%) |
| $100,000+ | 0 (0.0%) | 0 (0.0%) |
| Total | 42 (100.0%) | 43 (100.0%) |
Earnings by Sex by Educational Attainment in Ehrhardt
| Educational Attainment | Male Income | Female Income |
| Less than High School | - | - |
| High School Diploma | - | - |
| College or Associate's Degree | - | - |
| Bachelor's Degree | - | - |
| Graduate Degree | - | - |
| Total | - | - |
Family Income in Ehrhardt
Family Income Brackets in Ehrhardt
According to the Ehrhardt family income data, there are 61 families falling into the $35,000 to $49,999 income range, which is the most common income bracket and makes up 43.6% of all families.
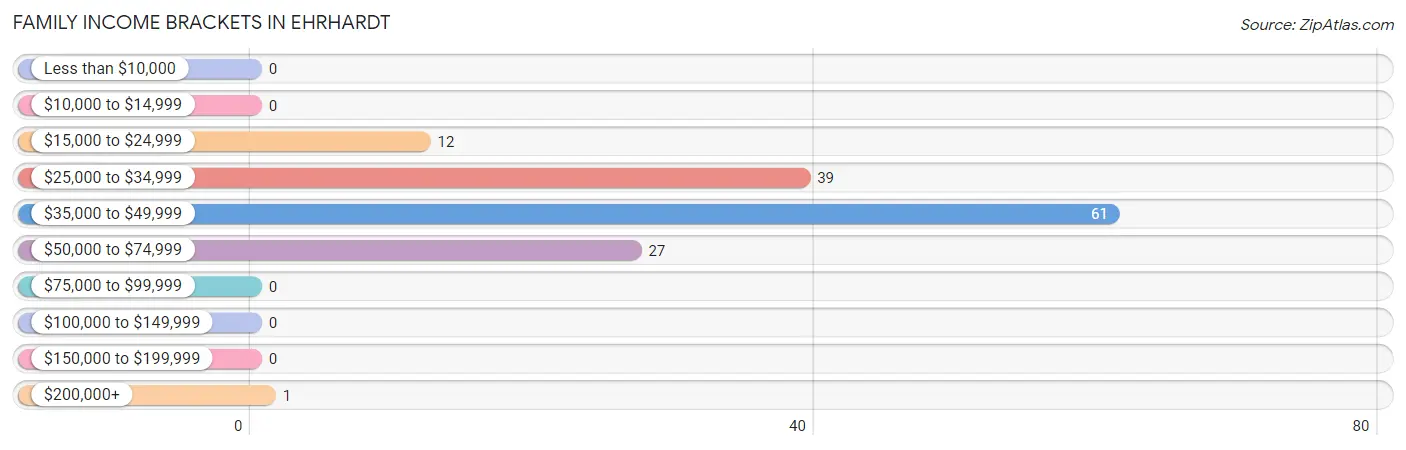
| Income Bracket | # Families | % Families |
| Less than $10,000 | 0 | 0.0% |
| $10,000 to $14,999 | 0 | 0.0% |
| $15,000 to $24,999 | 12 | 8.6% |
| $25,000 to $34,999 | 39 | 27.9% |
| $35,000 to $49,999 | 61 | 43.6% |
| $50,000 to $74,999 | 27 | 19.3% |
| $75,000 to $99,999 | 0 | 0.0% |
| $100,000 to $149,999 | 0 | 0.0% |
| $150,000 to $199,999 | 0 | 0.0% |
| $200,000+ | 1 | 0.7% |
Family Income by Famaliy Size in Ehrhardt
3-person families (24 | 17.1%) account for the highest median family income in Ehrhardt with $51,250 per family, while 2-person families (106 | 75.7%) have the highest median income of $17,984 per family member.
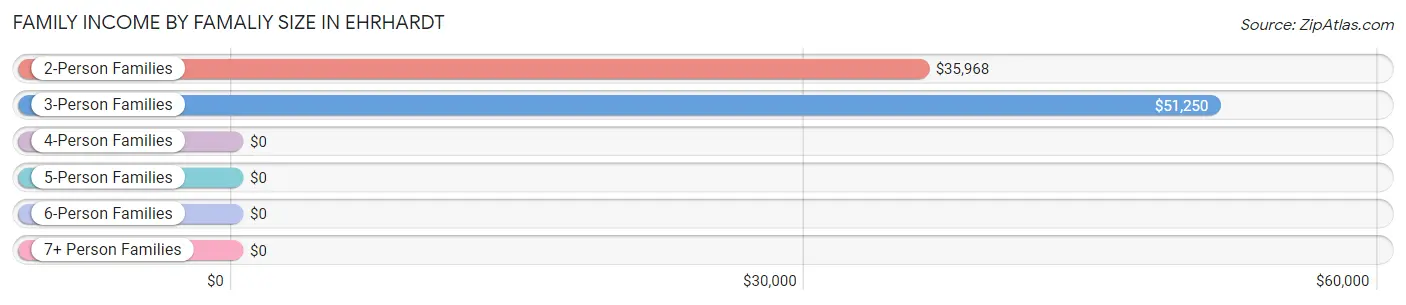
| Income Bracket | # Families | Median Income |
| 2-Person Families | 106 (75.7%) | $35,968 |
| 3-Person Families | 24 (17.1%) | $51,250 |
| 4-Person Families | 10 (7.1%) | $0 |
| 5-Person Families | 0 (0.0%) | $0 |
| 6-Person Families | 0 (0.0%) | $0 |
| 7+ Person Families | 0 (0.0%) | $0 |
| Total | 140 (100.0%) | $36,131 |
Family Income by Number of Earners in Ehrhardt
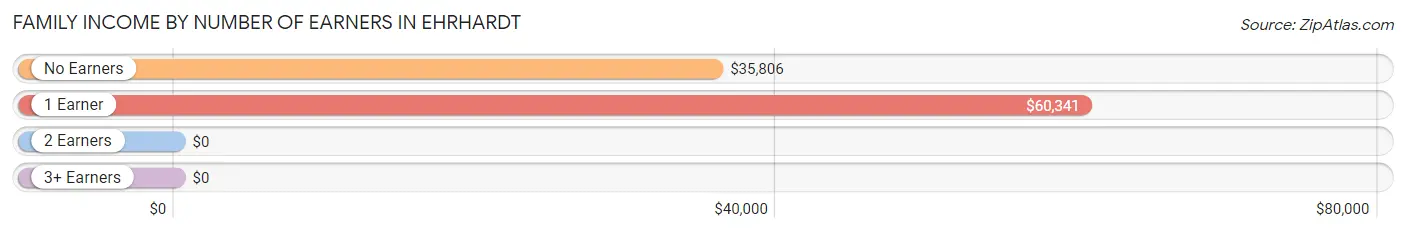
| Number of Earners | # Families | Median Income |
| No Earners | 110 (78.6%) | $35,806 |
| 1 Earner | 19 (13.6%) | $60,341 |
| 2 Earners | 11 (7.9%) | $0 |
| 3+ Earners | 0 (0.0%) | $0 |
| Total | 140 (100.0%) | $36,131 |
Household Income in Ehrhardt
Household Income Brackets in Ehrhardt
With 71 households falling in the category, the $35,000 to $49,999 income range is the most frequent in Ehrhardt, accounting for 29.7% of all households.
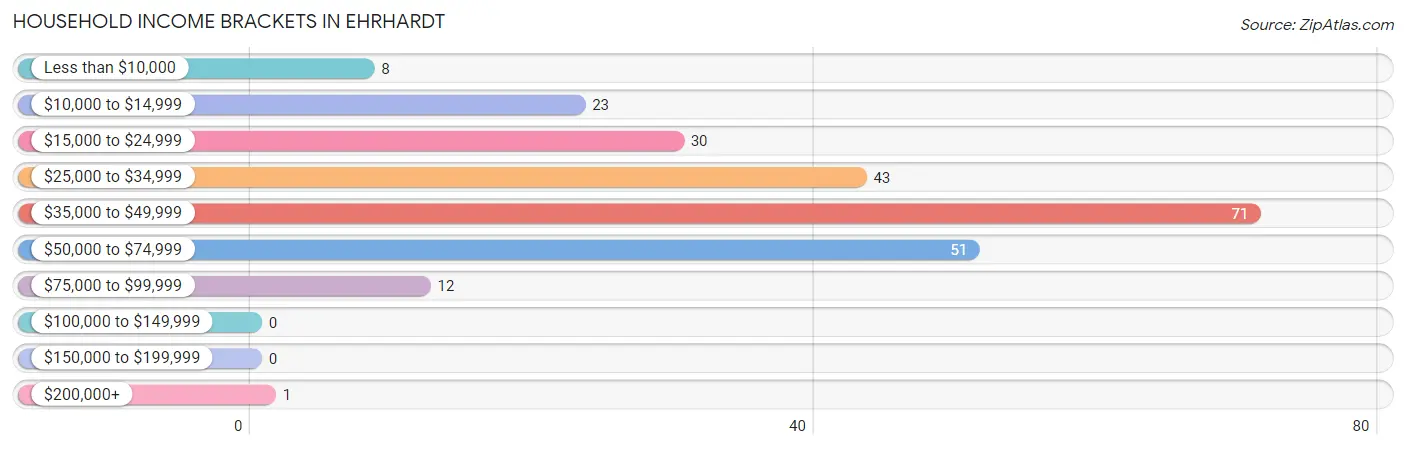
| Income Bracket | # Households | % Households |
| Less than $10,000 | 8 | 3.3% |
| $10,000 to $14,999 | 23 | 9.6% |
| $15,000 to $24,999 | 30 | 12.6% |
| $25,000 to $34,999 | 43 | 18.0% |
| $35,000 to $49,999 | 71 | 29.7% |
| $50,000 to $74,999 | 51 | 21.3% |
| $75,000 to $99,999 | 12 | 5.0% |
| $100,000 to $149,999 | 0 | 0.0% |
| $150,000 to $199,999 | 0 | 0.0% |
| $200,000+ | 1 | 0.4% |
Household Income by Householder Age in Ehrhardt
The median household income in Ehrhardt is $35,923, with the highest median household income of $36,008 found in the 65+ years age bracket for the primary householder. A total of 135 households (56.5%) fall into this category.
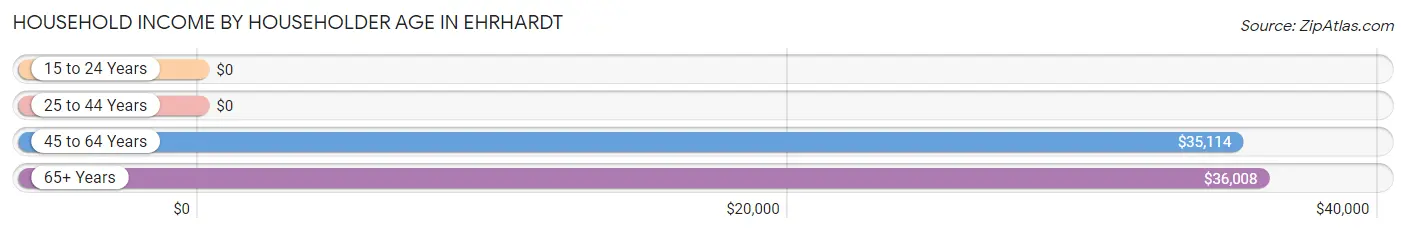
| Income Bracket | # Households | Median Income |
| 15 to 24 Years | 0 (0.0%) | $0 |
| 25 to 44 Years | 17 (7.1%) | $0 |
| 45 to 64 Years | 87 (36.4%) | $35,114 |
| 65+ Years | 135 (56.5%) | $36,008 |
| Total | 239 (100.0%) | $35,923 |
Poverty in Ehrhardt
Income Below Poverty by Sex and Age in Ehrhardt
With 9.6% poverty level for males and 2.4% for females among the residents of Ehrhardt, 55 to 64 year old males and 45 to 54 year old females are the most vulnerable to poverty, with 8 males (20.5%) and 1 females (14.3%) in their respective age groups living below the poverty level.
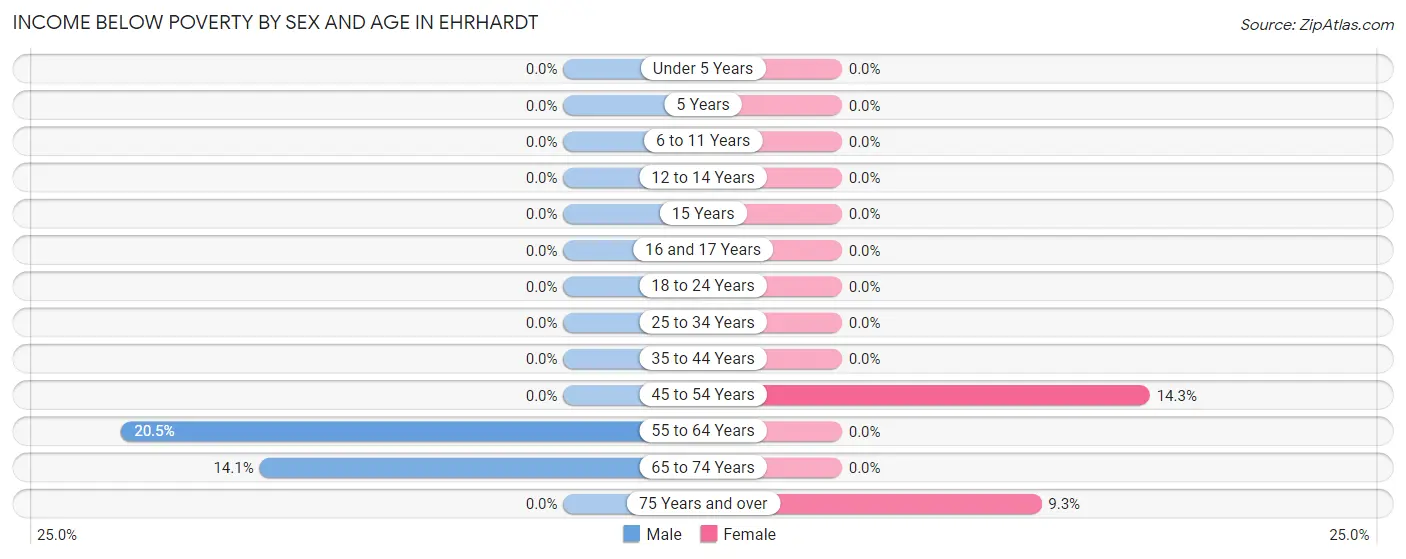
| Age Bracket | Male | Female |
| Under 5 Years | 0 (0.0%) | 0 (0.0%) |
| 5 Years | 0 (0.0%) | 0 (0.0%) |
| 6 to 11 Years | 0 (0.0%) | 0 (0.0%) |
| 12 to 14 Years | 0 (0.0%) | 0 (0.0%) |
| 15 Years | 0 (0.0%) | 0 (0.0%) |
| 16 and 17 Years | 0 (0.0%) | 0 (0.0%) |
| 18 to 24 Years | 0 (0.0%) | 0 (0.0%) |
| 25 to 34 Years | 0 (0.0%) | 0 (0.0%) |
| 35 to 44 Years | 0 (0.0%) | 0 (0.0%) |
| 45 to 54 Years | 0 (0.0%) | 1 (14.3%) |
| 55 to 64 Years | 8 (20.5%) | 0 (0.0%) |
| 65 to 74 Years | 11 (14.1%) | 0 (0.0%) |
| 75 Years and over | 0 (0.0%) | 5 (9.3%) |
| Total | 19 (9.6%) | 6 (2.4%) |
Income Above Poverty by Sex and Age in Ehrhardt
According to the poverty statistics in Ehrhardt, males aged 6 to 11 years and females aged under 5 years are the age groups that are most secure financially, with 100.0% of males and 100.0% of females in these age groups living above the poverty line.
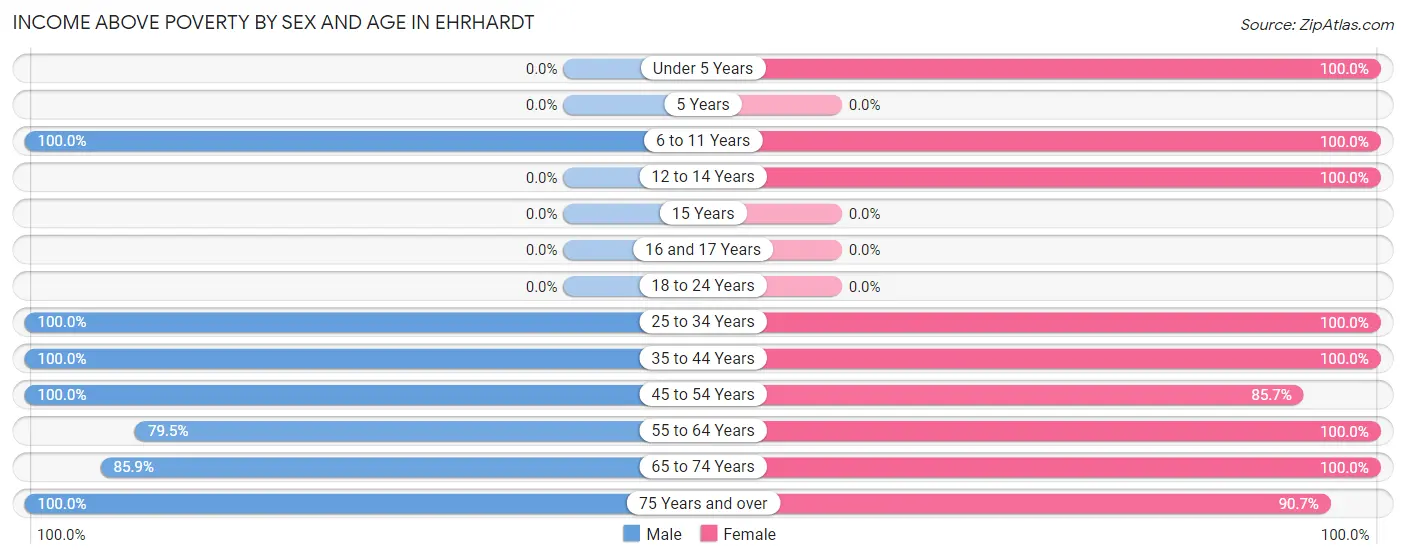
| Age Bracket | Male | Female |
| Under 5 Years | 0 (0.0%) | 14 (100.0%) |
| 5 Years | 0 (0.0%) | 0 (0.0%) |
| 6 to 11 Years | 6 (100.0%) | 6 (100.0%) |
| 12 to 14 Years | 0 (0.0%) | 3 (100.0%) |
| 15 Years | 0 (0.0%) | 0 (0.0%) |
| 16 and 17 Years | 0 (0.0%) | 0 (0.0%) |
| 18 to 24 Years | 0 (0.0%) | 0 (0.0%) |
| 25 to 34 Years | 10 (100.0%) | 13 (100.0%) |
| 35 to 44 Years | 27 (100.0%) | 28 (100.0%) |
| 45 to 54 Years | 10 (100.0%) | 6 (85.7%) |
| 55 to 64 Years | 31 (79.5%) | 73 (100.0%) |
| 65 to 74 Years | 67 (85.9%) | 52 (100.0%) |
| 75 Years and over | 28 (100.0%) | 49 (90.7%) |
| Total | 179 (90.4%) | 244 (97.6%) |
Income Below Poverty Among Married-Couple Families in Ehrhardt
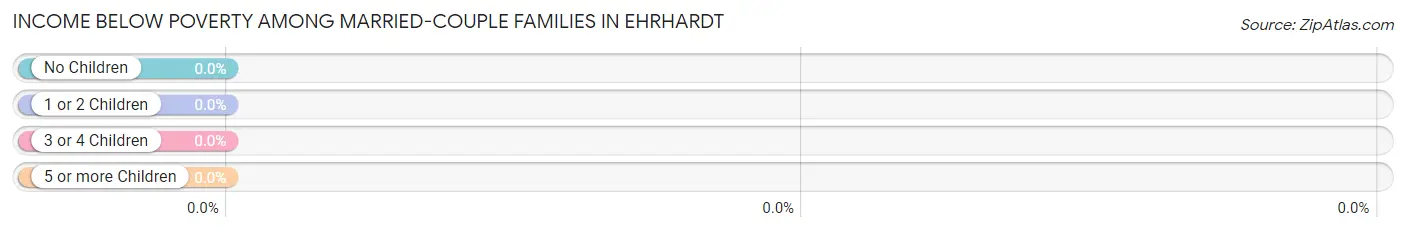
| Children | Above Poverty | Below Poverty |
| No Children | 109 (100.0%) | 0 (0.0%) |
| 1 or 2 Children | 6 (100.0%) | 0 (0.0%) |
| 3 or 4 Children | 0 (0.0%) | 0 (0.0%) |
| 5 or more Children | 0 (0.0%) | 0 (0.0%) |
| Total | 115 (100.0%) | 0 (0.0%) |
Income Below Poverty Among Single-Parent Households in Ehrhardt
| Children | Single Father | Single Mother |
| No Children | 0 (0.0%) | 0 (0.0%) |
| 1 or 2 Children | 0 (0.0%) | 0 (0.0%) |
| 3 or 4 Children | 0 (0.0%) | 0 (0.0%) |
| 5 or more Children | 0 (0.0%) | 0 (0.0%) |
| Total | 0 (0.0%) | 0 (0.0%) |
Income Below Poverty Among Married-Couple vs Single-Parent Households in Ehrhardt
| Children | Married-Couple Families | Single-Parent Households |
| No Children | 0 (0.0%) | 0 (0.0%) |
| 1 or 2 Children | 0 (0.0%) | 0 (0.0%) |
| 3 or 4 Children | 0 (0.0%) | 0 (0.0%) |
| 5 or more Children | 0 (0.0%) | 0 (0.0%) |
| Total | 0 (0.0%) | 0 (0.0%) |
Race in Ehrhardt
The most populous races in Ehrhardt are White / Caucasian (245 | 53.0%), and Black / African American (217 | 47.0%).
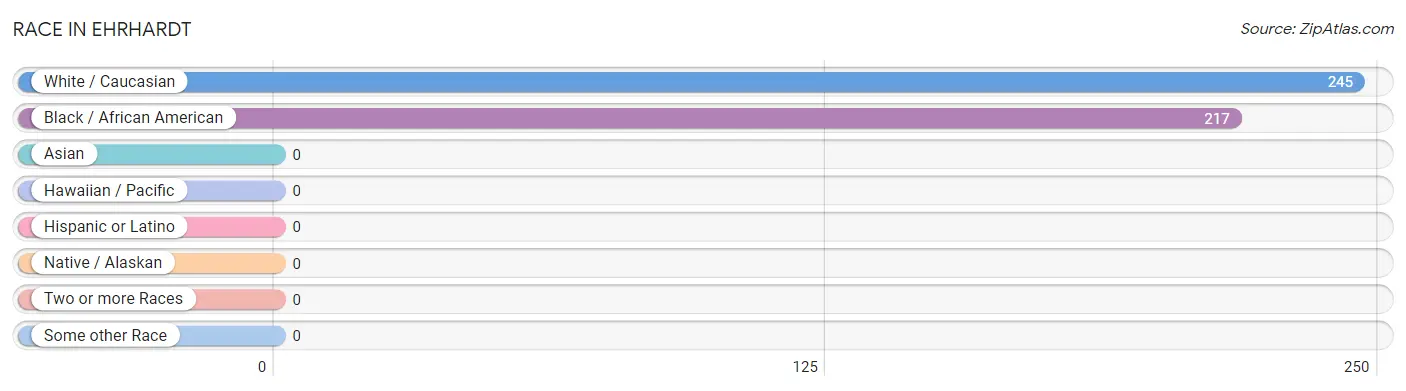
| Race | # Population | % Population |
| Asian | 0 | 0.0% |
| Black / African American | 217 | 47.0% |
| Hawaiian / Pacific | 0 | 0.0% |
| Hispanic or Latino | 0 | 0.0% |
| Native / Alaskan | 0 | 0.0% |
| White / Caucasian | 245 | 53.0% |
| Two or more Races | 0 | 0.0% |
| Some other Race | 0 | 0.0% |
| Total | 462 | 100.0% |
Ancestry in Ehrhardt
The most populous ancestries reported in Ehrhardt are American (119 | 25.8%), German (8 | 1.7%), European (3 | 0.6%), Polish (3 | 0.6%), and Danish (1 | 0.2%), together accounting for 29.0% of all Ehrhardt residents.
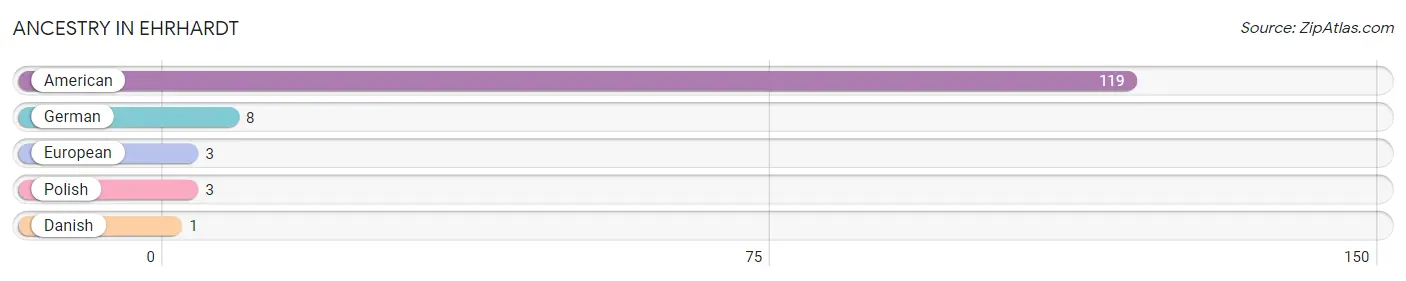
| Ancestry | # Population | % Population |
| American | 119 | 25.8% |
| Danish | 1 | 0.2% |
| European | 3 | 0.6% |
| German | 8 | 1.7% |
| Polish | 3 | 0.6% | View All 5 Rows |
Immigrants in Ehrhardt

| Immigration Origin | # Population | % Population | View All 0 Rows |
Sex and Age in Ehrhardt
Sex and Age in Ehrhardt
The most populous age groups in Ehrhardt are 70 to 74 Years (59 | 28.9%) for men and 60 to 64 Years (45 | 17.4%) for women.
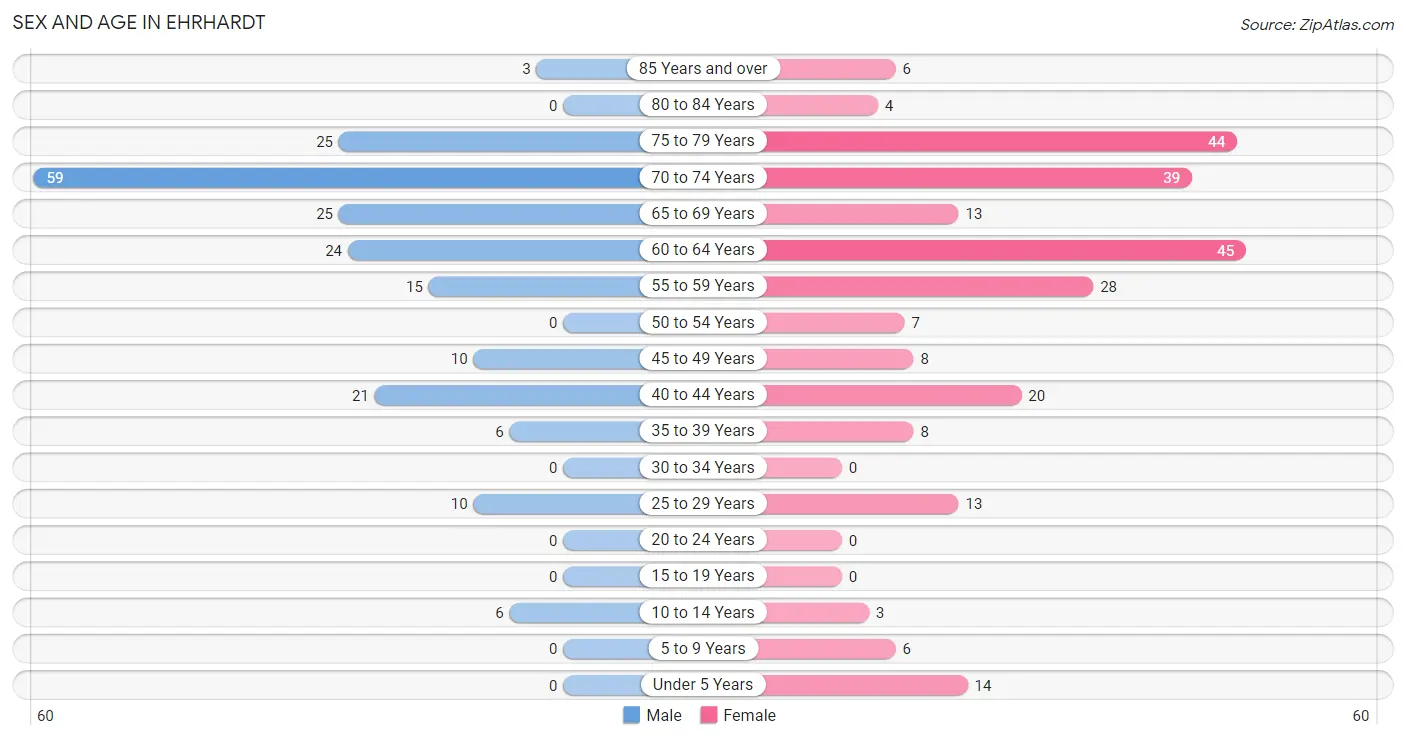
| Age Bracket | Male | Female |
| Under 5 Years | 0 (0.0%) | 14 (5.4%) |
| 5 to 9 Years | 0 (0.0%) | 6 (2.3%) |
| 10 to 14 Years | 6 (2.9%) | 3 (1.2%) |
| 15 to 19 Years | 0 (0.0%) | 0 (0.0%) |
| 20 to 24 Years | 0 (0.0%) | 0 (0.0%) |
| 25 to 29 Years | 10 (4.9%) | 13 (5.0%) |
| 30 to 34 Years | 0 (0.0%) | 0 (0.0%) |
| 35 to 39 Years | 6 (2.9%) | 8 (3.1%) |
| 40 to 44 Years | 21 (10.3%) | 20 (7.7%) |
| 45 to 49 Years | 10 (4.9%) | 8 (3.1%) |
| 50 to 54 Years | 0 (0.0%) | 7 (2.7%) |
| 55 to 59 Years | 15 (7.3%) | 28 (10.8%) |
| 60 to 64 Years | 24 (11.8%) | 45 (17.4%) |
| 65 to 69 Years | 25 (12.2%) | 13 (5.0%) |
| 70 to 74 Years | 59 (28.9%) | 39 (15.1%) |
| 75 to 79 Years | 25 (12.2%) | 44 (17.1%) |
| 80 to 84 Years | 0 (0.0%) | 4 (1.5%) |
| 85 Years and over | 3 (1.5%) | 6 (2.3%) |
| Total | 204 (100.0%) | 258 (100.0%) |
Families and Households in Ehrhardt
Median Family Size in Ehrhardt
The median family size in Ehrhardt is 2.49 persons per family, with single female/mother families (14 | 10.0%) accounting for the largest median family size of 4 persons per family. On the other hand, married-couple families (115 | 82.1%) represent the smallest median family size with 2.31 persons per family.
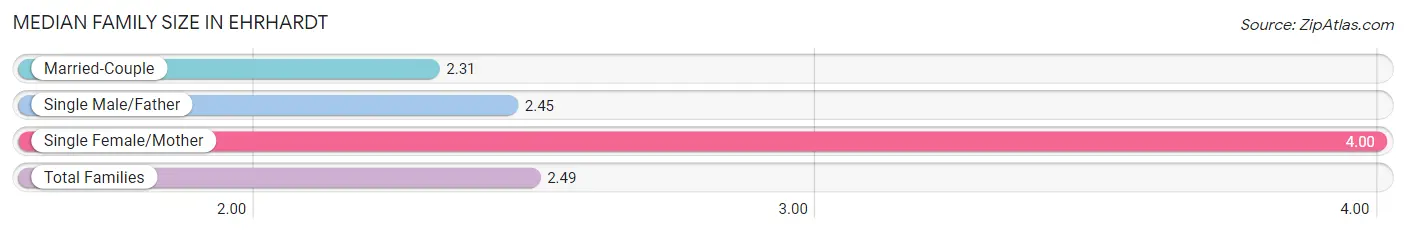
| Family Type | # Families | Family Size |
| Married-Couple | 115 (82.1%) | 2.31 |
| Single Male/Father | 11 (7.9%) | 2.45 |
| Single Female/Mother | 14 (10.0%) | 4.00 |
| Total Families | 140 (100.0%) | 2.49 |
Median Household Size in Ehrhardt
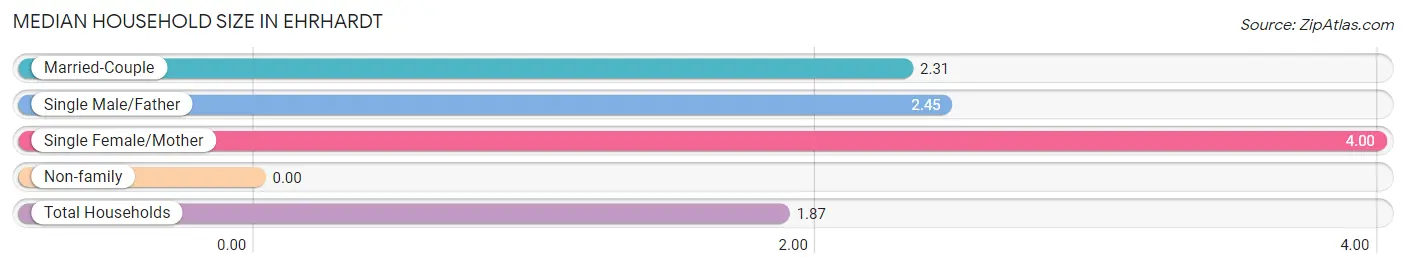
| Household Type | # Households | Household Size |
| Married-Couple | 115 (48.1%) | 2.31 |
| Single Male/Father | 11 (4.6%) | 2.45 |
| Single Female/Mother | 14 (5.9%) | 4.00 |
| Non-family | 99 (41.4%) | - |
| Total Households | 239 (100.0%) | 1.87 |
Household Size by Marriage Status in Ehrhardt
Out of a total of 239 households in Ehrhardt, 140 (58.6%) are family households, while 99 (41.4%) are nonfamily households. The most numerous type of family households are 2-person households, comprising 106, and the most common type of nonfamily households are 1-person households, comprising 99.
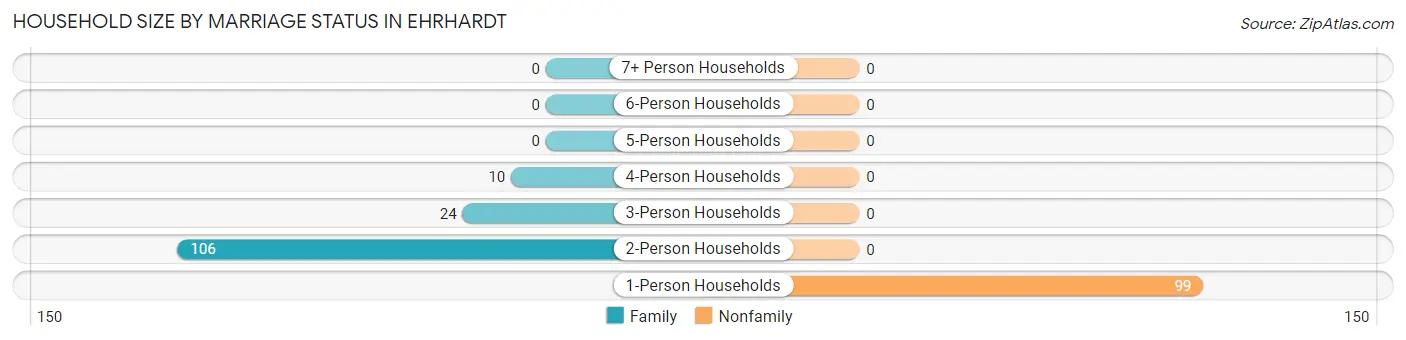
| Household Size | Family Households | Nonfamily Households |
| 1-Person Households | - | 99 (41.4%) |
| 2-Person Households | 106 (44.4%) | 0 (0.0%) |
| 3-Person Households | 24 (10.0%) | 0 (0.0%) |
| 4-Person Households | 10 (4.2%) | 0 (0.0%) |
| 5-Person Households | 0 (0.0%) | 0 (0.0%) |
| 6-Person Households | 0 (0.0%) | 0 (0.0%) |
| 7+ Person Households | 0 (0.0%) | 0 (0.0%) |
| Total | 140 (58.6%) | 99 (41.4%) |
Female Fertility in Ehrhardt
Fertility by Age in Ehrhardt
| Age Bracket | Women with Births | Births / 1,000 Women |
| 15 to 19 years | 0 (0.0%) | 0.0 |
| 20 to 34 years | 0 (0.0%) | 0.0 |
| 35 to 50 years | 0 (0.0%) | 0.0 |
| Total | 0 (0.0%) | 0.0 |
Fertility by Age by Marriage Status in Ehrhardt
| Age Bracket | Married | Unmarried |
| 15 to 19 years | 0 (0.0%) | 0 (0.0%) |
| 20 to 34 years | 0 (0.0%) | 0 (0.0%) |
| 35 to 50 years | 0 (0.0%) | 0 (0.0%) |
| Total | 0 (0.0%) | 0 (0.0%) |
Fertility by Education in Ehrhardt
| Educational Attainment | Women with Births | Births / 1,000 Women |
| Less than High School | 0 (0.0%) | 0.0 |
| High School Diploma | 0 (0.0%) | 0.0 |
| College or Associate's Degree | 0 (0.0%) | 0.0 |
| Bachelor's Degree | 0 (0.0%) | 0.0 |
| Graduate Degree | 0 (0.0%) | 0.0 |
| Total | 0 (0.0%) | 0.0 |
Fertility by Education by Marriage Status in Ehrhardt
| Educational Attainment | Married | Unmarried |
| Less than High School | 0 (0.0%) | 0 (0.0%) |
| High School Diploma | 0 (0.0%) | 0 (0.0%) |
| College or Associate's Degree | 0 (0.0%) | 0 (0.0%) |
| Bachelor's Degree | 0 (0.0%) | 0 (0.0%) |
| Graduate Degree | 0 (0.0%) | 0 (0.0%) |
| Total | 0 (0.0%) | 0 (0.0%) |
Employment Characteristics in Ehrhardt
Employment by Class of Employer in Ehrhardt
Among the 83 employed individuals in Ehrhardt, private company employees (32 | 38.6%), not-for-profit organizations (18 | 21.7%), and federal government employees (17 | 20.5%) make up the most common classes of employment.
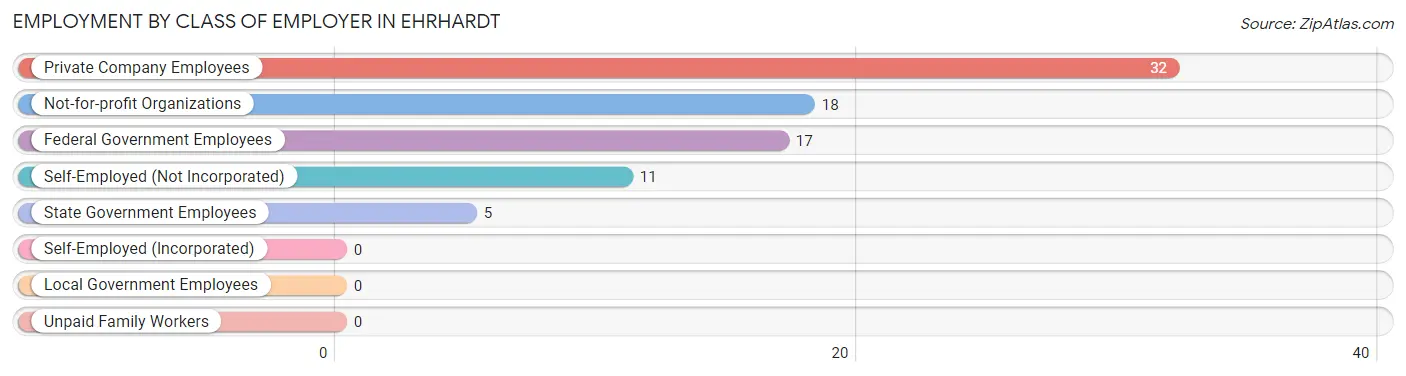
| Employer Class | # Employees | % Employees |
| Private Company Employees | 32 | 38.6% |
| Self-Employed (Incorporated) | 0 | 0.0% |
| Self-Employed (Not Incorporated) | 11 | 13.3% |
| Not-for-profit Organizations | 18 | 21.7% |
| Local Government Employees | 0 | 0.0% |
| State Government Employees | 5 | 6.0% |
| Federal Government Employees | 17 | 20.5% |
| Unpaid Family Workers | 0 | 0.0% |
| Total | 83 | 100.0% |
Employment Status by Age in Ehrhardt
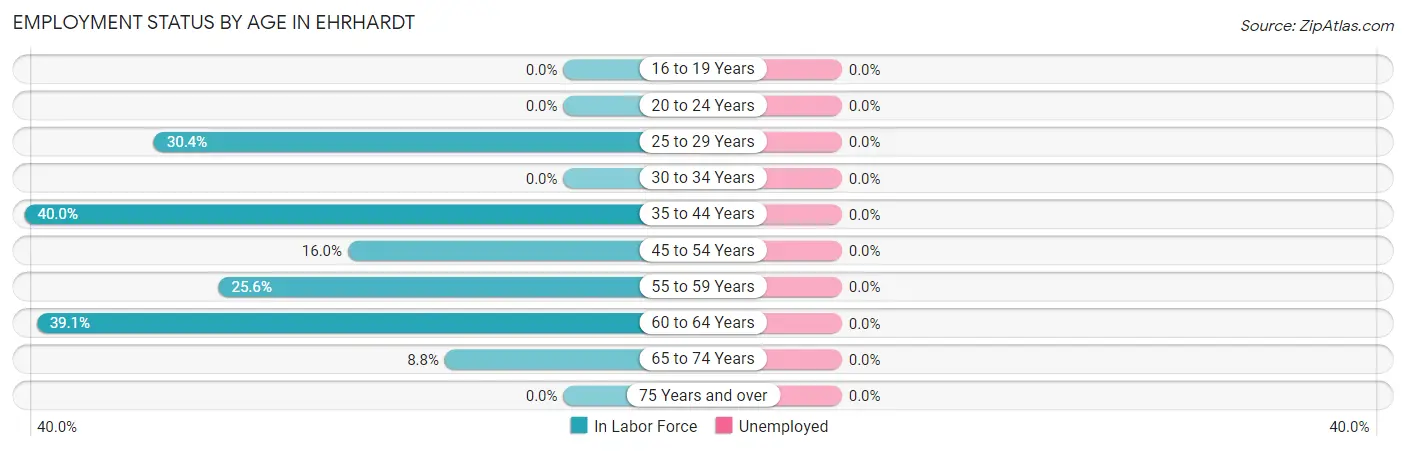
| Age Bracket | In Labor Force | Unemployed |
| 16 to 19 Years | 0 (0.0%) | 0 (0.0%) |
| 20 to 24 Years | 0 (0.0%) | 0 (0.0%) |
| 25 to 29 Years | 7 (30.4%) | 0 (0.0%) |
| 30 to 34 Years | 0 (0.0%) | 0 (0.0%) |
| 35 to 44 Years | 22 (40.0%) | 0 (0.0%) |
| 45 to 54 Years | 4 (16.0%) | 0 (0.0%) |
| 55 to 59 Years | 11 (25.6%) | 0 (0.0%) |
| 60 to 64 Years | 27 (39.1%) | 0 (0.0%) |
| 65 to 74 Years | 12 (8.8%) | 0 (0.0%) |
| 75 Years and over | 0 (0.0%) | 0 (0.0%) |
| Total | 83 (19.2%) | 0 (0.0%) |
Employment Status by Educational Attainment in Ehrhardt
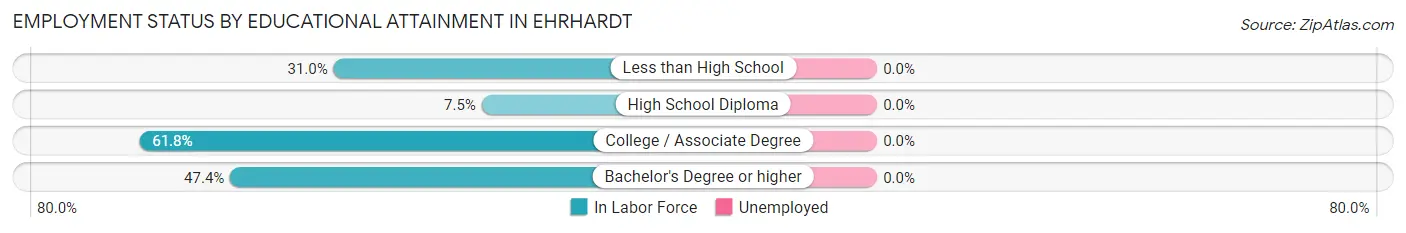
| Educational Attainment | In Labor Force | Unemployed |
| Less than High School | 13 (31.0%) | 0 (0.0%) |
| High School Diploma | 6 (7.5%) | 0 (0.0%) |
| College / Associate Degree | 34 (61.8%) | 0 (0.0%) |
| Bachelor's Degree or higher | 18 (47.4%) | 0 (0.0%) |
| Total | 71 (33.0%) | 0 (0.0%) |
Employment Occupations by Sex in Ehrhardt
Management, Business, Science and Arts Occupations
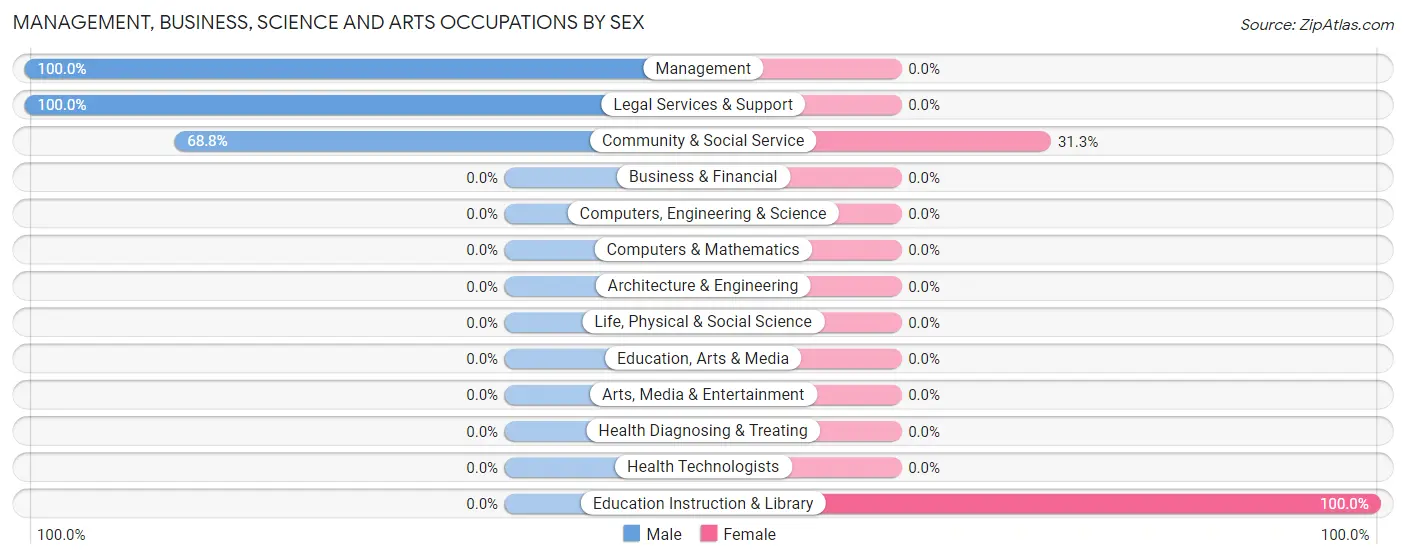
The most common Management, Business, Science and Arts occupations in Ehrhardt are Community & Social Service (16 | 19.3%), Management (11 | 13.3%), Legal Services & Support (11 | 13.3%), and Education Instruction & Library (5 | 6.0%).
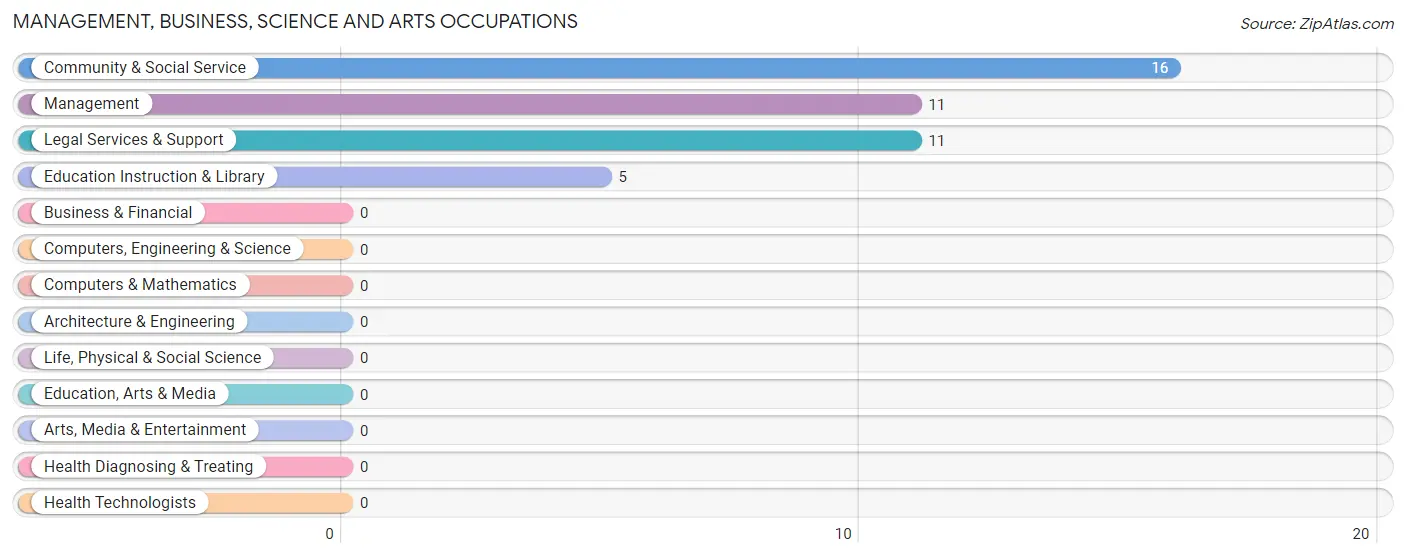
Management, Business, Science and Arts Occupations by Sex
Within the Management, Business, Science and Arts occupations in Ehrhardt, the most male-oriented occupations are Management (100.0%), Legal Services & Support (100.0%), and Community & Social Service (68.8%), while the most female-oriented occupations are Education Instruction & Library (100.0%), and Community & Social Service (31.2%).
| Occupation | Male | Female |
| Management | 11 (100.0%) | 0 (0.0%) |
| Business & Financial | 0 (0.0%) | 0 (0.0%) |
| Computers, Engineering & Science | 0 (0.0%) | 0 (0.0%) |
| Computers & Mathematics | 0 (0.0%) | 0 (0.0%) |
| Architecture & Engineering | 0 (0.0%) | 0 (0.0%) |
| Life, Physical & Social Science | 0 (0.0%) | 0 (0.0%) |
| Community & Social Service | 11 (68.8%) | 5 (31.2%) |
| Education, Arts & Media | 0 (0.0%) | 0 (0.0%) |
| Legal Services & Support | 11 (100.0%) | 0 (0.0%) |
| Education Instruction & Library | 0 (0.0%) | 5 (100.0%) |
| Arts, Media & Entertainment | 0 (0.0%) | 0 (0.0%) |
| Health Diagnosing & Treating | 0 (0.0%) | 0 (0.0%) |
| Health Technologists | 0 (0.0%) | 0 (0.0%) |
| Total (Category) | 22 (81.5%) | 5 (18.5%) |
| Total (Overall) | 40 (48.2%) | 43 (51.8%) |
Services Occupations
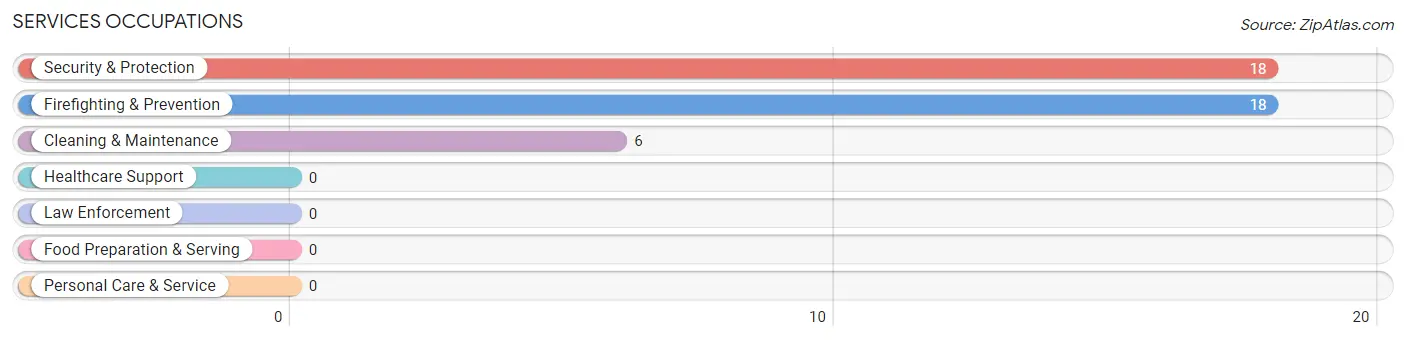
The most common Services occupations in Ehrhardt are Security & Protection (18 | 21.7%), Firefighting & Prevention (18 | 21.7%), and Cleaning & Maintenance (6 | 7.2%).
Services Occupations by Sex
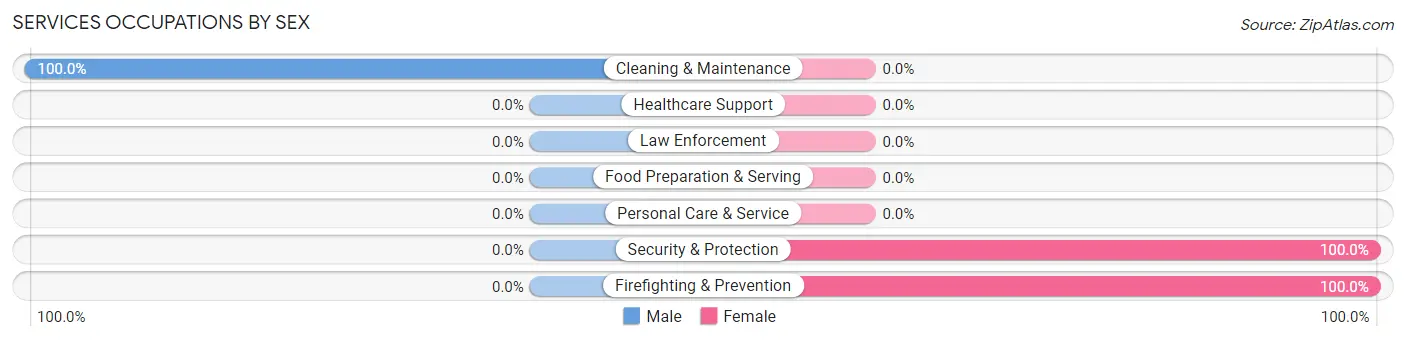
| Occupation | Male | Female |
| Healthcare Support | 0 (0.0%) | 0 (0.0%) |
| Security & Protection | 0 (0.0%) | 18 (100.0%) |
| Firefighting & Prevention | 0 (0.0%) | 18 (100.0%) |
| Law Enforcement | 0 (0.0%) | 0 (0.0%) |
| Food Preparation & Serving | 0 (0.0%) | 0 (0.0%) |
| Cleaning & Maintenance | 6 (100.0%) | 0 (0.0%) |
| Personal Care & Service | 0 (0.0%) | 0 (0.0%) |
| Total (Category) | 6 (25.0%) | 18 (75.0%) |
| Total (Overall) | 40 (48.2%) | 43 (51.8%) |
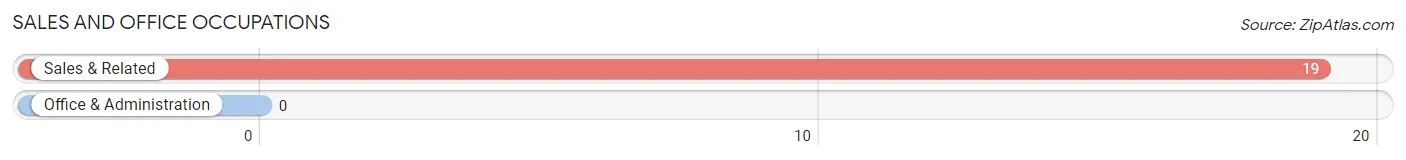
Sales and Office Occupations
The most common Sales and Office occupations in Ehrhardt are , and Sales & Related (19 | 22.9%).
Sales and Office Occupations by Sex
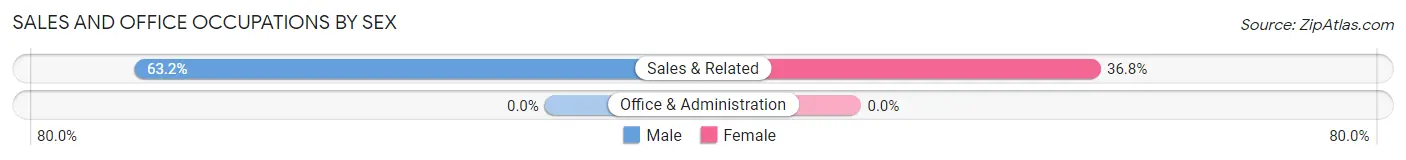
| Occupation | Male | Female |
| Sales & Related | 12 (63.2%) | 7 (36.8%) |
| Office & Administration | 0 (0.0%) | 0 (0.0%) |
| Total (Category) | 12 (63.2%) | 7 (36.8%) |
| Total (Overall) | 40 (48.2%) | 43 (51.8%) |
Natural Resources, Construction and Maintenance Occupations
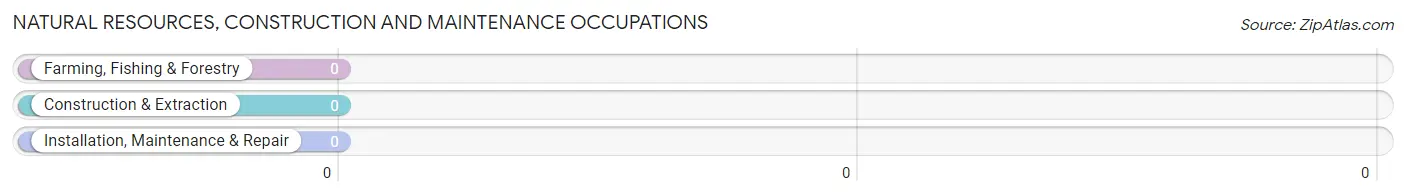
Natural Resources, Construction and Maintenance Occupations by Sex
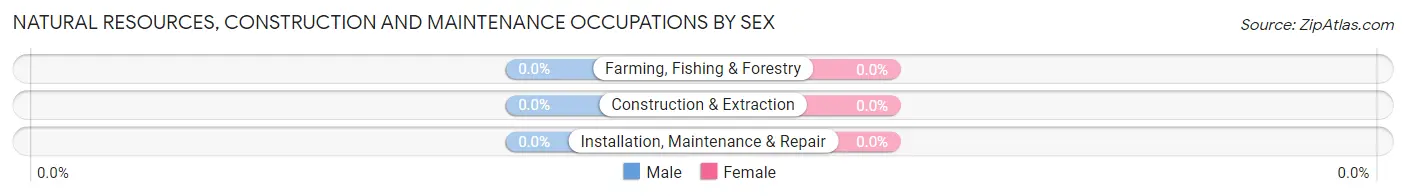
| Occupation | Male | Female |
| Farming, Fishing & Forestry | 0 (0.0%) | 0 (0.0%) |
| Construction & Extraction | 0 (0.0%) | 0 (0.0%) |
| Installation, Maintenance & Repair | 0 (0.0%) | 0 (0.0%) |
| Total (Category) | 0 (0.0%) | 0 (0.0%) |
| Total (Overall) | 40 (48.2%) | 43 (51.8%) |
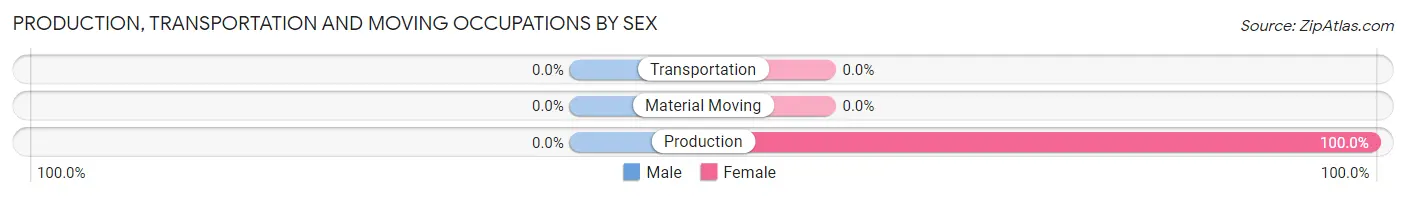
Production, Transportation and Moving Occupations
The most common Production, Transportation and Moving occupations in Ehrhardt are , and Production (13 | 15.7%).
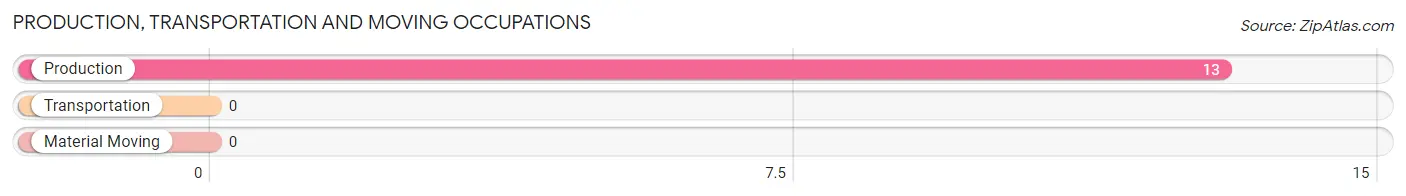
Production, Transportation and Moving Occupations by Sex
| Occupation | Male | Female |
| Production | 0 (0.0%) | 13 (100.0%) |
| Transportation | 0 (0.0%) | 0 (0.0%) |
| Material Moving | 0 (0.0%) | 0 (0.0%) |
| Total (Category) | 0 (0.0%) | 13 (100.0%) |
| Total (Overall) | 40 (48.2%) | 43 (51.8%) |
Employment Industries by Sex in Ehrhardt
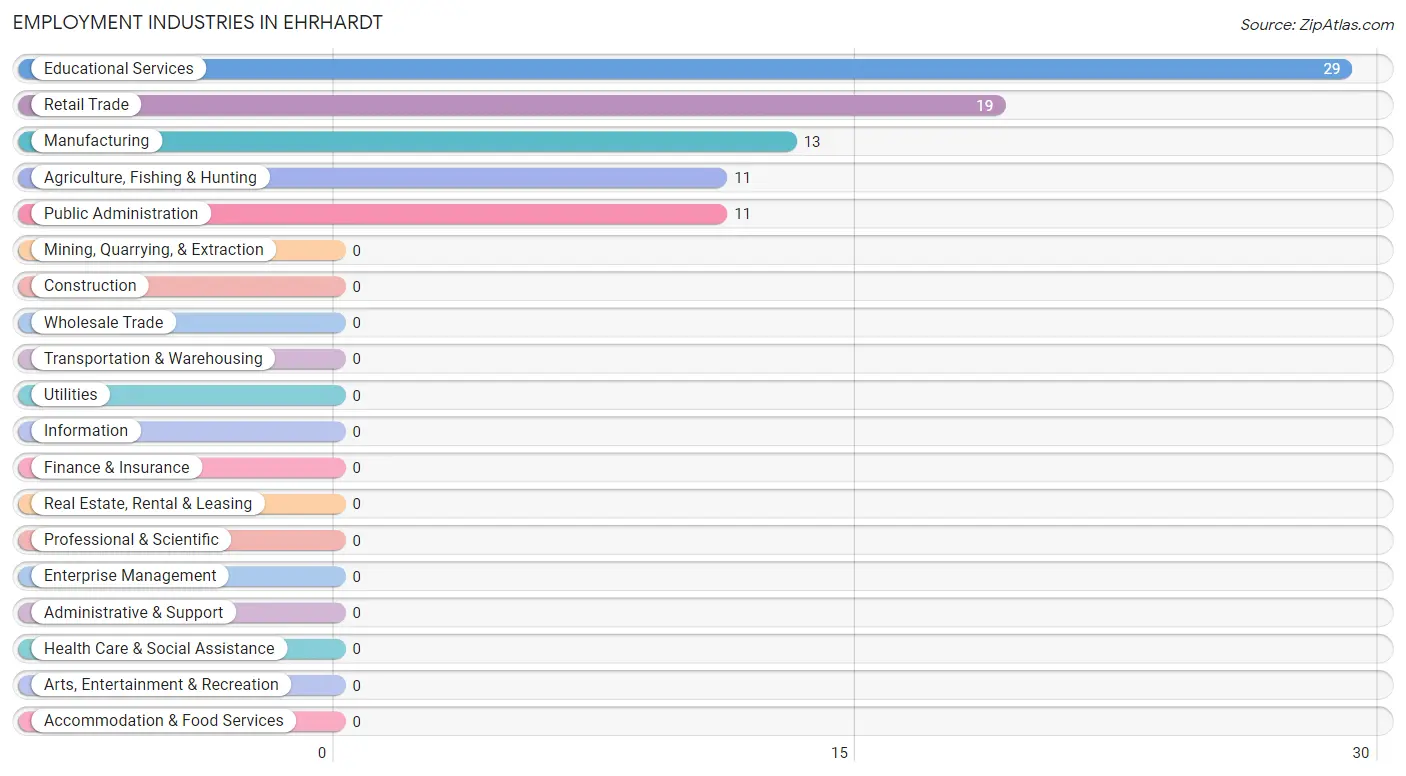
Employment Industries in Ehrhardt
The major employment industries in Ehrhardt include Educational Services (29 | 34.9%), Retail Trade (19 | 22.9%), Manufacturing (13 | 15.7%), Agriculture, Fishing & Hunting (11 | 13.3%), and Public Administration (11 | 13.3%).
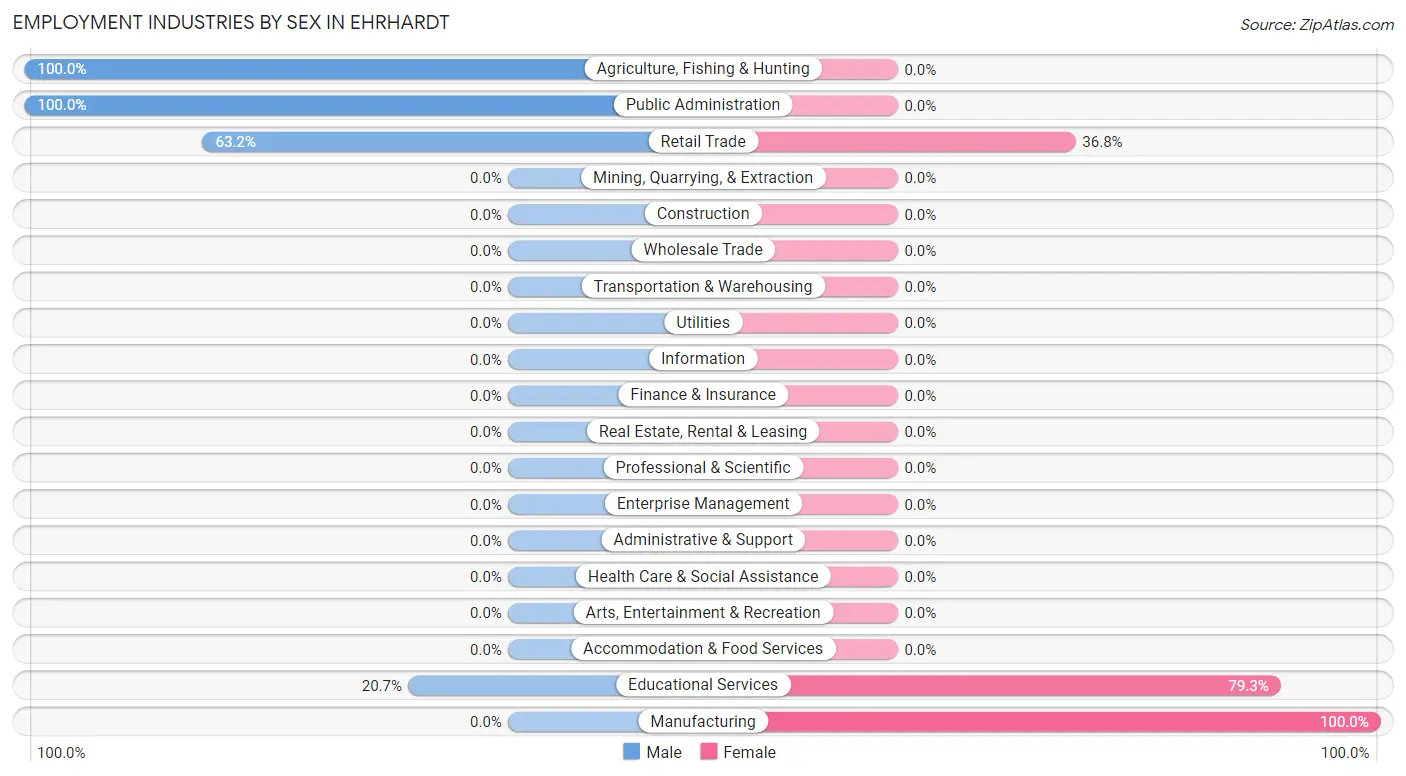
Employment Industries by Sex in Ehrhardt
The Ehrhardt industries that see more men than women are Agriculture, Fishing & Hunting (100.0%), Public Administration (100.0%), and Retail Trade (63.2%), whereas the industries that tend to have a higher number of women are Manufacturing (100.0%), Educational Services (79.3%), and Retail Trade (36.8%).
| Industry | Male | Female |
| Agriculture, Fishing & Hunting | 11 (100.0%) | 0 (0.0%) |
| Mining, Quarrying, & Extraction | 0 (0.0%) | 0 (0.0%) |
| Construction | 0 (0.0%) | 0 (0.0%) |
| Manufacturing | 0 (0.0%) | 13 (100.0%) |
| Wholesale Trade | 0 (0.0%) | 0 (0.0%) |
| Retail Trade | 12 (63.2%) | 7 (36.8%) |
| Transportation & Warehousing | 0 (0.0%) | 0 (0.0%) |
| Utilities | 0 (0.0%) | 0 (0.0%) |
| Information | 0 (0.0%) | 0 (0.0%) |
| Finance & Insurance | 0 (0.0%) | 0 (0.0%) |
| Real Estate, Rental & Leasing | 0 (0.0%) | 0 (0.0%) |
| Professional & Scientific | 0 (0.0%) | 0 (0.0%) |
| Enterprise Management | 0 (0.0%) | 0 (0.0%) |
| Administrative & Support | 0 (0.0%) | 0 (0.0%) |
| Educational Services | 6 (20.7%) | 23 (79.3%) |
| Health Care & Social Assistance | 0 (0.0%) | 0 (0.0%) |
| Arts, Entertainment & Recreation | 0 (0.0%) | 0 (0.0%) |
| Accommodation & Food Services | 0 (0.0%) | 0 (0.0%) |
| Public Administration | 11 (100.0%) | 0 (0.0%) |
| Total | 40 (48.2%) | 43 (51.8%) |
Education in Ehrhardt
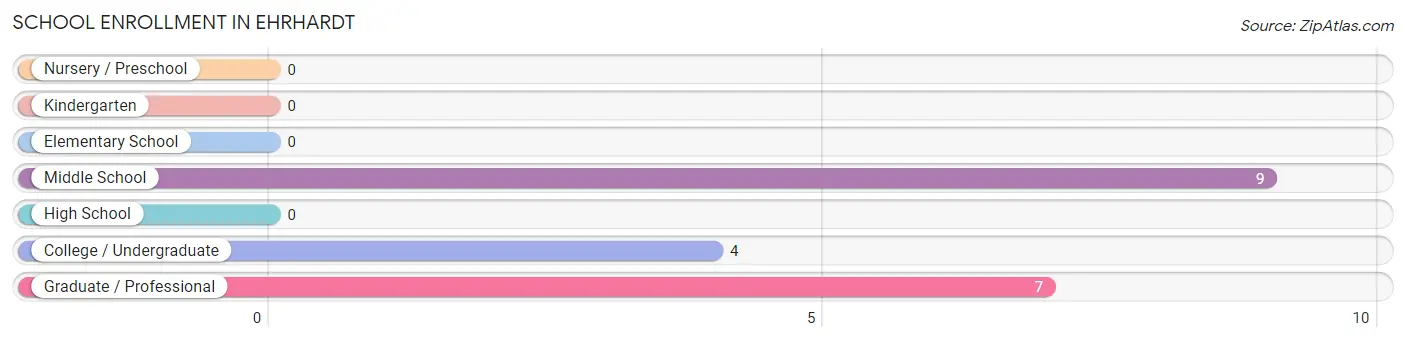
School Enrollment in Ehrhardt
The most common levels of schooling among the 20 students in Ehrhardt are middle school (9 | 45.0%), graduate / professional (7 | 35.0%), and college / undergraduate (4 | 20.0%).
| School Level | # Students | % Students |
| Nursery / Preschool | 0 | 0.0% |
| Kindergarten | 0 | 0.0% |
| Elementary School | 0 | 0.0% |
| Middle School | 9 | 45.0% |
| High School | 0 | 0.0% |
| College / Undergraduate | 4 | 20.0% |
| Graduate / Professional | 7 | 35.0% |
| Total | 20 | 100.0% |
School Enrollment by Age by Funding Source in Ehrhardt
Out of a total of 20 students who are enrolled in schools in Ehrhardt, 7 (35.0%) attend a private institution, while the remaining 13 (65.0%) are enrolled in public schools. The age group of 25 to 34 year olds has the highest likelihood of being enrolled in private schools, with 7 (100.0% in the age bracket) enrolled. Conversely, the age group of 10 to 14 year olds has the lowest likelihood of being enrolled in a private school, with 9 (100.0% in the age bracket) attending a public institution.
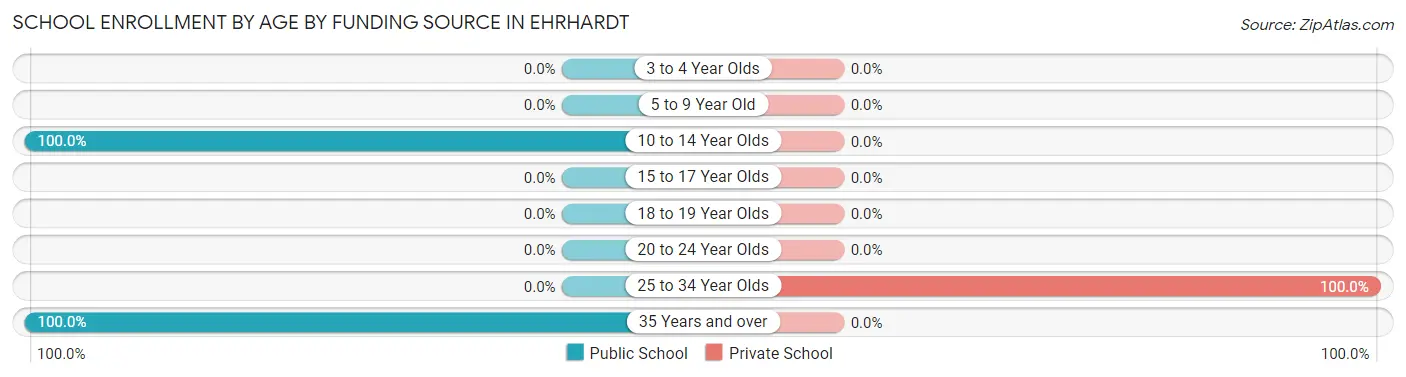
| Age Bracket | Public School | Private School |
| 3 to 4 Year Olds | 0 (0.0%) | 0 (0.0%) |
| 5 to 9 Year Old | 0 (0.0%) | 0 (0.0%) |
| 10 to 14 Year Olds | 9 (100.0%) | 0 (0.0%) |
| 15 to 17 Year Olds | 0 (0.0%) | 0 (0.0%) |
| 18 to 19 Year Olds | 0 (0.0%) | 0 (0.0%) |
| 20 to 24 Year Olds | 0 (0.0%) | 0 (0.0%) |
| 25 to 34 Year Olds | 0 (0.0%) | 7 (100.0%) |
| 35 Years and over | 4 (100.0%) | 0 (0.0%) |
| Total | 13 (65.0%) | 7 (35.0%) |
Educational Attainment by Field of Study in Ehrhardt
Education (46 | 37.7%), physical & health sciences (24 | 19.7%), arts & humanities (14 | 11.5%), business (12 | 9.8%), and science & technology (10 | 8.2%) are the most common fields of study among 122 individuals in Ehrhardt who have obtained a bachelor's degree or higher.
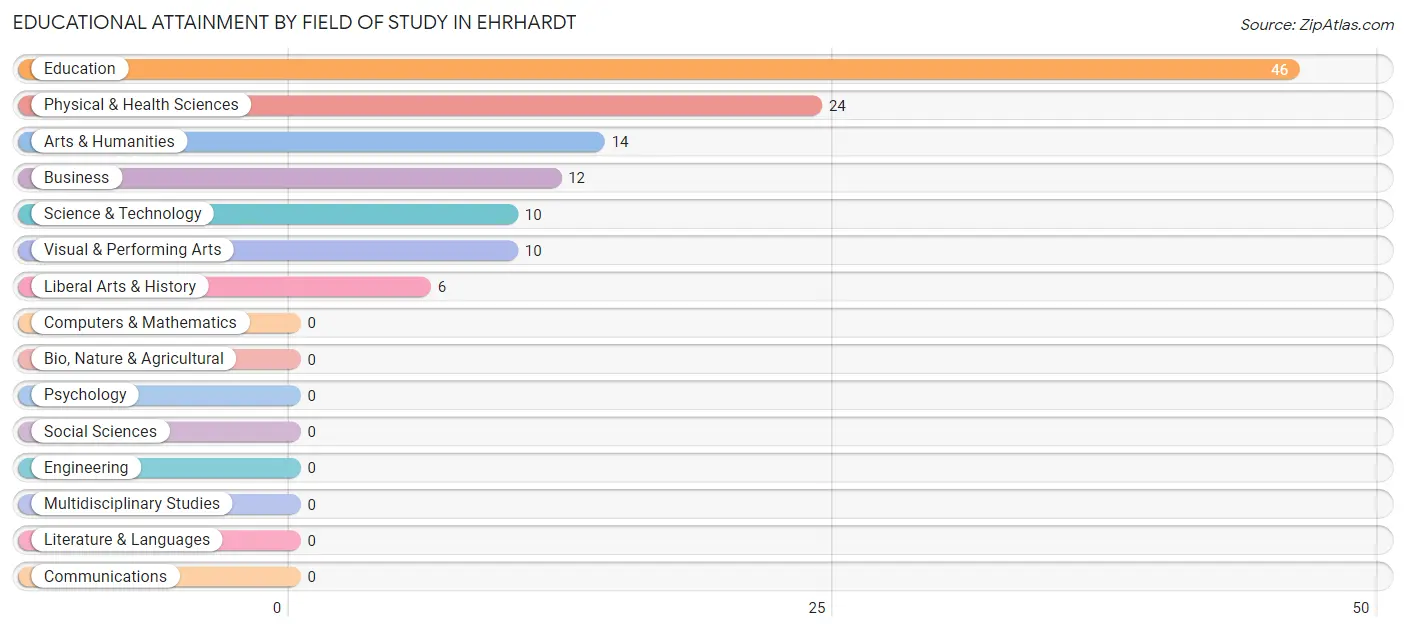
| Field of Study | # Graduates | % Graduates |
| Computers & Mathematics | 0 | 0.0% |
| Bio, Nature & Agricultural | 0 | 0.0% |
| Physical & Health Sciences | 24 | 19.7% |
| Psychology | 0 | 0.0% |
| Social Sciences | 0 | 0.0% |
| Engineering | 0 | 0.0% |
| Multidisciplinary Studies | 0 | 0.0% |
| Science & Technology | 10 | 8.2% |
| Business | 12 | 9.8% |
| Education | 46 | 37.7% |
| Literature & Languages | 0 | 0.0% |
| Liberal Arts & History | 6 | 4.9% |
| Visual & Performing Arts | 10 | 8.2% |
| Communications | 0 | 0.0% |
| Arts & Humanities | 14 | 11.5% |
| Total | 122 | 100.0% |
Transportation & Commute in Ehrhardt
Vehicle Availability by Sex in Ehrhardt
The most prevalent vehicle ownership categories in Ehrhardt are males with 1 vehicle (18, accounting for 45.0%) and females with 1 vehicle (22, making up 41.9%).
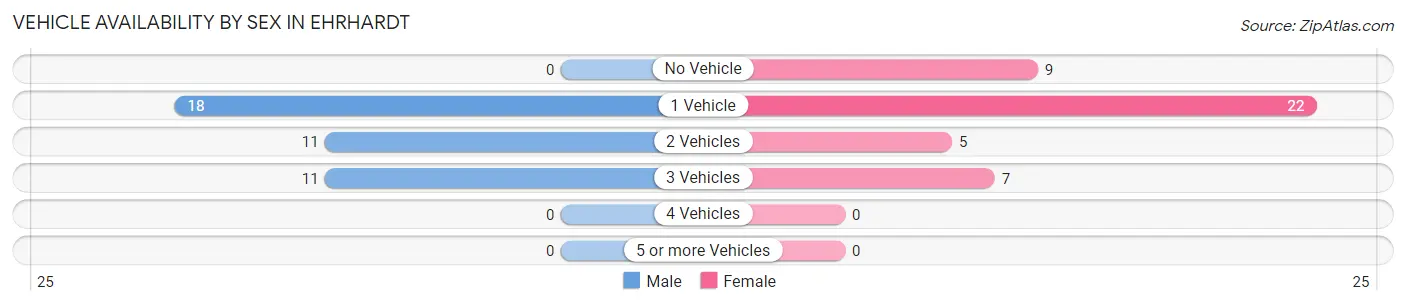
| Vehicles Available | Male | Female |
| No Vehicle | 0 (0.0%) | 9 (20.9%) |
| 1 Vehicle | 18 (45.0%) | 22 (51.2%) |
| 2 Vehicles | 11 (27.5%) | 5 (11.6%) |
| 3 Vehicles | 11 (27.5%) | 7 (16.3%) |
| 4 Vehicles | 0 (0.0%) | 0 (0.0%) |
| 5 or more Vehicles | 0 (0.0%) | 0 (0.0%) |
| Total | 40 (100.0%) | 43 (100.0%) |
Commute Time in Ehrhardt
The most frequently occuring commute durations in Ehrhardt are 20 to 24 minutes (32 commuters, 44.4%), less than 5 minutes (12 commuters, 16.7%), and 90 or more minutes (11 commuters, 15.3%).
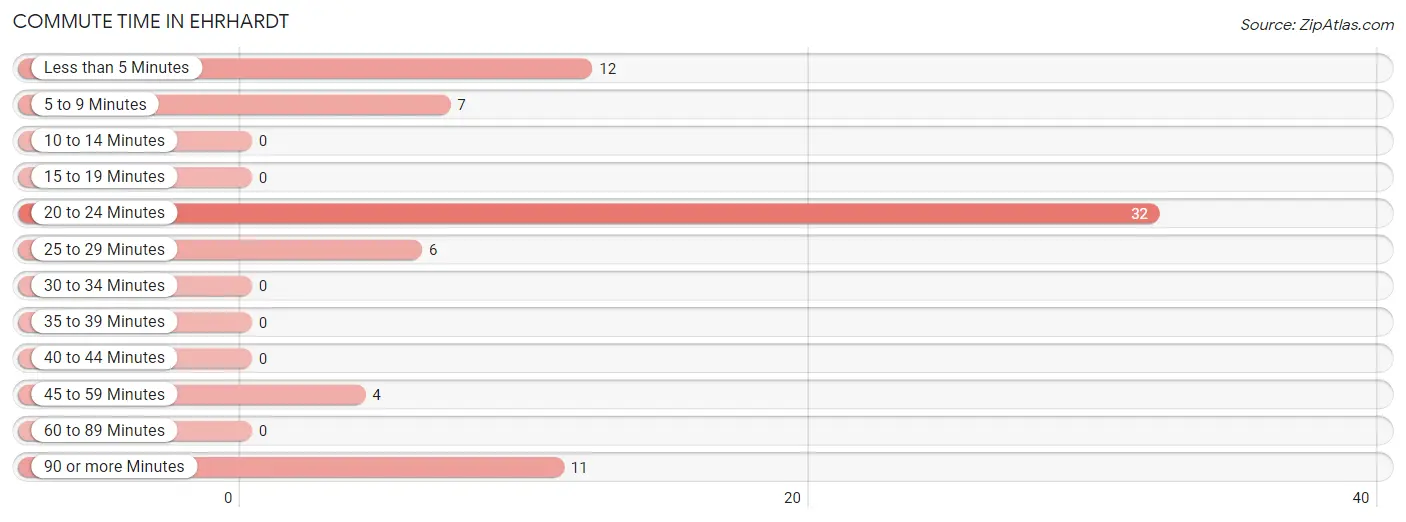
| Commute Time | # Commuters | % Commuters |
| Less than 5 Minutes | 12 | 16.7% |
| 5 to 9 Minutes | 7 | 9.7% |
| 10 to 14 Minutes | 0 | 0.0% |
| 15 to 19 Minutes | 0 | 0.0% |
| 20 to 24 Minutes | 32 | 44.4% |
| 25 to 29 Minutes | 6 | 8.3% |
| 30 to 34 Minutes | 0 | 0.0% |
| 35 to 39 Minutes | 0 | 0.0% |
| 40 to 44 Minutes | 0 | 0.0% |
| 45 to 59 Minutes | 4 | 5.6% |
| 60 to 89 Minutes | 0 | 0.0% |
| 90 or more Minutes | 11 | 15.3% |
Commute Time by Sex in Ehrhardt
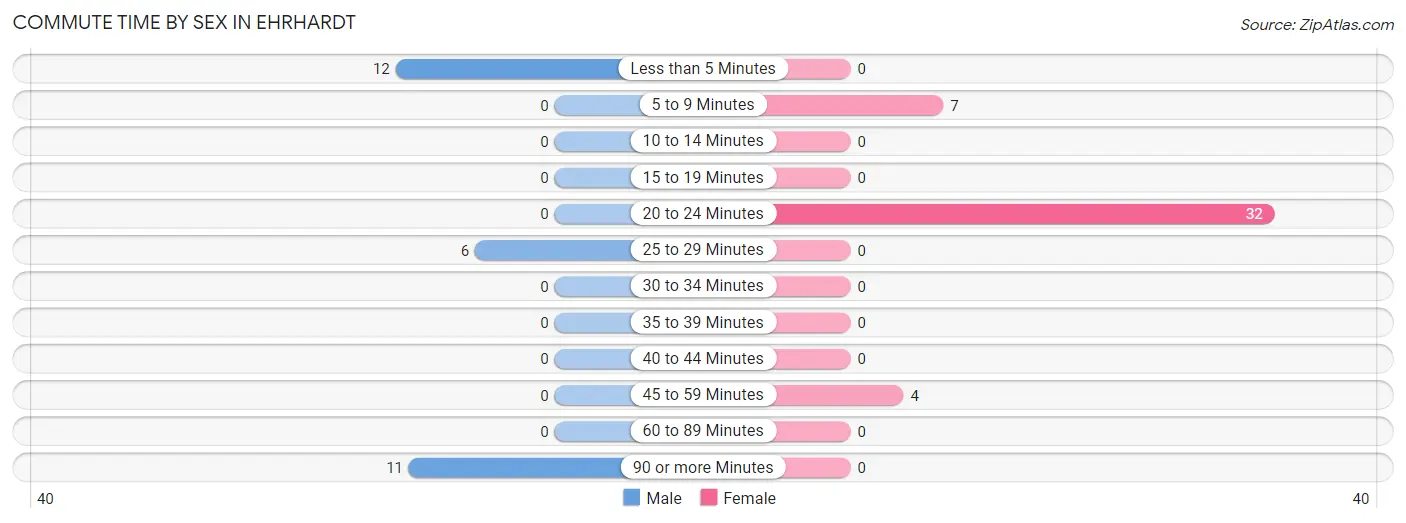
The most common commute times in Ehrhardt are less than 5 minutes (12 commuters, 41.4%) for males and 20 to 24 minutes (32 commuters, 74.4%) for females.
| Commute Time | Male | Female |
| Less than 5 Minutes | 12 (41.4%) | 0 (0.0%) |
| 5 to 9 Minutes | 0 (0.0%) | 7 (16.3%) |
| 10 to 14 Minutes | 0 (0.0%) | 0 (0.0%) |
| 15 to 19 Minutes | 0 (0.0%) | 0 (0.0%) |
| 20 to 24 Minutes | 0 (0.0%) | 32 (74.4%) |
| 25 to 29 Minutes | 6 (20.7%) | 0 (0.0%) |
| 30 to 34 Minutes | 0 (0.0%) | 0 (0.0%) |
| 35 to 39 Minutes | 0 (0.0%) | 0 (0.0%) |
| 40 to 44 Minutes | 0 (0.0%) | 0 (0.0%) |
| 45 to 59 Minutes | 0 (0.0%) | 4 (9.3%) |
| 60 to 89 Minutes | 0 (0.0%) | 0 (0.0%) |
| 90 or more Minutes | 11 (37.9%) | 0 (0.0%) |
Time of Departure to Work by Sex in Ehrhardt
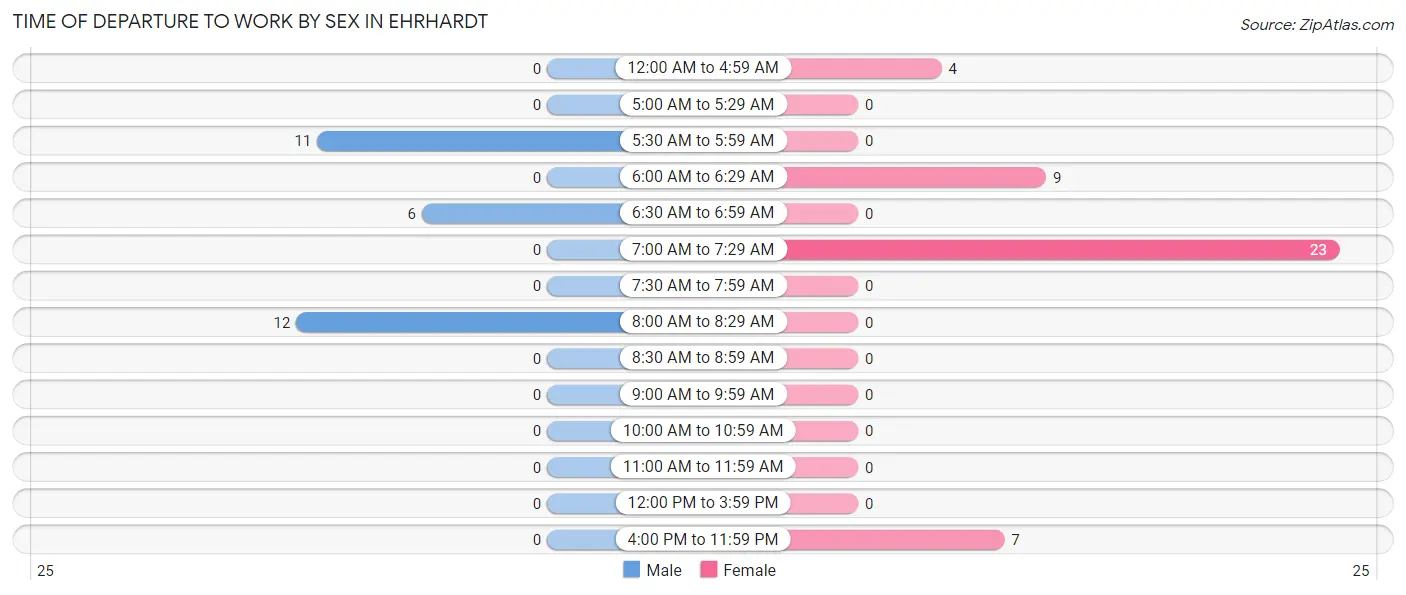
The most frequent times of departure to work in Ehrhardt are 8:00 AM to 8:29 AM (12, 41.4%) for males and 7:00 AM to 7:29 AM (23, 53.5%) for females.
| Time of Departure | Male | Female |
| 12:00 AM to 4:59 AM | 0 (0.0%) | 4 (9.3%) |
| 5:00 AM to 5:29 AM | 0 (0.0%) | 0 (0.0%) |
| 5:30 AM to 5:59 AM | 11 (37.9%) | 0 (0.0%) |
| 6:00 AM to 6:29 AM | 0 (0.0%) | 9 (20.9%) |
| 6:30 AM to 6:59 AM | 6 (20.7%) | 0 (0.0%) |
| 7:00 AM to 7:29 AM | 0 (0.0%) | 23 (53.5%) |
| 7:30 AM to 7:59 AM | 0 (0.0%) | 0 (0.0%) |
| 8:00 AM to 8:29 AM | 12 (41.4%) | 0 (0.0%) |
| 8:30 AM to 8:59 AM | 0 (0.0%) | 0 (0.0%) |
| 9:00 AM to 9:59 AM | 0 (0.0%) | 0 (0.0%) |
| 10:00 AM to 10:59 AM | 0 (0.0%) | 0 (0.0%) |
| 11:00 AM to 11:59 AM | 0 (0.0%) | 0 (0.0%) |
| 12:00 PM to 3:59 PM | 0 (0.0%) | 0 (0.0%) |
| 4:00 PM to 11:59 PM | 0 (0.0%) | 7 (16.3%) |
| Total | 29 (100.0%) | 43 (100.0%) |
Housing Occupancy in Ehrhardt
Occupancy by Ownership in Ehrhardt
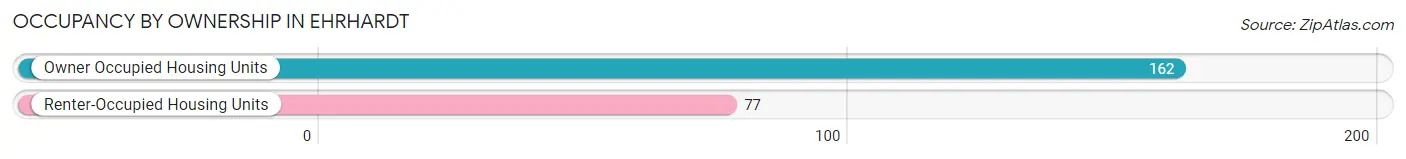
Of the total 239 dwellings in Ehrhardt, owner-occupied units account for 162 (67.8%), while renter-occupied units make up 77 (32.2%).
| Occupancy | # Housing Units | % Housing Units |
| Owner Occupied Housing Units | 162 | 67.8% |
| Renter-Occupied Housing Units | 77 | 32.2% |
| Total Occupied Housing Units | 239 | 100.0% |
Occupancy by Household Size in Ehrhardt
| Household Size | # Housing Units | % Housing Units |
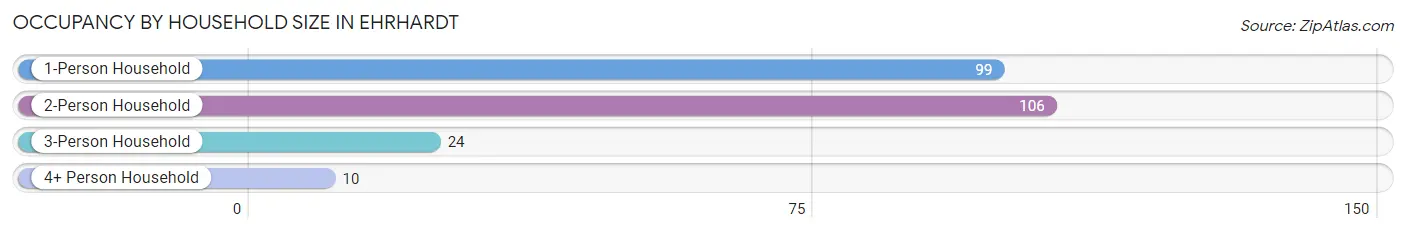
| 1-Person Household | 99 | 41.4% |
| 2-Person Household | 106 | 44.4% |
| 3-Person Household | 24 | 10.0% |
| 4+ Person Household | 10 | 4.2% |
| Total Housing Units | 239 | 100.0% |
Occupancy by Ownership by Household Size in Ehrhardt

| Household Size | Owner-occupied | Renter-occupied |
| 1-Person Household | 51 (51.5%) | 48 (48.5%) |
| 2-Person Household | 83 (78.3%) | 23 (21.7%) |
| 3-Person Household | 24 (100.0%) | 0 (0.0%) |
| 4+ Person Household | 4 (40.0%) | 6 (60.0%) |
| Total Housing Units | 162 (67.8%) | 77 (32.2%) |
Occupancy by Educational Attainment in Ehrhardt
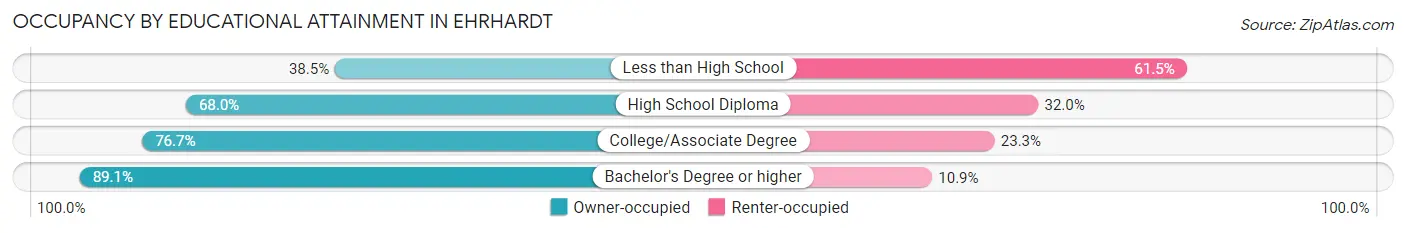
| Household Size | Owner-occupied | Renter-occupied |
| Less than High School | 25 (38.5%) | 40 (61.5%) |
| High School Diploma | 34 (68.0%) | 16 (32.0%) |
| College/Associate Degree | 46 (76.7%) | 14 (23.3%) |
| Bachelor's Degree or higher | 57 (89.1%) | 7 (10.9%) |
Occupancy by Age of Householder in Ehrhardt
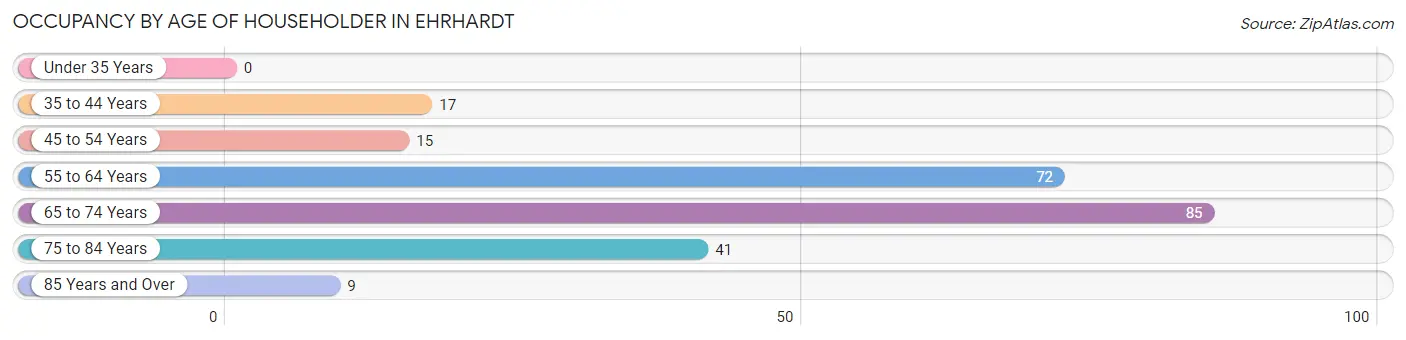
| Age Bracket | # Households | % Households |
| Under 35 Years | 0 | 0.0% |
| 35 to 44 Years | 17 | 7.1% |
| 45 to 54 Years | 15 | 6.3% |
| 55 to 64 Years | 72 | 30.1% |
| 65 to 74 Years | 85 | 35.6% |
| 75 to 84 Years | 41 | 17.2% |
| 85 Years and Over | 9 | 3.8% |
| Total | 239 | 100.0% |
Housing Finances in Ehrhardt
Median Income by Occupancy in Ehrhardt
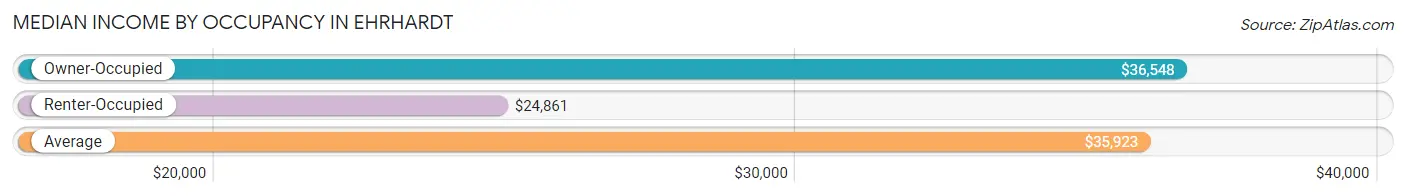
| Occupancy Type | # Households | Median Income |
| Owner-Occupied | 162 (67.8%) | $36,548 |
| Renter-Occupied | 77 (32.2%) | $24,861 |
| Average | 239 (100.0%) | $35,923 |
Occupancy by Householder Income Bracket in Ehrhardt
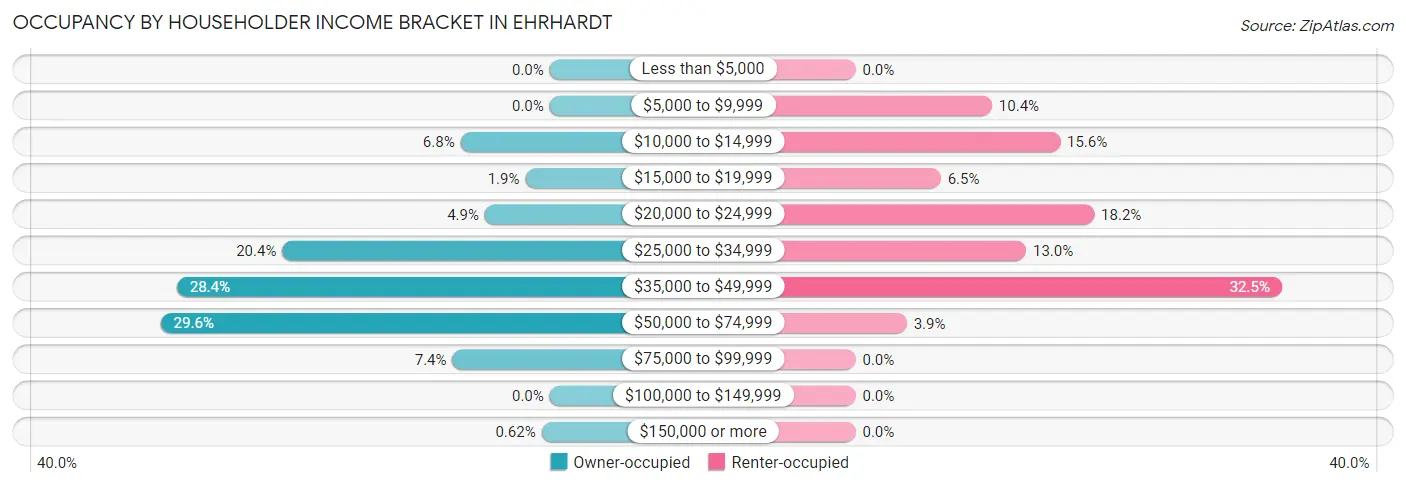
| Income Bracket | Owner-occupied | Renter-occupied |
| Less than $5,000 | 0 (0.0%) | 0 (0.0%) |
| $5,000 to $9,999 | 0 (0.0%) | 8 (10.4%) |
| $10,000 to $14,999 | 11 (6.8%) | 12 (15.6%) |
| $15,000 to $19,999 | 3 (1.8%) | 5 (6.5%) |
| $20,000 to $24,999 | 8 (4.9%) | 14 (18.2%) |
| $25,000 to $34,999 | 33 (20.4%) | 10 (13.0%) |
| $35,000 to $49,999 | 46 (28.4%) | 25 (32.5%) |
| $50,000 to $74,999 | 48 (29.6%) | 3 (3.9%) |
| $75,000 to $99,999 | 12 (7.4%) | 0 (0.0%) |
| $100,000 to $149,999 | 0 (0.0%) | 0 (0.0%) |
| $150,000 or more | 1 (0.6%) | 0 (0.0%) |
| Total | 162 (100.0%) | 77 (100.0%) |
Monthly Housing Cost Tiers in Ehrhardt
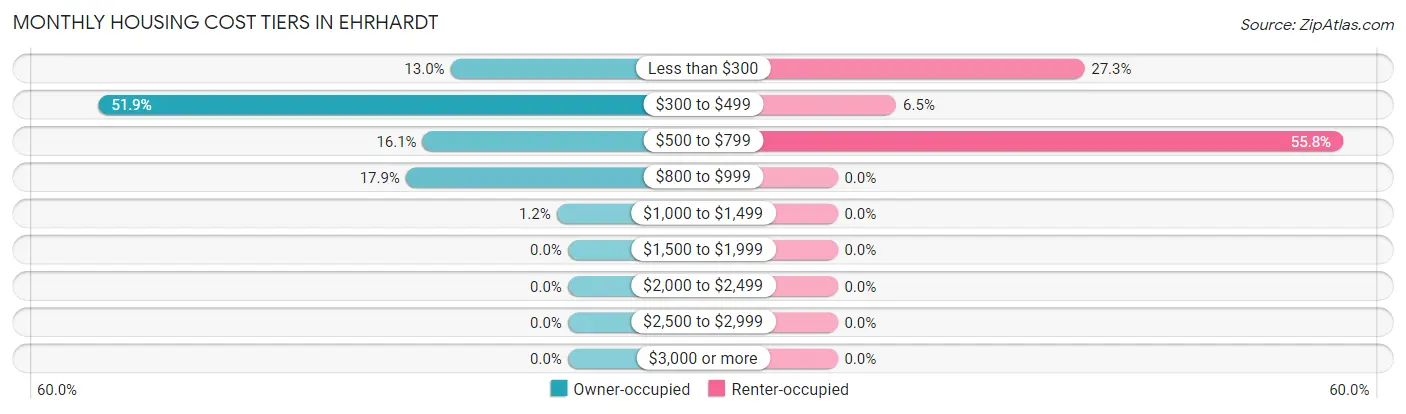
| Monthly Cost | Owner-occupied | Renter-occupied |
| Less than $300 | 21 (13.0%) | 21 (27.3%) |
| $300 to $499 | 84 (51.8%) | 5 (6.5%) |
| $500 to $799 | 26 (16.1%) | 43 (55.8%) |
| $800 to $999 | 29 (17.9%) | 0 (0.0%) |
| $1,000 to $1,499 | 2 (1.2%) | 0 (0.0%) |
| $1,500 to $1,999 | 0 (0.0%) | 0 (0.0%) |
| $2,000 to $2,499 | 0 (0.0%) | 0 (0.0%) |
| $2,500 to $2,999 | 0 (0.0%) | 0 (0.0%) |
| $3,000 or more | 0 (0.0%) | 0 (0.0%) |
| Total | 162 (100.0%) | 77 (100.0%) |
Physical Housing Characteristics in Ehrhardt
Housing Structures in Ehrhardt
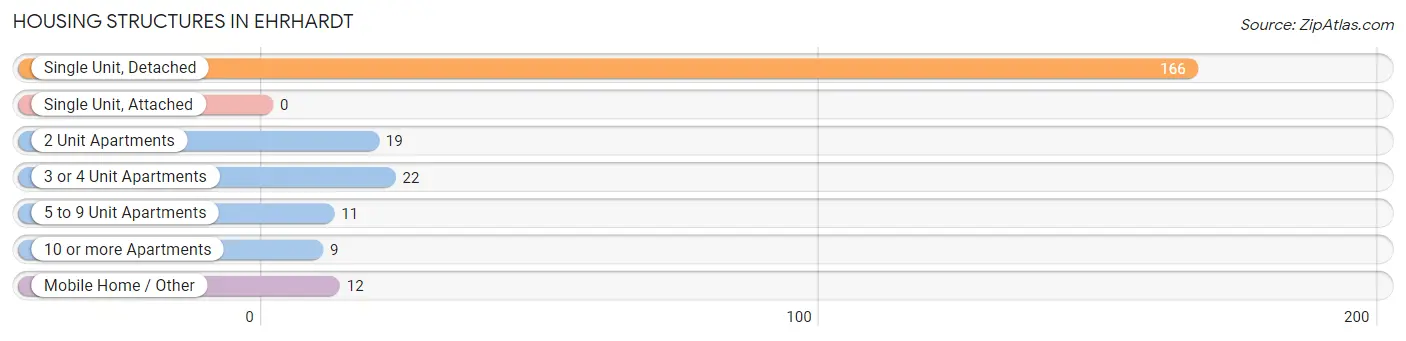
| Structure Type | # Housing Units | % Housing Units |
| Single Unit, Detached | 166 | 69.5% |
| Single Unit, Attached | 0 | 0.0% |
| 2 Unit Apartments | 19 | 8.0% |
| 3 or 4 Unit Apartments | 22 | 9.2% |
| 5 to 9 Unit Apartments | 11 | 4.6% |
| 10 or more Apartments | 9 | 3.8% |
| Mobile Home / Other | 12 | 5.0% |
| Total | 239 | 100.0% |
Housing Structures by Occupancy in Ehrhardt
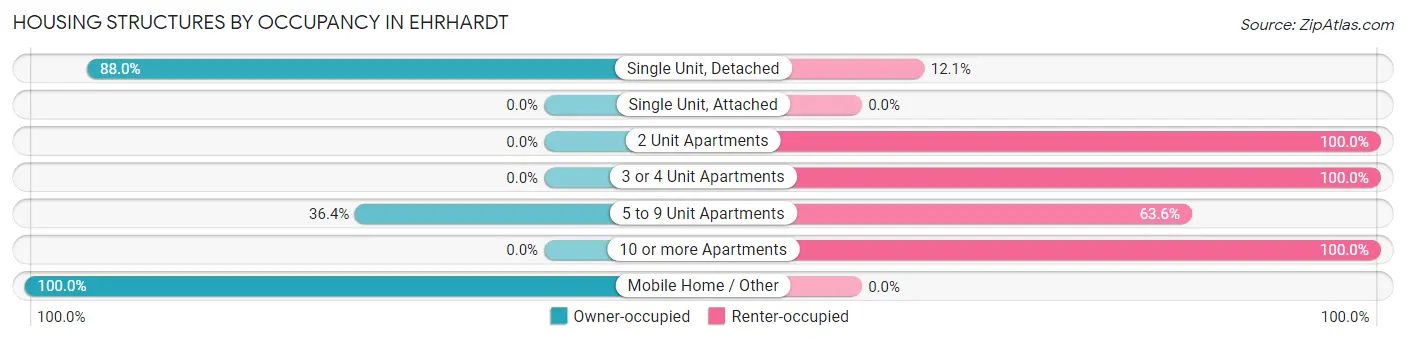
| Structure Type | Owner-occupied | Renter-occupied |
| Single Unit, Detached | 146 (87.9%) | 20 (12.0%) |
| Single Unit, Attached | 0 (0.0%) | 0 (0.0%) |
| 2 Unit Apartments | 0 (0.0%) | 19 (100.0%) |
| 3 or 4 Unit Apartments | 0 (0.0%) | 22 (100.0%) |
| 5 to 9 Unit Apartments | 4 (36.4%) | 7 (63.6%) |
| 10 or more Apartments | 0 (0.0%) | 9 (100.0%) |
| Mobile Home / Other | 12 (100.0%) | 0 (0.0%) |
| Total | 162 (67.8%) | 77 (32.2%) |
Housing Structures by Number of Rooms in Ehrhardt
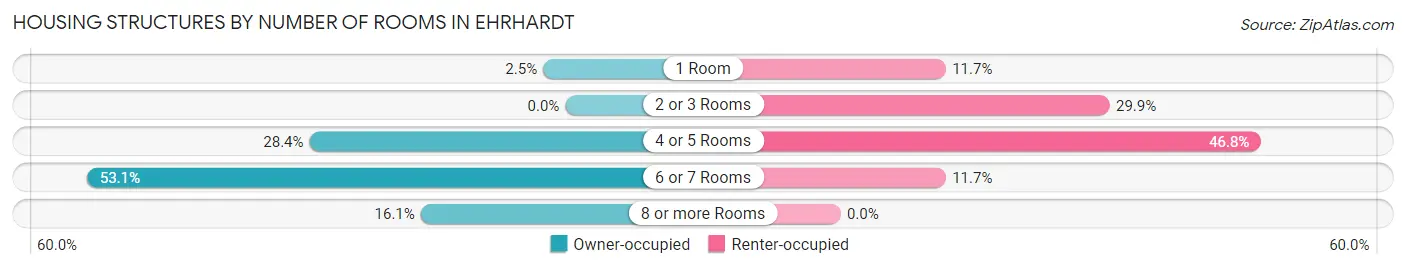
| Number of Rooms | Owner-occupied | Renter-occupied |
| 1 Room | 4 (2.5%) | 9 (11.7%) |
| 2 or 3 Rooms | 0 (0.0%) | 23 (29.9%) |
| 4 or 5 Rooms | 46 (28.4%) | 36 (46.8%) |
| 6 or 7 Rooms | 86 (53.1%) | 9 (11.7%) |
| 8 or more Rooms | 26 (16.1%) | 0 (0.0%) |
| Total | 162 (100.0%) | 77 (100.0%) |
Housing Structure by Heating Type in Ehrhardt
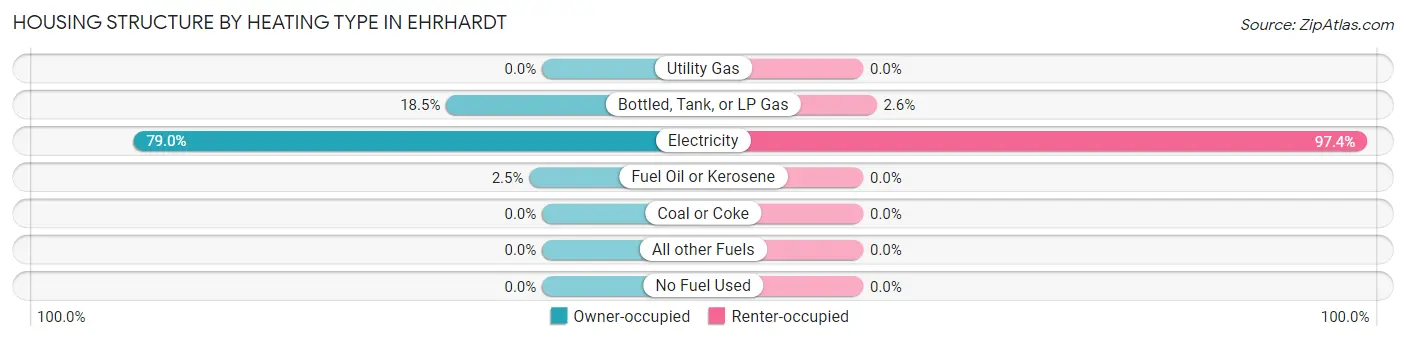
| Heating Type | Owner-occupied | Renter-occupied |
| Utility Gas | 0 (0.0%) | 0 (0.0%) |
| Bottled, Tank, or LP Gas | 30 (18.5%) | 2 (2.6%) |
| Electricity | 128 (79.0%) | 75 (97.4%) |
| Fuel Oil or Kerosene | 4 (2.5%) | 0 (0.0%) |
| Coal or Coke | 0 (0.0%) | 0 (0.0%) |
| All other Fuels | 0 (0.0%) | 0 (0.0%) |
| No Fuel Used | 0 (0.0%) | 0 (0.0%) |
| Total | 162 (100.0%) | 77 (100.0%) |
Household Vehicle Usage in Ehrhardt
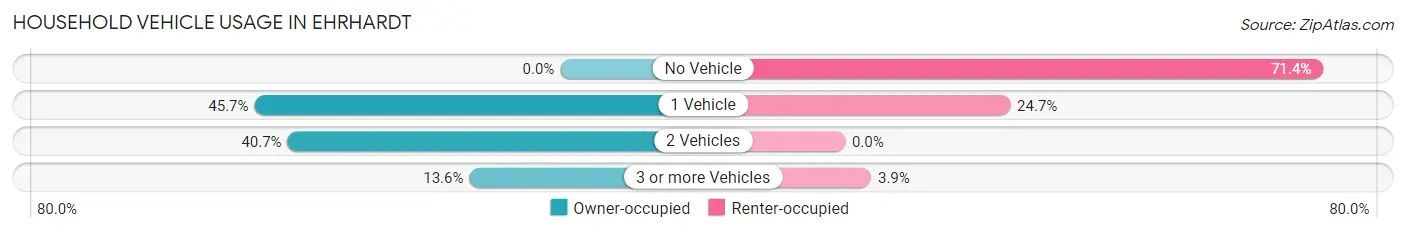
| Vehicles per Household | Owner-occupied | Renter-occupied |
| No Vehicle | 0 (0.0%) | 55 (71.4%) |
| 1 Vehicle | 74 (45.7%) | 19 (24.7%) |
| 2 Vehicles | 66 (40.7%) | 0 (0.0%) |
| 3 or more Vehicles | 22 (13.6%) | 3 (3.9%) |
| Total | 162 (100.0%) | 77 (100.0%) |
Real Estate & Mortgages in Ehrhardt
Real Estate and Mortgage Overview in Ehrhardt
| Characteristic | Without Mortgage | With Mortgage |
| Housing Units | 149 | 13 |
| Median Property Value | $86,600 | $0 |
| Median Household Income | $36,161 | $0 |
| Monthly Housing Costs | $391 | $0 |
| Real Estate Taxes | $659 | $0 |
Property Value by Mortgage Status in Ehrhardt
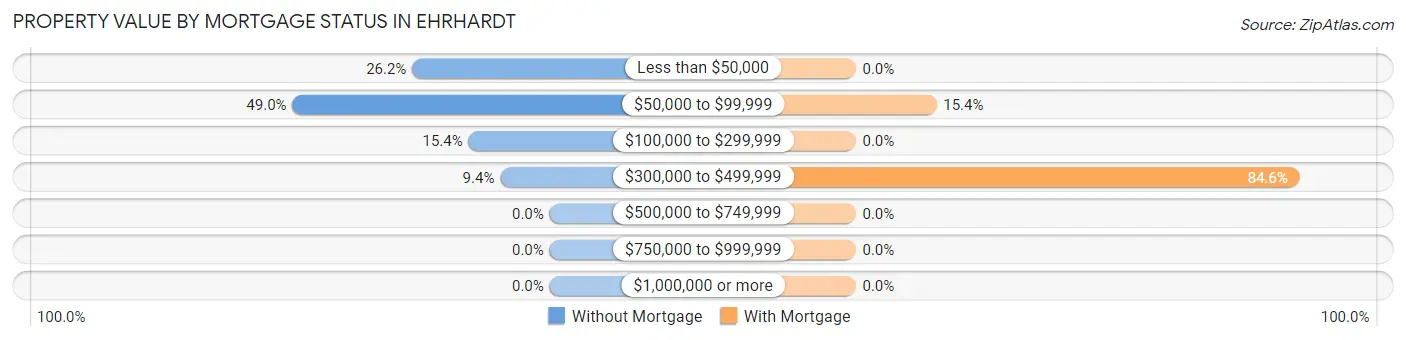
| Property Value | Without Mortgage | With Mortgage |
| Less than $50,000 | 39 (26.2%) | 0 (0.0%) |
| $50,000 to $99,999 | 73 (49.0%) | 2 (15.4%) |
| $100,000 to $299,999 | 23 (15.4%) | 0 (0.0%) |
| $300,000 to $499,999 | 14 (9.4%) | 11 (84.6%) |
| $500,000 to $749,999 | 0 (0.0%) | 0 (0.0%) |
| $750,000 to $999,999 | 0 (0.0%) | 0 (0.0%) |
| $1,000,000 or more | 0 (0.0%) | 0 (0.0%) |
| Total | 149 (100.0%) | 13 (100.0%) |
Household Income by Mortgage Status in Ehrhardt
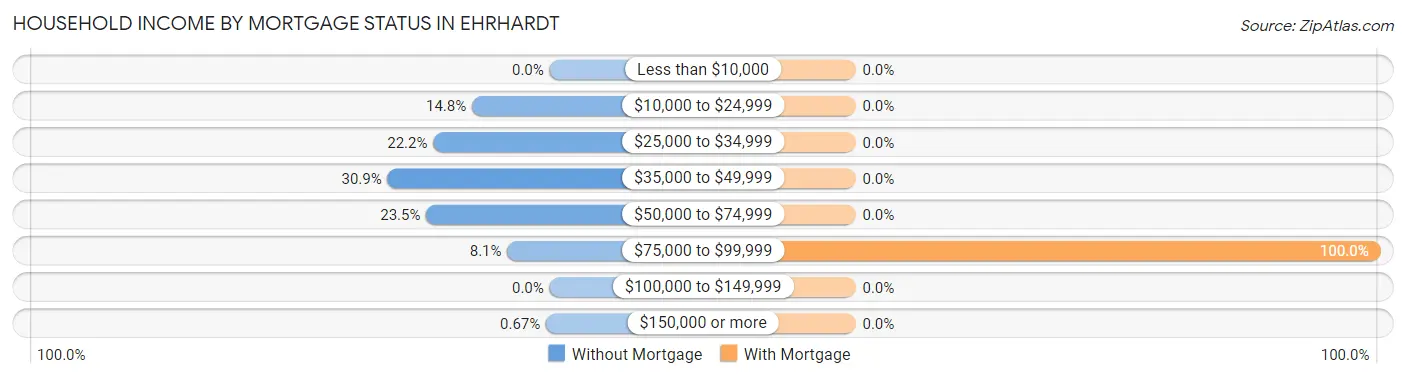
| Household Income | Without Mortgage | With Mortgage |
| Less than $10,000 | 0 (0.0%) | 0 (0.0%) |
| $10,000 to $24,999 | 22 (14.8%) | 0 (0.0%) |
| $25,000 to $34,999 | 33 (22.2%) | 0 (0.0%) |
| $35,000 to $49,999 | 46 (30.9%) | 0 (0.0%) |
| $50,000 to $74,999 | 35 (23.5%) | 0 (0.0%) |
| $75,000 to $99,999 | 12 (8.1%) | 13 (100.0%) |
| $100,000 to $149,999 | 0 (0.0%) | 0 (0.0%) |
| $150,000 or more | 1 (0.7%) | 0 (0.0%) |
| Total | 149 (100.0%) | 13 (100.0%) |
Property Value to Household Income Ratio in Ehrhardt
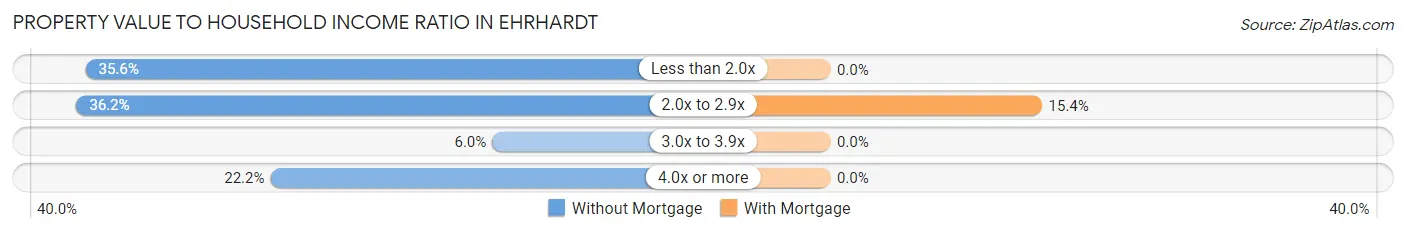
| Value-to-Income Ratio | Without Mortgage | With Mortgage |
| Less than 2.0x | 53 (35.6%) | 0 (0.0%) |
| 2.0x to 2.9x | 54 (36.2%) | 2 (15.4%) |
| 3.0x to 3.9x | 9 (6.0%) | 0 (0.0%) |
| 4.0x or more | 33 (22.2%) | 0 (0.0%) |
| Total | 149 (100.0%) | 13 (100.0%) |
Real Estate Taxes by Mortgage Status in Ehrhardt
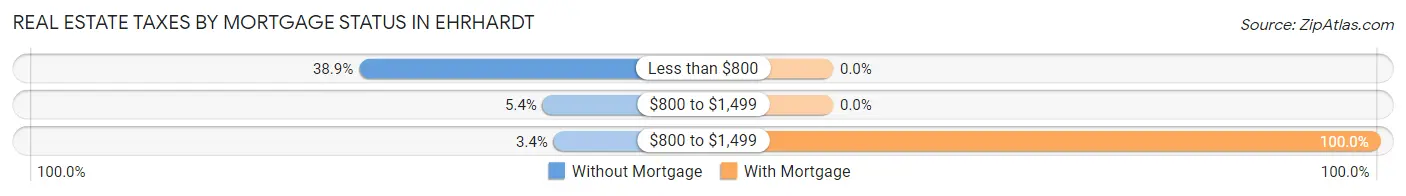
| Property Taxes | Without Mortgage | With Mortgage |
| Less than $800 | 58 (38.9%) | 0 (0.0%) |
| $800 to $1,499 | 8 (5.4%) | 0 (0.0%) |
| $800 to $1,499 | 5 (3.4%) | 13 (100.0%) |
| Total | 149 (100.0%) | 13 (100.0%) |
Health & Disability in Ehrhardt
Health Insurance Coverage by Age in Ehrhardt
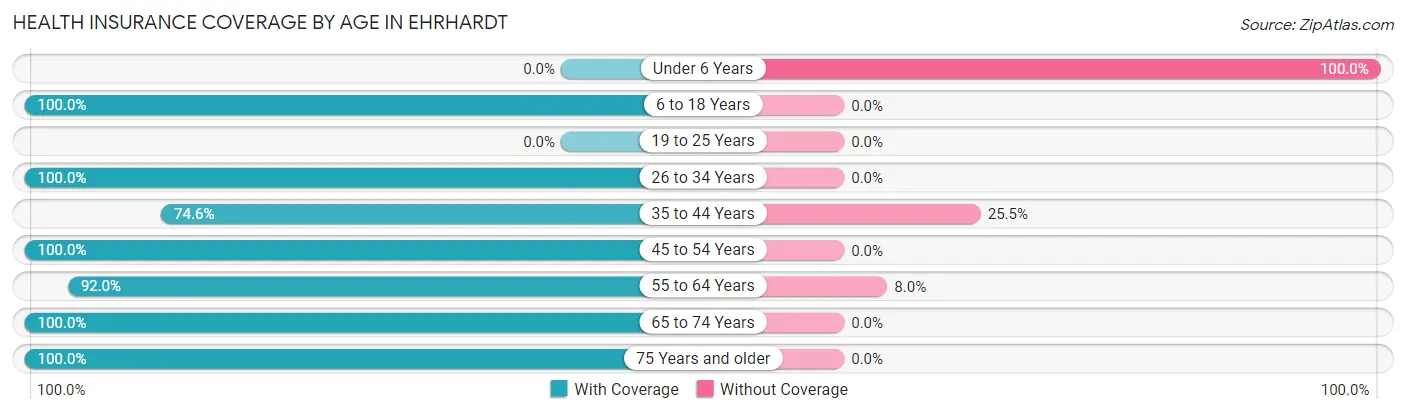
| Age Bracket | With Coverage | Without Coverage |
| Under 6 Years | 0 (0.0%) | 14 (100.0%) |
| 6 to 18 Years | 15 (100.0%) | 0 (0.0%) |
| 19 to 25 Years | 0 (0.0%) | 0 (0.0%) |
| 26 to 34 Years | 23 (100.0%) | 0 (0.0%) |
| 35 to 44 Years | 41 (74.6%) | 14 (25.5%) |
| 45 to 54 Years | 17 (100.0%) | 0 (0.0%) |
| 55 to 64 Years | 103 (92.0%) | 9 (8.0%) |
| 65 to 74 Years | 130 (100.0%) | 0 (0.0%) |
| 75 Years and older | 82 (100.0%) | 0 (0.0%) |
| Total | 411 (91.7%) | 37 (8.3%) |
Health Insurance Coverage by Citizenship Status in Ehrhardt
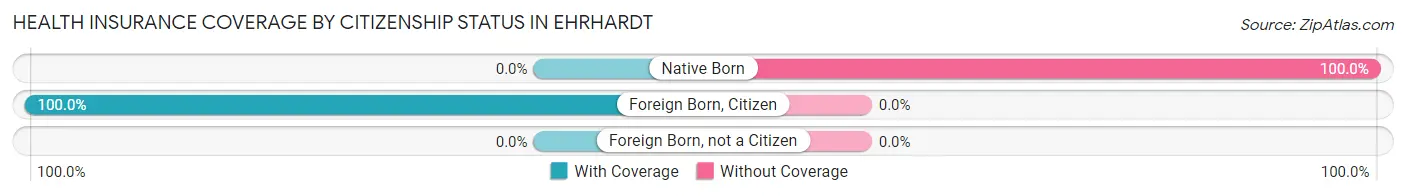
| Citizenship Status | With Coverage | Without Coverage |
| Native Born | 0 (0.0%) | 14 (100.0%) |
| Foreign Born, Citizen | 15 (100.0%) | 0 (0.0%) |
| Foreign Born, not a Citizen | 0 (0.0%) | 0 (0.0%) |
Health Insurance Coverage by Household Income in Ehrhardt
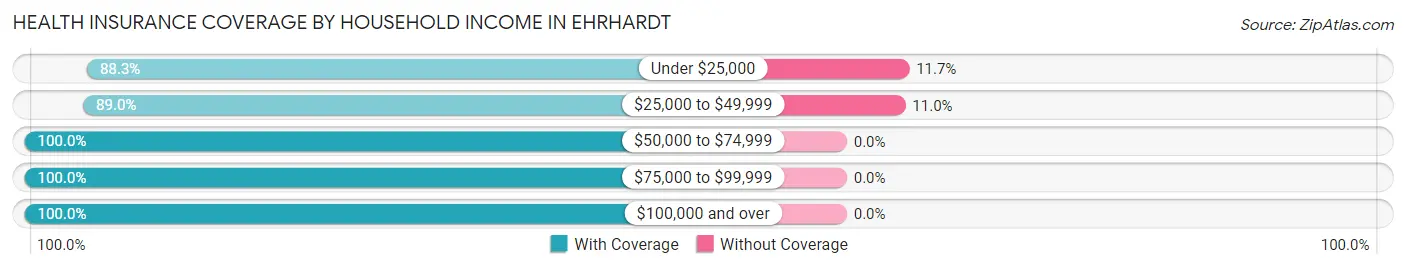
| Household Income | With Coverage | Without Coverage |
| Under $25,000 | 68 (88.3%) | 9 (11.7%) |
| $25,000 to $49,999 | 227 (89.0%) | 28 (11.0%) |
| $50,000 to $74,999 | 101 (100.0%) | 0 (0.0%) |
| $75,000 to $99,999 | 12 (100.0%) | 0 (0.0%) |
| $100,000 and over | 3 (100.0%) | 0 (0.0%) |
Public vs Private Health Insurance Coverage by Age in Ehrhardt
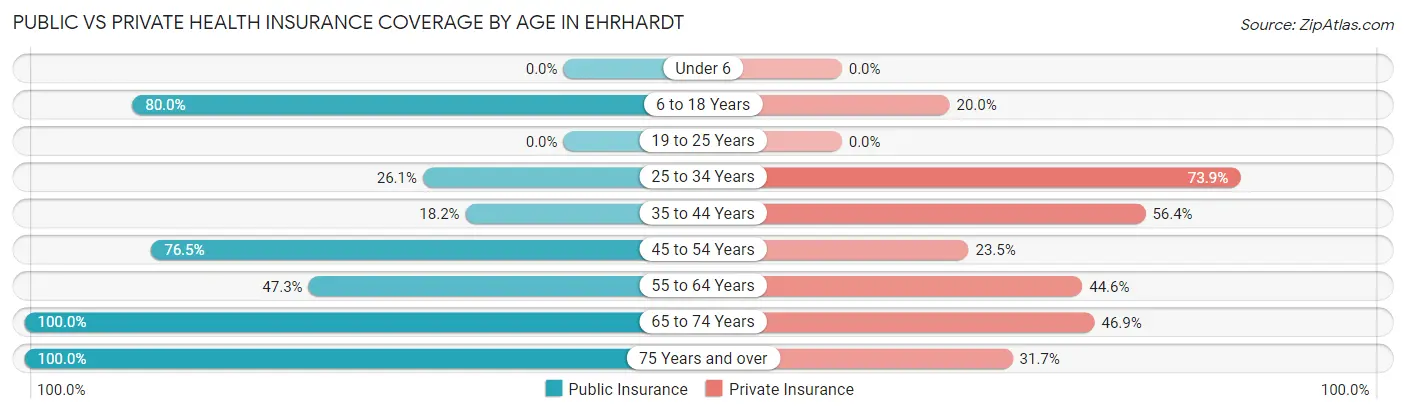
| Age Bracket | Public Insurance | Private Insurance |
| Under 6 | 0 (0.0%) | 0 (0.0%) |
| 6 to 18 Years | 12 (80.0%) | 3 (20.0%) |
| 19 to 25 Years | 0 (0.0%) | 0 (0.0%) |
| 25 to 34 Years | 6 (26.1%) | 17 (73.9%) |
| 35 to 44 Years | 10 (18.2%) | 31 (56.4%) |
| 45 to 54 Years | 13 (76.5%) | 4 (23.5%) |
| 55 to 64 Years | 53 (47.3%) | 50 (44.6%) |
| 65 to 74 Years | 130 (100.0%) | 61 (46.9%) |
| 75 Years and over | 82 (100.0%) | 26 (31.7%) |
| Total | 306 (68.3%) | 192 (42.9%) |
Disability Status by Sex by Age in Ehrhardt
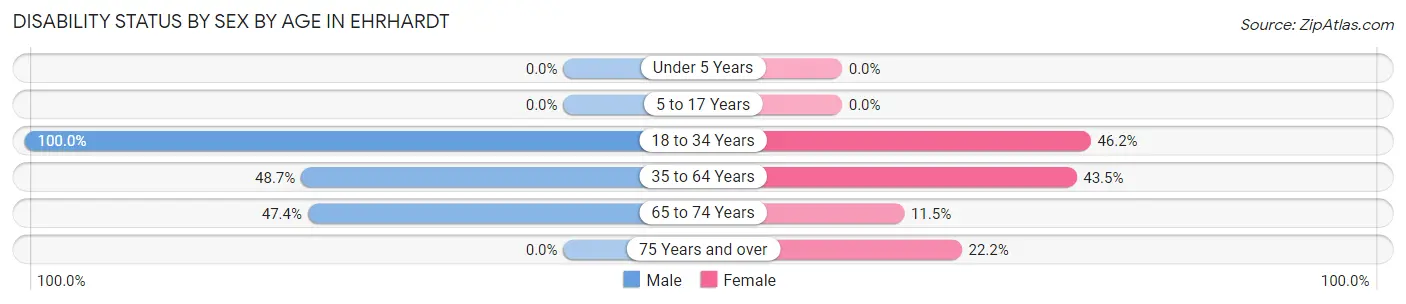
| Age Bracket | Male | Female |
| Under 5 Years | 0 (0.0%) | 0 (0.0%) |
| 5 to 17 Years | 0 (0.0%) | 0 (0.0%) |
| 18 to 34 Years | 10 (100.0%) | 6 (46.2%) |
| 35 to 64 Years | 37 (48.7%) | 47 (43.5%) |
| 65 to 74 Years | 37 (47.4%) | 6 (11.5%) |
| 75 Years and over | 0 (0.0%) | 12 (22.2%) |
Disability Class by Sex by Age in Ehrhardt
Disability Class: Hearing Difficulty
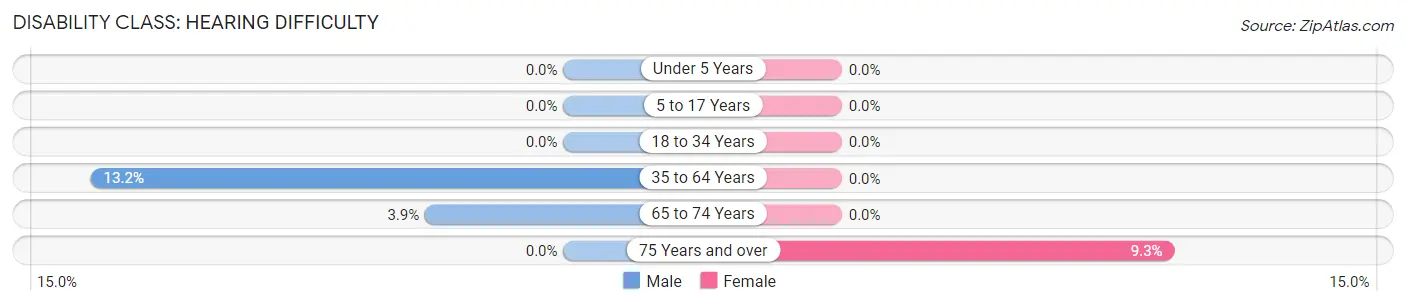
| Age Bracket | Male | Female |
| Under 5 Years | 0 (0.0%) | 0 (0.0%) |
| 5 to 17 Years | 0 (0.0%) | 0 (0.0%) |
| 18 to 34 Years | 0 (0.0%) | 0 (0.0%) |
| 35 to 64 Years | 10 (13.2%) | 0 (0.0%) |
| 65 to 74 Years | 3 (3.8%) | 0 (0.0%) |
| 75 Years and over | 0 (0.0%) | 5 (9.3%) |
Disability Class: Vision Difficulty
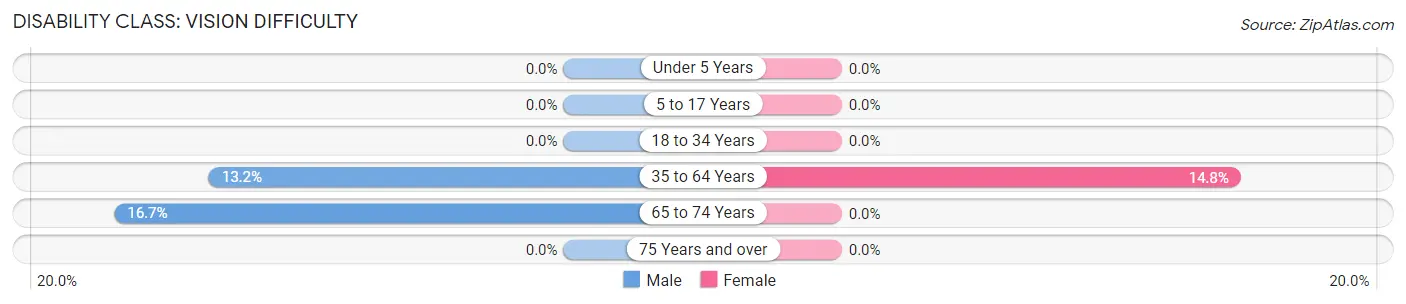
| Age Bracket | Male | Female |
| Under 5 Years | 0 (0.0%) | 0 (0.0%) |
| 5 to 17 Years | 0 (0.0%) | 0 (0.0%) |
| 18 to 34 Years | 0 (0.0%) | 0 (0.0%) |
| 35 to 64 Years | 10 (13.2%) | 16 (14.8%) |
| 65 to 74 Years | 13 (16.7%) | 0 (0.0%) |
| 75 Years and over | 0 (0.0%) | 0 (0.0%) |
Disability Class: Cognitive Difficulty
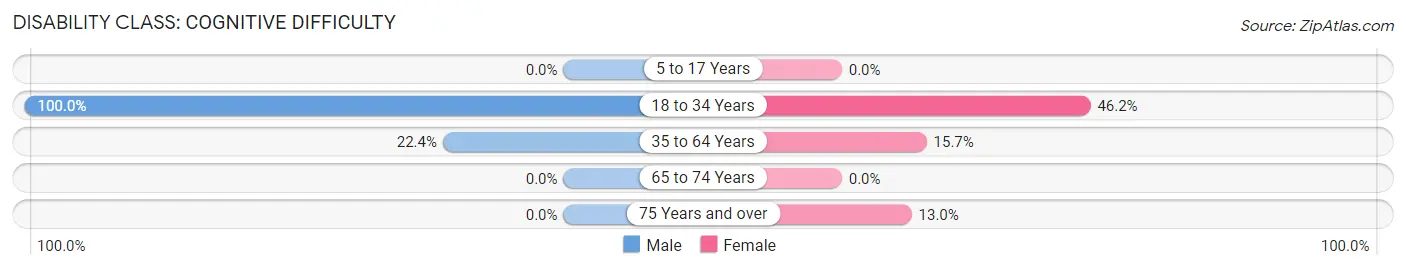
| Age Bracket | Male | Female |
| 5 to 17 Years | 0 (0.0%) | 0 (0.0%) |
| 18 to 34 Years | 10 (100.0%) | 6 (46.2%) |
| 35 to 64 Years | 17 (22.4%) | 17 (15.7%) |
| 65 to 74 Years | 0 (0.0%) | 0 (0.0%) |
| 75 Years and over | 0 (0.0%) | 7 (13.0%) |
Disability Class: Ambulatory Difficulty
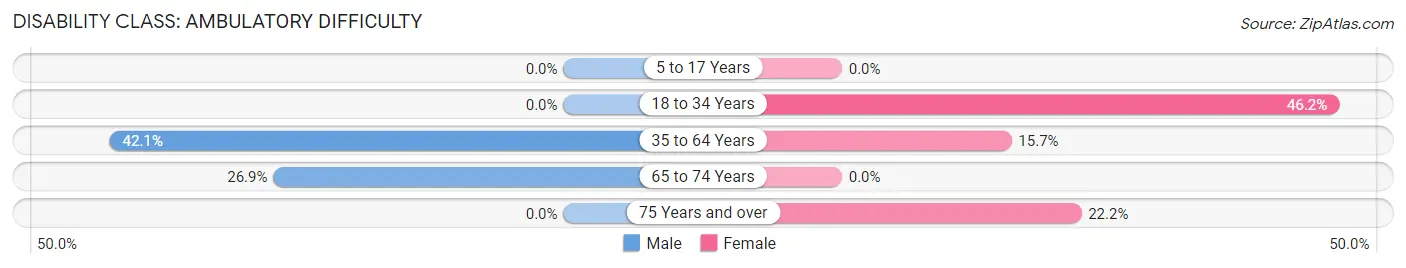
| Age Bracket | Male | Female |
| 5 to 17 Years | 0 (0.0%) | 0 (0.0%) |
| 18 to 34 Years | 0 (0.0%) | 6 (46.2%) |
| 35 to 64 Years | 32 (42.1%) | 17 (15.7%) |
| 65 to 74 Years | 21 (26.9%) | 0 (0.0%) |
| 75 Years and over | 0 (0.0%) | 12 (22.2%) |
Disability Class: Self-Care Difficulty
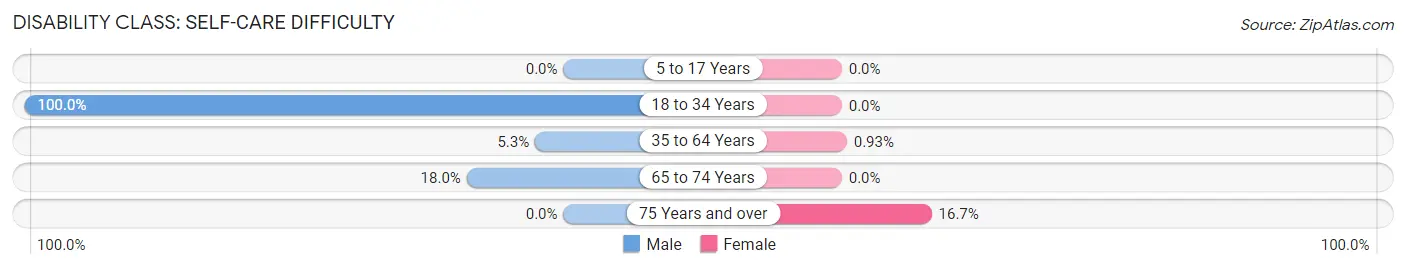
| Age Bracket | Male | Female |
| 5 to 17 Years | 0 (0.0%) | 0 (0.0%) |
| 18 to 34 Years | 10 (100.0%) | 0 (0.0%) |
| 35 to 64 Years | 4 (5.3%) | 1 (0.9%) |
| 65 to 74 Years | 14 (17.9%) | 0 (0.0%) |
| 75 Years and over | 0 (0.0%) | 9 (16.7%) |
Technology Access in Ehrhardt
Computing Device Access in Ehrhardt
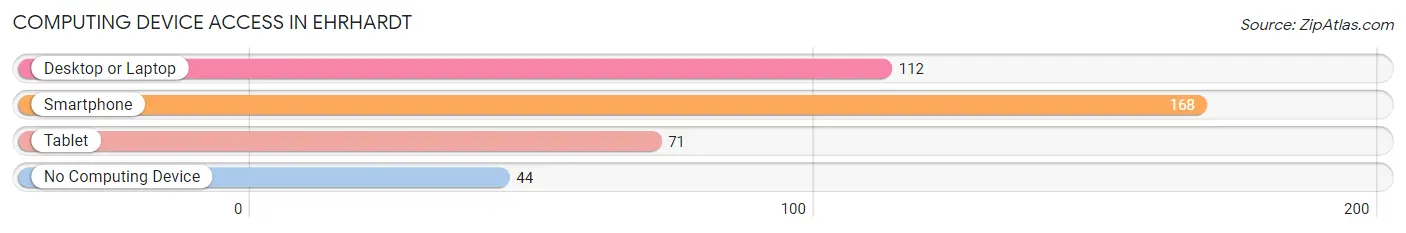
| Device Type | # Households | % Households |
| Desktop or Laptop | 112 | 46.9% |
| Smartphone | 168 | 70.3% |
| Tablet | 71 | 29.7% |
| No Computing Device | 44 | 18.4% |
| Total | 239 | 100.0% |
Internet Access in Ehrhardt
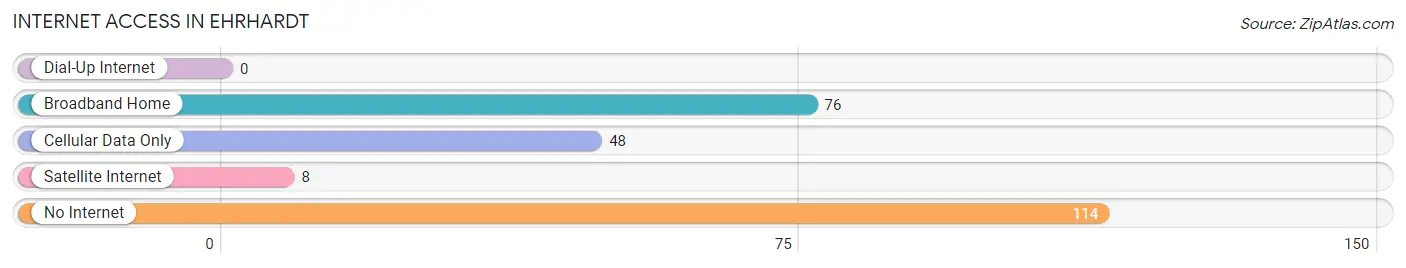
| Internet Type | # Households | % Households |
| Dial-Up Internet | 0 | 0.0% |
| Broadband Home | 76 | 31.8% |
| Cellular Data Only | 48 | 20.1% |
| Satellite Internet | 8 | 3.4% |
| No Internet | 114 | 47.7% |
| Total | 239 | 100.0% |
Ehrhardt Summary
Ehrhardt is a small town located in Bamberg County, South Carolina. It is situated in the heart of the South Carolina Lowcountry, approximately halfway between Columbia and Charleston. The town has a population of approximately 500 people and is part of the larger Bamberg County, which has a population of around 15,000.
Geography
Ehrhardt is located in the South Carolina Lowcountry, a region of the state characterized by its flat terrain, sandy soil, and abundant wetlands. The town is situated on the banks of the Salkehatchie River, which flows through the area and provides a source of recreation for the locals. The town is surrounded by a number of small towns and rural communities, including Denmark, Bamberg, and Branchville.
The climate in Ehrhardt is humid subtropical, with hot, humid summers and mild winters. The average annual temperature is around 70 degrees Fahrenheit, with temperatures reaching as high as 95 degrees in the summer months and as low as 40 degrees in the winter months. The area receives an average of 48 inches of rain per year, with most of the precipitation occurring in the summer months.
Economy
Ehrhardt’s economy is largely based on agriculture, with the town’s main crops being cotton, soybeans, and corn. The town also has a number of small businesses, including a grocery store, a hardware store, and a few restaurants. The town is also home to a number of small manufacturing companies, including a furniture factory and a textile mill.
Demographics
As of the 2010 census, the population of Ehrhardt was 498 people, with a median age of 39.7 years. The racial makeup of the town was 79.2% White, 17.2% African American, 0.4% Native American, 0.2% Asian, and 2.8% from other races. The median household income was $30,938, and the median family income was $37,917.
Ehrhardt is a small, rural town with a close-knit community. The town is home to a number of churches, including the Ehrhardt Baptist Church, the Ehrhardt Methodist Church, and the Ehrhardt Presbyterian Church. The town also has a number of recreational activities, including fishing, hunting, and camping. The town is also home to a number of historic sites, including the Ehrhardt Historic District, which is listed on the National Register of Historic Places.
Common Questions
What is Per Capita Income in Ehrhardt?
Per Capita income in Ehrhardt is $21,461.
What is the Median Family Income in Ehrhardt?
Median Family Income in Ehrhardt is $36,131.
What is the Median Household income in Ehrhardt?
Median Household Income in Ehrhardt is $35,923.
What is Inequality or Gini Index in Ehrhardt?
Inequality or Gini Index in Ehrhardt is 0.29.
What is the Total Population of Ehrhardt?
Total Population of Ehrhardt is 462.
What is the Total Male Population of Ehrhardt?
Total Male Population of Ehrhardt is 204.
What is the Total Female Population of Ehrhardt?
Total Female Population of Ehrhardt is 258.
What is the Ratio of Males per 100 Females in Ehrhardt?
There are 79.07 Males per 100 Females in Ehrhardt.
What is the Ratio of Females per 100 Males in Ehrhardt?
There are 126.47 Females per 100 Males in Ehrhardt.
What is the Median Population Age in Ehrhardt?
Median Population Age in Ehrhardt is 63.5 Years.
What is the Average Family Size in Ehrhardt
Average Family Size in Ehrhardt is 2.5 People.
What is the Average Household Size in Ehrhardt
Average Household Size in Ehrhardt is 1.9 People.
How Large is the Labor Force in Ehrhardt?
There are 83 People in the Labor Forcein in Ehrhardt.
What is the Percentage of People in the Labor Force in Ehrhardt?
19.2% of People are in the Labor Force in Ehrhardt.