Kline, SC Map & Demographics
Kline Map

Kline Overview
$22,129
PER CAPITA INCOME
$64,250
AVG FAMILY INCOME
$53,750
AVG HOUSEHOLD INCOME
9.9%
WAGE / INCOME GAP [ % ]
90.1¢/ $1
WAGE / INCOME GAP [ $ ]
0.31
INEQUALITY / GINI INDEX
195
TOTAL POPULATION
98
MALE POPULATION
97
FEMALE POPULATION
101.03
MALES / 100 FEMALES
98.98
FEMALES / 100 MALES
25.1
MEDIAN AGE
4.2
AVG FAMILY SIZE
3.2
AVG HOUSEHOLD SIZE
74
LABOR FORCE [ PEOPLE ]
57.4%
PERCENT IN LABOR FORCE
5.4%
UNEMPLOYMENT RATE
Kline Area Codes
Income in Kline
Income Overview in Kline
Per Capita Income in Kline is $22,129, while median incomes of families and households are $64,250 and $53,750 respectively.
| Characteristic | Number | Measure |
| Per Capita Income | 195 | $22,129 |
| Median Family Income | 42 | $64,250 |
| Mean Family Income | 42 | $71,629 |
| Median Household Income | 61 | $53,750 |
| Mean Household Income | 61 | $59,298 |
| Income Deficit | 42 | $0 |
| Wage / Income Gap (%) | 195 | 9.94% |
| Wage / Income Gap ($) | 195 | 90.06¢ per $1 |
| Gini / Inequality Index | 195 | 0.31 |
Earnings by Sex in Kline
Average Earnings in Kline are $32,500, $35,625 for men and $32,083 for women, a difference of 9.9%.
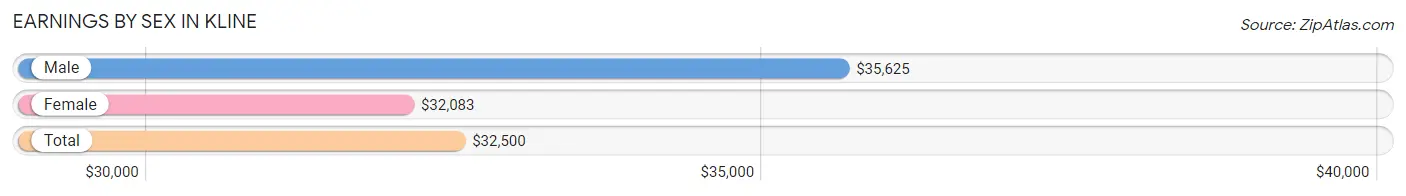
| Sex | Number | Average Earnings |
| Male | 45 (56.2%) | $35,625 |
| Female | 35 (43.8%) | $32,083 |
| Total | 80 (100.0%) | $32,500 |
Earnings by Sex by Income Bracket in Kline
The most common earnings brackets in Kline are $25,000 to $29,999 for men (9 | 20.0%) and $22,500 to $24,999 for women (12 | 34.3%).
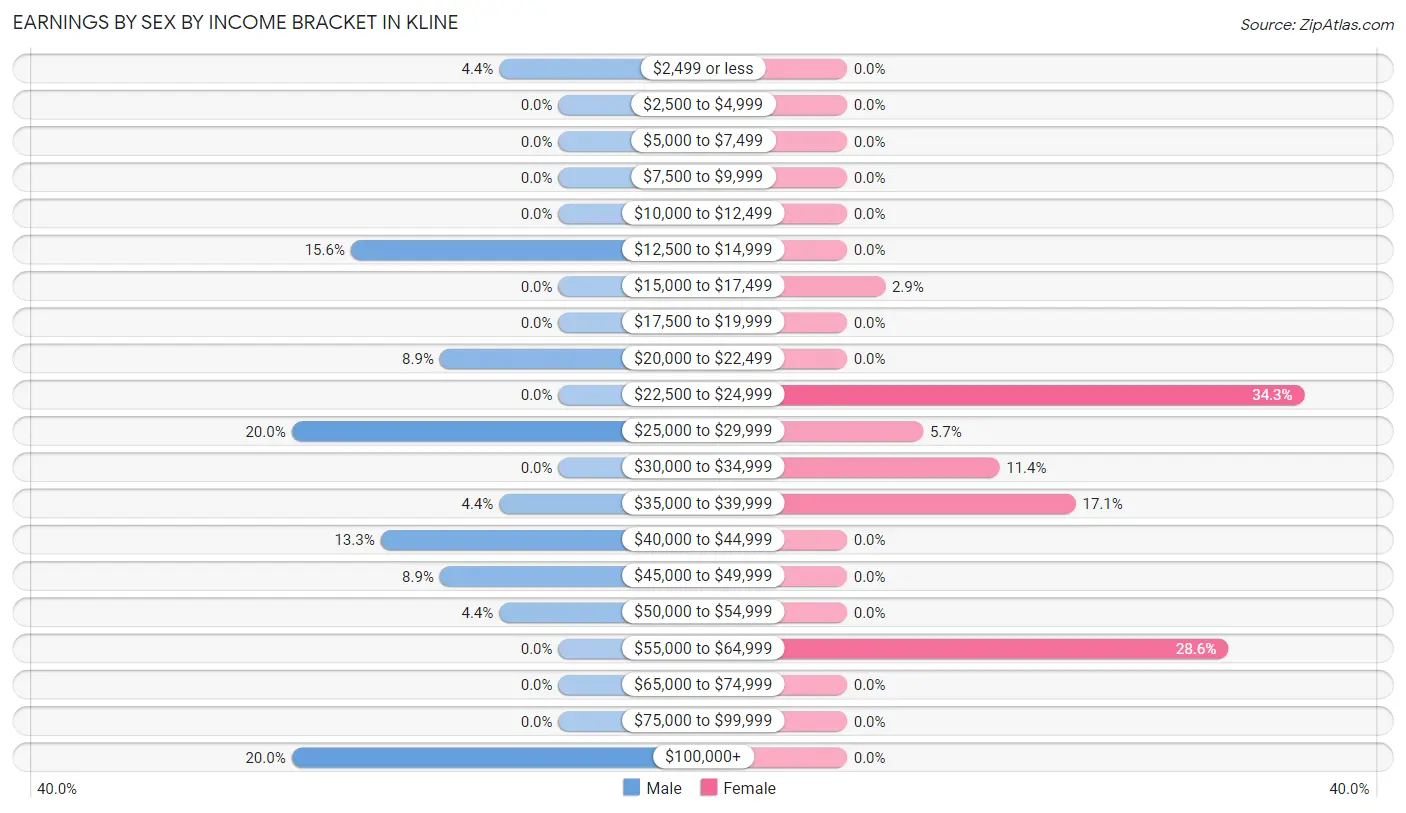
| Income | Male | Female |
| $2,499 or less | 2 (4.4%) | 0 (0.0%) |
| $2,500 to $4,999 | 0 (0.0%) | 0 (0.0%) |
| $5,000 to $7,499 | 0 (0.0%) | 0 (0.0%) |
| $7,500 to $9,999 | 0 (0.0%) | 0 (0.0%) |
| $10,000 to $12,499 | 0 (0.0%) | 0 (0.0%) |
| $12,500 to $14,999 | 7 (15.6%) | 0 (0.0%) |
| $15,000 to $17,499 | 0 (0.0%) | 1 (2.9%) |
| $17,500 to $19,999 | 0 (0.0%) | 0 (0.0%) |
| $20,000 to $22,499 | 4 (8.9%) | 0 (0.0%) |
| $22,500 to $24,999 | 0 (0.0%) | 12 (34.3%) |
| $25,000 to $29,999 | 9 (20.0%) | 2 (5.7%) |
| $30,000 to $34,999 | 0 (0.0%) | 4 (11.4%) |
| $35,000 to $39,999 | 2 (4.4%) | 6 (17.1%) |
| $40,000 to $44,999 | 6 (13.3%) | 0 (0.0%) |
| $45,000 to $49,999 | 4 (8.9%) | 0 (0.0%) |
| $50,000 to $54,999 | 2 (4.4%) | 0 (0.0%) |
| $55,000 to $64,999 | 0 (0.0%) | 10 (28.6%) |
| $65,000 to $74,999 | 0 (0.0%) | 0 (0.0%) |
| $75,000 to $99,999 | 0 (0.0%) | 0 (0.0%) |
| $100,000+ | 9 (20.0%) | 0 (0.0%) |
| Total | 45 (100.0%) | 35 (100.0%) |
Earnings by Sex by Educational Attainment in Kline
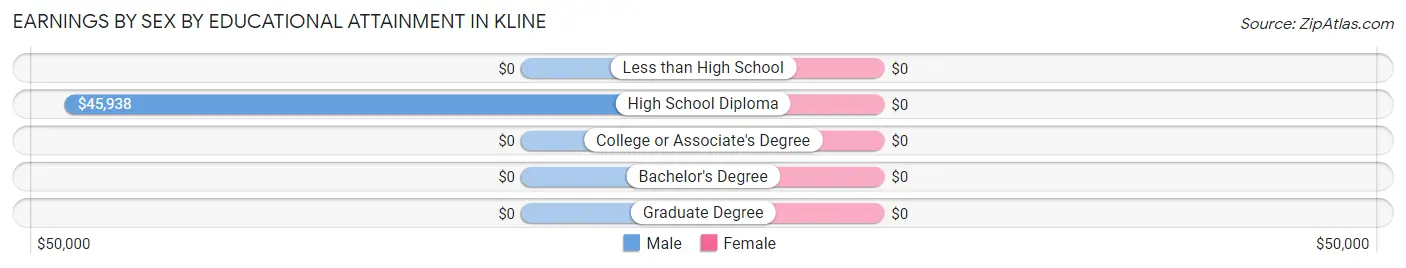
| Educational Attainment | Male Income | Female Income |
| Less than High School | - | - |
| High School Diploma | $45,938 | $0 |
| College or Associate's Degree | - | - |
| Bachelor's Degree | - | - |
| Graduate Degree | - | - |
| Total | - | - |
Family Income in Kline
Family Income Brackets in Kline
According to the Kline family income data, there are 17 families falling into the $50,000 to $74,999 income range, which is the most common income bracket and makes up 40.5% of all families.
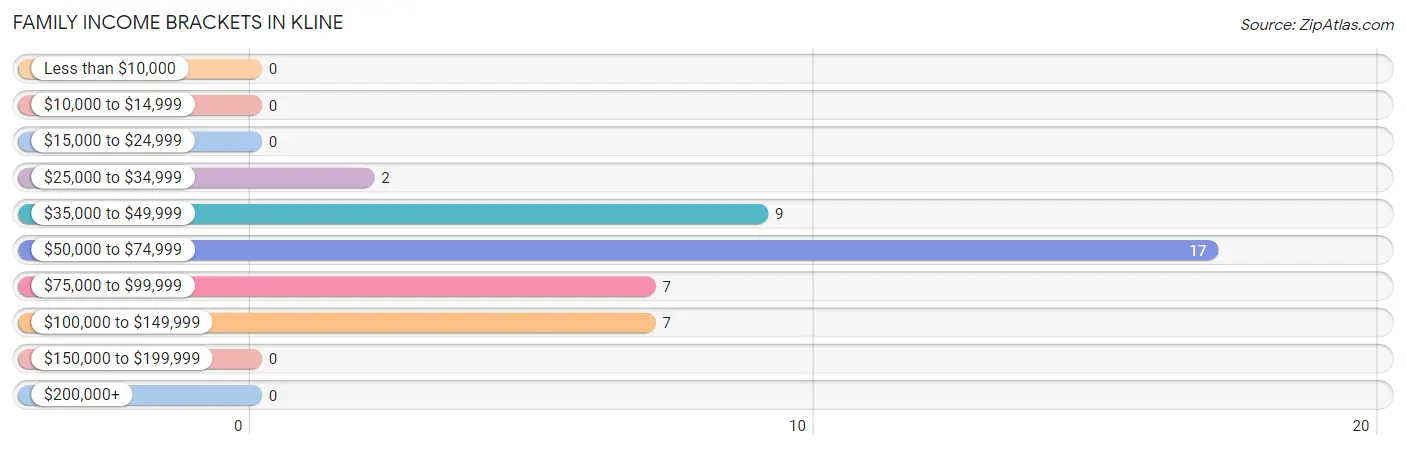
| Income Bracket | # Families | % Families |
| Less than $10,000 | 0 | 0.0% |
| $10,000 to $14,999 | 0 | 0.0% |
| $15,000 to $24,999 | 0 | 0.0% |
| $25,000 to $34,999 | 2 | 4.8% |
| $35,000 to $49,999 | 9 | 21.4% |
| $50,000 to $74,999 | 17 | 40.5% |
| $75,000 to $99,999 | 7 | 16.7% |
| $100,000 to $149,999 | 7 | 16.7% |
| $150,000 to $199,999 | 0 | 0.0% |
| $200,000+ | 0 | 0.0% |
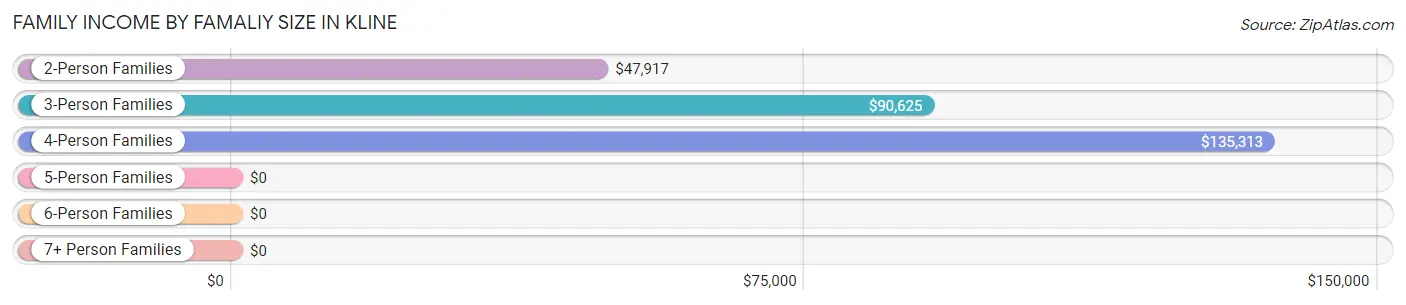
Family Income by Famaliy Size in Kline
4-person families (9 | 21.4%) account for the highest median family income in Kline with $135,313 per family, while 4-person families (9 | 21.4%) have the highest median income of $33,828 per family member.
| Income Bracket | # Families | Median Income |
| 2-Person Families | 13 (30.9%) | $47,917 |
| 3-Person Families | 10 (23.8%) | $90,625 |
| 4-Person Families | 9 (21.4%) | $135,313 |
| 5-Person Families | 0 (0.0%) | $0 |
| 6-Person Families | 10 (23.8%) | $0 |
| 7+ Person Families | 0 (0.0%) | $0 |
| Total | 42 (100.0%) | $64,250 |
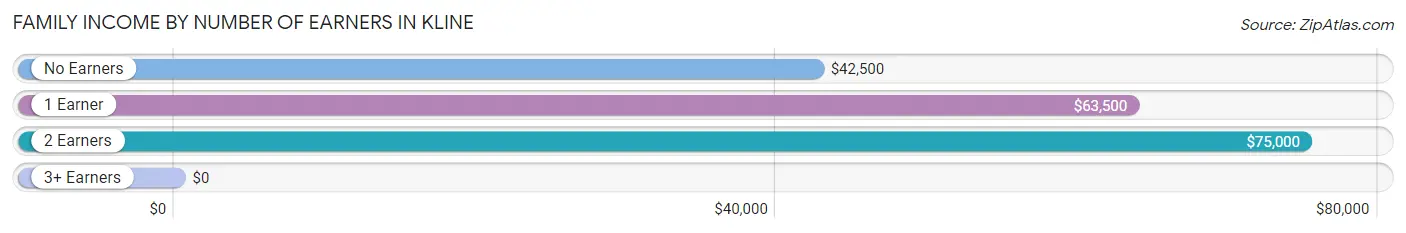
Family Income by Number of Earners in Kline
| Number of Earners | # Families | Median Income |
| No Earners | 4 (9.5%) | $42,500 |
| 1 Earner | 16 (38.1%) | $63,500 |
| 2 Earners | 22 (52.4%) | $75,000 |
| 3+ Earners | 0 (0.0%) | $0 |
| Total | 42 (100.0%) | $64,250 |
Household Income in Kline
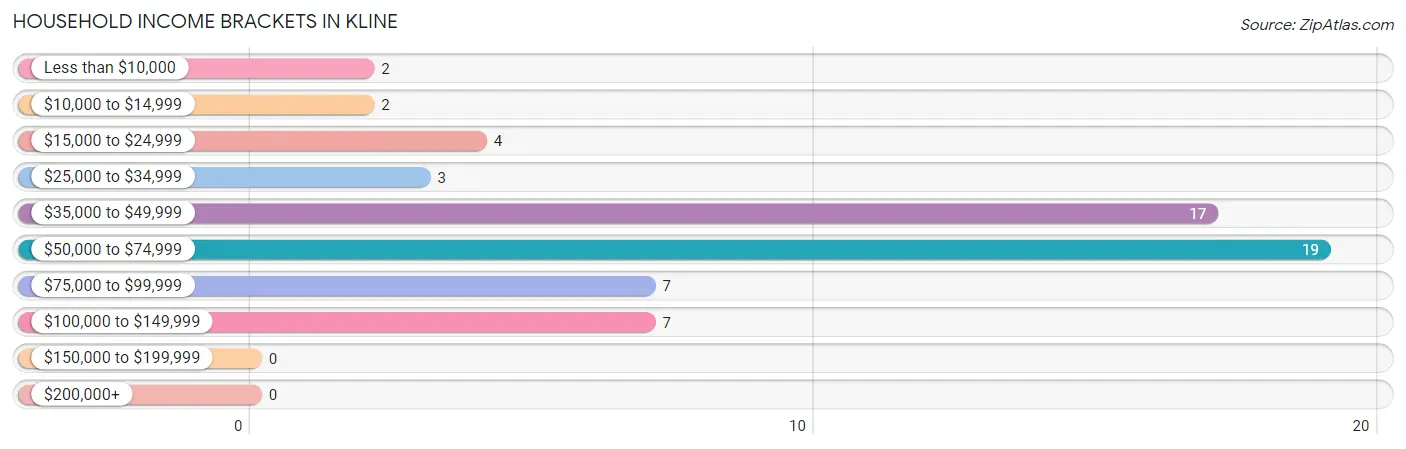
Household Income Brackets in Kline
With 19 households falling in the category, the $50,000 to $74,999 income range is the most frequent in Kline, accounting for 31.1% of all households.
| Income Bracket | # Households | % Households |
| Less than $10,000 | 2 | 3.3% |
| $10,000 to $14,999 | 2 | 3.3% |
| $15,000 to $24,999 | 4 | 6.6% |
| $25,000 to $34,999 | 3 | 4.9% |
| $35,000 to $49,999 | 17 | 27.9% |
| $50,000 to $74,999 | 19 | 31.1% |
| $75,000 to $99,999 | 7 | 11.5% |
| $100,000 to $149,999 | 7 | 11.5% |
| $150,000 to $199,999 | 0 | 0.0% |
| $200,000+ | 0 | 0.0% |
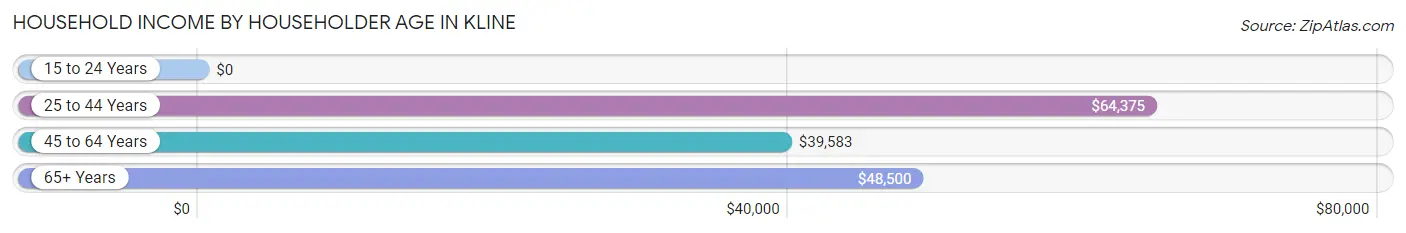
Household Income by Householder Age in Kline
The median household income in Kline is $53,750, with the highest median household income of $64,375 found in the 25 to 44 years age bracket for the primary householder. A total of 23 households (37.7%) fall into this category. Meanwhile, the 15 to 24 years age bracket for the primary householder has the lowest median household income of $0, with 2 households (3.3%) in this group.
| Income Bracket | # Households | Median Income |
| 15 to 24 Years | 2 (3.3%) | $0 |
| 25 to 44 Years | 23 (37.7%) | $64,375 |
| 45 to 64 Years | 20 (32.8%) | $39,583 |
| 65+ Years | 16 (26.2%) | $48,500 |
| Total | 61 (100.0%) | $53,750 |
Poverty in Kline
Income Below Poverty by Sex and Age in Kline
With 1.0% poverty level for males and 3.1% for females among the residents of Kline, 55 to 64 year old males and 75 year old and over females are the most vulnerable to poverty, with 1 males (14.3%) and 3 females (42.9%) in their respective age groups living below the poverty level.
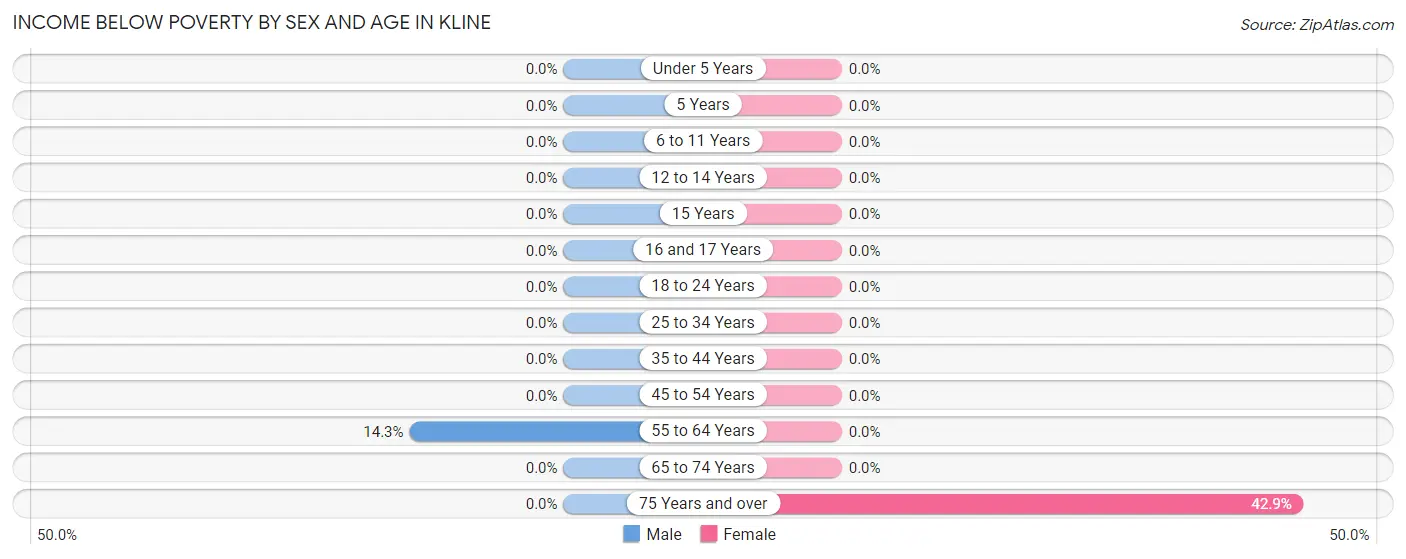
| Age Bracket | Male | Female |
| Under 5 Years | 0 (0.0%) | 0 (0.0%) |
| 5 Years | 0 (0.0%) | 0 (0.0%) |
| 6 to 11 Years | 0 (0.0%) | 0 (0.0%) |
| 12 to 14 Years | 0 (0.0%) | 0 (0.0%) |
| 15 Years | 0 (0.0%) | 0 (0.0%) |
| 16 and 17 Years | 0 (0.0%) | 0 (0.0%) |
| 18 to 24 Years | 0 (0.0%) | 0 (0.0%) |
| 25 to 34 Years | 0 (0.0%) | 0 (0.0%) |
| 35 to 44 Years | 0 (0.0%) | 0 (0.0%) |
| 45 to 54 Years | 0 (0.0%) | 0 (0.0%) |
| 55 to 64 Years | 1 (14.3%) | 0 (0.0%) |
| 65 to 74 Years | 0 (0.0%) | 0 (0.0%) |
| 75 Years and over | 0 (0.0%) | 3 (42.9%) |
| Total | 1 (1.0%) | 3 (3.1%) |
Income Above Poverty by Sex and Age in Kline
According to the poverty statistics in Kline, males aged under 5 years and females aged under 5 years are the age groups that are most secure financially, with 100.0% of males and 100.0% of females in these age groups living above the poverty line.
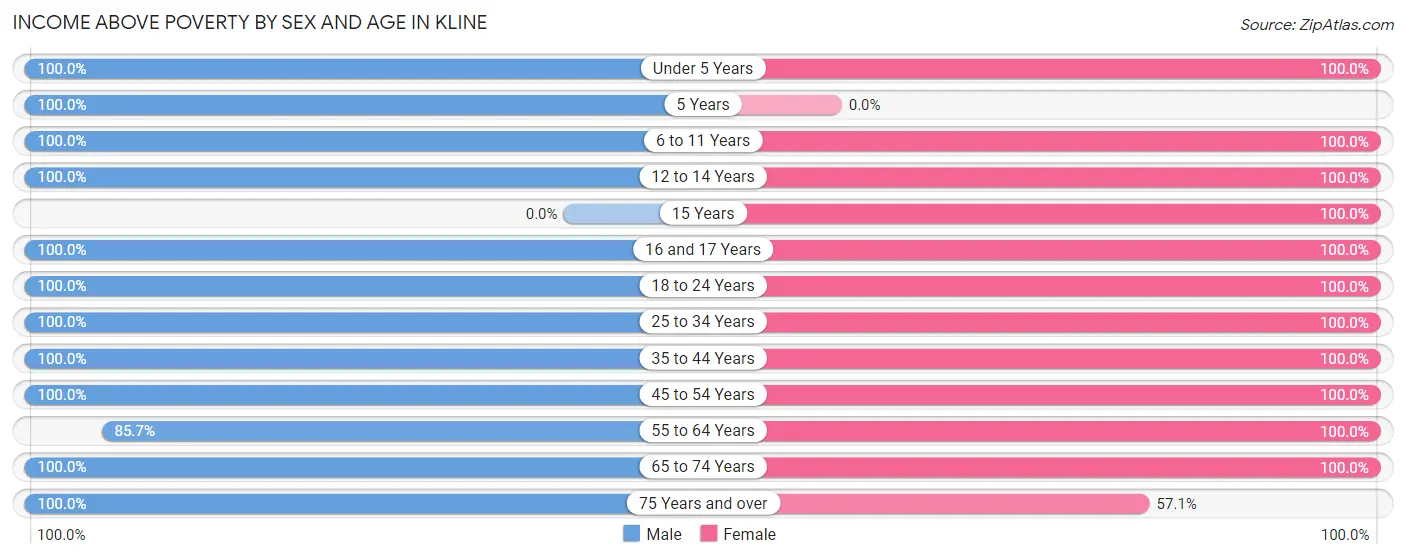
| Age Bracket | Male | Female |
| Under 5 Years | 2 (100.0%) | 1 (100.0%) |
| 5 Years | 12 (100.0%) | 0 (0.0%) |
| 6 to 11 Years | 11 (100.0%) | 20 (100.0%) |
| 12 to 14 Years | 4 (100.0%) | 4 (100.0%) |
| 15 Years | 0 (0.0%) | 12 (100.0%) |
| 16 and 17 Years | 2 (100.0%) | 4 (100.0%) |
| 18 to 24 Years | 19 (100.0%) | 6 (100.0%) |
| 25 to 34 Years | 21 (100.0%) | 1 (100.0%) |
| 35 to 44 Years | 4 (100.0%) | 18 (100.0%) |
| 45 to 54 Years | 6 (100.0%) | 5 (100.0%) |
| 55 to 64 Years | 6 (85.7%) | 13 (100.0%) |
| 65 to 74 Years | 8 (100.0%) | 6 (100.0%) |
| 75 Years and over | 2 (100.0%) | 4 (57.1%) |
| Total | 97 (99.0%) | 94 (96.9%) |
Income Below Poverty Among Married-Couple Families in Kline
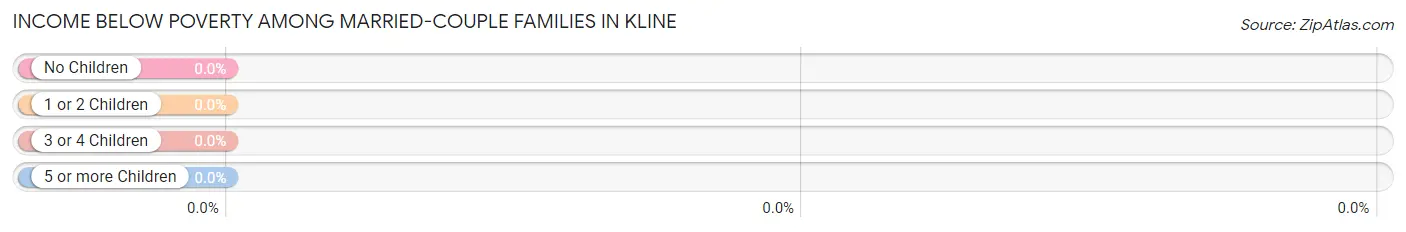
| Children | Above Poverty | Below Poverty |
| No Children | 11 (100.0%) | 0 (0.0%) |
| 1 or 2 Children | 9 (100.0%) | 0 (0.0%) |
| 3 or 4 Children | 0 (0.0%) | 0 (0.0%) |
| 5 or more Children | 0 (0.0%) | 0 (0.0%) |
| Total | 20 (100.0%) | 0 (0.0%) |
Income Below Poverty Among Single-Parent Households in Kline
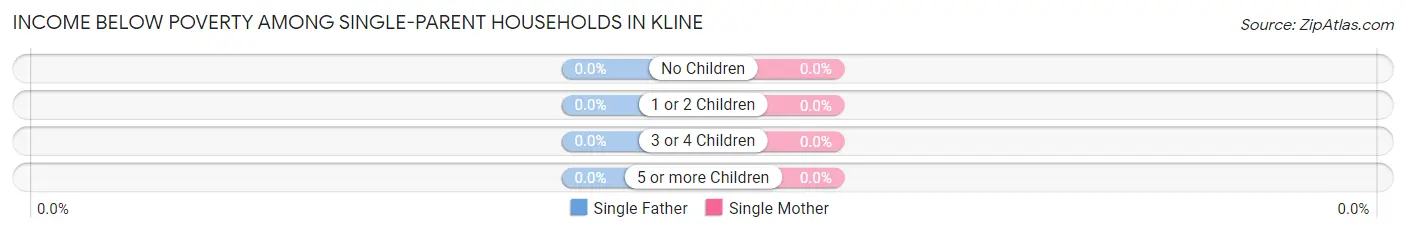
| Children | Single Father | Single Mother |
| No Children | 0 (0.0%) | 0 (0.0%) |
| 1 or 2 Children | 0 (0.0%) | 0 (0.0%) |
| 3 or 4 Children | 0 (0.0%) | 0 (0.0%) |
| 5 or more Children | 0 (0.0%) | 0 (0.0%) |
| Total | 0 (0.0%) | 0 (0.0%) |
Income Below Poverty Among Married-Couple vs Single-Parent Households in Kline
| Children | Married-Couple Families | Single-Parent Households |
| No Children | 0 (0.0%) | 0 (0.0%) |
| 1 or 2 Children | 0 (0.0%) | 0 (0.0%) |
| 3 or 4 Children | 0 (0.0%) | 0 (0.0%) |
| 5 or more Children | 0 (0.0%) | 0 (0.0%) |
| Total | 0 (0.0%) | 0 (0.0%) |
Race in Kline
The most populous races in Kline are Black / African American (93 | 47.7%), White / Caucasian (90 | 46.2%), and Hispanic or Latino (25 | 12.8%).
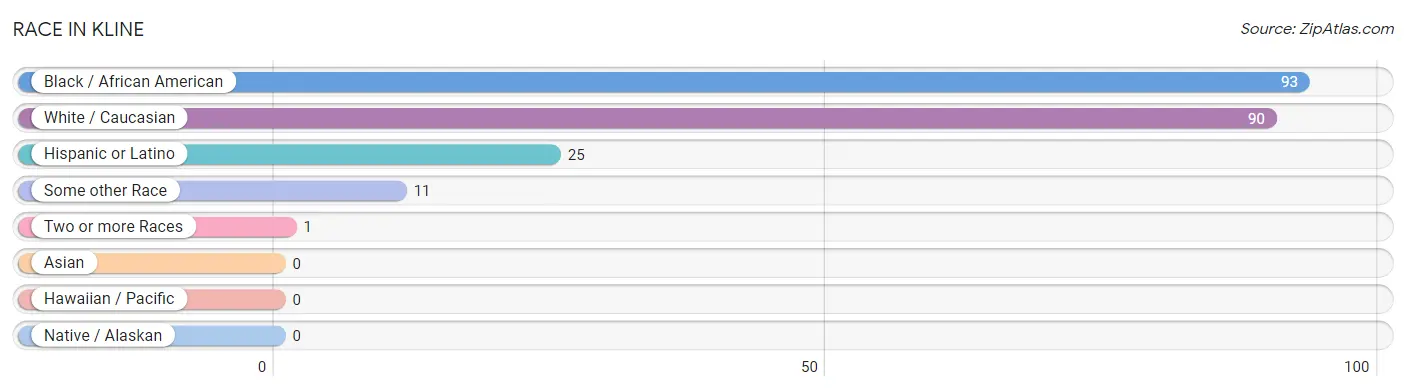
| Race | # Population | % Population |
| Asian | 0 | 0.0% |
| Black / African American | 93 | 47.7% |
| Hawaiian / Pacific | 0 | 0.0% |
| Hispanic or Latino | 25 | 12.8% |
| Native / Alaskan | 0 | 0.0% |
| White / Caucasian | 90 | 46.2% |
| Two or more Races | 1 | 0.5% |
| Some other Race | 11 | 5.6% |
| Total | 195 | 100.0% |
Ancestry in Kline
The most populous ancestries reported in Kline are American (30 | 15.4%), Mexican (11 | 5.6%), English (10 | 5.1%), African (5 | 2.6%), and Irish (5 | 2.6%), together accounting for 31.3% of all Kline residents.
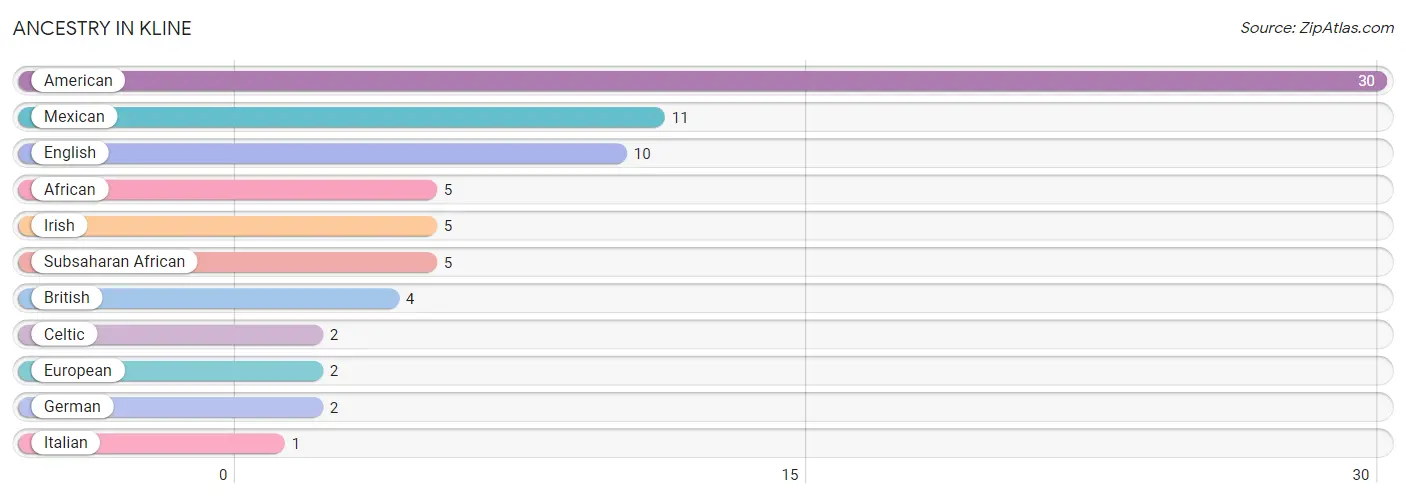
| Ancestry | # Population | % Population |
| African | 5 | 2.6% |
| American | 30 | 15.4% |
| British | 4 | 2.1% |
| Celtic | 2 | 1.0% |
| English | 10 | 5.1% |
| European | 2 | 1.0% |
| German | 2 | 1.0% |
| Irish | 5 | 2.6% |
| Italian | 1 | 0.5% |
| Mexican | 11 | 5.6% |
| Subsaharan African | 5 | 2.6% | View All 11 Rows |
Immigrants in Kline
The most numerous immigrant groups reported in Kline came from Central America (2 | 1.0%), Latin America (2 | 1.0%), and Mexico (2 | 1.0%), together accounting for 3.1% of all Kline residents.
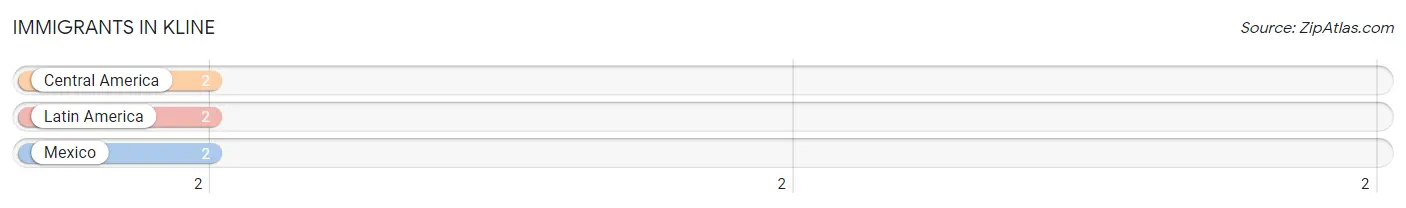
| Immigration Origin | # Population | % Population |
| Central America | 2 | 1.0% |
| Latin America | 2 | 1.0% |
| Mexico | 2 | 1.0% | View All 3 Rows |
Sex and Age in Kline
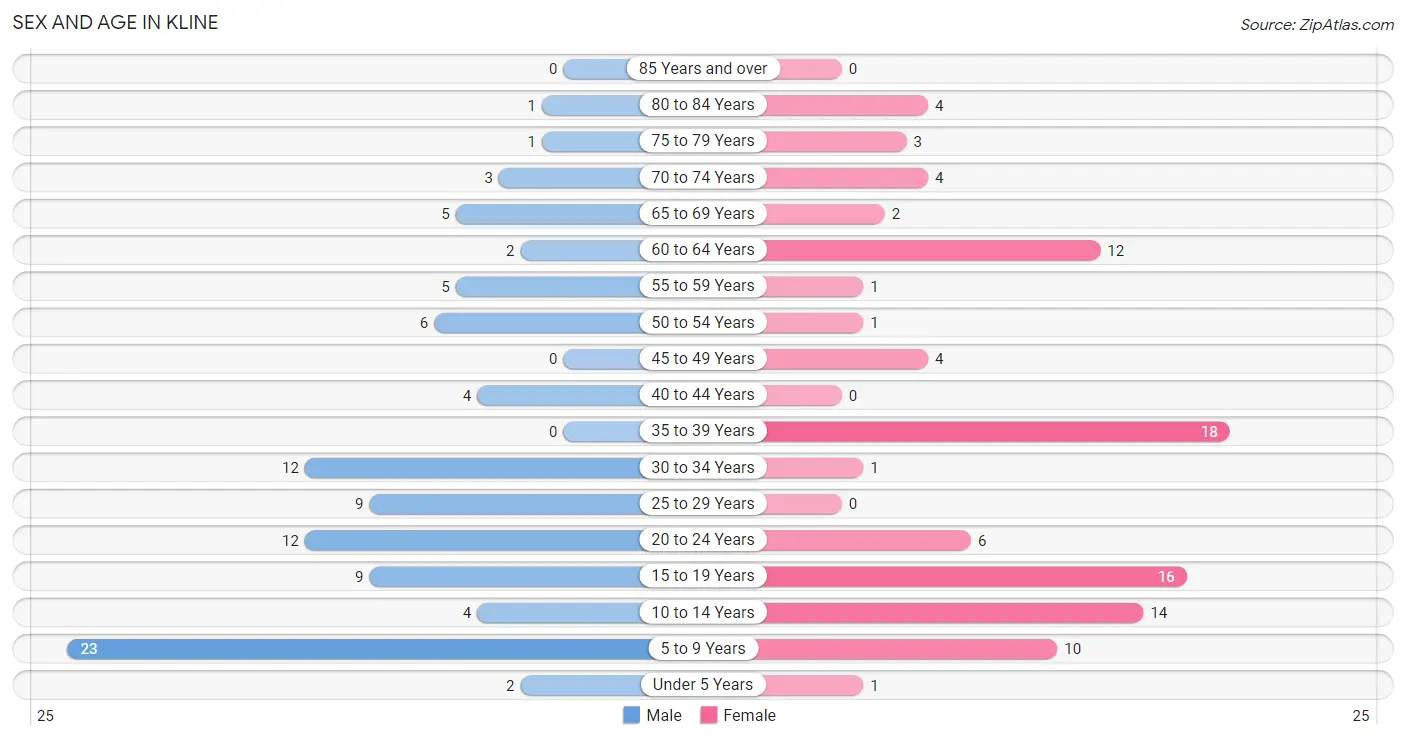
Sex and Age in Kline
The most populous age groups in Kline are 5 to 9 Years (23 | 23.5%) for men and 35 to 39 Years (18 | 18.6%) for women.
| Age Bracket | Male | Female |
| Under 5 Years | 2 (2.0%) | 1 (1.0%) |
| 5 to 9 Years | 23 (23.5%) | 10 (10.3%) |
| 10 to 14 Years | 4 (4.1%) | 14 (14.4%) |
| 15 to 19 Years | 9 (9.2%) | 16 (16.5%) |
| 20 to 24 Years | 12 (12.2%) | 6 (6.2%) |
| 25 to 29 Years | 9 (9.2%) | 0 (0.0%) |
| 30 to 34 Years | 12 (12.2%) | 1 (1.0%) |
| 35 to 39 Years | 0 (0.0%) | 18 (18.6%) |
| 40 to 44 Years | 4 (4.1%) | 0 (0.0%) |
| 45 to 49 Years | 0 (0.0%) | 4 (4.1%) |
| 50 to 54 Years | 6 (6.1%) | 1 (1.0%) |
| 55 to 59 Years | 5 (5.1%) | 1 (1.0%) |
| 60 to 64 Years | 2 (2.0%) | 12 (12.4%) |
| 65 to 69 Years | 5 (5.1%) | 2 (2.1%) |
| 70 to 74 Years | 3 (3.1%) | 4 (4.1%) |
| 75 to 79 Years | 1 (1.0%) | 3 (3.1%) |
| 80 to 84 Years | 1 (1.0%) | 4 (4.1%) |
| 85 Years and over | 0 (0.0%) | 0 (0.0%) |
| Total | 98 (100.0%) | 97 (100.0%) |
Families and Households in Kline
Median Family Size in Kline
The median family size in Kline is 4.19 persons per family, with single female/mother families (16 | 38.1%) accounting for the largest median family size of 5.25 persons per family. On the other hand, married-couple families (20 | 47.6%) represent the smallest median family size with 3.45 persons per family.
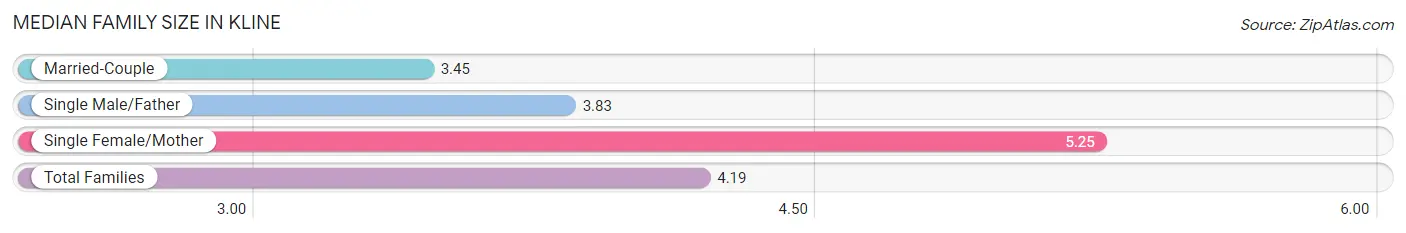
| Family Type | # Families | Family Size |
| Married-Couple | 20 (47.6%) | 3.45 |
| Single Male/Father | 6 (14.3%) | 3.83 |
| Single Female/Mother | 16 (38.1%) | 5.25 |
| Total Families | 42 (100.0%) | 4.19 |
Median Household Size in Kline
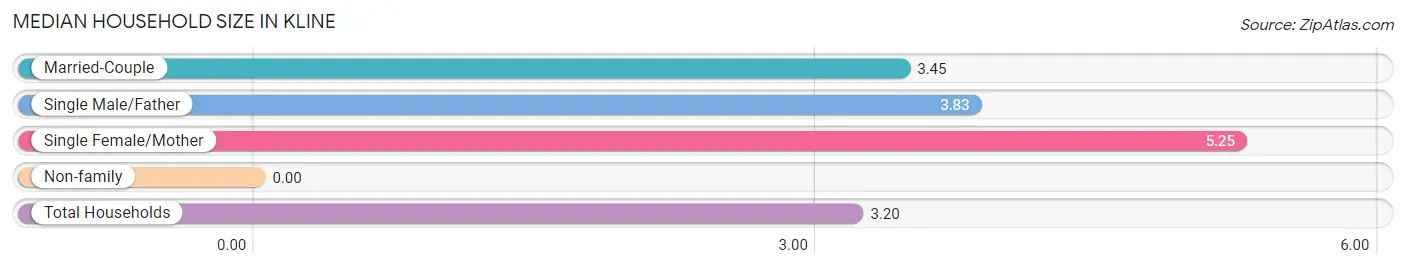
| Household Type | # Households | Household Size |
| Married-Couple | 20 (32.8%) | 3.45 |
| Single Male/Father | 6 (9.8%) | 3.83 |
| Single Female/Mother | 16 (26.2%) | 5.25 |
| Non-family | 19 (31.1%) | - |
| Total Households | 61 (100.0%) | 3.20 |
Household Size by Marriage Status in Kline
Out of a total of 61 households in Kline, 42 (68.9%) are family households, while 19 (31.1%) are nonfamily households. The most numerous type of family households are 2-person households, comprising 13, and the most common type of nonfamily households are 1-person households, comprising 19.
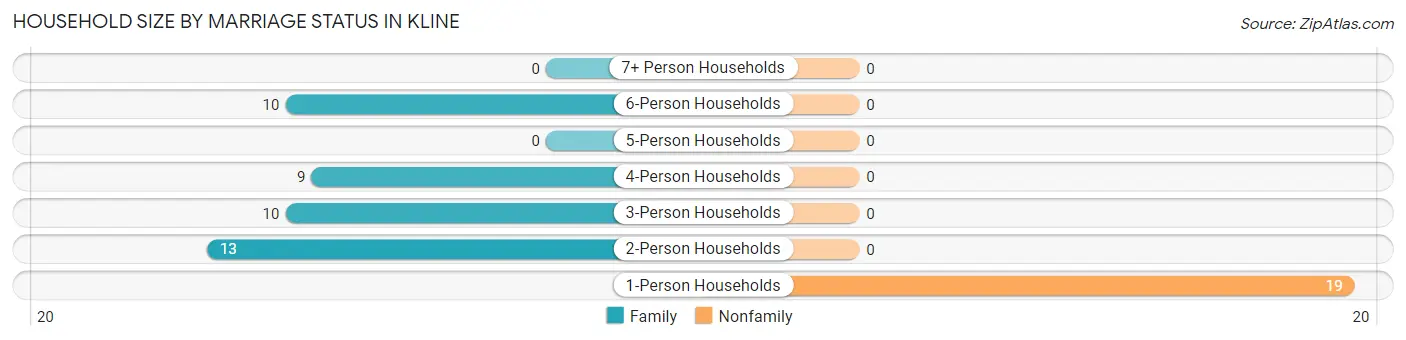
| Household Size | Family Households | Nonfamily Households |
| 1-Person Households | - | 19 (31.1%) |
| 2-Person Households | 13 (21.3%) | 0 (0.0%) |
| 3-Person Households | 10 (16.4%) | 0 (0.0%) |
| 4-Person Households | 9 (14.7%) | 0 (0.0%) |
| 5-Person Households | 0 (0.0%) | 0 (0.0%) |
| 6-Person Households | 10 (16.4%) | 0 (0.0%) |
| 7+ Person Households | 0 (0.0%) | 0 (0.0%) |
| Total | 42 (68.9%) | 19 (31.1%) |
Female Fertility in Kline
Fertility by Age in Kline
| Age Bracket | Women with Births | Births / 1,000 Women |
| 15 to 19 years | 0 (0.0%) | 0.0 |
| 20 to 34 years | 0 (0.0%) | 0.0 |
| 35 to 50 years | 0 (0.0%) | 0.0 |
| Total | 0 (0.0%) | 0.0 |
Fertility by Age by Marriage Status in Kline
| Age Bracket | Married | Unmarried |
| 15 to 19 years | 0 (0.0%) | 0 (0.0%) |
| 20 to 34 years | 0 (0.0%) | 0 (0.0%) |
| 35 to 50 years | 0 (0.0%) | 0 (0.0%) |
| Total | 0 (0.0%) | 0 (0.0%) |
Fertility by Education in Kline
| Educational Attainment | Women with Births | Births / 1,000 Women |
| Less than High School | 0 (0.0%) | 0.0 |
| High School Diploma | 0 (0.0%) | 0.0 |
| College or Associate's Degree | 0 (0.0%) | 0.0 |
| Bachelor's Degree | 0 (0.0%) | 0.0 |
| Graduate Degree | 0 (0.0%) | 0.0 |
| Total | 0 (0.0%) | 0.0 |
Fertility by Education by Marriage Status in Kline
| Educational Attainment | Married | Unmarried |
| Less than High School | 0 (0.0%) | 0 (0.0%) |
| High School Diploma | 0 (0.0%) | 0 (0.0%) |
| College or Associate's Degree | 0 (0.0%) | 0 (0.0%) |
| Bachelor's Degree | 0 (0.0%) | 0 (0.0%) |
| Graduate Degree | 0 (0.0%) | 0 (0.0%) |
| Total | 0 (0.0%) | 0 (0.0%) |
Employment Characteristics in Kline
Employment by Class of Employer in Kline
Among the 70 employed individuals in Kline, private company employees (45 | 64.3%), federal government employees (10 | 14.3%), and local government employees (7 | 10.0%) make up the most common classes of employment.
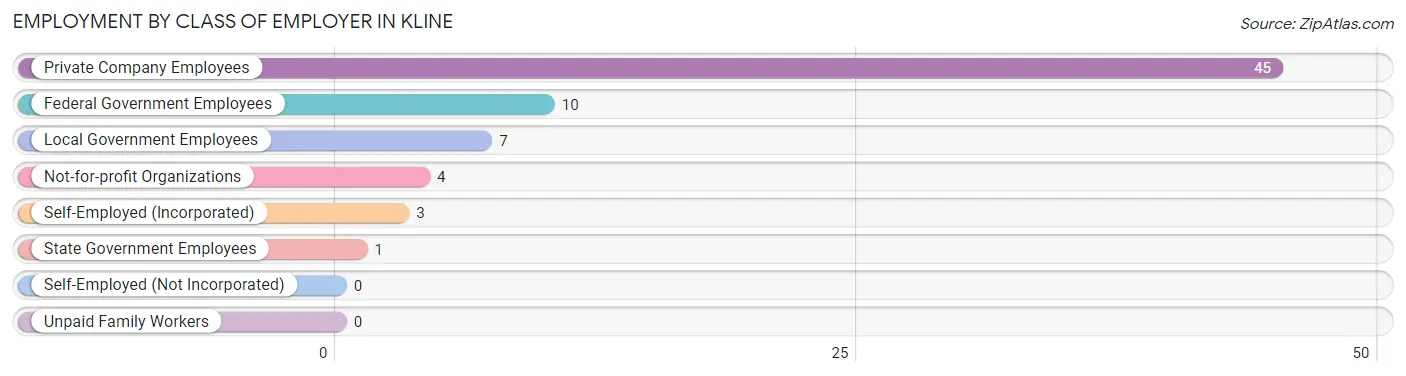
| Employer Class | # Employees | % Employees |
| Private Company Employees | 45 | 64.3% |
| Self-Employed (Incorporated) | 3 | 4.3% |
| Self-Employed (Not Incorporated) | 0 | 0.0% |
| Not-for-profit Organizations | 4 | 5.7% |
| Local Government Employees | 7 | 10.0% |
| State Government Employees | 1 | 1.4% |
| Federal Government Employees | 10 | 14.3% |
| Unpaid Family Workers | 0 | 0.0% |
| Total | 70 | 100.0% |
Employment Status by Age in Kline
According to the labor force statistics for Kline, out of the total population over 16 years of age (129), 57.4% or 74 individuals are in the labor force, with 5.4% or 4 of them unemployed. The age group with the highest labor force participation rate is 25 to 29 years, with 100.0% or 9 individuals in the labor force. Within the labor force, the 30 to 34 years age range has the highest percentage of unemployed individuals, with 30.8% or 4 of them being unemployed.
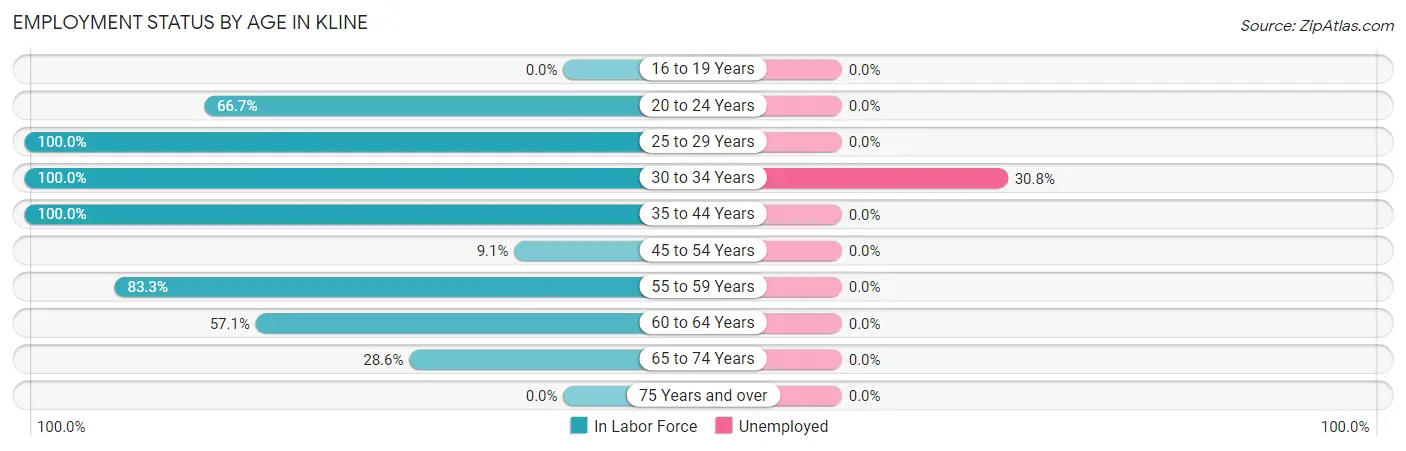
| Age Bracket | In Labor Force | Unemployed |
| 16 to 19 Years | 0 (0.0%) | 0 (0.0%) |
| 20 to 24 Years | 12 (66.7%) | 0 (0.0%) |
| 25 to 29 Years | 9 (100.0%) | 0 (0.0%) |
| 30 to 34 Years | 13 (100.0%) | 4 (30.8%) |
| 35 to 44 Years | 22 (100.0%) | 0 (0.0%) |
| 45 to 54 Years | 1 (9.1%) | 0 (0.0%) |
| 55 to 59 Years | 5 (83.3%) | 0 (0.0%) |
| 60 to 64 Years | 8 (57.1%) | 0 (0.0%) |
| 65 to 74 Years | 4 (28.6%) | 0 (0.0%) |
| 75 Years and over | 0 (0.0%) | 0 (0.0%) |
| Total | 74 (57.4%) | 4 (5.4%) |
Employment Status by Educational Attainment in Kline
According to labor force statistics for Kline, 77.3% of individuals (58) out of the total population between 25 and 64 years of age (75) are in the labor force, with 6.9% or 4 of them being unemployed. The group with the highest labor force participation rate are those with the educational attainment of bachelor's degree or higher, with 100.0% or 12 individuals in the labor force. Within the labor force, individuals with high school diploma education have the highest percentage of unemployment, with 20.0% or 3 of them being unemployed.
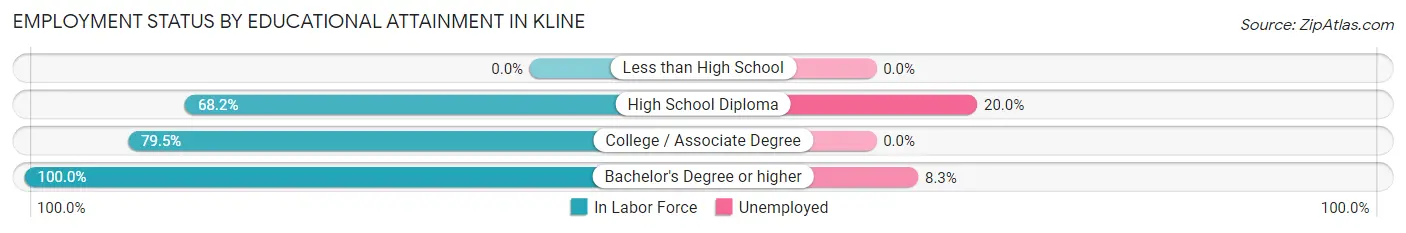
| Educational Attainment | In Labor Force | Unemployed |
| Less than High School | 0 (0.0%) | 0 (0.0%) |
| High School Diploma | 15 (68.2%) | 4 (20.0%) |
| College / Associate Degree | 31 (79.5%) | 0 (0.0%) |
| Bachelor's Degree or higher | 12 (100.0%) | 1 (8.3%) |
| Total | 58 (77.3%) | 5 (6.9%) |
Employment Occupations by Sex in Kline
Management, Business, Science and Arts Occupations
The most common Management, Business, Science and Arts occupations in Kline are Management (12 | 17.1%), Health Diagnosing & Treating (12 | 17.1%), Health Technologists (10 | 14.3%), Community & Social Service (5 | 7.1%), and Education Instruction & Library (5 | 7.1%).
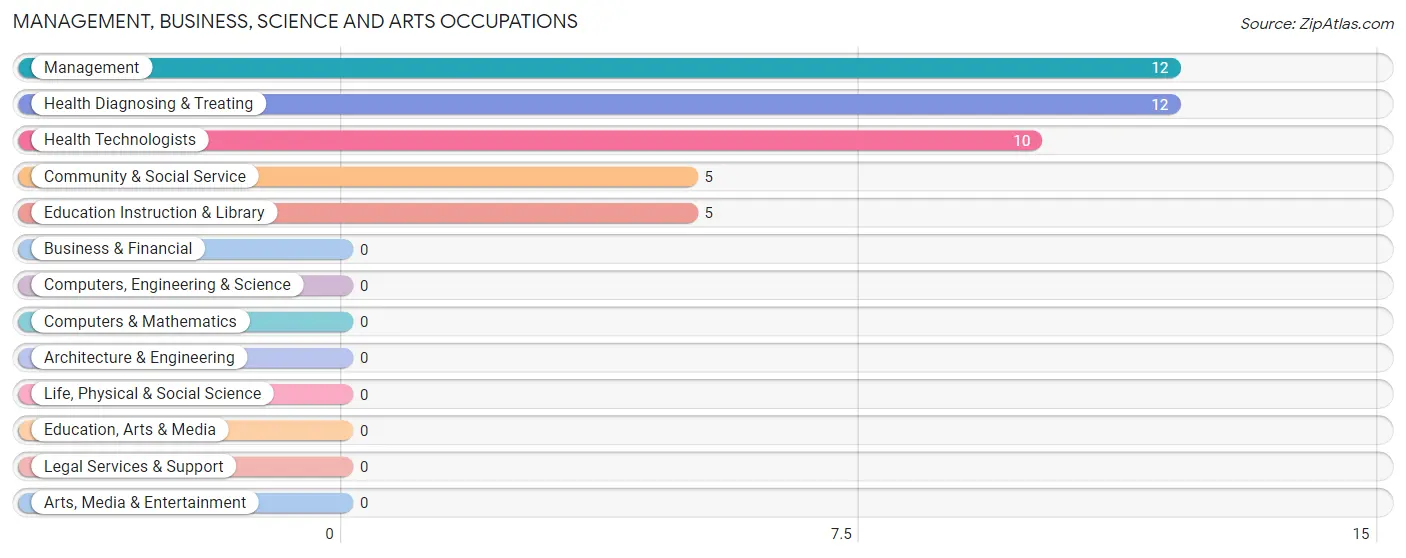
Management, Business, Science and Arts Occupations by Sex
Within the Management, Business, Science and Arts occupations in Kline, the most male-oriented occupations are Community & Social Service (100.0%), Education Instruction & Library (100.0%), and Management (66.7%), while the most female-oriented occupations are Health Technologists (100.0%), Health Diagnosing & Treating (83.3%), and Management (33.3%).
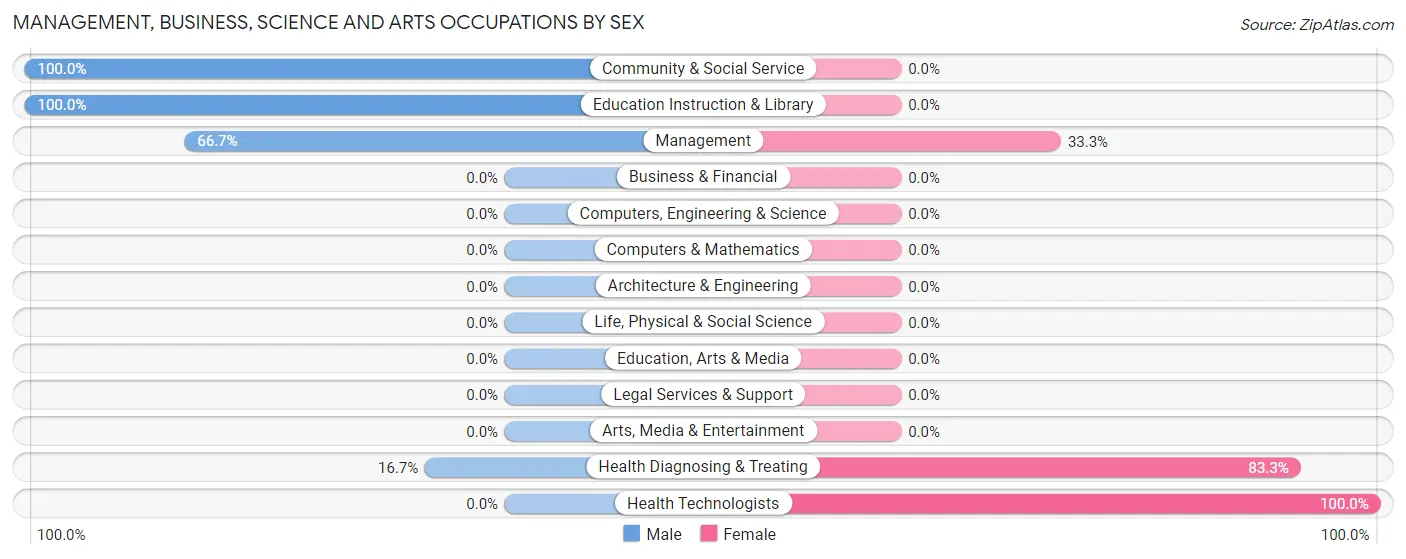
| Occupation | Male | Female |
| Management | 8 (66.7%) | 4 (33.3%) |
| Business & Financial | 0 (0.0%) | 0 (0.0%) |
| Computers, Engineering & Science | 0 (0.0%) | 0 (0.0%) |
| Computers & Mathematics | 0 (0.0%) | 0 (0.0%) |
| Architecture & Engineering | 0 (0.0%) | 0 (0.0%) |
| Life, Physical & Social Science | 0 (0.0%) | 0 (0.0%) |
| Community & Social Service | 5 (100.0%) | 0 (0.0%) |
| Education, Arts & Media | 0 (0.0%) | 0 (0.0%) |
| Legal Services & Support | 0 (0.0%) | 0 (0.0%) |
| Education Instruction & Library | 5 (100.0%) | 0 (0.0%) |
| Arts, Media & Entertainment | 0 (0.0%) | 0 (0.0%) |
| Health Diagnosing & Treating | 2 (16.7%) | 10 (83.3%) |
| Health Technologists | 0 (0.0%) | 10 (100.0%) |
| Total (Category) | 15 (51.7%) | 14 (48.3%) |
| Total (Overall) | 40 (57.1%) | 30 (42.9%) |
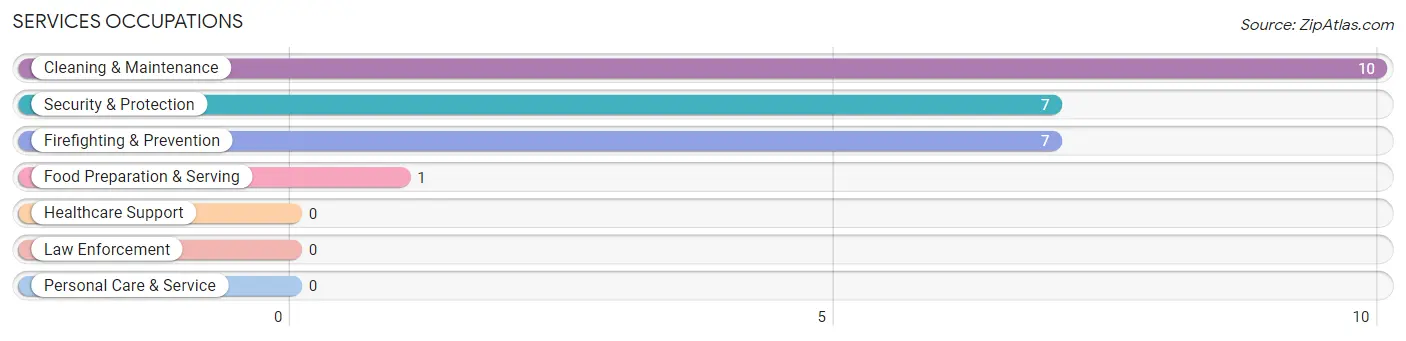
Services Occupations
The most common Services occupations in Kline are Cleaning & Maintenance (10 | 14.3%), Security & Protection (7 | 10.0%), Firefighting & Prevention (7 | 10.0%), and Food Preparation & Serving (1 | 1.4%).
Services Occupations by Sex
Within the Services occupations in Kline, the most male-oriented occupations are Security & Protection (100.0%), Firefighting & Prevention (100.0%), and Cleaning & Maintenance (20.0%), while the most female-oriented occupations are Food Preparation & Serving (100.0%), and Cleaning & Maintenance (80.0%).
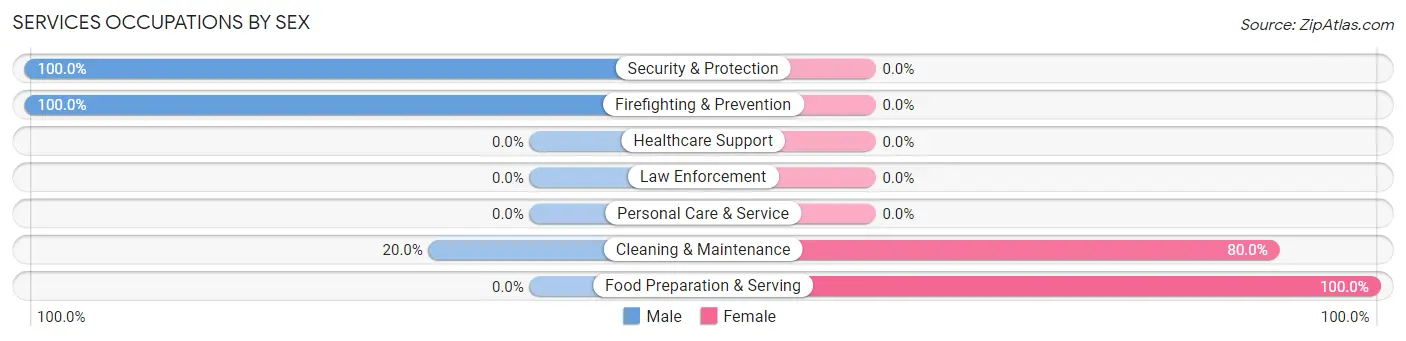
| Occupation | Male | Female |
| Healthcare Support | 0 (0.0%) | 0 (0.0%) |
| Security & Protection | 7 (100.0%) | 0 (0.0%) |
| Firefighting & Prevention | 7 (100.0%) | 0 (0.0%) |
| Law Enforcement | 0 (0.0%) | 0 (0.0%) |
| Food Preparation & Serving | 0 (0.0%) | 1 (100.0%) |
| Cleaning & Maintenance | 2 (20.0%) | 8 (80.0%) |
| Personal Care & Service | 0 (0.0%) | 0 (0.0%) |
| Total (Category) | 9 (50.0%) | 9 (50.0%) |
| Total (Overall) | 40 (57.1%) | 30 (42.9%) |
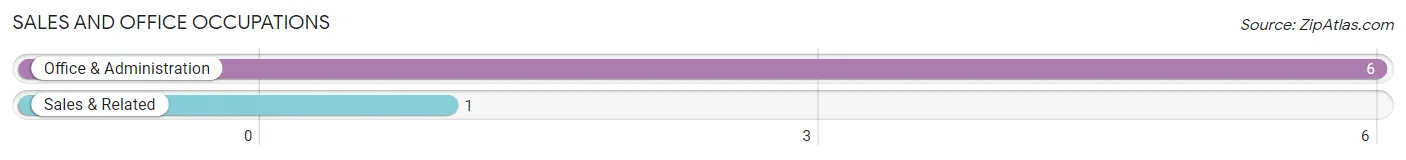
Sales and Office Occupations
The most common Sales and Office occupations in Kline are Office & Administration (6 | 8.6%), and Sales & Related (1 | 1.4%).
Sales and Office Occupations by Sex
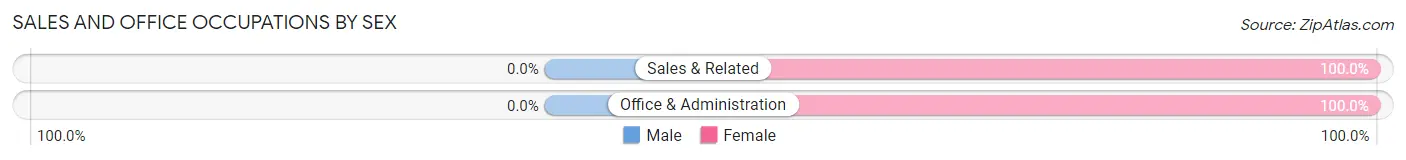
| Occupation | Male | Female |
| Sales & Related | 0 (0.0%) | 1 (100.0%) |
| Office & Administration | 0 (0.0%) | 6 (100.0%) |
| Total (Category) | 0 (0.0%) | 7 (100.0%) |
| Total (Overall) | 40 (57.1%) | 30 (42.9%) |
Natural Resources, Construction and Maintenance Occupations
The most common Natural Resources, Construction and Maintenance occupations in Kline are , and Installation, Maintenance & Repair (6 | 8.6%).
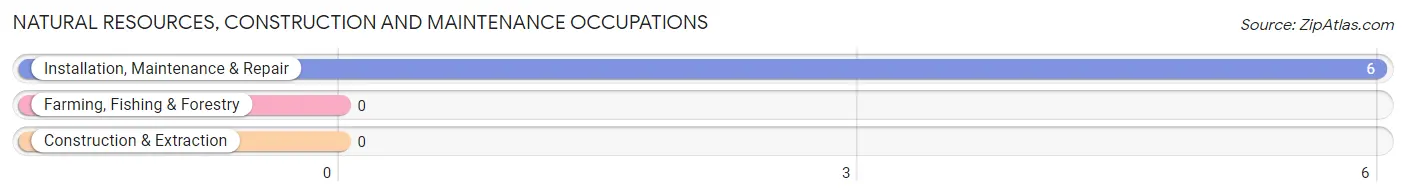
Natural Resources, Construction and Maintenance Occupations by Sex
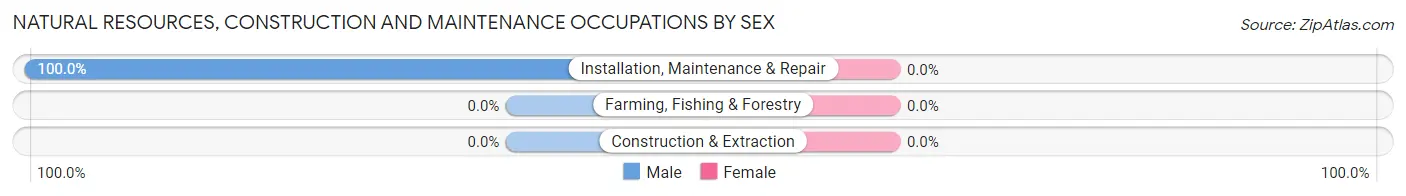
| Occupation | Male | Female |
| Farming, Fishing & Forestry | 0 (0.0%) | 0 (0.0%) |
| Construction & Extraction | 0 (0.0%) | 0 (0.0%) |
| Installation, Maintenance & Repair | 6 (100.0%) | 0 (0.0%) |
| Total (Category) | 6 (100.0%) | 0 (0.0%) |
| Total (Overall) | 40 (57.1%) | 30 (42.9%) |
Production, Transportation and Moving Occupations
The most common Production, Transportation and Moving occupations in Kline are Material Moving (6 | 8.6%), and Production (4 | 5.7%).
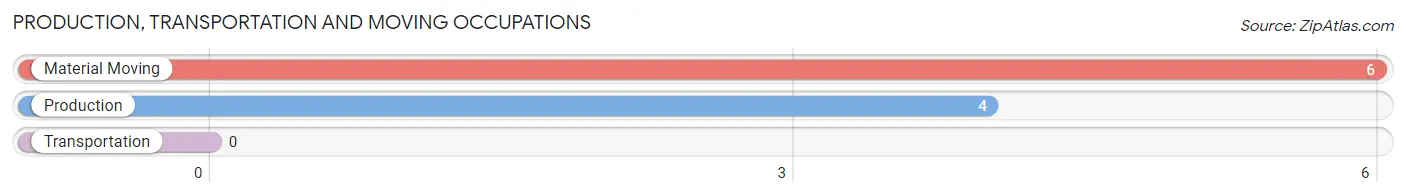
Production, Transportation and Moving Occupations by Sex
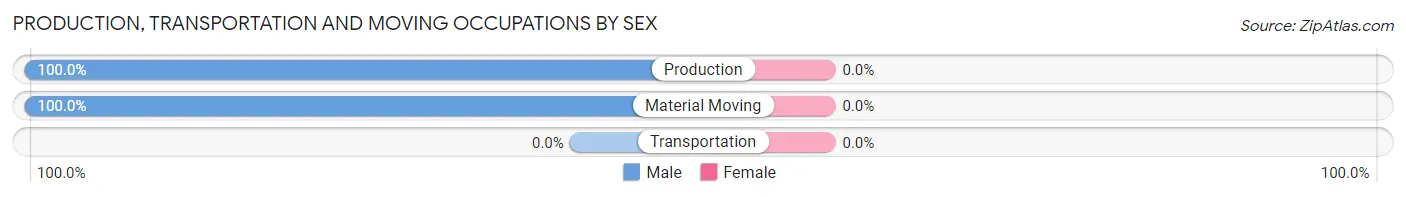
| Occupation | Male | Female |
| Production | 4 (100.0%) | 0 (0.0%) |
| Transportation | 0 (0.0%) | 0 (0.0%) |
| Material Moving | 6 (100.0%) | 0 (0.0%) |
| Total (Category) | 10 (100.0%) | 0 (0.0%) |
| Total (Overall) | 40 (57.1%) | 30 (42.9%) |
Employment Industries by Sex in Kline
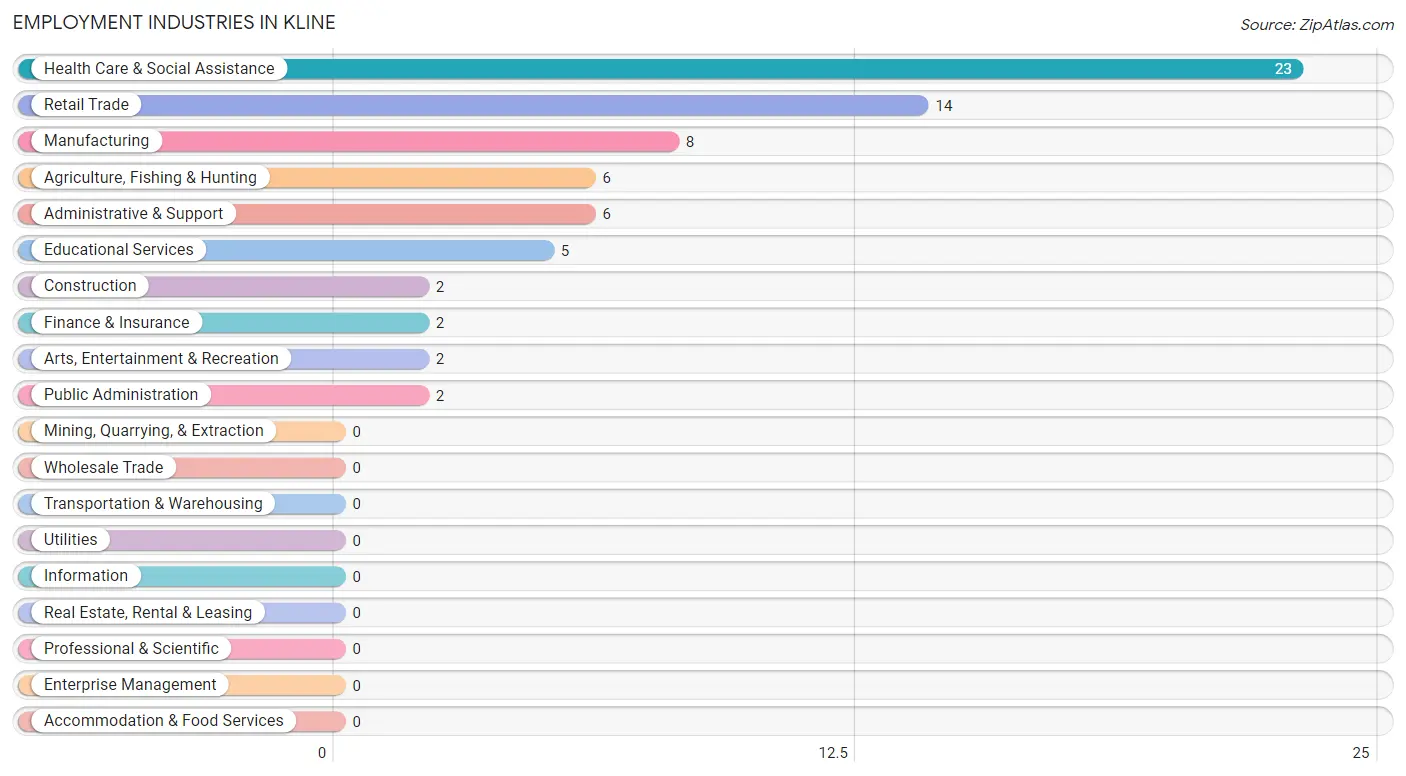
Employment Industries in Kline
The major employment industries in Kline include Health Care & Social Assistance (23 | 32.9%), Retail Trade (14 | 20.0%), Manufacturing (8 | 11.4%), Agriculture, Fishing & Hunting (6 | 8.6%), and Administrative & Support (6 | 8.6%).
Employment Industries by Sex in Kline
The Kline industries that see more men than women are Construction (100.0%), Educational Services (100.0%), and Arts, Entertainment & Recreation (100.0%), whereas the industries that tend to have a higher number of women are Finance & Insurance (100.0%), Administrative & Support (100.0%), and Health Care & Social Assistance (60.9%).
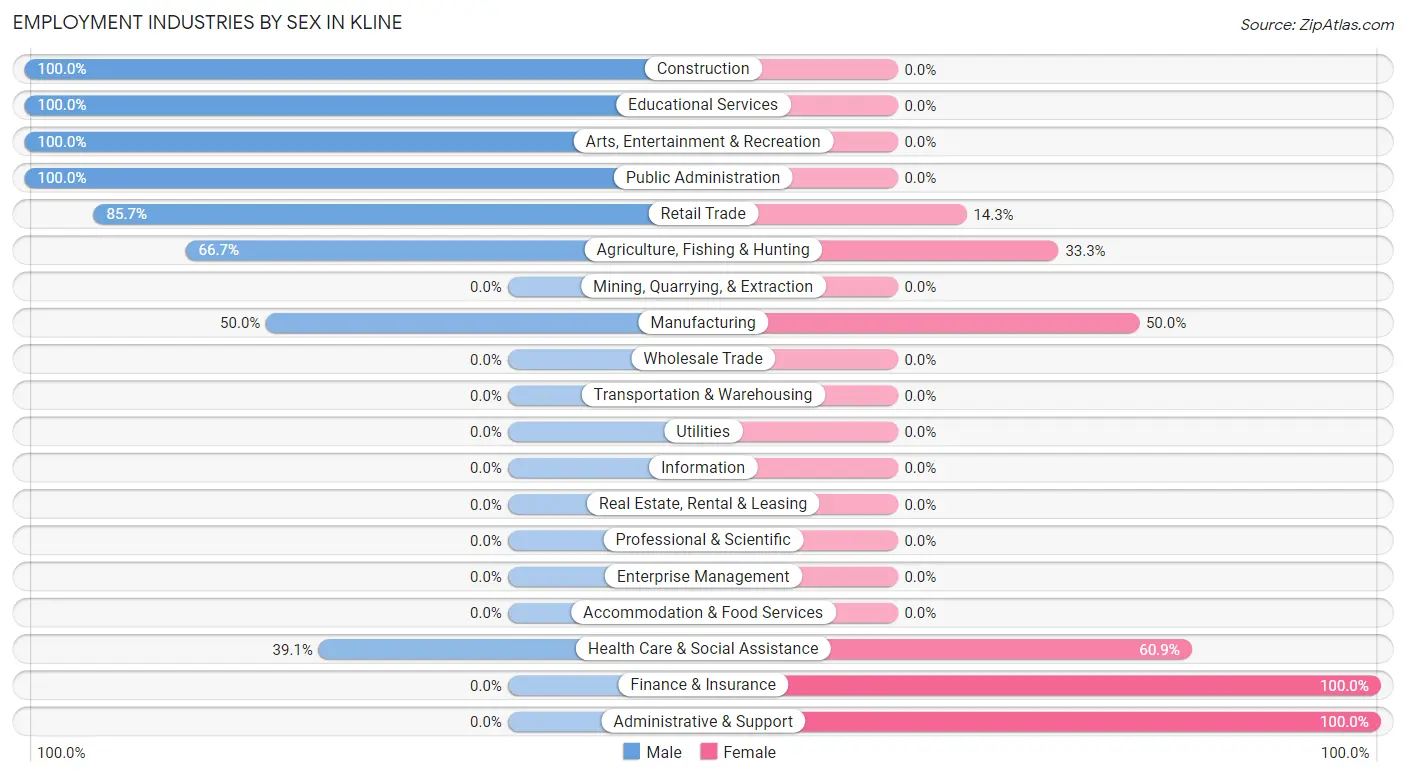
| Industry | Male | Female |
| Agriculture, Fishing & Hunting | 4 (66.7%) | 2 (33.3%) |
| Mining, Quarrying, & Extraction | 0 (0.0%) | 0 (0.0%) |
| Construction | 2 (100.0%) | 0 (0.0%) |
| Manufacturing | 4 (50.0%) | 4 (50.0%) |
| Wholesale Trade | 0 (0.0%) | 0 (0.0%) |
| Retail Trade | 12 (85.7%) | 2 (14.3%) |
| Transportation & Warehousing | 0 (0.0%) | 0 (0.0%) |
| Utilities | 0 (0.0%) | 0 (0.0%) |
| Information | 0 (0.0%) | 0 (0.0%) |
| Finance & Insurance | 0 (0.0%) | 2 (100.0%) |
| Real Estate, Rental & Leasing | 0 (0.0%) | 0 (0.0%) |
| Professional & Scientific | 0 (0.0%) | 0 (0.0%) |
| Enterprise Management | 0 (0.0%) | 0 (0.0%) |
| Administrative & Support | 0 (0.0%) | 6 (100.0%) |
| Educational Services | 5 (100.0%) | 0 (0.0%) |
| Health Care & Social Assistance | 9 (39.1%) | 14 (60.9%) |
| Arts, Entertainment & Recreation | 2 (100.0%) | 0 (0.0%) |
| Accommodation & Food Services | 0 (0.0%) | 0 (0.0%) |
| Public Administration | 2 (100.0%) | 0 (0.0%) |
| Total | 40 (57.1%) | 30 (42.9%) |
Education in Kline
School Enrollment in Kline
The most common levels of schooling among the 79 students in Kline are elementary school (21 | 26.6%), high school (19 | 24.0%), and college / undergraduate (17 | 21.5%).
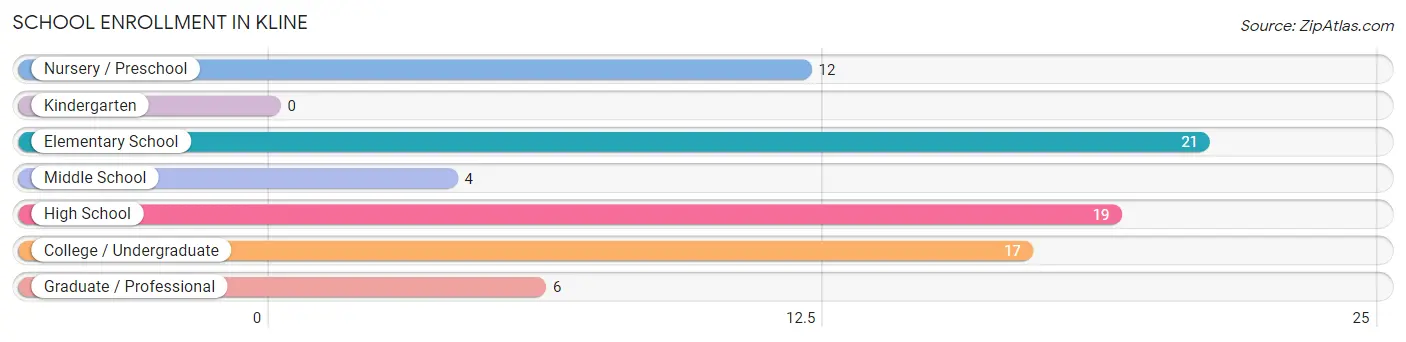
| School Level | # Students | % Students |
| Nursery / Preschool | 12 | 15.2% |
| Kindergarten | 0 | 0.0% |
| Elementary School | 21 | 26.6% |
| Middle School | 4 | 5.1% |
| High School | 19 | 24.0% |
| College / Undergraduate | 17 | 21.5% |
| Graduate / Professional | 6 | 7.6% |
| Total | 79 | 100.0% |
School Enrollment by Age by Funding Source in Kline
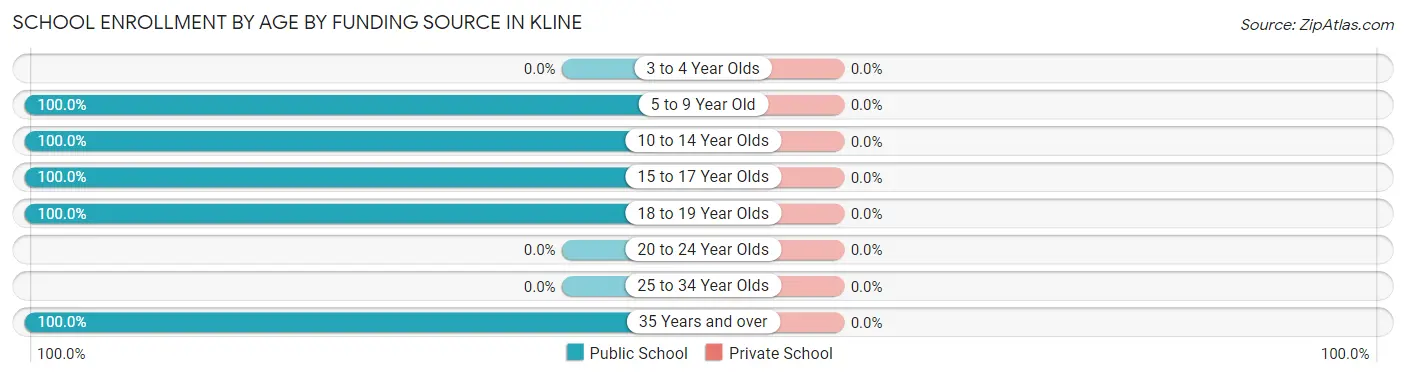
| Age Bracket | Public School | Private School |
| 3 to 4 Year Olds | 0 (0.0%) | 0 (0.0%) |
| 5 to 9 Year Old | 33 (100.0%) | 0 (0.0%) |
| 10 to 14 Year Olds | 8 (100.0%) | 0 (0.0%) |
| 15 to 17 Year Olds | 15 (100.0%) | 0 (0.0%) |
| 18 to 19 Year Olds | 7 (100.0%) | 0 (0.0%) |
| 20 to 24 Year Olds | 0 (0.0%) | 0 (0.0%) |
| 25 to 34 Year Olds | 0 (0.0%) | 0 (0.0%) |
| 35 Years and over | 16 (100.0%) | 0 (0.0%) |
| Total | 79 (100.0%) | 0 (0.0%) |
Educational Attainment by Field of Study in Kline
Arts & humanities (6 | 31.6%), visual & performing arts (5 | 26.3%), social sciences (2 | 10.5%), multidisciplinary studies (2 | 10.5%), and business (2 | 10.5%) are the most common fields of study among 19 individuals in Kline who have obtained a bachelor's degree or higher.
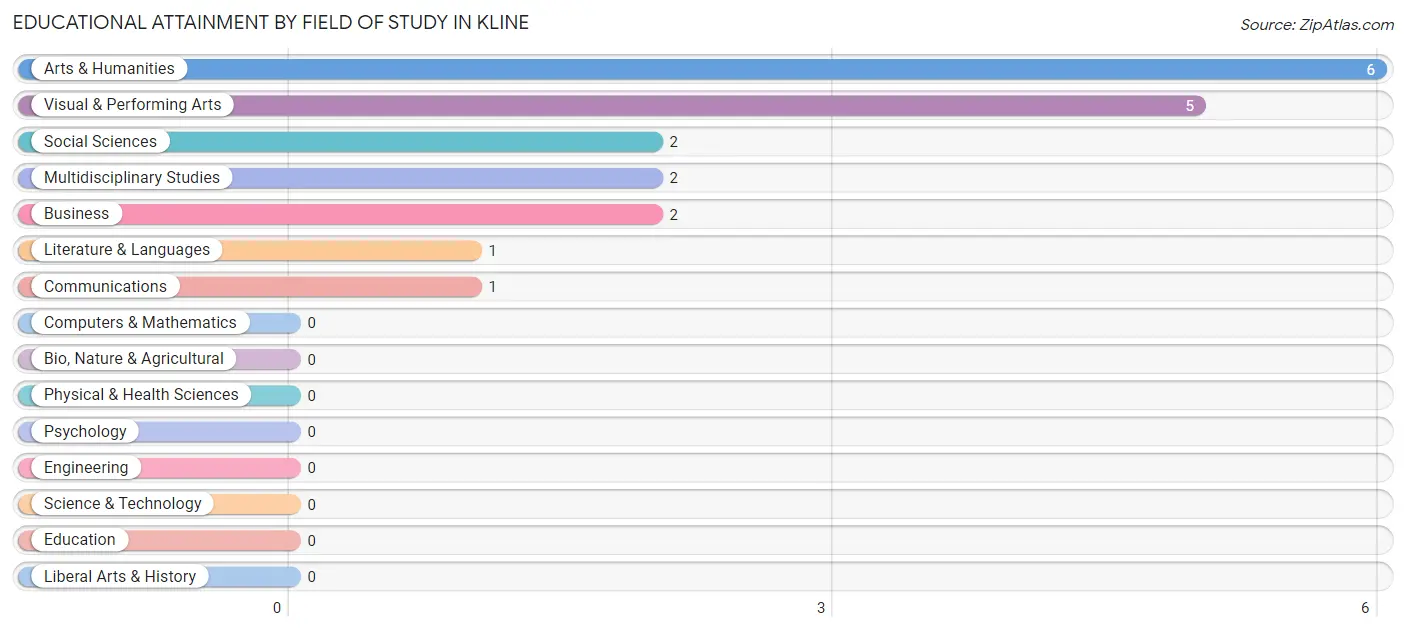
| Field of Study | # Graduates | % Graduates |
| Computers & Mathematics | 0 | 0.0% |
| Bio, Nature & Agricultural | 0 | 0.0% |
| Physical & Health Sciences | 0 | 0.0% |
| Psychology | 0 | 0.0% |
| Social Sciences | 2 | 10.5% |
| Engineering | 0 | 0.0% |
| Multidisciplinary Studies | 2 | 10.5% |
| Science & Technology | 0 | 0.0% |
| Business | 2 | 10.5% |
| Education | 0 | 0.0% |
| Literature & Languages | 1 | 5.3% |
| Liberal Arts & History | 0 | 0.0% |
| Visual & Performing Arts | 5 | 26.3% |
| Communications | 1 | 5.3% |
| Arts & Humanities | 6 | 31.6% |
| Total | 19 | 100.0% |
Transportation & Commute in Kline
Vehicle Availability by Sex in Kline
The most prevalent vehicle ownership categories in Kline are males with 1 vehicle (23, accounting for 57.5%) and females with 1 vehicle (8, making up 76.7%).
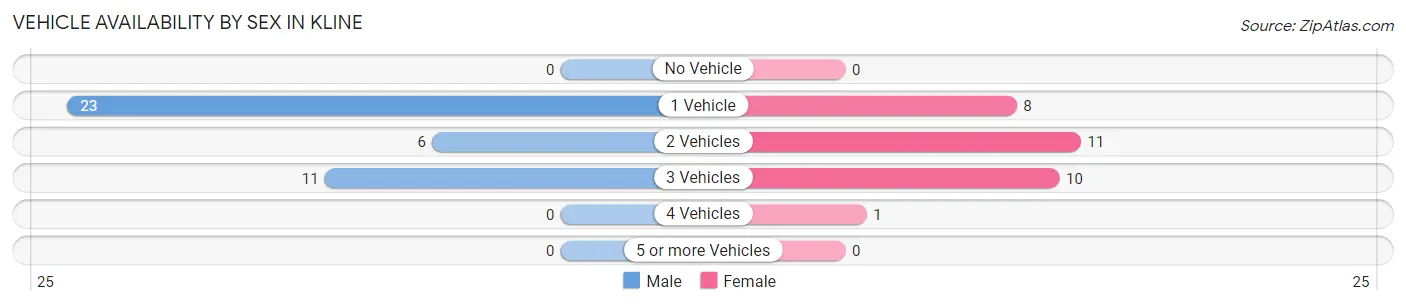
| Vehicles Available | Male | Female |
| No Vehicle | 0 (0.0%) | 0 (0.0%) |
| 1 Vehicle | 23 (57.5%) | 8 (26.7%) |
| 2 Vehicles | 6 (15.0%) | 11 (36.7%) |
| 3 Vehicles | 11 (27.5%) | 10 (33.3%) |
| 4 Vehicles | 0 (0.0%) | 1 (3.3%) |
| 5 or more Vehicles | 0 (0.0%) | 0 (0.0%) |
| Total | 40 (100.0%) | 30 (100.0%) |
Commute Time in Kline
The most frequently occuring commute durations in Kline are 30 to 34 minutes (16 commuters, 22.9%), 15 to 19 minutes (14 commuters, 20.0%), and 20 to 24 minutes (10 commuters, 14.3%).
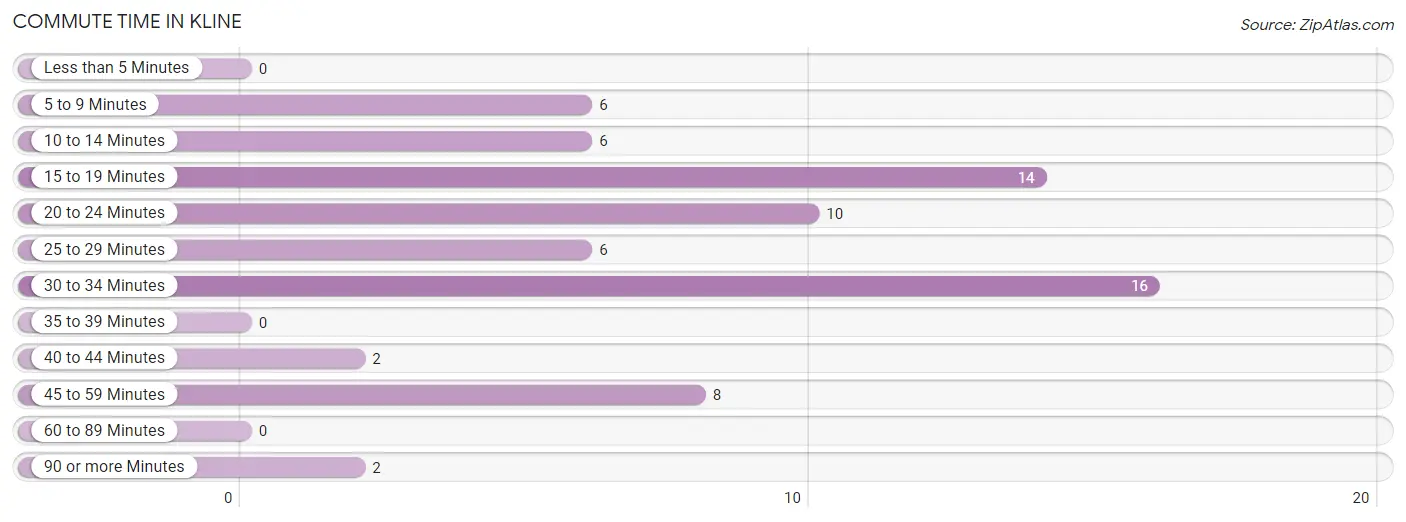
| Commute Time | # Commuters | % Commuters |
| Less than 5 Minutes | 0 | 0.0% |
| 5 to 9 Minutes | 6 | 8.6% |
| 10 to 14 Minutes | 6 | 8.6% |
| 15 to 19 Minutes | 14 | 20.0% |
| 20 to 24 Minutes | 10 | 14.3% |
| 25 to 29 Minutes | 6 | 8.6% |
| 30 to 34 Minutes | 16 | 22.9% |
| 35 to 39 Minutes | 0 | 0.0% |
| 40 to 44 Minutes | 2 | 2.9% |
| 45 to 59 Minutes | 8 | 11.4% |
| 60 to 89 Minutes | 0 | 0.0% |
| 90 or more Minutes | 2 | 2.9% |
Commute Time by Sex in Kline
The most common commute times in Kline are 30 to 34 minutes (11 commuters, 27.5%) for males and 20 to 24 minutes (10 commuters, 33.3%) for females.
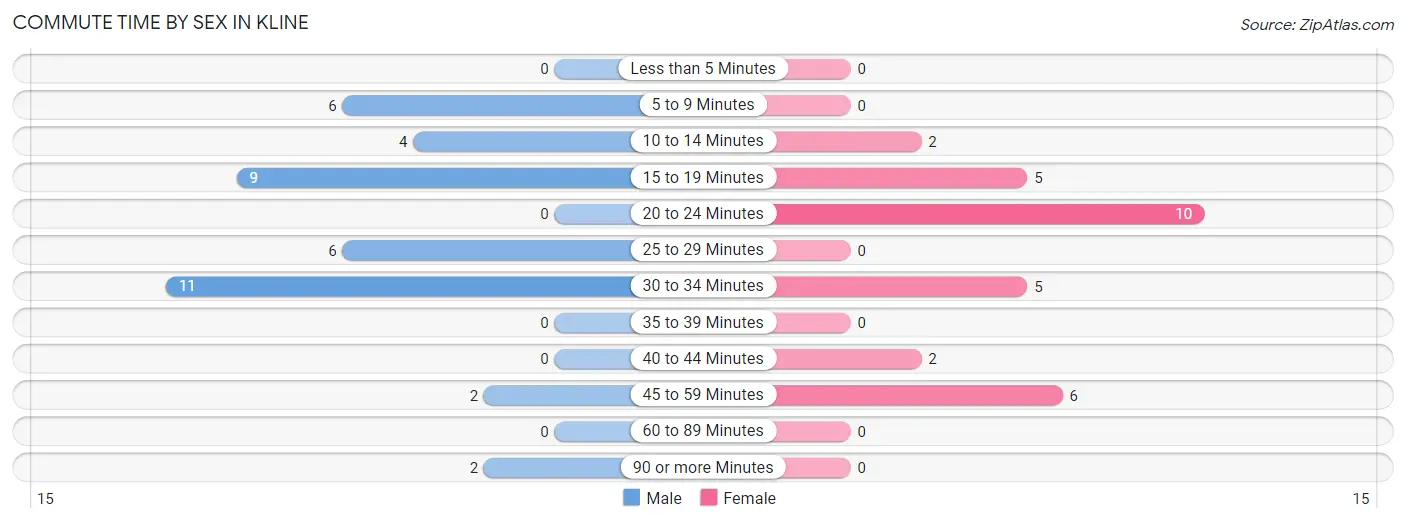
| Commute Time | Male | Female |
| Less than 5 Minutes | 0 (0.0%) | 0 (0.0%) |
| 5 to 9 Minutes | 6 (15.0%) | 0 (0.0%) |
| 10 to 14 Minutes | 4 (10.0%) | 2 (6.7%) |
| 15 to 19 Minutes | 9 (22.5%) | 5 (16.7%) |
| 20 to 24 Minutes | 0 (0.0%) | 10 (33.3%) |
| 25 to 29 Minutes | 6 (15.0%) | 0 (0.0%) |
| 30 to 34 Minutes | 11 (27.5%) | 5 (16.7%) |
| 35 to 39 Minutes | 0 (0.0%) | 0 (0.0%) |
| 40 to 44 Minutes | 0 (0.0%) | 2 (6.7%) |
| 45 to 59 Minutes | 2 (5.0%) | 6 (20.0%) |
| 60 to 89 Minutes | 0 (0.0%) | 0 (0.0%) |
| 90 or more Minutes | 2 (5.0%) | 0 (0.0%) |
Time of Departure to Work by Sex in Kline
The most frequent times of departure to work in Kline are 6:00 AM to 6:29 AM (8, 20.0%) for males and 4:00 PM to 11:59 PM (10, 33.3%) for females.
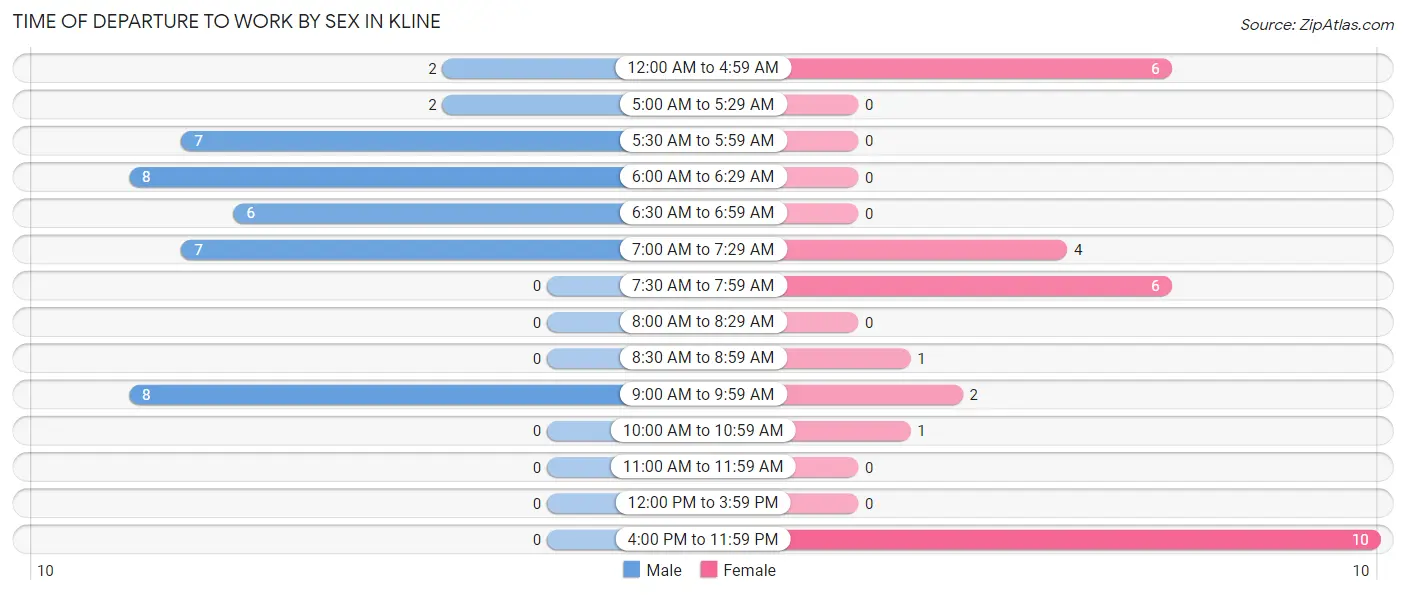
| Time of Departure | Male | Female |
| 12:00 AM to 4:59 AM | 2 (5.0%) | 6 (20.0%) |
| 5:00 AM to 5:29 AM | 2 (5.0%) | 0 (0.0%) |
| 5:30 AM to 5:59 AM | 7 (17.5%) | 0 (0.0%) |
| 6:00 AM to 6:29 AM | 8 (20.0%) | 0 (0.0%) |
| 6:30 AM to 6:59 AM | 6 (15.0%) | 0 (0.0%) |
| 7:00 AM to 7:29 AM | 7 (17.5%) | 4 (13.3%) |
| 7:30 AM to 7:59 AM | 0 (0.0%) | 6 (20.0%) |
| 8:00 AM to 8:29 AM | 0 (0.0%) | 0 (0.0%) |
| 8:30 AM to 8:59 AM | 0 (0.0%) | 1 (3.3%) |
| 9:00 AM to 9:59 AM | 8 (20.0%) | 2 (6.7%) |
| 10:00 AM to 10:59 AM | 0 (0.0%) | 1 (3.3%) |
| 11:00 AM to 11:59 AM | 0 (0.0%) | 0 (0.0%) |
| 12:00 PM to 3:59 PM | 0 (0.0%) | 0 (0.0%) |
| 4:00 PM to 11:59 PM | 0 (0.0%) | 10 (33.3%) |
| Total | 40 (100.0%) | 30 (100.0%) |
Housing Occupancy in Kline
Occupancy by Ownership in Kline
Of the total 61 dwellings in Kline, owner-occupied units account for 55 (90.2%), while renter-occupied units make up 6 (9.8%).
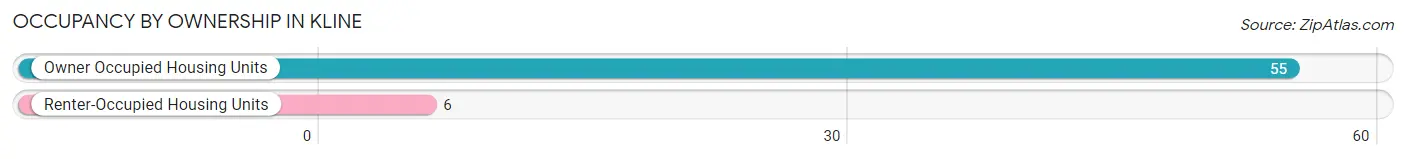
| Occupancy | # Housing Units | % Housing Units |
| Owner Occupied Housing Units | 55 | 90.2% |
| Renter-Occupied Housing Units | 6 | 9.8% |
| Total Occupied Housing Units | 61 | 100.0% |
Occupancy by Household Size in Kline
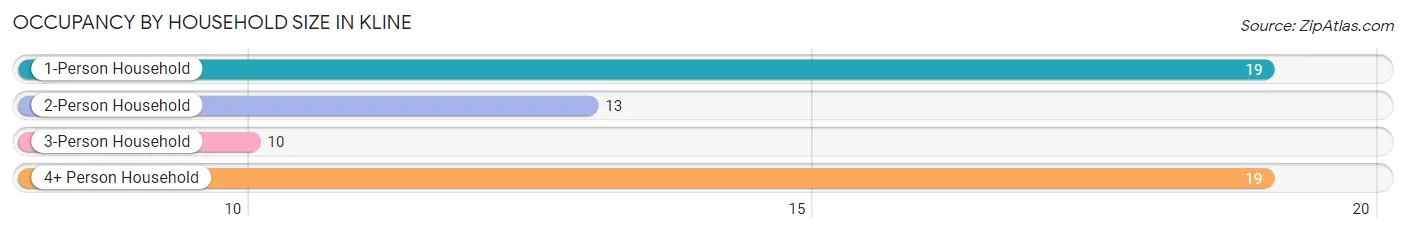
| Household Size | # Housing Units | % Housing Units |
| 1-Person Household | 19 | 31.1% |
| 2-Person Household | 13 | 21.3% |
| 3-Person Household | 10 | 16.4% |
| 4+ Person Household | 19 | 31.1% |
| Total Housing Units | 61 | 100.0% |
Occupancy by Ownership by Household Size in Kline
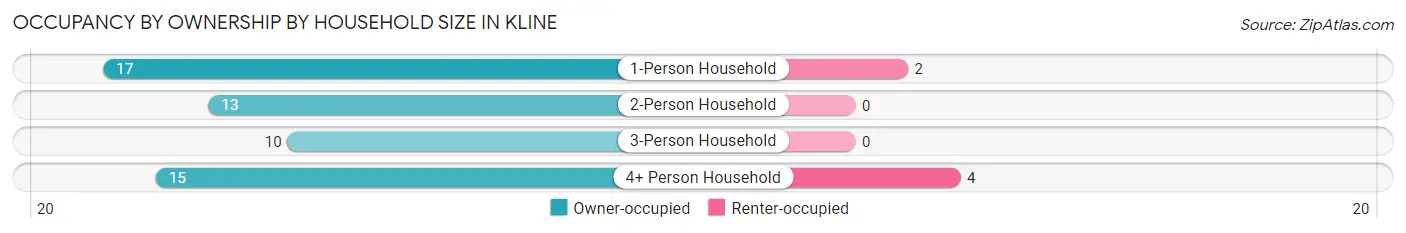
| Household Size | Owner-occupied | Renter-occupied |
| 1-Person Household | 17 (89.5%) | 2 (10.5%) |
| 2-Person Household | 13 (100.0%) | 0 (0.0%) |
| 3-Person Household | 10 (100.0%) | 0 (0.0%) |
| 4+ Person Household | 15 (78.9%) | 4 (21.0%) |
| Total Housing Units | 55 (90.2%) | 6 (9.8%) |
Occupancy by Educational Attainment in Kline
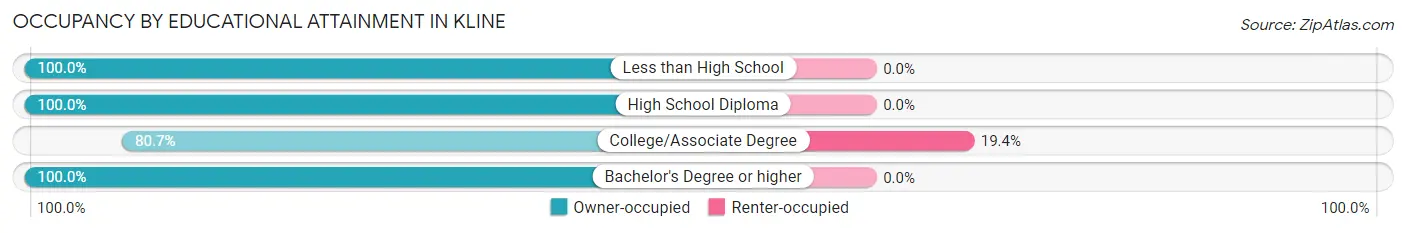
| Household Size | Owner-occupied | Renter-occupied |
| Less than High School | 5 (100.0%) | 0 (0.0%) |
| High School Diploma | 14 (100.0%) | 0 (0.0%) |
| College/Associate Degree | 25 (80.6%) | 6 (19.4%) |
| Bachelor's Degree or higher | 11 (100.0%) | 0 (0.0%) |
Occupancy by Age of Householder in Kline
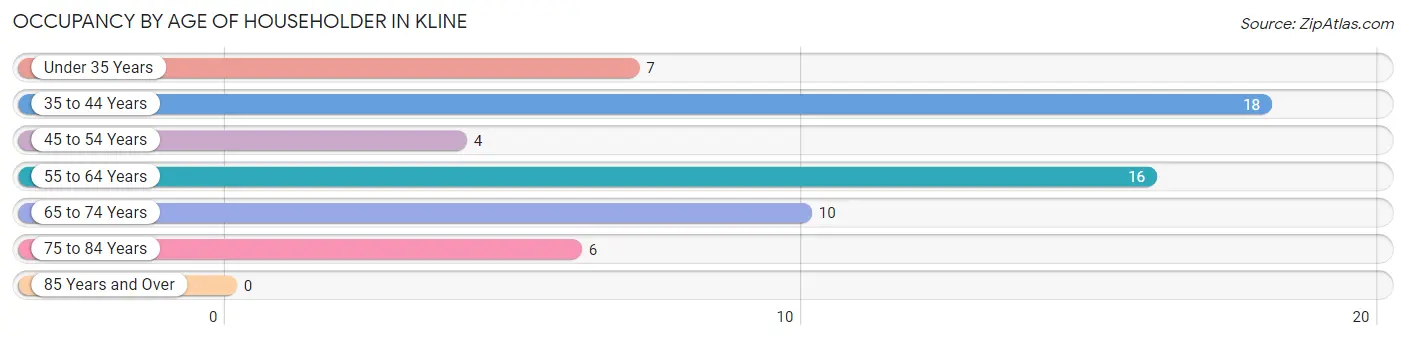
| Age Bracket | # Households | % Households |
| Under 35 Years | 7 | 11.5% |
| 35 to 44 Years | 18 | 29.5% |
| 45 to 54 Years | 4 | 6.6% |
| 55 to 64 Years | 16 | 26.2% |
| 65 to 74 Years | 10 | 16.4% |
| 75 to 84 Years | 6 | 9.8% |
| 85 Years and Over | 0 | 0.0% |
| Total | 61 | 100.0% |
Housing Finances in Kline
Median Income by Occupancy in Kline
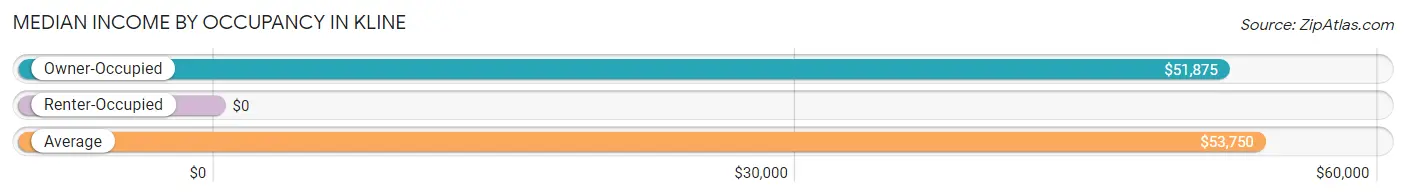
| Occupancy Type | # Households | Median Income |
| Owner-Occupied | 55 (90.2%) | $51,875 |
| Renter-Occupied | 6 (9.8%) | $0 |
| Average | 61 (100.0%) | $53,750 |
Occupancy by Householder Income Bracket in Kline
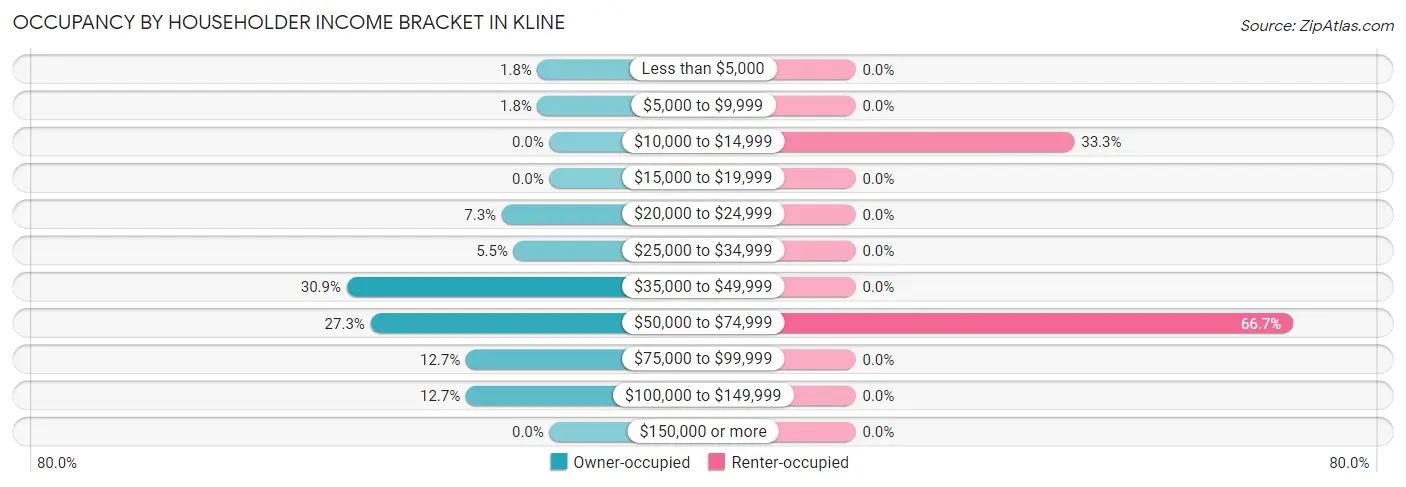
| Income Bracket | Owner-occupied | Renter-occupied |
| Less than $5,000 | 1 (1.8%) | 0 (0.0%) |
| $5,000 to $9,999 | 1 (1.8%) | 0 (0.0%) |
| $10,000 to $14,999 | 0 (0.0%) | 2 (33.3%) |
| $15,000 to $19,999 | 0 (0.0%) | 0 (0.0%) |
| $20,000 to $24,999 | 4 (7.3%) | 0 (0.0%) |
| $25,000 to $34,999 | 3 (5.4%) | 0 (0.0%) |
| $35,000 to $49,999 | 17 (30.9%) | 0 (0.0%) |
| $50,000 to $74,999 | 15 (27.3%) | 4 (66.7%) |
| $75,000 to $99,999 | 7 (12.7%) | 0 (0.0%) |
| $100,000 to $149,999 | 7 (12.7%) | 0 (0.0%) |
| $150,000 or more | 0 (0.0%) | 0 (0.0%) |
| Total | 55 (100.0%) | 6 (100.0%) |
Monthly Housing Cost Tiers in Kline
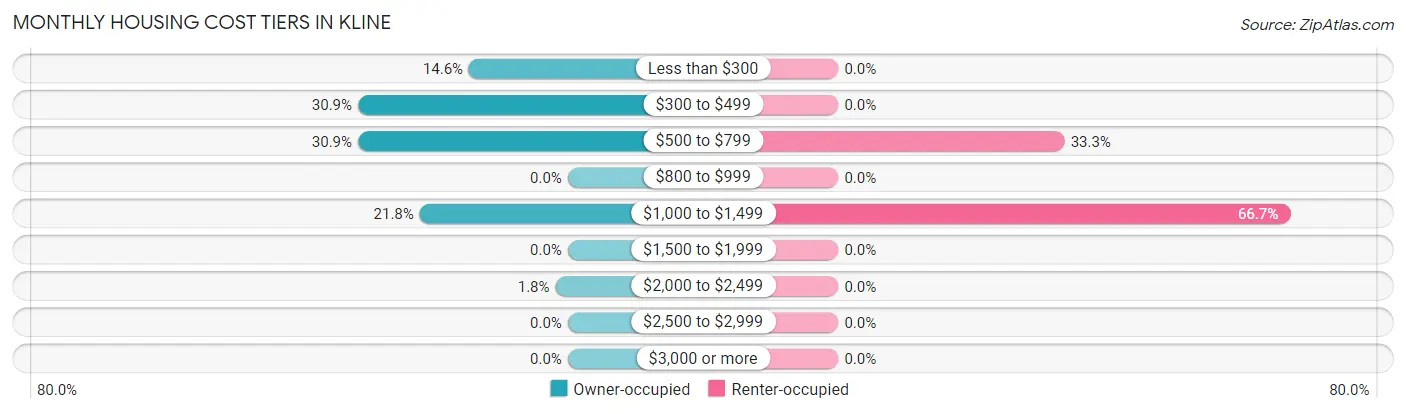
| Monthly Cost | Owner-occupied | Renter-occupied |
| Less than $300 | 8 (14.5%) | 0 (0.0%) |
| $300 to $499 | 17 (30.9%) | 0 (0.0%) |
| $500 to $799 | 17 (30.9%) | 2 (33.3%) |
| $800 to $999 | 0 (0.0%) | 0 (0.0%) |
| $1,000 to $1,499 | 12 (21.8%) | 4 (66.7%) |
| $1,500 to $1,999 | 0 (0.0%) | 0 (0.0%) |
| $2,000 to $2,499 | 1 (1.8%) | 0 (0.0%) |
| $2,500 to $2,999 | 0 (0.0%) | 0 (0.0%) |
| $3,000 or more | 0 (0.0%) | 0 (0.0%) |
| Total | 55 (100.0%) | 6 (100.0%) |
Physical Housing Characteristics in Kline
Housing Structures in Kline
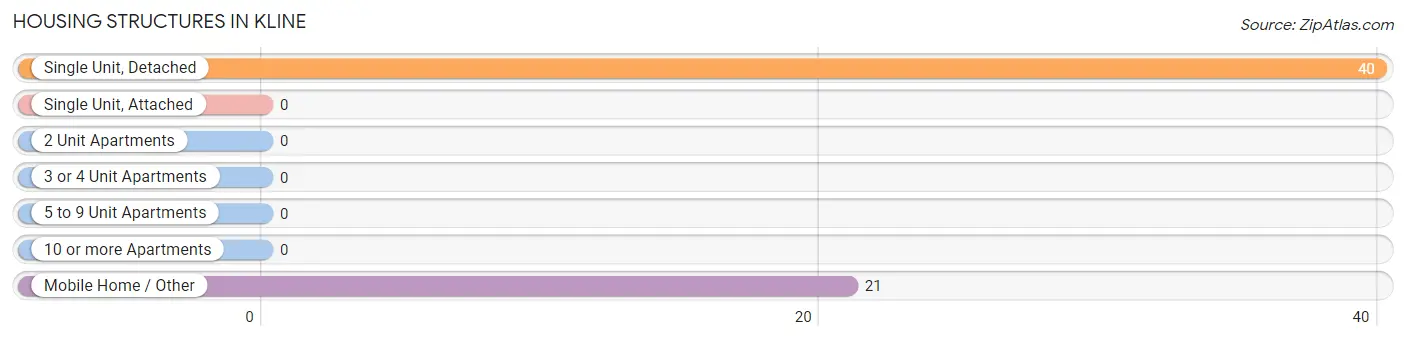
| Structure Type | # Housing Units | % Housing Units |
| Single Unit, Detached | 40 | 65.6% |
| Single Unit, Attached | 0 | 0.0% |
| 2 Unit Apartments | 0 | 0.0% |
| 3 or 4 Unit Apartments | 0 | 0.0% |
| 5 to 9 Unit Apartments | 0 | 0.0% |
| 10 or more Apartments | 0 | 0.0% |
| Mobile Home / Other | 21 | 34.4% |
| Total | 61 | 100.0% |
Housing Structures by Occupancy in Kline
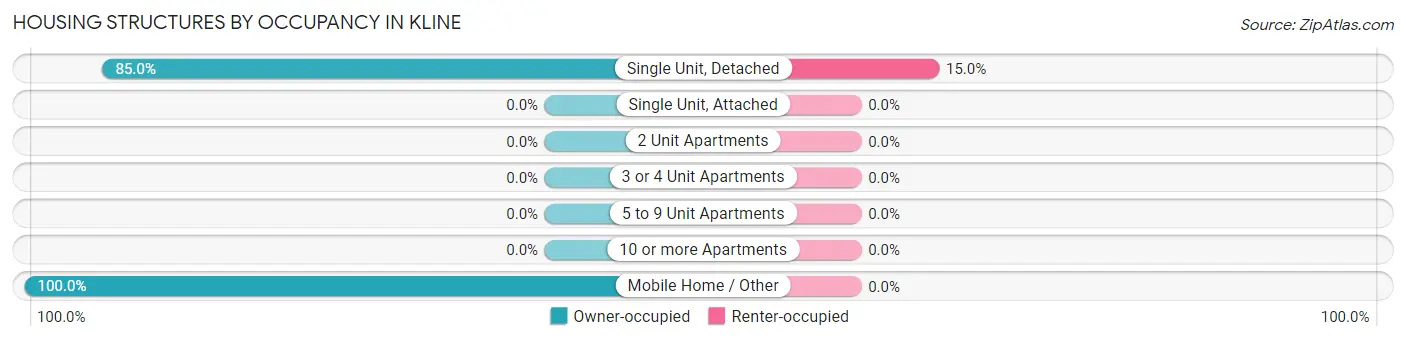
| Structure Type | Owner-occupied | Renter-occupied |
| Single Unit, Detached | 34 (85.0%) | 6 (15.0%) |
| Single Unit, Attached | 0 (0.0%) | 0 (0.0%) |
| 2 Unit Apartments | 0 (0.0%) | 0 (0.0%) |
| 3 or 4 Unit Apartments | 0 (0.0%) | 0 (0.0%) |
| 5 to 9 Unit Apartments | 0 (0.0%) | 0 (0.0%) |
| 10 or more Apartments | 0 (0.0%) | 0 (0.0%) |
| Mobile Home / Other | 21 (100.0%) | 0 (0.0%) |
| Total | 55 (90.2%) | 6 (9.8%) |
Housing Structures by Number of Rooms in Kline
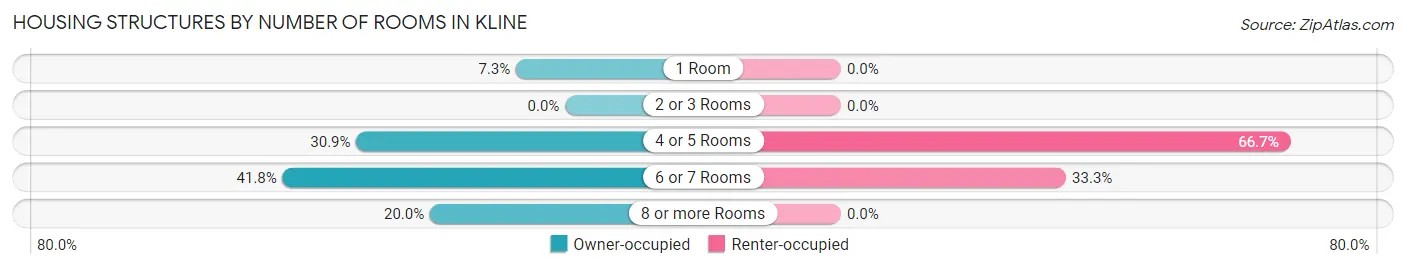
| Number of Rooms | Owner-occupied | Renter-occupied |
| 1 Room | 4 (7.3%) | 0 (0.0%) |
| 2 or 3 Rooms | 0 (0.0%) | 0 (0.0%) |
| 4 or 5 Rooms | 17 (30.9%) | 4 (66.7%) |
| 6 or 7 Rooms | 23 (41.8%) | 2 (33.3%) |
| 8 or more Rooms | 11 (20.0%) | 0 (0.0%) |
| Total | 55 (100.0%) | 6 (100.0%) |
Housing Structure by Heating Type in Kline
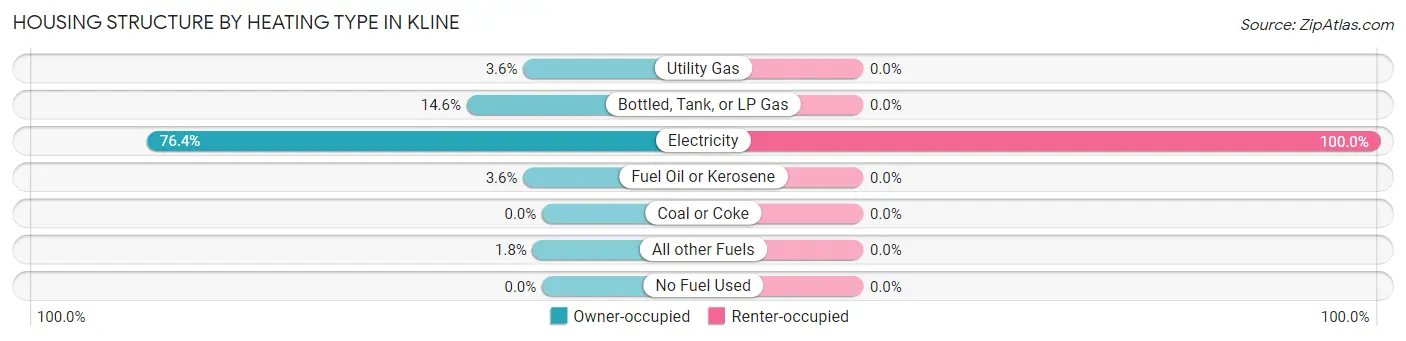
| Heating Type | Owner-occupied | Renter-occupied |
| Utility Gas | 2 (3.6%) | 0 (0.0%) |
| Bottled, Tank, or LP Gas | 8 (14.5%) | 0 (0.0%) |
| Electricity | 42 (76.4%) | 6 (100.0%) |
| Fuel Oil or Kerosene | 2 (3.6%) | 0 (0.0%) |
| Coal or Coke | 0 (0.0%) | 0 (0.0%) |
| All other Fuels | 1 (1.8%) | 0 (0.0%) |
| No Fuel Used | 0 (0.0%) | 0 (0.0%) |
| Total | 55 (100.0%) | 6 (100.0%) |
Household Vehicle Usage in Kline
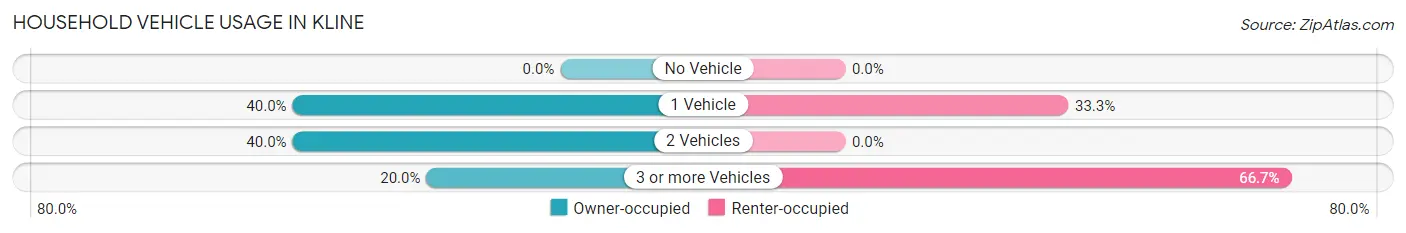
| Vehicles per Household | Owner-occupied | Renter-occupied |
| No Vehicle | 0 (0.0%) | 0 (0.0%) |
| 1 Vehicle | 22 (40.0%) | 2 (33.3%) |
| 2 Vehicles | 22 (40.0%) | 0 (0.0%) |
| 3 or more Vehicles | 11 (20.0%) | 4 (66.7%) |
| Total | 55 (100.0%) | 6 (100.0%) |
Real Estate & Mortgages in Kline
Real Estate and Mortgage Overview in Kline
| Characteristic | Without Mortgage | With Mortgage |
| Housing Units | 42 | 13 |
| Median Property Value | $90,000 | $127,500 |
| Median Household Income | $52,500 | $0 |
| Monthly Housing Costs | $443 | $0 |
| Real Estate Taxes | $342 | $0 |
Property Value by Mortgage Status in Kline
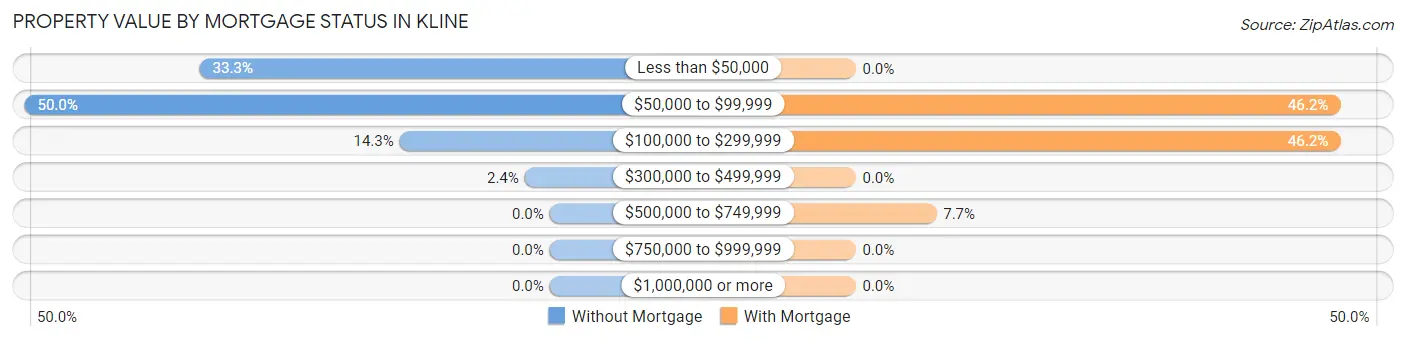
| Property Value | Without Mortgage | With Mortgage |
| Less than $50,000 | 14 (33.3%) | 0 (0.0%) |
| $50,000 to $99,999 | 21 (50.0%) | 6 (46.2%) |
| $100,000 to $299,999 | 6 (14.3%) | 6 (46.2%) |
| $300,000 to $499,999 | 1 (2.4%) | 0 (0.0%) |
| $500,000 to $749,999 | 0 (0.0%) | 1 (7.7%) |
| $750,000 to $999,999 | 0 (0.0%) | 0 (0.0%) |
| $1,000,000 or more | 0 (0.0%) | 0 (0.0%) |
| Total | 42 (100.0%) | 13 (100.0%) |
Household Income by Mortgage Status in Kline
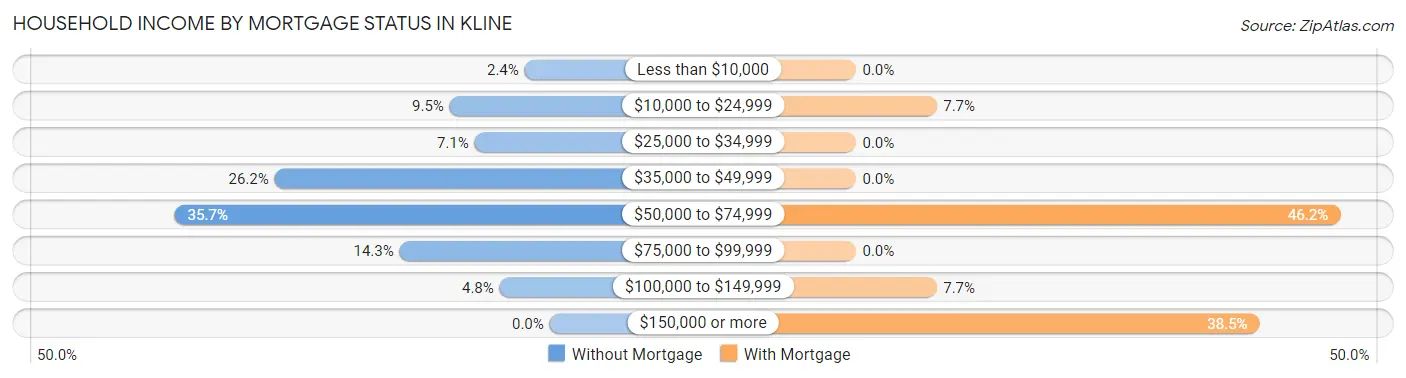
| Household Income | Without Mortgage | With Mortgage |
| Less than $10,000 | 1 (2.4%) | 0 (0.0%) |
| $10,000 to $24,999 | 4 (9.5%) | 1 (7.7%) |
| $25,000 to $34,999 | 3 (7.1%) | 0 (0.0%) |
| $35,000 to $49,999 | 11 (26.2%) | 0 (0.0%) |
| $50,000 to $74,999 | 15 (35.7%) | 6 (46.2%) |
| $75,000 to $99,999 | 6 (14.3%) | 0 (0.0%) |
| $100,000 to $149,999 | 2 (4.8%) | 1 (7.7%) |
| $150,000 or more | 0 (0.0%) | 5 (38.5%) |
| Total | 42 (100.0%) | 13 (100.0%) |
Property Value to Household Income Ratio in Kline
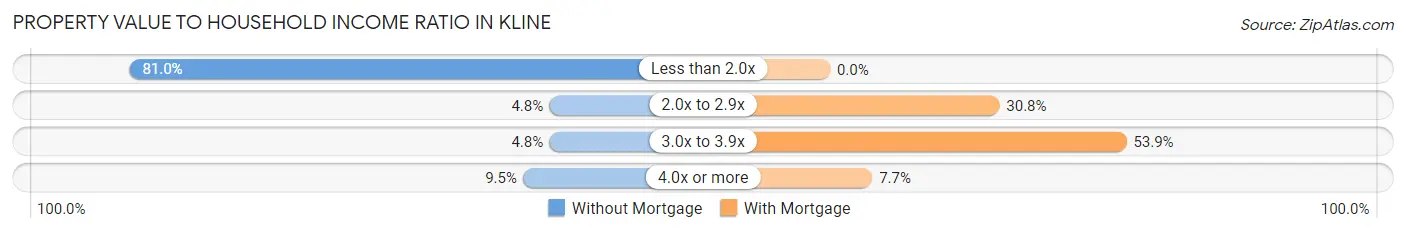
| Value-to-Income Ratio | Without Mortgage | With Mortgage |
| Less than 2.0x | 34 (80.9%) | 0 (0.0%) |
| 2.0x to 2.9x | 2 (4.8%) | 4 (30.8%) |
| 3.0x to 3.9x | 2 (4.8%) | 7 (53.8%) |
| 4.0x or more | 4 (9.5%) | 1 (7.7%) |
| Total | 42 (100.0%) | 13 (100.0%) |
Real Estate Taxes by Mortgage Status in Kline
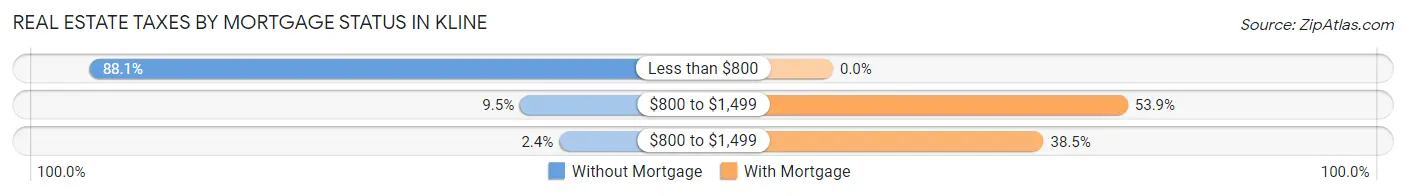
| Property Taxes | Without Mortgage | With Mortgage |
| Less than $800 | 37 (88.1%) | 0 (0.0%) |
| $800 to $1,499 | 4 (9.5%) | 7 (53.8%) |
| $800 to $1,499 | 1 (2.4%) | 5 (38.5%) |
| Total | 42 (100.0%) | 13 (100.0%) |
Health & Disability in Kline
Health Insurance Coverage by Age in Kline
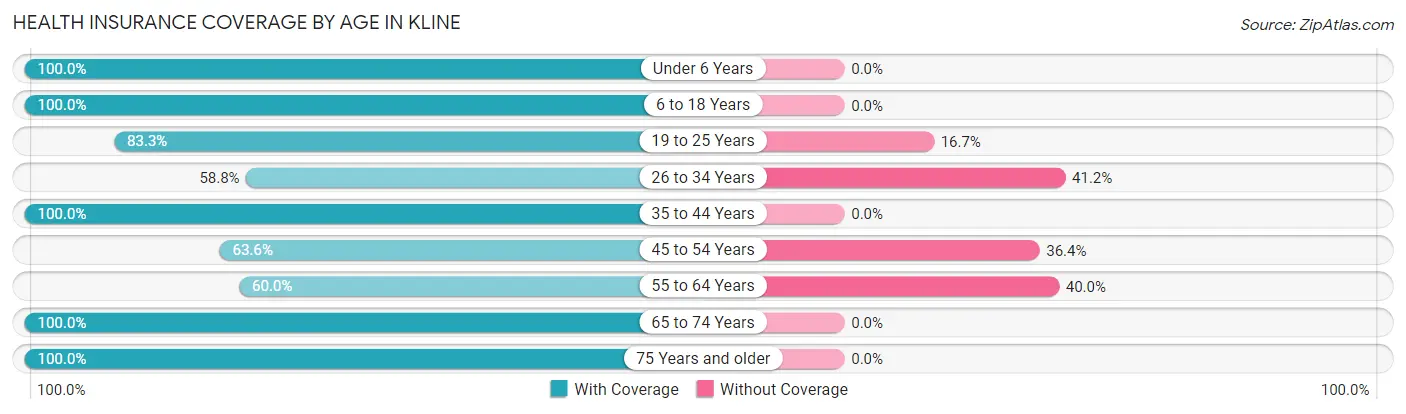
| Age Bracket | With Coverage | Without Coverage |
| Under 6 Years | 15 (100.0%) | 0 (0.0%) |
| 6 to 18 Years | 57 (100.0%) | 0 (0.0%) |
| 19 to 25 Years | 25 (83.3%) | 5 (16.7%) |
| 26 to 34 Years | 10 (58.8%) | 7 (41.2%) |
| 35 to 44 Years | 22 (100.0%) | 0 (0.0%) |
| 45 to 54 Years | 7 (63.6%) | 4 (36.4%) |
| 55 to 64 Years | 12 (60.0%) | 8 (40.0%) |
| 65 to 74 Years | 14 (100.0%) | 0 (0.0%) |
| 75 Years and older | 9 (100.0%) | 0 (0.0%) |
| Total | 171 (87.7%) | 24 (12.3%) |
Health Insurance Coverage by Citizenship Status in Kline
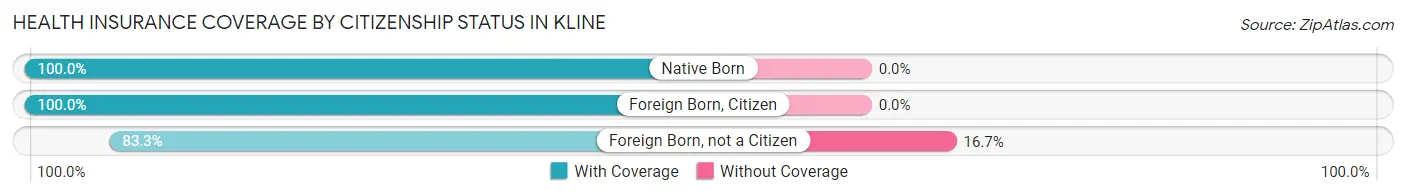
| Citizenship Status | With Coverage | Without Coverage |
| Native Born | 15 (100.0%) | 0 (0.0%) |
| Foreign Born, Citizen | 57 (100.0%) | 0 (0.0%) |
| Foreign Born, not a Citizen | 25 (83.3%) | 5 (16.7%) |
Health Insurance Coverage by Household Income in Kline
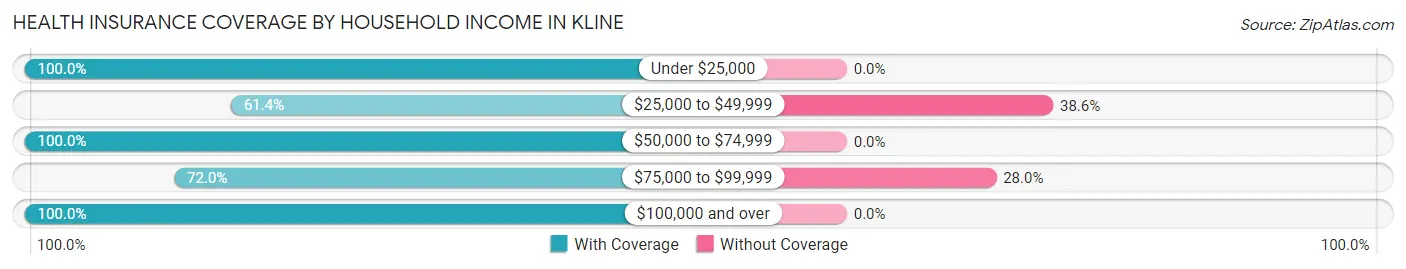
| Household Income | With Coverage | Without Coverage |
| Under $25,000 | 8 (100.0%) | 0 (0.0%) |
| $25,000 to $49,999 | 27 (61.4%) | 17 (38.6%) |
| $50,000 to $74,999 | 86 (100.0%) | 0 (0.0%) |
| $75,000 to $99,999 | 18 (72.0%) | 7 (28.0%) |
| $100,000 and over | 32 (100.0%) | 0 (0.0%) |
Public vs Private Health Insurance Coverage by Age in Kline
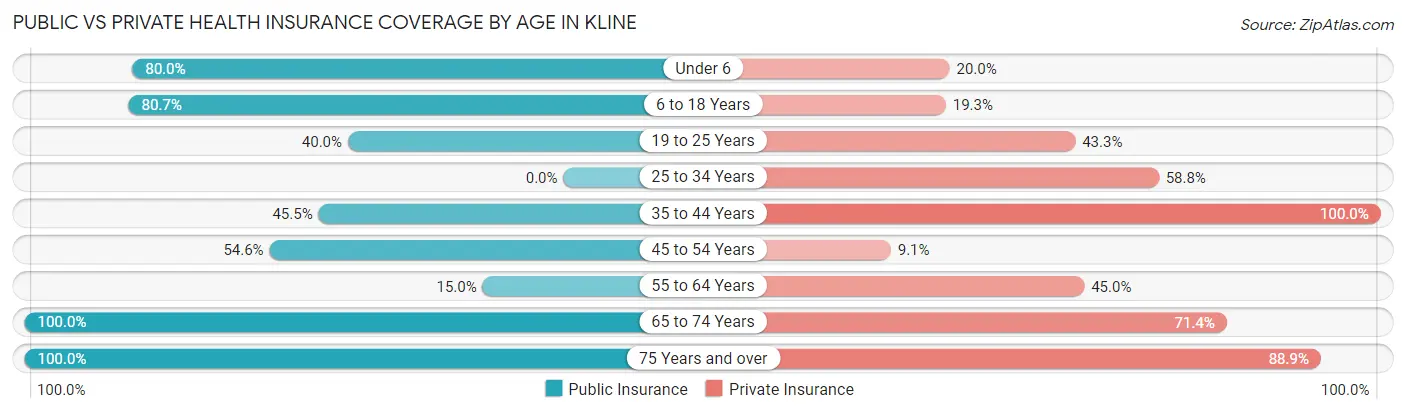
| Age Bracket | Public Insurance | Private Insurance |
| Under 6 | 12 (80.0%) | 3 (20.0%) |
| 6 to 18 Years | 46 (80.7%) | 11 (19.3%) |
| 19 to 25 Years | 12 (40.0%) | 13 (43.3%) |
| 25 to 34 Years | 0 (0.0%) | 10 (58.8%) |
| 35 to 44 Years | 10 (45.5%) | 22 (100.0%) |
| 45 to 54 Years | 6 (54.5%) | 1 (9.1%) |
| 55 to 64 Years | 3 (15.0%) | 9 (45.0%) |
| 65 to 74 Years | 14 (100.0%) | 10 (71.4%) |
| 75 Years and over | 9 (100.0%) | 8 (88.9%) |
| Total | 112 (57.4%) | 87 (44.6%) |
Disability Status by Sex by Age in Kline
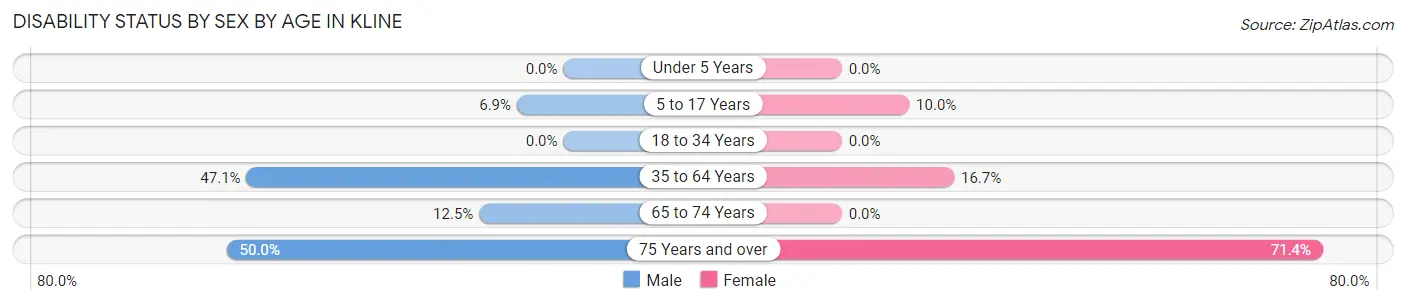
| Age Bracket | Male | Female |
| Under 5 Years | 0 (0.0%) | 0 (0.0%) |
| 5 to 17 Years | 2 (6.9%) | 4 (10.0%) |
| 18 to 34 Years | 0 (0.0%) | 0 (0.0%) |
| 35 to 64 Years | 8 (47.1%) | 6 (16.7%) |
| 65 to 74 Years | 1 (12.5%) | 0 (0.0%) |
| 75 Years and over | 1 (50.0%) | 5 (71.4%) |
Disability Class by Sex by Age in Kline
Disability Class: Hearing Difficulty
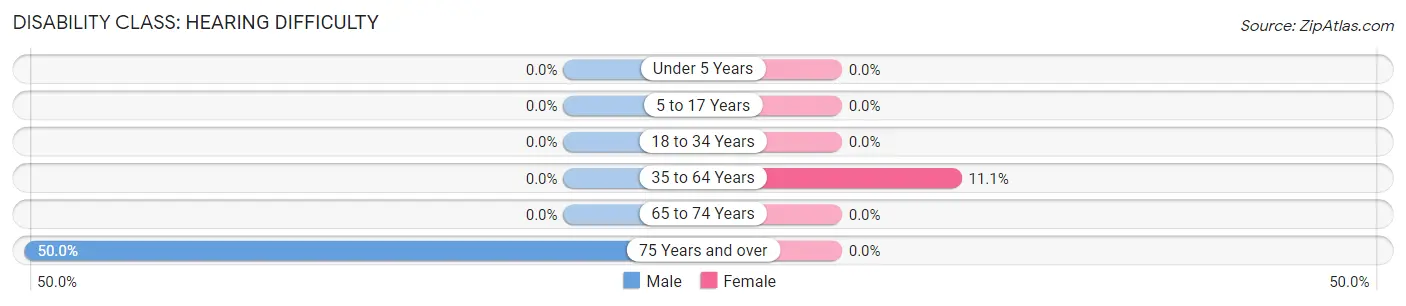
| Age Bracket | Male | Female |
| Under 5 Years | 0 (0.0%) | 0 (0.0%) |
| 5 to 17 Years | 0 (0.0%) | 0 (0.0%) |
| 18 to 34 Years | 0 (0.0%) | 0 (0.0%) |
| 35 to 64 Years | 0 (0.0%) | 4 (11.1%) |
| 65 to 74 Years | 0 (0.0%) | 0 (0.0%) |
| 75 Years and over | 1 (50.0%) | 0 (0.0%) |
Disability Class: Vision Difficulty
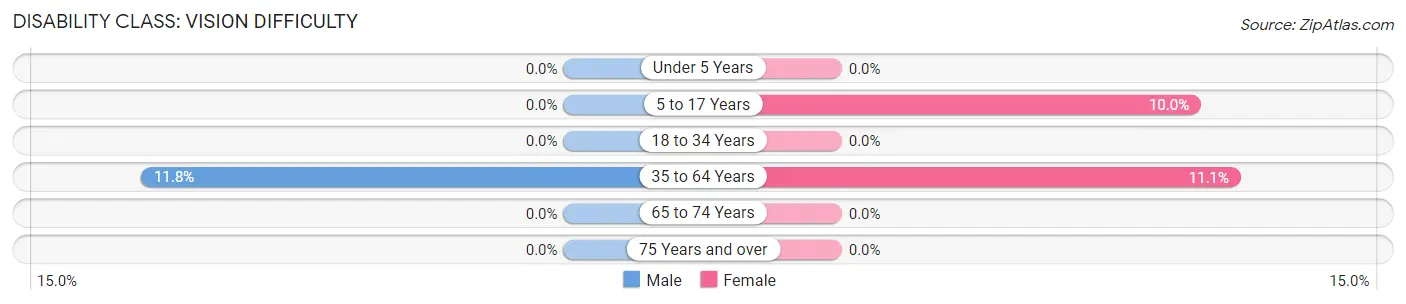
| Age Bracket | Male | Female |
| Under 5 Years | 0 (0.0%) | 0 (0.0%) |
| 5 to 17 Years | 0 (0.0%) | 4 (10.0%) |
| 18 to 34 Years | 0 (0.0%) | 0 (0.0%) |
| 35 to 64 Years | 2 (11.8%) | 4 (11.1%) |
| 65 to 74 Years | 0 (0.0%) | 0 (0.0%) |
| 75 Years and over | 0 (0.0%) | 0 (0.0%) |
Disability Class: Cognitive Difficulty
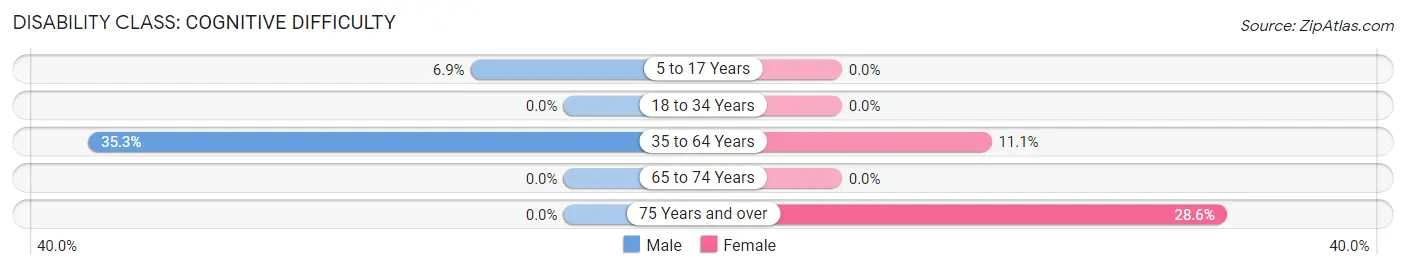
| Age Bracket | Male | Female |
| 5 to 17 Years | 2 (6.9%) | 0 (0.0%) |
| 18 to 34 Years | 0 (0.0%) | 0 (0.0%) |
| 35 to 64 Years | 6 (35.3%) | 4 (11.1%) |
| 65 to 74 Years | 0 (0.0%) | 0 (0.0%) |
| 75 Years and over | 0 (0.0%) | 2 (28.6%) |
Disability Class: Ambulatory Difficulty
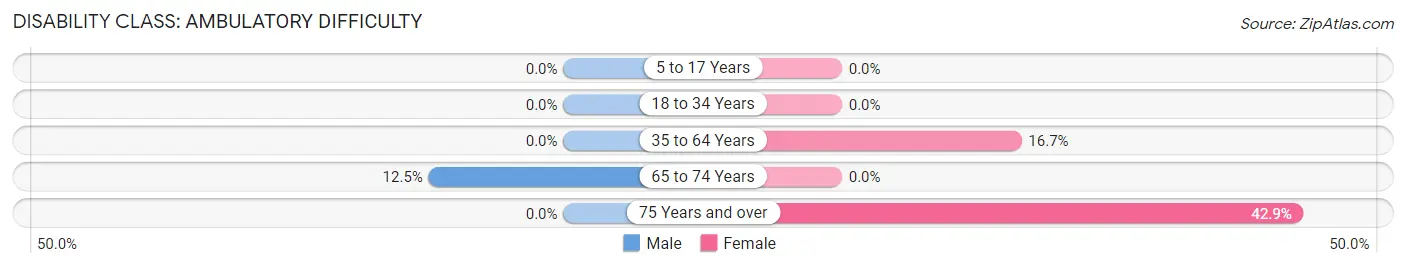
| Age Bracket | Male | Female |
| 5 to 17 Years | 0 (0.0%) | 0 (0.0%) |
| 18 to 34 Years | 0 (0.0%) | 0 (0.0%) |
| 35 to 64 Years | 0 (0.0%) | 6 (16.7%) |
| 65 to 74 Years | 1 (12.5%) | 0 (0.0%) |
| 75 Years and over | 0 (0.0%) | 3 (42.9%) |
Disability Class: Self-Care Difficulty
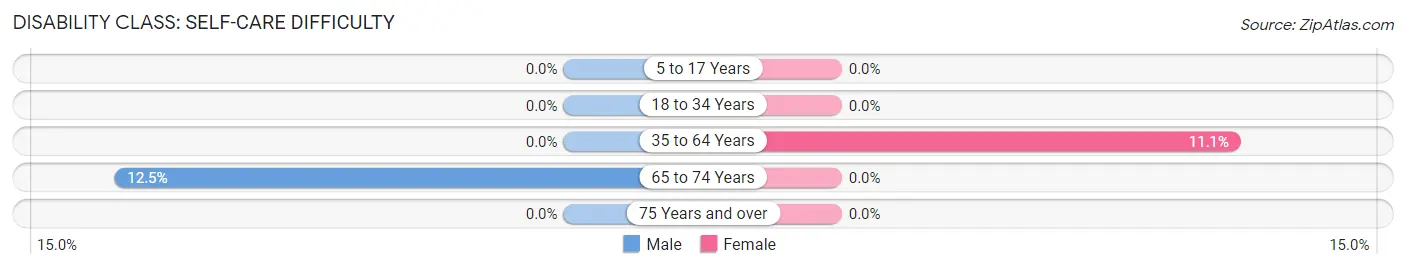
| Age Bracket | Male | Female |
| 5 to 17 Years | 0 (0.0%) | 0 (0.0%) |
| 18 to 34 Years | 0 (0.0%) | 0 (0.0%) |
| 35 to 64 Years | 0 (0.0%) | 4 (11.1%) |
| 65 to 74 Years | 1 (12.5%) | 0 (0.0%) |
| 75 Years and over | 0 (0.0%) | 0 (0.0%) |
Technology Access in Kline
Computing Device Access in Kline
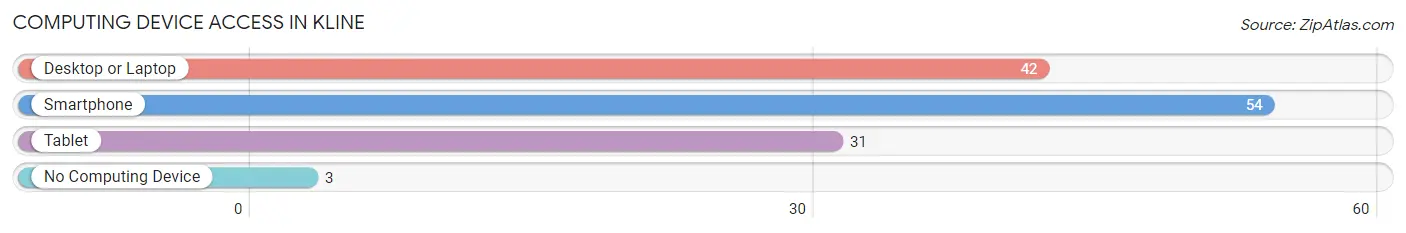
| Device Type | # Households | % Households |
| Desktop or Laptop | 42 | 68.9% |
| Smartphone | 54 | 88.5% |
| Tablet | 31 | 50.8% |
| No Computing Device | 3 | 4.9% |
| Total | 61 | 100.0% |
Internet Access in Kline
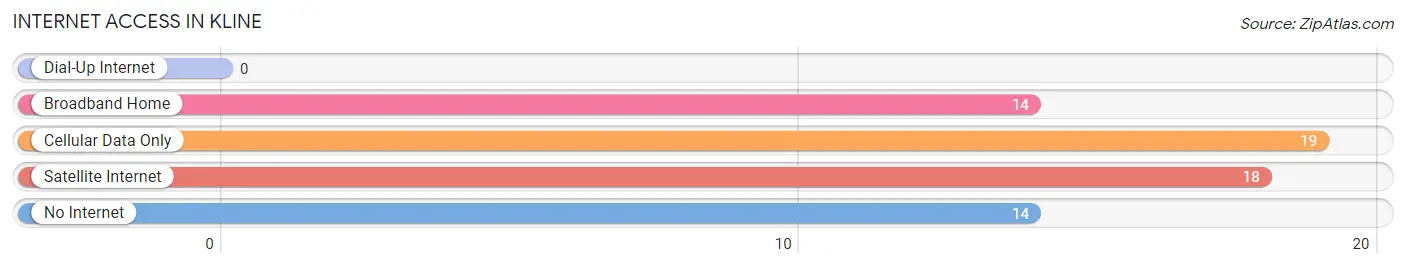
| Internet Type | # Households | % Households |
| Dial-Up Internet | 0 | 0.0% |
| Broadband Home | 14 | 23.0% |
| Cellular Data Only | 19 | 31.1% |
| Satellite Internet | 18 | 29.5% |
| No Internet | 14 | 23.0% |
| Total | 61 | 100.0% |
Kline Summary
GlaxoSmithKline (GSK) is a British multinational pharmaceutical company headquartered in Brentford, London. It is one of the world’s largest pharmaceutical companies and is the fifth-largest pharmaceutical company in the world by revenue. GSK was formed in 2000 through the merger of Glaxo Wellcome and SmithKline Beecham.
GSK has a long history in South Carolina, dating back to the early 1900s. The company first established a presence in the state in the 1920s, when it opened a manufacturing facility in Spartanburg. Since then, GSK has grown to become one of the largest employers in the state, with more than 4,000 employees across its various sites.
Geography
South Carolina is located in the southeastern United States, bordered by North Carolina to the north, Georgia to the south, and the Atlantic Ocean to the east. The state is divided into 46 counties and has an area of 32,020 square miles. The capital and largest city is Columbia, located in the center of the state.
The geography of South Carolina is diverse, ranging from the coastal plains in the east to the Appalachian Mountains in the west. The state is home to a variety of ecosystems, including wetlands, forests, and grasslands. The climate is generally mild, with hot summers and mild winters.
Economy
South Carolina’s economy is largely driven by manufacturing, with the automotive, chemical, and textile industries being the largest contributors. The state is also home to a number of military bases, which provide a significant source of employment. Tourism is also an important part of the economy, with the state’s beaches and historic sites attracting millions of visitors each year.
The state’s unemployment rate was 4.2% in 2019, slightly lower than the national average. The median household income was $50,570 in 2019, slightly lower than the national average.
Demographics
As of 2019, South Carolina had a population of 5.1 million people. The population is largely concentrated in the coastal areas, with the largest cities being Columbia, Charleston, and Greenville. The state is racially diverse, with the largest racial groups being white (68.2%), African American (27.3%), and Hispanic or Latino (3.3%).
The median age in South Carolina is 38.7 years, slightly lower than the national average. The state has a higher-than-average poverty rate, with 17.2% of the population living below the poverty line.
Conclusion
GlaxoSmithKline has a long history in South Carolina, dating back to the early 1900s. The company has grown to become one of the largest employers in the state, with more than 4,000 employees across its various sites. South Carolina’s economy is largely driven by manufacturing, with the automotive, chemical, and textile industries being the largest contributors. The state is racially diverse, with the largest racial groups being white, African American, and Hispanic or Latino. The median age in South Carolina is 38.7 years, slightly lower than the national average. The state has a higher-than-average poverty rate, with 17.2% of the population living below the poverty line.
Common Questions
What is Per Capita Income in Kline?
Per Capita income in Kline is $22,129.
What is the Median Family Income in Kline?
Median Family Income in Kline is $64,250.
What is the Median Household income in Kline?
Median Household Income in Kline is $53,750.
What is Income or Wage Gap in Kline?
Income or Wage Gap in Kline is 9.9%.
Women in Kline earn 90.1 cents for every dollar earned by a man.
What is Inequality or Gini Index in Kline?
Inequality or Gini Index in Kline is 0.31.
What is the Total Population of Kline?
Total Population of Kline is 195.
What is the Total Male Population of Kline?
Total Male Population of Kline is 98.
What is the Total Female Population of Kline?
Total Female Population of Kline is 97.
What is the Ratio of Males per 100 Females in Kline?
There are 101.03 Males per 100 Females in Kline.
What is the Ratio of Females per 100 Males in Kline?
There are 98.98 Females per 100 Males in Kline.
What is the Median Population Age in Kline?
Median Population Age in Kline is 25.1 Years.
What is the Average Family Size in Kline
Average Family Size in Kline is 4.2 People.
What is the Average Household Size in Kline
Average Household Size in Kline is 3.2 People.
How Large is the Labor Force in Kline?
There are 74 People in the Labor Forcein in Kline.
What is the Percentage of People in the Labor Force in Kline?
57.4% of People are in the Labor Force in Kline.
What is the Unemployment Rate in Kline?
Unemployment Rate in Kline is 5.4%.