Zip Codes with the Highest Percentage of Population Employed in Security & Protection in South Carolina
RELATED REPORTS & OPTIONS
Security & Protection
South Carolina
Compare Zip Codes
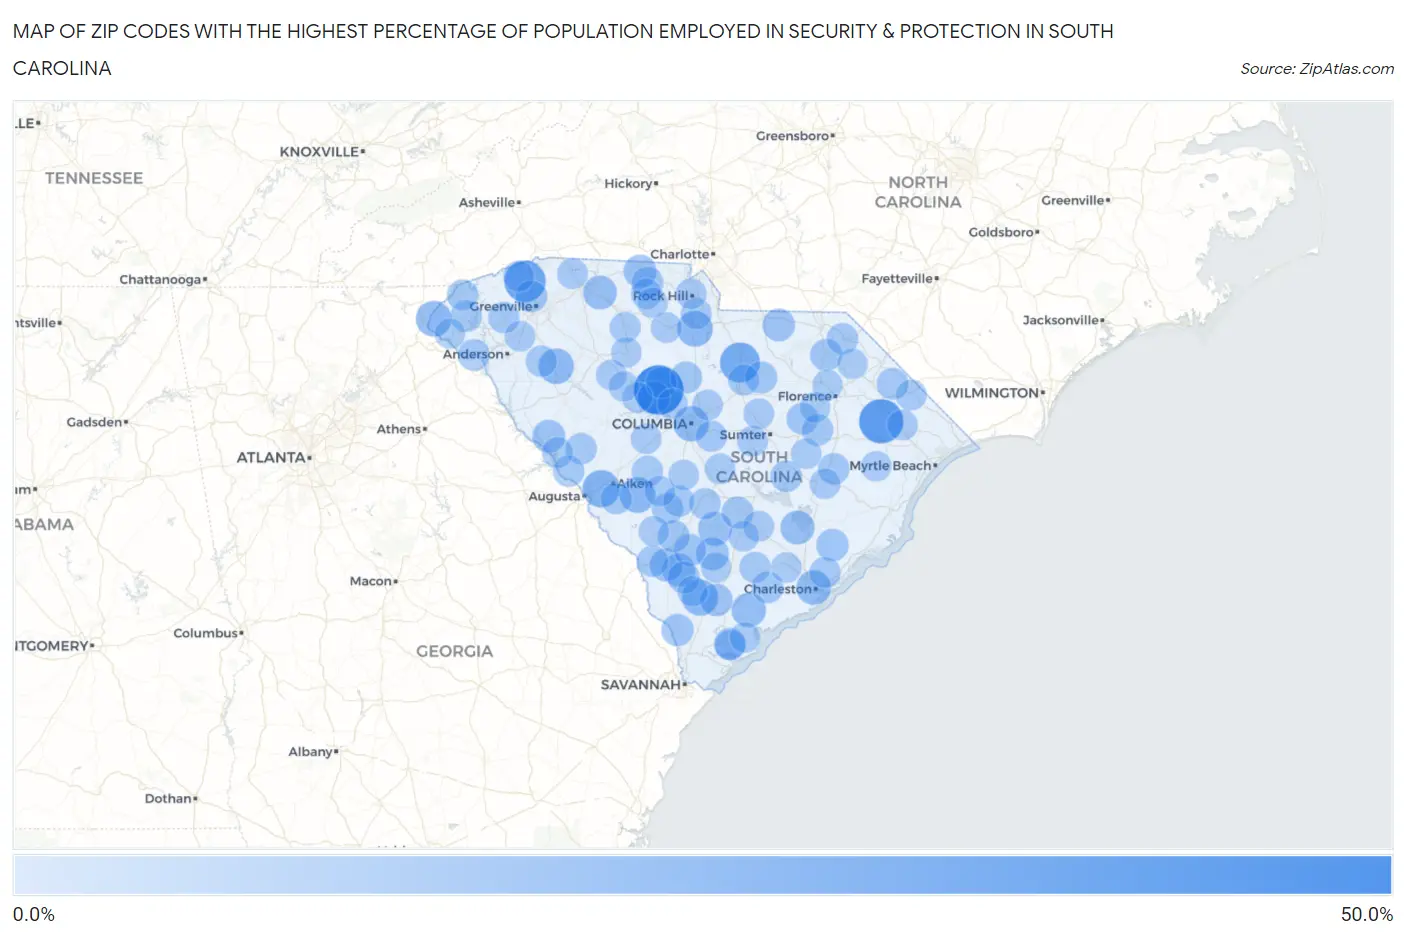
Map of Zip Codes with the Highest Percentage of Population Employed in Security & Protection in South Carolina
0.0%
50.0%
Zip Codes with the Highest Percentage of Population Employed in Security & Protection in South Carolina
| Zip Code | % Employed | vs State | vs National | |
| 1. | 29122 | 41.2% | 2.1%(+39.1)#1 | 2.1%(+39.0)#55 |
| 2. | 29519 | 30.5% | 2.1%(+28.4)#2 | 2.1%(+28.3)#95 |
| 3. | 29683 | 24.9% | 2.1%(+22.8)#3 | 2.1%(+22.7)#132 |
| 4. | 29175 | 21.9% | 2.1%(+19.8)#4 | 2.1%(+19.7)#170 |
| 5. | 29828 | 16.6% | 2.1%(+14.5)#5 | 2.1%(+14.4)#294 |
| 6. | 29916 | 14.5% | 2.1%(+12.4)#6 | 2.1%(+12.4)#389 |
| 7. | 29729 | 13.6% | 2.1%(+11.5)#7 | 2.1%(+11.4)#440 |
| 8. | 29856 | 13.4% | 2.1%(+11.3)#8 | 2.1%(+11.2)#456 |
| 9. | 29658 | 13.3% | 2.1%(+11.2)#9 | 2.1%(+11.2)#458 |
| 10. | 29692 | 13.2% | 2.1%(+11.1)#10 | 2.1%(+11.1)#466 |
| 11. | 29225 | 12.7% | 2.1%(+10.6)#11 | 2.1%(+10.5)#496 |
| 12. | 29409 | 11.2% | 2.1%(+9.06)#12 | 2.1%(+9.01)#630 |
| 13. | 29446 | 10.8% | 2.1%(+8.74)#13 | 2.1%(+8.69)#661 |
| 14. | 29469 | 10.1% | 2.1%(+7.98)#14 | 2.1%(+7.93)#758 |
| 15. | 29432 | 9.9% | 2.1%(+7.81)#15 | 2.1%(+7.76)#781 |
| 16. | 29346 | 9.8% | 2.1%(+7.72)#16 | 2.1%(+7.67)#790 |
| 17. | 29702 | 8.3% | 2.1%(+6.22)#17 | 2.1%(+6.17)#1,068 |
| 18. | 29911 | 8.1% | 2.1%(+5.99)#18 | 2.1%(+5.95)#1,131 |
| 19. | 29827 | 8.0% | 2.1%(+5.85)#19 | 2.1%(+5.80)#1,185 |
| 20. | 29493 | 7.9% | 2.1%(+5.79)#20 | 2.1%(+5.75)#1,203 |
| 21. | 29835 | 7.8% | 2.1%(+5.73)#21 | 2.1%(+5.69)#1,227 |
| 22. | 29727 | 7.5% | 2.1%(+5.42)#22 | 2.1%(+5.37)#1,324 |
| 23. | 29075 | 7.5% | 2.1%(+5.36)#23 | 2.1%(+5.31)#1,349 |
| 24. | 29945 | 7.4% | 2.1%(+5.26)#24 | 2.1%(+5.22)#1,377 |
| 25. | 29943 | 7.0% | 2.1%(+4.85)#25 | 2.1%(+4.80)#1,555 |
| 26. | 29450 | 6.9% | 2.1%(+4.83)#26 | 2.1%(+4.79)#1,562 |
| 27. | 29081 | 6.7% | 2.1%(+4.60)#27 | 2.1%(+4.55)#1,687 |
| 28. | 29843 | 6.6% | 2.1%(+4.46)#28 | 2.1%(+4.41)#1,764 |
| 29. | 29032 | 6.4% | 2.1%(+4.34)#29 | 2.1%(+4.29)#1,812 |
| 30. | 29613 | 6.3% | 2.1%(+4.20)#30 | 2.1%(+4.15)#1,900 |
| 31. | 29593 | 6.2% | 2.1%(+4.10)#31 | 2.1%(+4.06)#1,952 |
| 32. | 29924 | 6.1% | 2.1%(+4.01)#32 | 2.1%(+3.96)#2,004 |
| 33. | 29018 | 6.0% | 2.1%(+3.91)#33 | 2.1%(+3.86)#2,072 |
| 34. | 29743 | 6.0% | 2.1%(+3.89)#34 | 2.1%(+3.84)#2,087 |
| 35. | 29080 | 5.8% | 2.1%(+3.70)#35 | 2.1%(+3.65)#2,208 |
| 36. | 29180 | 5.7% | 2.1%(+3.64)#36 | 2.1%(+3.59)#2,255 |
| 37. | 29935 | 5.7% | 2.1%(+3.61)#37 | 2.1%(+3.56)#2,285 |
| 38. | 29426 | 5.6% | 2.1%(+3.54)#38 | 2.1%(+3.49)#2,337 |
| 39. | 29543 | 5.6% | 2.1%(+3.46)#39 | 2.1%(+3.41)#2,410 |
| 40. | 29114 | 5.5% | 2.1%(+3.40)#40 | 2.1%(+3.35)#2,458 |
| 41. | 29643 | 5.4% | 2.1%(+3.32)#41 | 2.1%(+3.27)#2,522 |
| 42. | 29102 | 5.4% | 2.1%(+3.28)#42 | 2.1%(+3.23)#2,558 |
| 43. | 29696 | 5.4% | 2.1%(+3.26)#43 | 2.1%(+3.21)#2,574 |
| 44. | 29512 | 5.1% | 2.1%(+3.03)#44 | 2.1%(+2.99)#2,778 |
| 45. | 29556 | 5.1% | 2.1%(+3.03)#45 | 2.1%(+2.98)#2,786 |
| 46. | 29810 | 5.0% | 2.1%(+2.95)#46 | 2.1%(+2.90)#2,871 |
| 47. | 29061 | 5.0% | 2.1%(+2.91)#47 | 2.1%(+2.86)#2,920 |
| 48. | 29817 | 4.9% | 2.1%(+2.84)#48 | 2.1%(+2.79)#2,995 |
| 49. | 29657 | 4.9% | 2.1%(+2.81)#49 | 2.1%(+2.77)#3,029 |
| 50. | 29065 | 4.9% | 2.1%(+2.81)#50 | 2.1%(+2.76)#3,031 |
| 51. | 29435 | 4.9% | 2.1%(+2.79)#51 | 2.1%(+2.74)#3,060 |
| 52. | 29824 | 4.9% | 2.1%(+2.79)#52 | 2.1%(+2.74)#3,065 |
| 53. | 29654 | 4.8% | 2.1%(+2.71)#53 | 2.1%(+2.66)#3,175 |
| 54. | 29039 | 4.8% | 2.1%(+2.67)#54 | 2.1%(+2.63)#3,202 |
| 55. | 29821 | 4.8% | 2.1%(+2.65)#55 | 2.1%(+2.60)#3,236 |
| 56. | 29492 | 4.7% | 2.1%(+2.62)#56 | 2.1%(+2.57)#3,276 |
| 57. | 29020 | 4.7% | 2.1%(+2.57)#57 | 2.1%(+2.52)#3,347 |
| 58. | 29113 | 4.6% | 2.1%(+2.52)#58 | 2.1%(+2.47)#3,406 |
| 59. | 29803 | 4.6% | 2.1%(+2.48)#59 | 2.1%(+2.44)#3,474 |
| 60. | 29164 | 4.5% | 2.1%(+2.43)#60 | 2.1%(+2.39)#3,552 |
| 61. | 29686 | 4.2% | 2.1%(+2.09)#61 | 2.1%(+2.04)#4,145 |
| 62. | 29712 | 4.1% | 2.1%(+2.03)#62 | 2.1%(+1.98)#4,246 |
| 63. | 29844 | 4.1% | 2.1%(+1.98)#63 | 2.1%(+1.93)#4,337 |
| 64. | 29581 | 4.1% | 2.1%(+1.98)#64 | 2.1%(+1.93)#4,349 |
| 65. | 29661 | 4.1% | 2.1%(+1.97)#65 | 2.1%(+1.93)#4,351 |
| 66. | 29448 | 4.0% | 2.1%(+1.94)#66 | 2.1%(+1.89)#4,411 |
| 67. | 29379 | 4.0% | 2.1%(+1.94)#67 | 2.1%(+1.89)#4,415 |
| 68. | 29544 | 3.9% | 2.1%(+1.83)#68 | 2.1%(+1.78)#4,627 |
| 69. | 29229 | 3.9% | 2.1%(+1.76)#69 | 2.1%(+1.71)#4,779 |
| 70. | 29697 | 3.8% | 2.1%(+1.74)#70 | 2.1%(+1.69)#4,822 |
| 71. | 29717 | 3.8% | 2.1%(+1.72)#71 | 2.1%(+1.68)#4,856 |
| 72. | 29349 | 3.8% | 2.1%(+1.71)#72 | 2.1%(+1.66)#4,885 |
| 73. | 29154 | 3.8% | 2.1%(+1.66)#73 | 2.1%(+1.61)#5,016 |
| 74. | 29590 | 3.7% | 2.1%(+1.60)#74 | 2.1%(+1.56)#5,129 |
| 75. | 29733 | 3.7% | 2.1%(+1.59)#75 | 2.1%(+1.55)#5,168 |
| 76. | 29706 | 3.7% | 2.1%(+1.56)#76 | 2.1%(+1.52)#5,233 |
| 77. | 29135 | 3.7% | 2.1%(+1.56)#77 | 2.1%(+1.51)#5,240 |
| 78. | 29146 | 3.6% | 2.1%(+1.49)#78 | 2.1%(+1.44)#5,413 |
| 79. | 29070 | 3.6% | 2.1%(+1.47)#79 | 2.1%(+1.42)#5,488 |
| 80. | 29040 | 3.5% | 2.1%(+1.43)#80 | 2.1%(+1.39)#5,591 |
| 81. | 29902 | 3.5% | 2.1%(+1.42)#81 | 2.1%(+1.37)#5,631 |
| 82. | 29355 | 3.5% | 2.1%(+1.39)#82 | 2.1%(+1.34)#5,693 |
| 83. | 29111 | 3.4% | 2.1%(+1.34)#83 | 2.1%(+1.29)#5,828 |
| 84. | 29477 | 3.4% | 2.1%(+1.32)#84 | 2.1%(+1.27)#5,881 |
| 85. | 29485 | 3.4% | 2.1%(+1.29)#85 | 2.1%(+1.24)#5,974 |
| 86. | 29112 | 3.4% | 2.1%(+1.28)#86 | 2.1%(+1.23)#6,007 |
| 87. | 29161 | 3.4% | 2.1%(+1.26)#87 | 2.1%(+1.21)#6,056 |
| 88. | 29063 | 3.3% | 2.1%(+1.24)#88 | 2.1%(+1.19)#6,135 |
| 89. | 29554 | 3.3% | 2.1%(+1.21)#89 | 2.1%(+1.16)#6,199 |
| 90. | 29907 | 3.3% | 2.1%(+1.21)#90 | 2.1%(+1.16)#6,217 |
| 91. | 29475 | 3.3% | 2.1%(+1.19)#91 | 2.1%(+1.15)#6,261 |
| 92. | 29127 | 3.3% | 2.1%(+1.19)#92 | 2.1%(+1.14)#6,279 |
| 93. | 29944 | 3.3% | 2.1%(+1.17)#93 | 2.1%(+1.13)#6,329 |
| 94. | 29812 | 3.3% | 2.1%(+1.17)#94 | 2.1%(+1.12)#6,339 |
| 95. | 29178 | 3.2% | 2.1%(+1.10)#95 | 2.1%(+1.05)#6,547 |
| 96. | 29516 | 3.2% | 2.1%(+1.06)#96 | 2.1%(+1.01)#6,666 |
| 97. | 29532 | 3.1% | 2.1%(+0.995)#97 | 2.1%(+0.946)#6,904 |
| 98. | 29742 | 3.1% | 2.1%(+0.974)#98 | 2.1%(+0.925)#6,977 |
| 99. | 29693 | 3.0% | 2.1%(+0.938)#99 | 2.1%(+0.890)#7,077 |
| 100. | 29108 | 3.0% | 2.1%(+0.922)#100 | 2.1%(+0.874)#7,137 |
Common Questions
What are the Top 10 Zip Codes with the Highest Percentage of Population Employed in Security & Protection in South Carolina?
Top 10 Zip Codes with the Highest Percentage of Population Employed in Security & Protection in South Carolina are:
What zip code has the Highest Percentage of Population Employed in Security & Protection in South Carolina?
29122 has the Highest Percentage of Population Employed in Security & Protection in South Carolina with 41.2%.
What is the Percentage of Population Employed in Security & Protection in the State of South Carolina?
Percentage of Population Employed in Security & Protection in South Carolina is 2.1%.
What is the Percentage of Population Employed in Security & Protection in the United States?
Percentage of Population Employed in Security & Protection in the United States is 2.1%.