East Gaffney, SC Map & Demographics
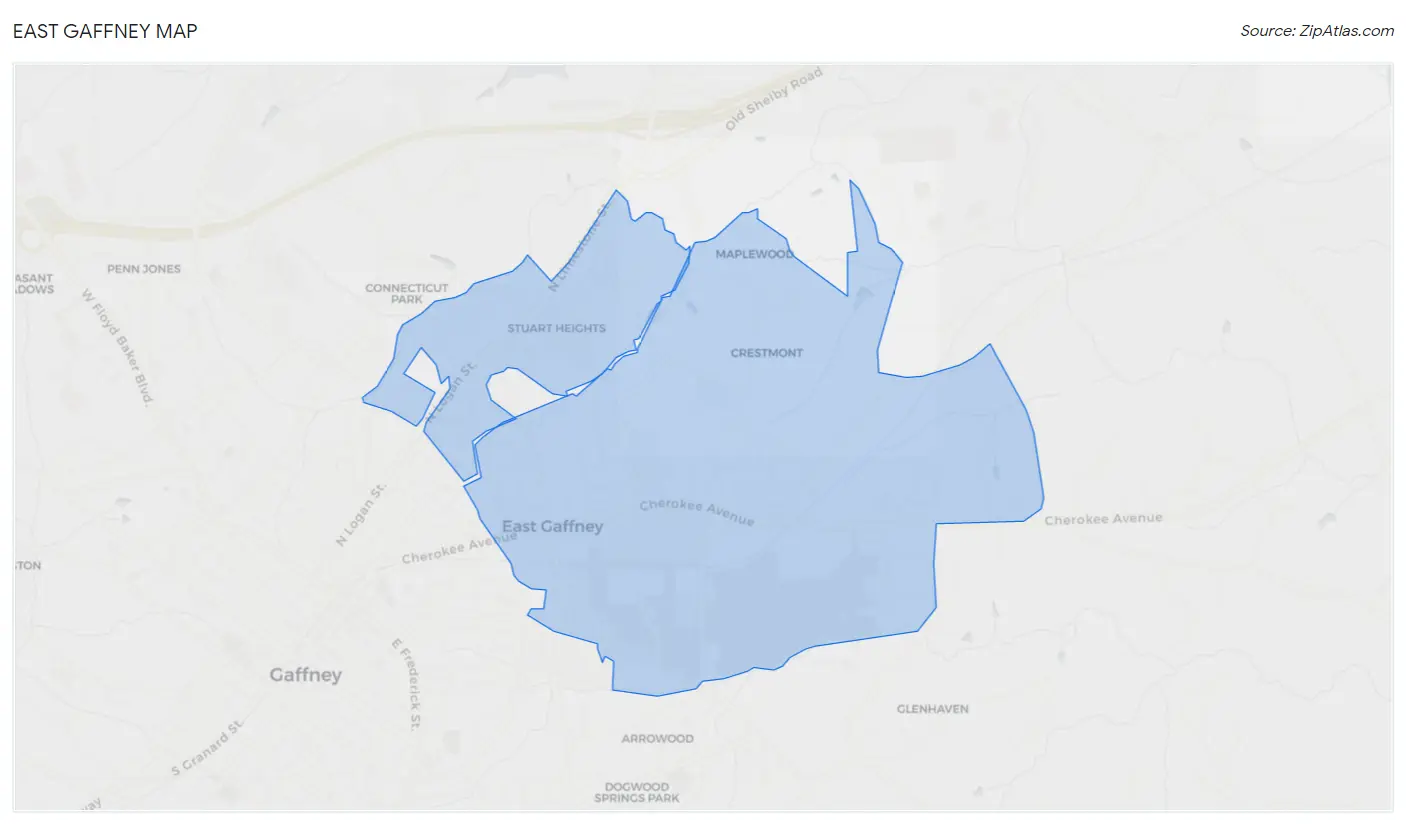
East Gaffney Map
East Gaffney Overview
$19,694
PER CAPITA INCOME
$40,000
AVG FAMILY INCOME
$30,758
AVG HOUSEHOLD INCOME
22.4%
WAGE / INCOME GAP [ % ]
77.6¢/ $1
WAGE / INCOME GAP [ $ ]
0.49
INEQUALITY / GINI INDEX
2,972
TOTAL POPULATION
1,468
MALE POPULATION
1,504
FEMALE POPULATION
97.61
MALES / 100 FEMALES
102.45
FEMALES / 100 MALES
43.8
MEDIAN AGE
3.3
AVG FAMILY SIZE
2.2
AVG HOUSEHOLD SIZE
1,167
LABOR FORCE [ PEOPLE ]
48.9%
PERCENT IN LABOR FORCE
3.6%
UNEMPLOYMENT RATE
Income in East Gaffney
Income Overview in East Gaffney
Per Capita Income in East Gaffney is $19,694, while median incomes of families and households are $40,000 and $30,758 respectively.
| Characteristic | Number | Measure |
| Per Capita Income | 2,972 | $19,694 |
| Median Family Income | 648 | $40,000 |
| Mean Family Income | 648 | $50,196 |
| Median Household Income | 1,325 | $30,758 |
| Mean Household Income | 1,325 | $39,017 |
| Income Deficit | 648 | $0 |
| Wage / Income Gap (%) | 2,972 | 22.36% |
| Wage / Income Gap ($) | 2,972 | 77.64¢ per $1 |
| Gini / Inequality Index | 2,972 | 0.49 |
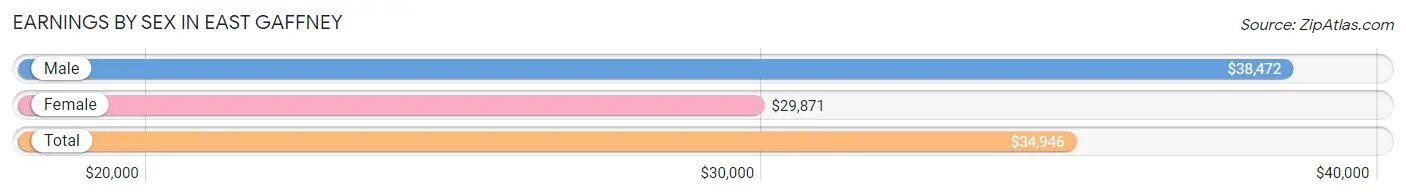
Earnings by Sex in East Gaffney
Average Earnings in East Gaffney are $34,946, $38,472 for men and $29,871 for women, a difference of 22.4%.
| Sex | Number | Average Earnings |
| Male | 585 (51.7%) | $38,472 |
| Female | 547 (48.3%) | $29,871 |
| Total | 1,132 (100.0%) | $34,946 |
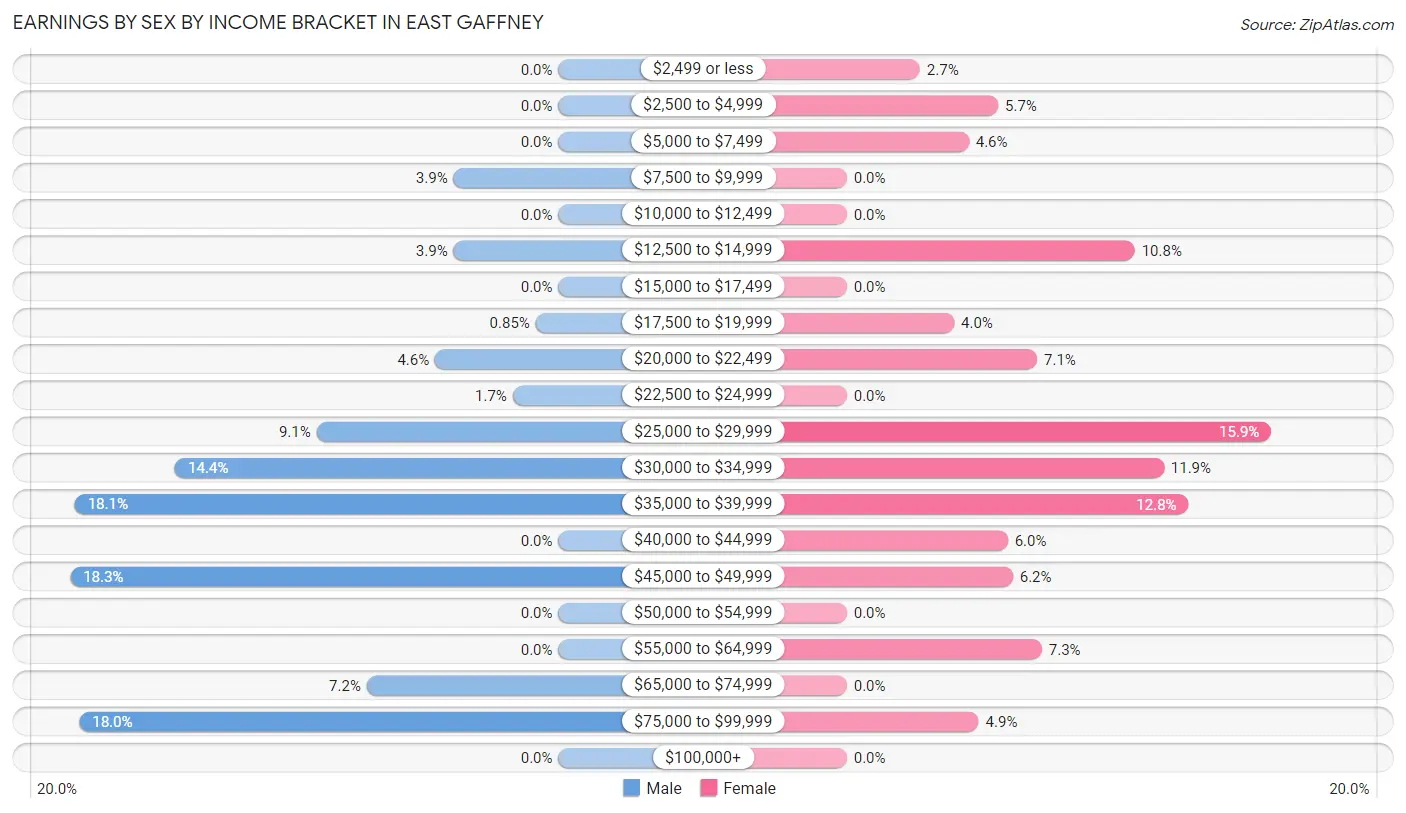
Earnings by Sex by Income Bracket in East Gaffney
The most common earnings brackets in East Gaffney are $45,000 to $49,999 for men (107 | 18.3%) and $25,000 to $29,999 for women (87 | 15.9%).
| Income | Male | Female |
| $2,499 or less | 0 (0.0%) | 15 (2.7%) |
| $2,500 to $4,999 | 0 (0.0%) | 31 (5.7%) |
| $5,000 to $7,499 | 0 (0.0%) | 25 (4.6%) |
| $7,500 to $9,999 | 23 (3.9%) | 0 (0.0%) |
| $10,000 to $12,499 | 0 (0.0%) | 0 (0.0%) |
| $12,500 to $14,999 | 23 (3.9%) | 59 (10.8%) |
| $15,000 to $17,499 | 0 (0.0%) | 0 (0.0%) |
| $17,500 to $19,999 | 5 (0.9%) | 22 (4.0%) |
| $20,000 to $22,499 | 27 (4.6%) | 39 (7.1%) |
| $22,500 to $24,999 | 10 (1.7%) | 0 (0.0%) |
| $25,000 to $29,999 | 53 (9.1%) | 87 (15.9%) |
| $30,000 to $34,999 | 84 (14.4%) | 65 (11.9%) |
| $35,000 to $39,999 | 106 (18.1%) | 70 (12.8%) |
| $40,000 to $44,999 | 0 (0.0%) | 33 (6.0%) |
| $45,000 to $49,999 | 107 (18.3%) | 34 (6.2%) |
| $50,000 to $54,999 | 0 (0.0%) | 0 (0.0%) |
| $55,000 to $64,999 | 0 (0.0%) | 40 (7.3%) |
| $65,000 to $74,999 | 42 (7.2%) | 0 (0.0%) |
| $75,000 to $99,999 | 105 (17.9%) | 27 (4.9%) |
| $100,000+ | 0 (0.0%) | 0 (0.0%) |
| Total | 585 (100.0%) | 547 (100.0%) |
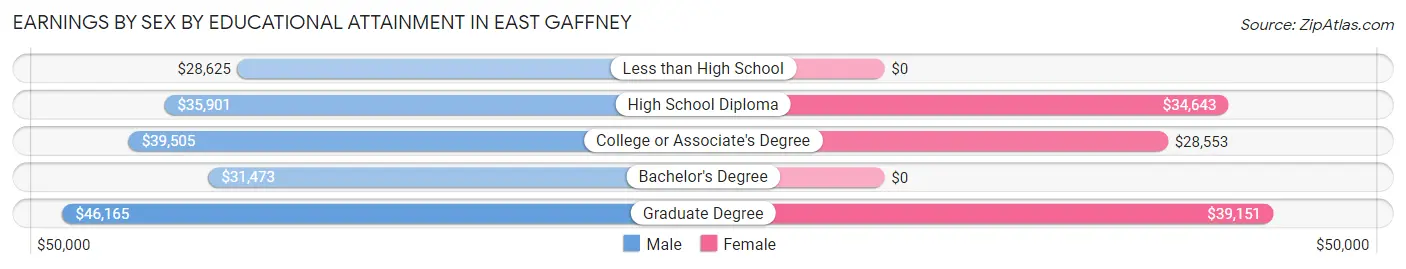
Earnings by Sex by Educational Attainment in East Gaffney
Average earnings in East Gaffney are $38,294 for men and $32,731 for women, a difference of 14.5%. Men with an educational attainment of graduate degree enjoy the highest average annual earnings of $46,165, while those with less than high school education earn the least with $28,625. Women with an educational attainment of graduate degree earn the most with the average annual earnings of $39,151, while those with college or associate's degree education have the smallest earnings of $28,553.
| Educational Attainment | Male Income | Female Income |
| Less than High School | $28,625 | $0 |
| High School Diploma | $35,901 | $34,643 |
| College or Associate's Degree | $39,505 | $28,553 |
| Bachelor's Degree | $31,473 | $0 |
| Graduate Degree | $46,165 | $39,151 |
| Total | $38,294 | $32,731 |
Family Income in East Gaffney
Family Income Brackets in East Gaffney
According to the East Gaffney family income data, there are 119 families falling into the $75,000 to $99,999 income range, which is the most common income bracket and makes up 18.4% of all families.
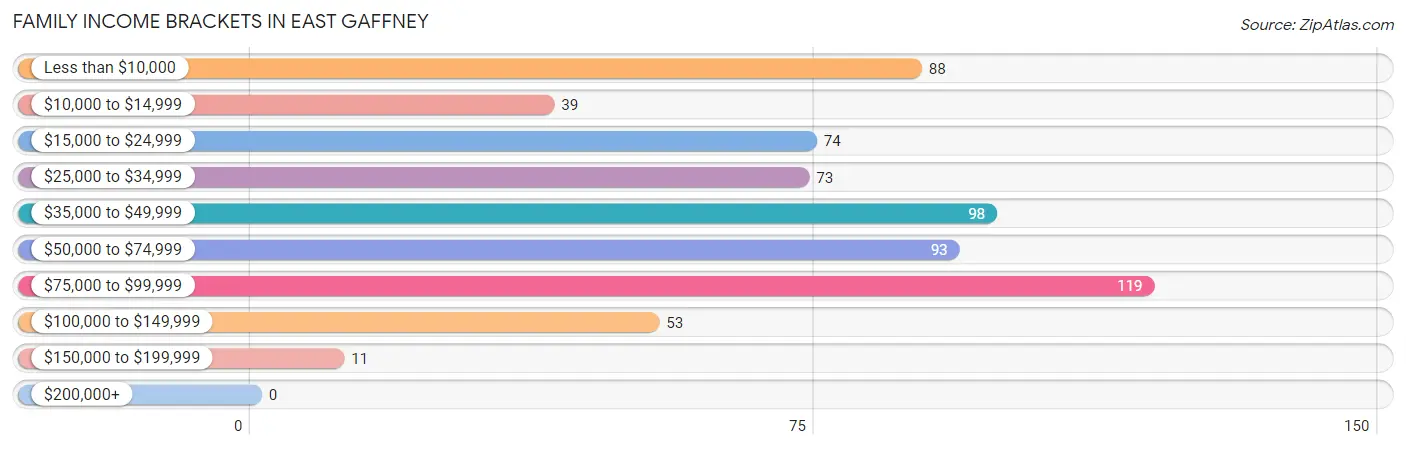
| Income Bracket | # Families | % Families |
| Less than $10,000 | 88 | 13.6% |
| $10,000 to $14,999 | 39 | 6.0% |
| $15,000 to $24,999 | 74 | 11.4% |
| $25,000 to $34,999 | 73 | 11.3% |
| $35,000 to $49,999 | 98 | 15.1% |
| $50,000 to $74,999 | 93 | 14.4% |
| $75,000 to $99,999 | 119 | 18.4% |
| $100,000 to $149,999 | 53 | 8.2% |
| $150,000 to $199,999 | 11 | 1.7% |
| $200,000+ | 0 | 0.0% |
Family Income by Famaliy Size in East Gaffney
4-person families (124 | 19.1%) account for the highest median family income in East Gaffney with $52,500 per family, while 2-person families (368 | 56.8%) have the highest median income of $19,375 per family member.
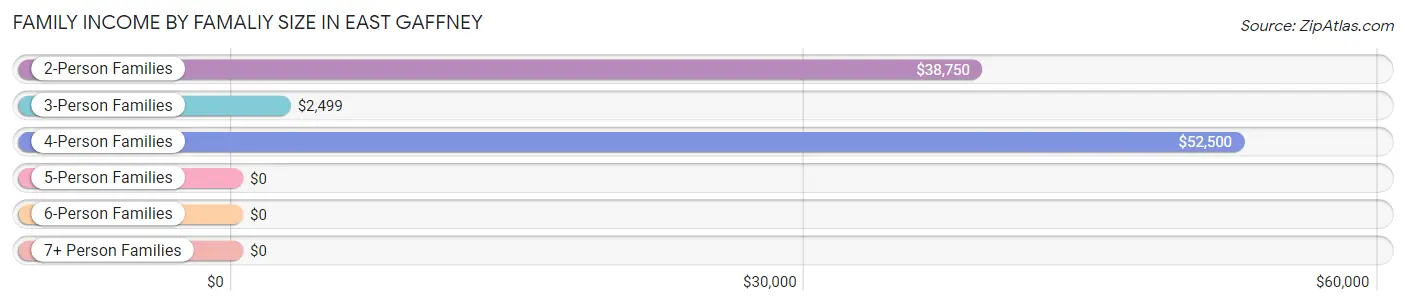
| Income Bracket | # Families | Median Income |
| 2-Person Families | 368 (56.8%) | $38,750 |
| 3-Person Families | 90 (13.9%) | $2,499 |
| 4-Person Families | 124 (19.1%) | $52,500 |
| 5-Person Families | 53 (8.2%) | $0 |
| 6-Person Families | 13 (2.0%) | $0 |
| 7+ Person Families | 0 (0.0%) | $0 |
| Total | 648 (100.0%) | $40,000 |
Family Income by Number of Earners in East Gaffney
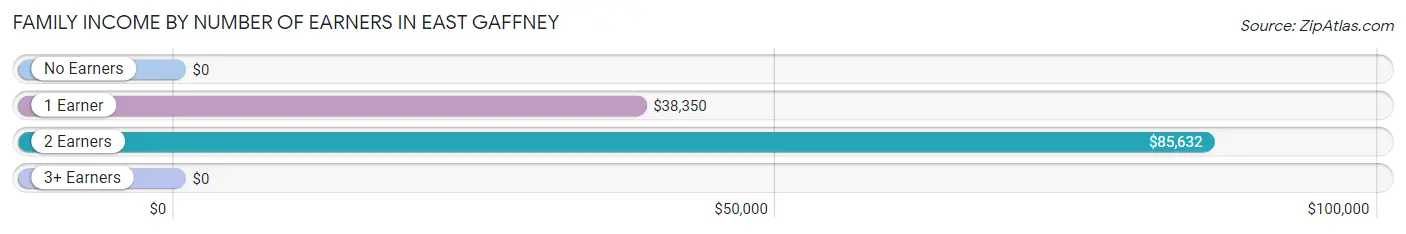
| Number of Earners | # Families | Median Income |
| No Earners | 186 (28.7%) | $0 |
| 1 Earner | 198 (30.6%) | $38,350 |
| 2 Earners | 264 (40.7%) | $85,632 |
| 3+ Earners | 0 (0.0%) | $0 |
| Total | 648 (100.0%) | $40,000 |
Household Income in East Gaffney
Household Income Brackets in East Gaffney
With 280 households falling in the category, the $10,000 to $14,999 income range is the most frequent in East Gaffney, accounting for 21.1% of all households.
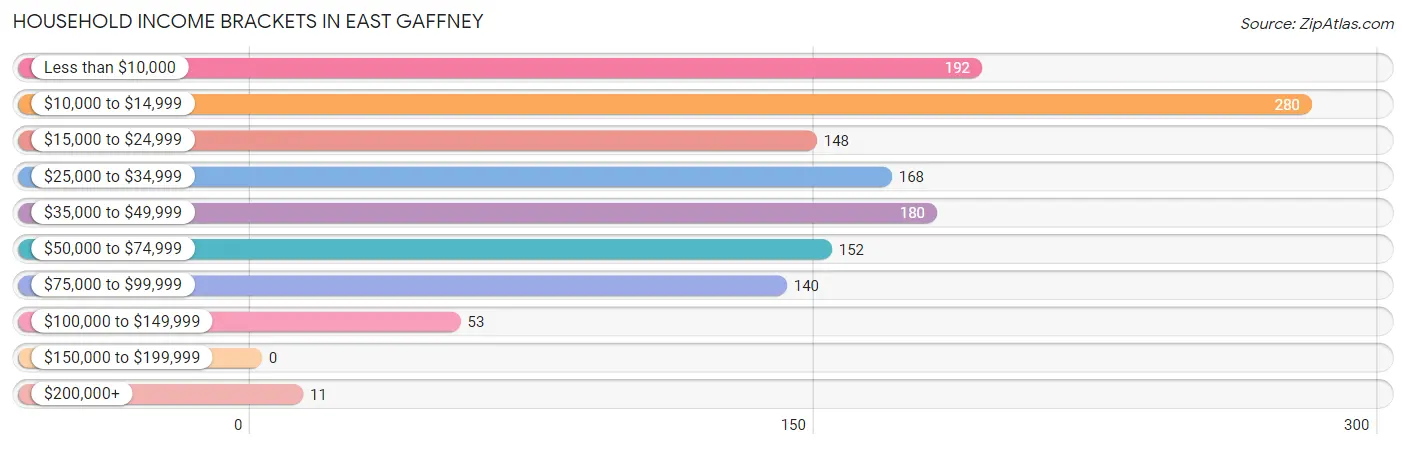
| Income Bracket | # Households | % Households |
| Less than $10,000 | 192 | 14.5% |
| $10,000 to $14,999 | 280 | 21.1% |
| $15,000 to $24,999 | 148 | 11.2% |
| $25,000 to $34,999 | 168 | 12.7% |
| $35,000 to $49,999 | 180 | 13.6% |
| $50,000 to $74,999 | 152 | 11.5% |
| $75,000 to $99,999 | 140 | 10.6% |
| $100,000 to $149,999 | 53 | 4.0% |
| $150,000 to $199,999 | 0 | 0.0% |
| $200,000+ | 11 | 0.8% |
Household Income by Householder Age in East Gaffney
The median household income in East Gaffney is $30,758, with the highest median household income of $48,550 found in the 25 to 44 years age bracket for the primary householder. A total of 373 households (28.1%) fall into this category. Meanwhile, the 15 to 24 years age bracket for the primary householder has the lowest median household income of $0, with 14 households (1.1%) in this group.
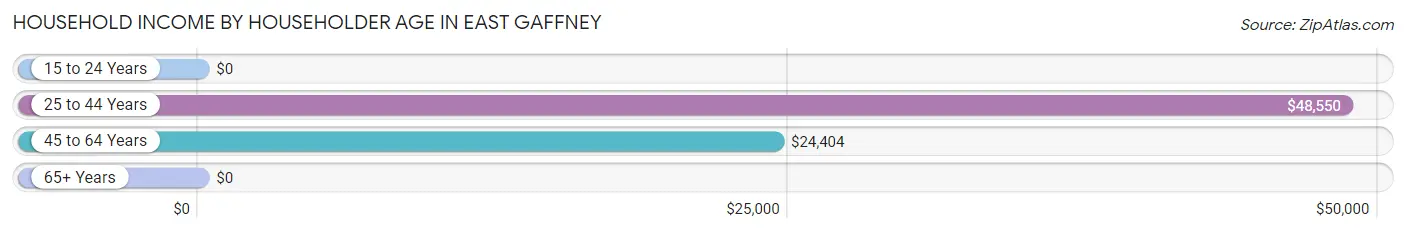
| Income Bracket | # Households | Median Income |
| 15 to 24 Years | 14 (1.1%) | $0 |
| 25 to 44 Years | 373 (28.1%) | $48,550 |
| 45 to 64 Years | 485 (36.6%) | $24,404 |
| 65+ Years | 453 (34.2%) | $0 |
| Total | 1,325 (100.0%) | $30,758 |
Poverty in East Gaffney
Income Below Poverty by Sex and Age in East Gaffney
With 16.5% poverty level for males and 36.0% for females among the residents of East Gaffney, 55 to 64 year old males and under 5 year old females are the most vulnerable to poverty, with 114 males (57.3%) and 25 females (100.0%) in their respective age groups living below the poverty level.
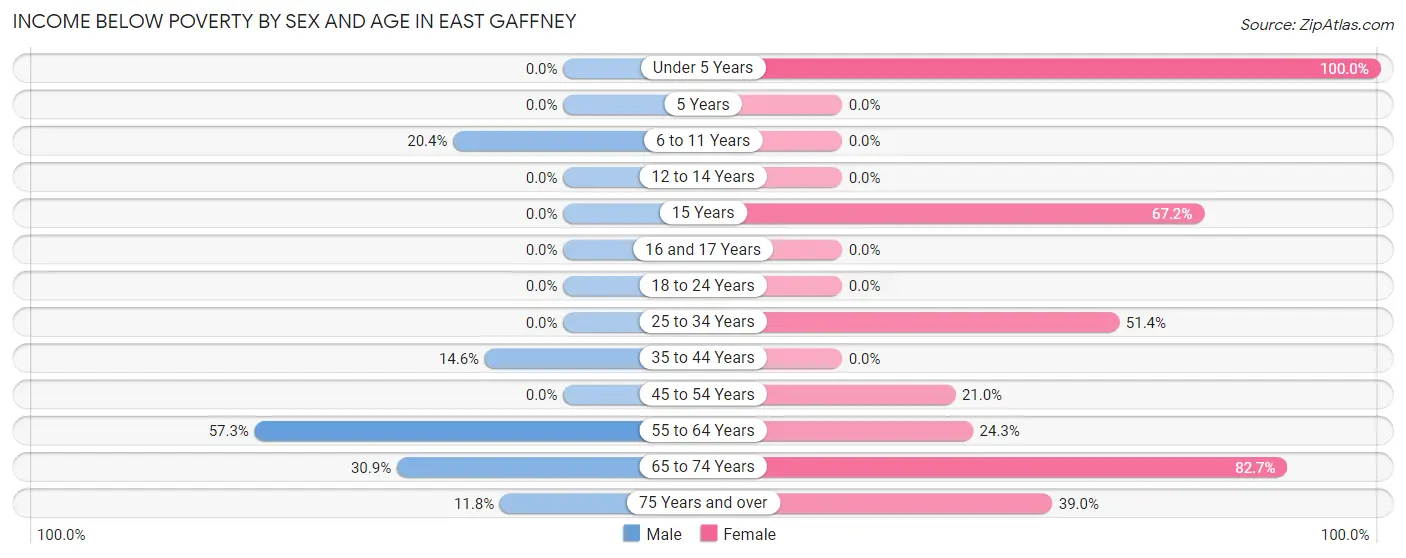
| Age Bracket | Male | Female |
| Under 5 Years | 0 (0.0%) | 25 (100.0%) |
| 5 Years | 0 (0.0%) | 0 (0.0%) |
| 6 to 11 Years | 38 (20.4%) | 0 (0.0%) |
| 12 to 14 Years | 0 (0.0%) | 0 (0.0%) |
| 15 Years | 0 (0.0%) | 39 (67.2%) |
| 16 and 17 Years | 0 (0.0%) | 0 (0.0%) |
| 18 to 24 Years | 0 (0.0%) | 0 (0.0%) |
| 25 to 34 Years | 0 (0.0%) | 108 (51.4%) |
| 35 to 44 Years | 32 (14.5%) | 0 (0.0%) |
| 45 to 54 Years | 0 (0.0%) | 46 (21.0%) |
| 55 to 64 Years | 114 (57.3%) | 42 (24.3%) |
| 65 to 74 Years | 42 (30.9%) | 258 (82.7%) |
| 75 Years and over | 14 (11.8%) | 23 (39.0%) |
| Total | 240 (16.5%) | 541 (36.0%) |
Income Above Poverty by Sex and Age in East Gaffney
According to the poverty statistics in East Gaffney, males aged under 5 years and females aged 5 years are the age groups that are most secure financially, with 100.0% of males and 100.0% of females in these age groups living above the poverty line.
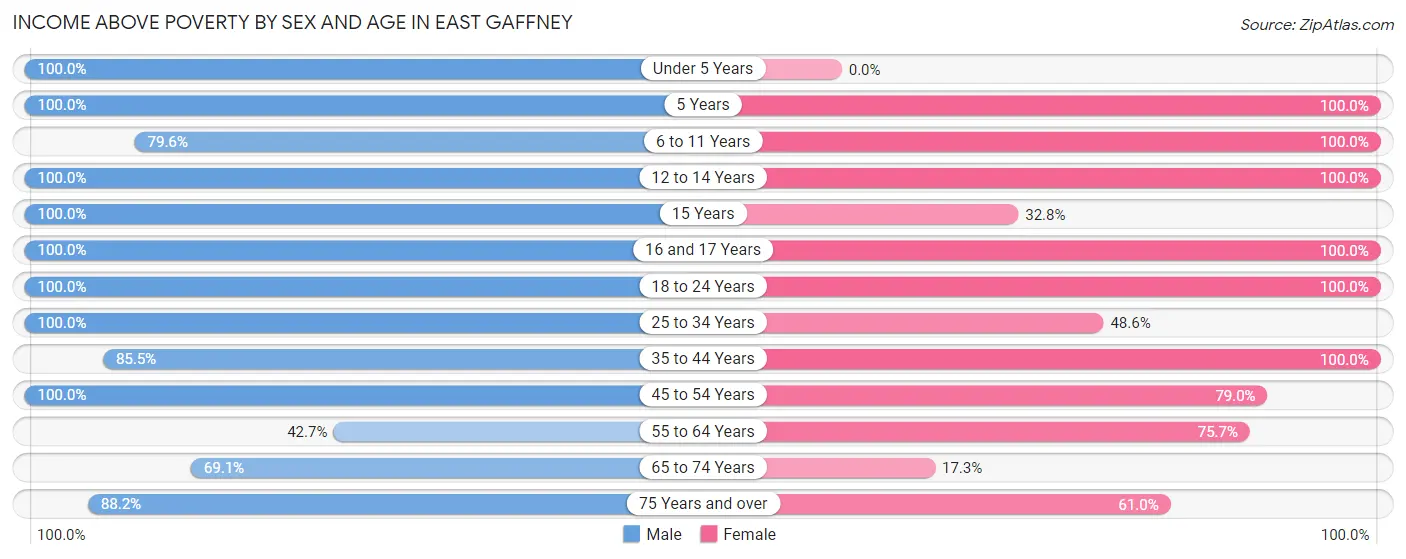
| Age Bracket | Male | Female |
| Under 5 Years | 78 (100.0%) | 0 (0.0%) |
| 5 Years | 17 (100.0%) | 7 (100.0%) |
| 6 to 11 Years | 148 (79.6%) | 89 (100.0%) |
| 12 to 14 Years | 9 (100.0%) | 30 (100.0%) |
| 15 Years | 76 (100.0%) | 19 (32.8%) |
| 16 and 17 Years | 10 (100.0%) | 16 (100.0%) |
| 18 to 24 Years | 73 (100.0%) | 101 (100.0%) |
| 25 to 34 Years | 142 (100.0%) | 102 (48.6%) |
| 35 to 44 Years | 188 (85.5%) | 205 (100.0%) |
| 45 to 54 Years | 193 (100.0%) | 173 (79.0%) |
| 55 to 64 Years | 85 (42.7%) | 131 (75.7%) |
| 65 to 74 Years | 94 (69.1%) | 54 (17.3%) |
| 75 Years and over | 105 (88.2%) | 36 (61.0%) |
| Total | 1,218 (83.5%) | 963 (64.0%) |
Income Below Poverty Among Married-Couple Families in East Gaffney
The poverty statistics for married-couple families in East Gaffney show that 15.6% or 69 of the total 443 families live below the poverty line. Families with no children have the highest poverty rate of 21.8%, comprising of 69 families. On the other hand, families with 1 or 2 children have the lowest poverty rate of 0.0%, which includes 0 families.
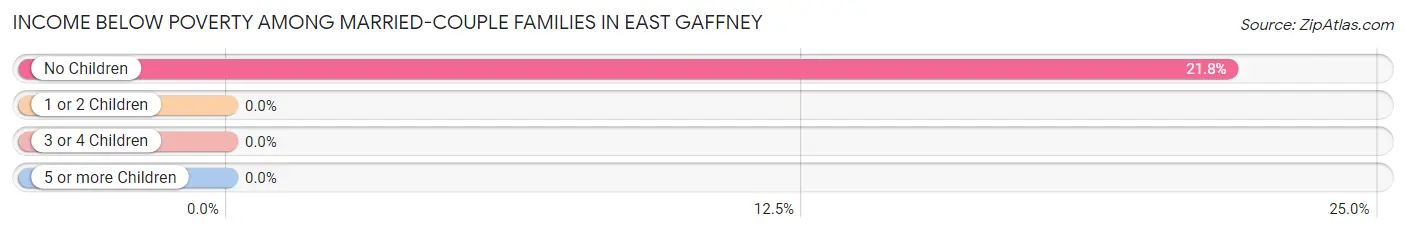
| Children | Above Poverty | Below Poverty |
| No Children | 248 (78.2%) | 69 (21.8%) |
| 1 or 2 Children | 60 (100.0%) | 0 (0.0%) |
| 3 or 4 Children | 66 (100.0%) | 0 (0.0%) |
| 5 or more Children | 0 (0.0%) | 0 (0.0%) |
| Total | 374 (84.4%) | 69 (15.6%) |
Income Below Poverty Among Single-Parent Households in East Gaffney
According to the poverty data in East Gaffney, 44.1% or 30 single-father households and 42.3% or 58 single-mother households are living below the poverty line. Among single-father households, those with 1 or 2 children have the highest poverty rate, with 23 households (57.5%) experiencing poverty. Likewise, among single-mother households, those with 1 or 2 children have the highest poverty rate, with 58 households (100.0%) falling below the poverty line.
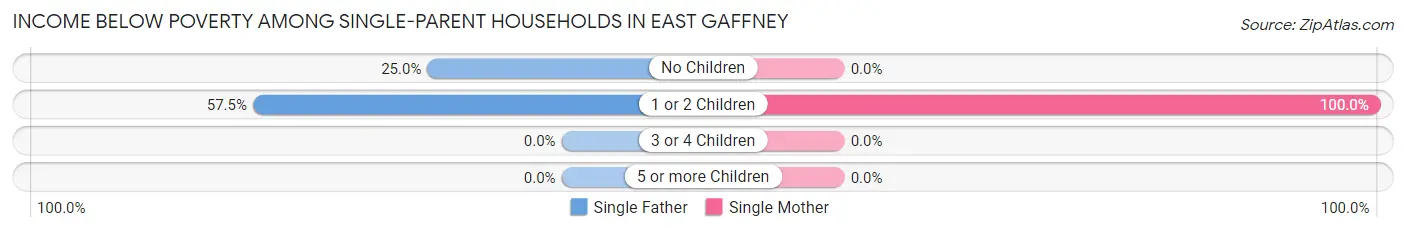
| Children | Single Father | Single Mother |
| No Children | 7 (25.0%) | 0 (0.0%) |
| 1 or 2 Children | 23 (57.5%) | 58 (100.0%) |
| 3 or 4 Children | 0 (0.0%) | 0 (0.0%) |
| 5 or more Children | 0 (0.0%) | 0 (0.0%) |
| Total | 30 (44.1%) | 58 (42.3%) |
Income Below Poverty Among Married-Couple vs Single-Parent Households in East Gaffney
The poverty data for East Gaffney shows that 69 of the married-couple family households (15.6%) and 88 of the single-parent households (42.9%) are living below the poverty level. Within the married-couple family households, those with no children have the highest poverty rate, with 69 households (21.8%) falling below the poverty line. Among the single-parent households, those with 1 or 2 children have the highest poverty rate, with 81 household (82.7%) living below poverty.
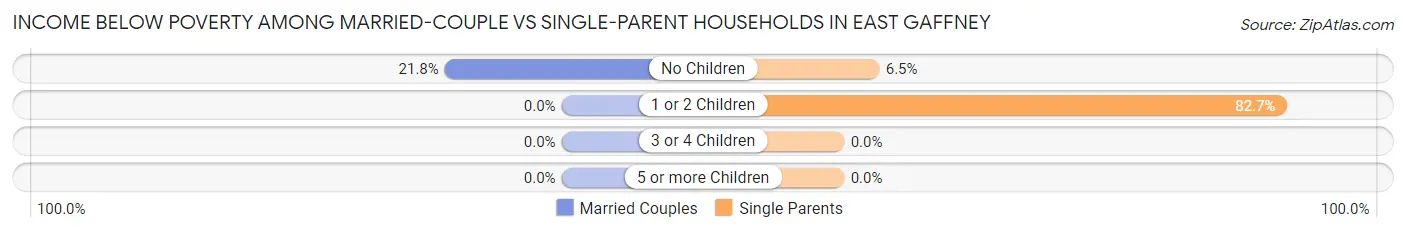
| Children | Married-Couple Families | Single-Parent Households |
| No Children | 69 (21.8%) | 7 (6.5%) |
| 1 or 2 Children | 0 (0.0%) | 81 (82.7%) |
| 3 or 4 Children | 0 (0.0%) | 0 (0.0%) |
| 5 or more Children | 0 (0.0%) | 0 (0.0%) |
| Total | 69 (15.6%) | 88 (42.9%) |
Race in East Gaffney
The most populous races in East Gaffney are White / Caucasian (1,881 | 63.3%), Black / African American (981 | 33.0%), and Two or more Races (100 | 3.4%).
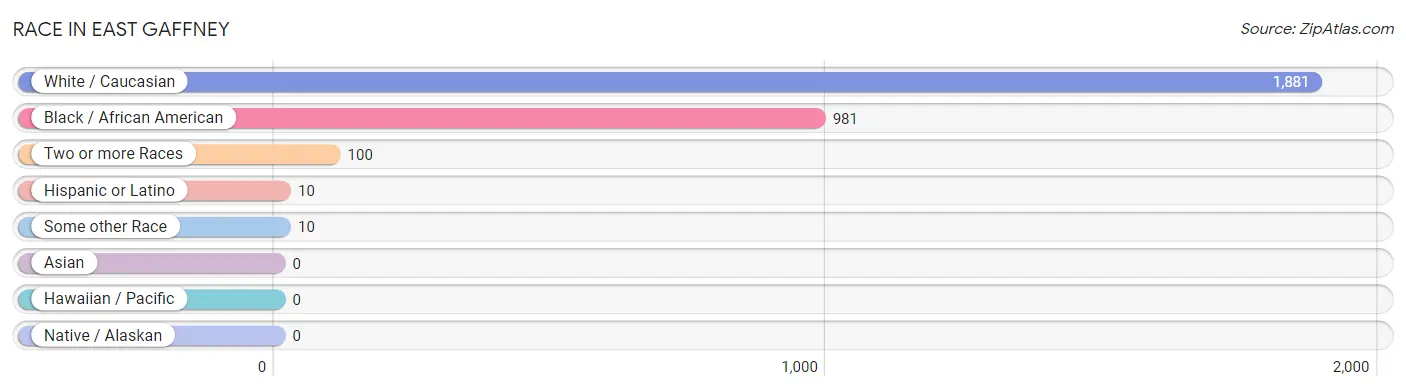
| Race | # Population | % Population |
| Asian | 0 | 0.0% |
| Black / African American | 981 | 33.0% |
| Hawaiian / Pacific | 0 | 0.0% |
| Hispanic or Latino | 10 | 0.3% |
| Native / Alaskan | 0 | 0.0% |
| White / Caucasian | 1,881 | 63.3% |
| Two or more Races | 100 | 3.4% |
| Some other Race | 10 | 0.3% |
| Total | 2,972 | 100.0% |
Ancestry in East Gaffney
The most populous ancestries reported in East Gaffney are American (397 | 13.4%), African (163 | 5.5%), Subsaharan African (163 | 5.5%), Irish (116 | 3.9%), and English (61 | 2.1%), together accounting for 30.3% of all East Gaffney residents.
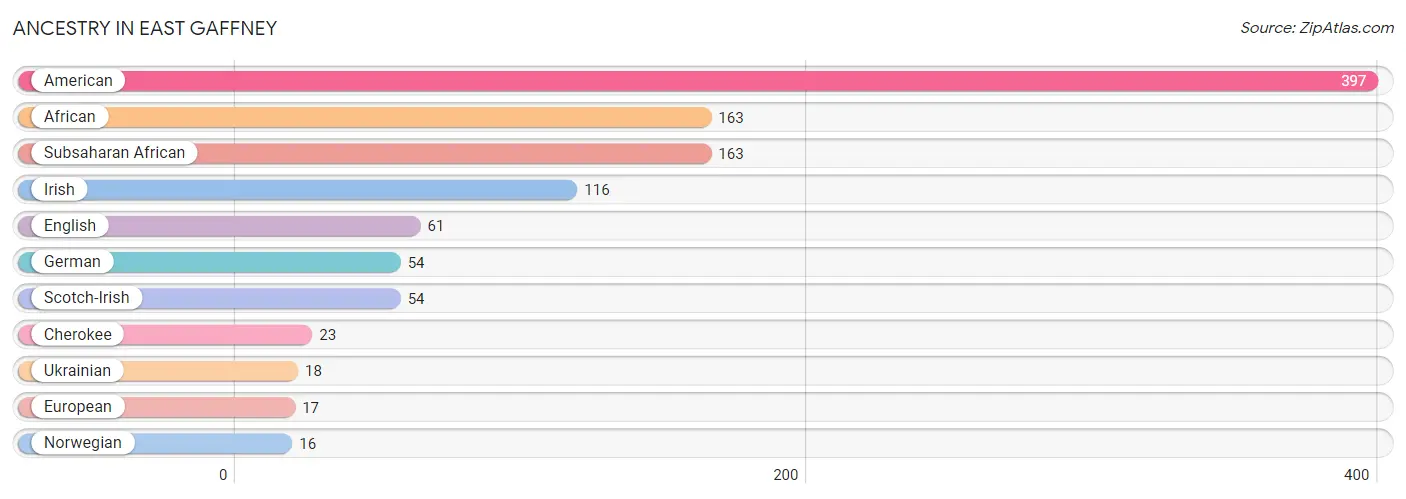
| Ancestry | # Population | % Population |
| African | 163 | 5.5% |
| American | 397 | 13.4% |
| Cherokee | 23 | 0.8% |
| English | 61 | 2.1% |
| European | 17 | 0.6% |
| German | 54 | 1.8% |
| Irish | 116 | 3.9% |
| Norwegian | 16 | 0.5% |
| Scotch-Irish | 54 | 1.8% |
| Subsaharan African | 163 | 5.5% |
| Ukrainian | 18 | 0.6% | View All 11 Rows |
Immigrants in East Gaffney

| Immigration Origin | # Population | % Population | View All 0 Rows |
Sex and Age in East Gaffney
Sex and Age in East Gaffney
The most populous age groups in East Gaffney are 60 to 64 Years (188 | 12.8%) for men and 70 to 74 Years (220 | 14.6%) for women.
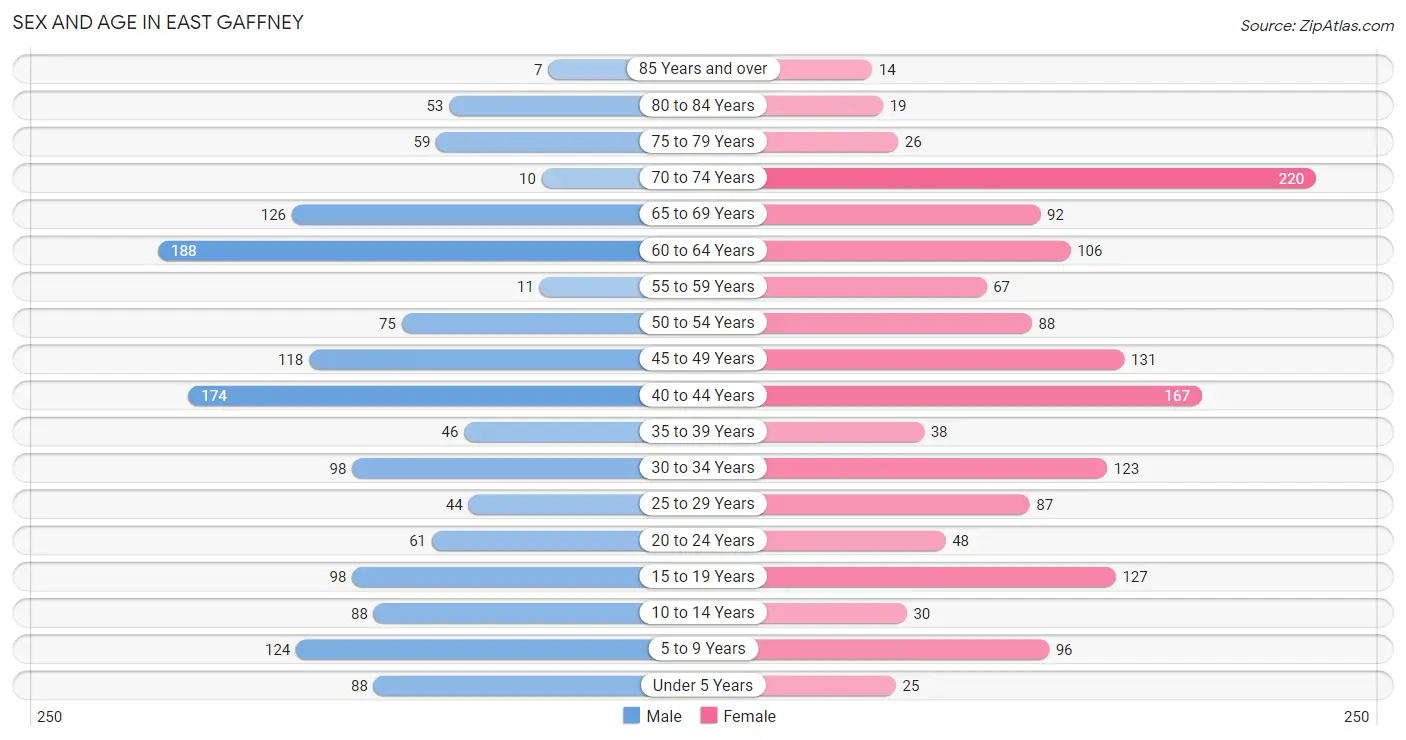
| Age Bracket | Male | Female |
| Under 5 Years | 88 (6.0%) | 25 (1.7%) |
| 5 to 9 Years | 124 (8.5%) | 96 (6.4%) |
| 10 to 14 Years | 88 (6.0%) | 30 (2.0%) |
| 15 to 19 Years | 98 (6.7%) | 127 (8.4%) |
| 20 to 24 Years | 61 (4.2%) | 48 (3.2%) |
| 25 to 29 Years | 44 (3.0%) | 87 (5.8%) |
| 30 to 34 Years | 98 (6.7%) | 123 (8.2%) |
| 35 to 39 Years | 46 (3.1%) | 38 (2.5%) |
| 40 to 44 Years | 174 (11.8%) | 167 (11.1%) |
| 45 to 49 Years | 118 (8.0%) | 131 (8.7%) |
| 50 to 54 Years | 75 (5.1%) | 88 (5.9%) |
| 55 to 59 Years | 11 (0.7%) | 67 (4.4%) |
| 60 to 64 Years | 188 (12.8%) | 106 (7.0%) |
| 65 to 69 Years | 126 (8.6%) | 92 (6.1%) |
| 70 to 74 Years | 10 (0.7%) | 220 (14.6%) |
| 75 to 79 Years | 59 (4.0%) | 26 (1.7%) |
| 80 to 84 Years | 53 (3.6%) | 19 (1.3%) |
| 85 Years and over | 7 (0.5%) | 14 (0.9%) |
| Total | 1,468 (100.0%) | 1,504 (100.0%) |
Families and Households in East Gaffney
Median Family Size in East Gaffney
The median family size in East Gaffney is 3.32 persons per family, with single male/father families (68 | 10.5%) accounting for the largest median family size of 3.49 persons per family. On the other hand, single female/mother families (137 | 21.1%) represent the smallest median family size with 2.78 persons per family.
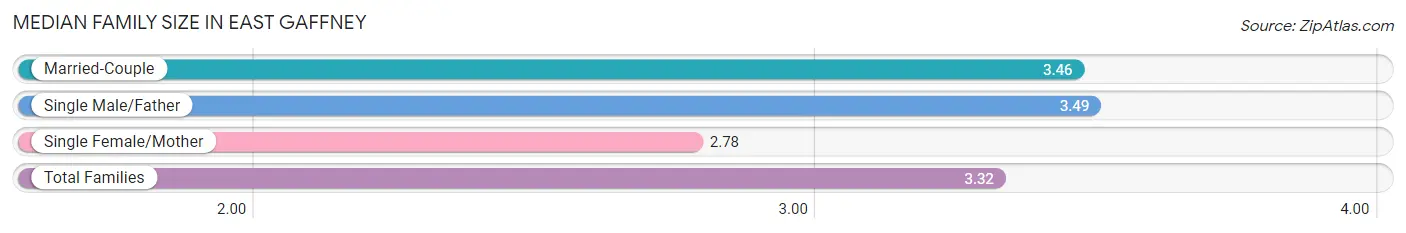
| Family Type | # Families | Family Size |
| Married-Couple | 443 (68.4%) | 3.46 |
| Single Male/Father | 68 (10.5%) | 3.49 |
| Single Female/Mother | 137 (21.1%) | 2.78 |
| Total Families | 648 (100.0%) | 3.32 |
Median Household Size in East Gaffney
The median household size in East Gaffney is 2.24 persons per household, with single male/father households (68 | 5.1%) accounting for the largest median household size of 3.75 persons per household. non-family households (677 | 51.1%) represent the smallest median household size with 1.04 persons per household.
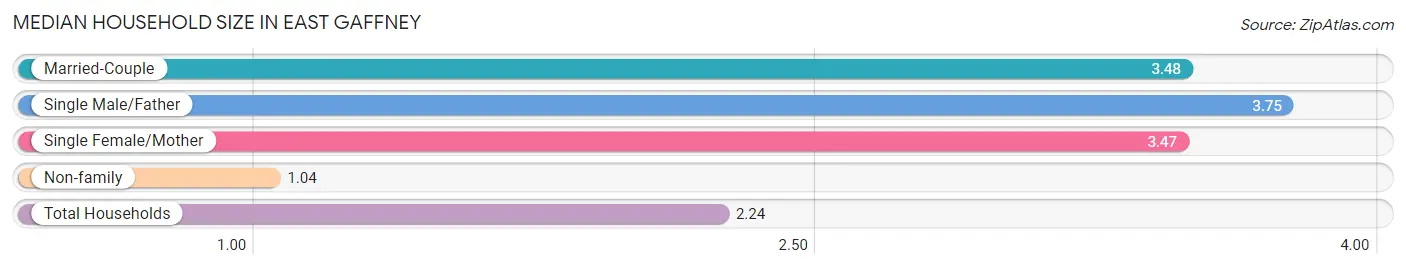
| Household Type | # Households | Household Size |
| Married-Couple | 443 (33.4%) | 3.48 |
| Single Male/Father | 68 (5.1%) | 3.75 |
| Single Female/Mother | 137 (10.3%) | 3.47 |
| Non-family | 677 (51.1%) | 1.04 |
| Total Households | 1,325 (100.0%) | 2.24 |
Household Size by Marriage Status in East Gaffney
Out of a total of 1,325 households in East Gaffney, 648 (48.9%) are family households, while 677 (51.1%) are nonfamily households. The most numerous type of family households are 2-person households, comprising 358, and the most common type of nonfamily households are 1-person households, comprising 652.
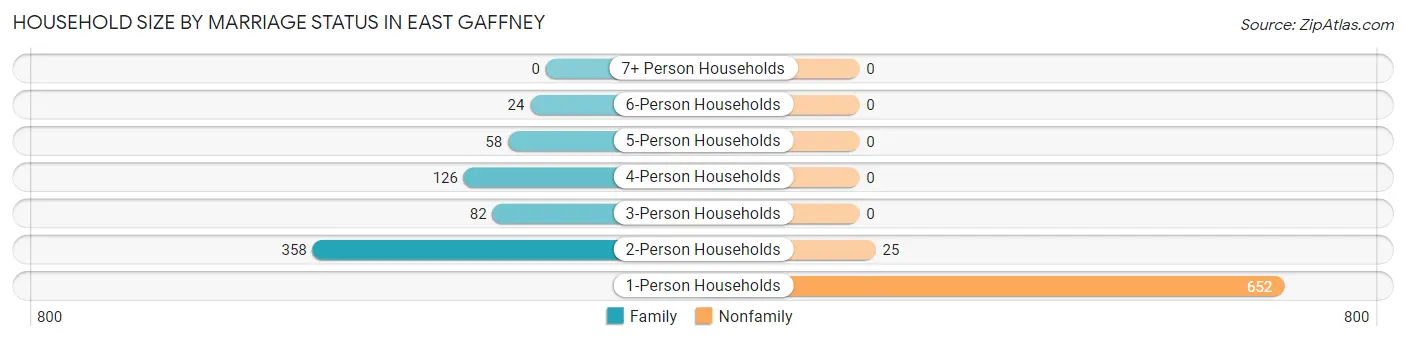
| Household Size | Family Households | Nonfamily Households |
| 1-Person Households | - | 652 (49.2%) |
| 2-Person Households | 358 (27.0%) | 25 (1.9%) |
| 3-Person Households | 82 (6.2%) | 0 (0.0%) |
| 4-Person Households | 126 (9.5%) | 0 (0.0%) |
| 5-Person Households | 58 (4.4%) | 0 (0.0%) |
| 6-Person Households | 24 (1.8%) | 0 (0.0%) |
| 7+ Person Households | 0 (0.0%) | 0 (0.0%) |
| Total | 648 (48.9%) | 677 (51.1%) |
Female Fertility in East Gaffney
Fertility by Age in East Gaffney
| Age Bracket | Women with Births | Births / 1,000 Women |
| 15 to 19 years | 0 (0.0%) | 0.0 |
| 20 to 34 years | 0 (0.0%) | 0.0 |
| 35 to 50 years | 0 (0.0%) | 0.0 |
| Total | 0 (0.0%) | 0.0 |
Fertility by Age by Marriage Status in East Gaffney
| Age Bracket | Married | Unmarried |
| 15 to 19 years | 0 (0.0%) | 0 (0.0%) |
| 20 to 34 years | 0 (0.0%) | 0 (0.0%) |
| 35 to 50 years | 0 (0.0%) | 0 (0.0%) |
| Total | 0 (0.0%) | 0 (0.0%) |
Fertility by Education in East Gaffney
| Educational Attainment | Women with Births | Births / 1,000 Women |
| Less than High School | 0 (0.0%) | 0.0 |
| High School Diploma | 0 (0.0%) | 0.0 |
| College or Associate's Degree | 0 (0.0%) | 0.0 |
| Bachelor's Degree | 0 (0.0%) | 0.0 |
| Graduate Degree | 0 (0.0%) | 0.0 |
| Total | 0 (0.0%) | 0.0 |
Fertility by Education by Marriage Status in East Gaffney
| Educational Attainment | Married | Unmarried |
| Less than High School | 0 (0.0%) | 0 (0.0%) |
| High School Diploma | 0 (0.0%) | 0 (0.0%) |
| College or Associate's Degree | 0 (0.0%) | 0 (0.0%) |
| Bachelor's Degree | 0 (0.0%) | 0 (0.0%) |
| Graduate Degree | 0 (0.0%) | 0 (0.0%) |
| Total | 0 (0.0%) | 0 (0.0%) |
Employment Characteristics in East Gaffney
Employment by Class of Employer in East Gaffney
Among the 1,120 employed individuals in East Gaffney, private company employees (770 | 68.8%), local government employees (176 | 15.7%), and state government employees (70 | 6.2%) make up the most common classes of employment.
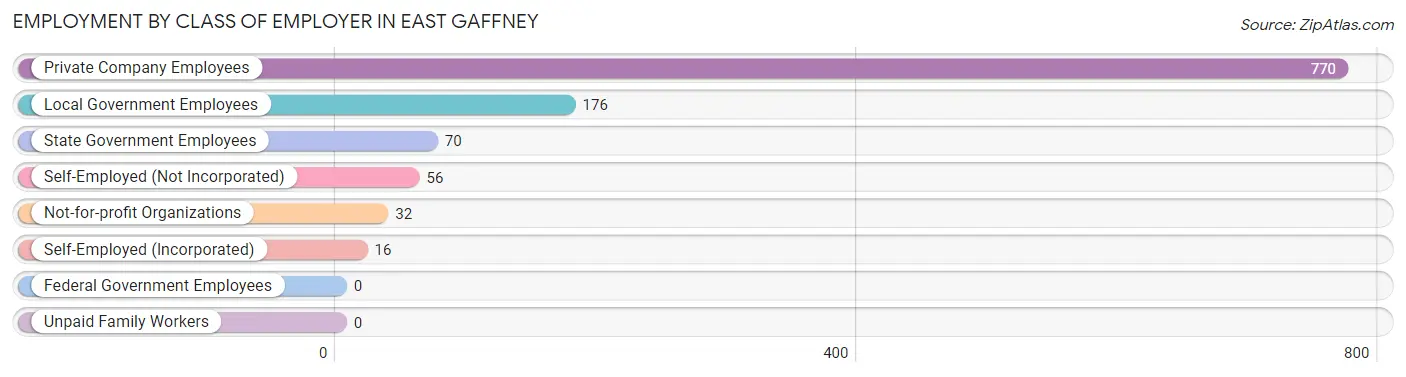
| Employer Class | # Employees | % Employees |
| Private Company Employees | 770 | 68.8% |
| Self-Employed (Incorporated) | 16 | 1.4% |
| Self-Employed (Not Incorporated) | 56 | 5.0% |
| Not-for-profit Organizations | 32 | 2.9% |
| Local Government Employees | 176 | 15.7% |
| State Government Employees | 70 | 6.2% |
| Federal Government Employees | 0 | 0.0% |
| Unpaid Family Workers | 0 | 0.0% |
| Total | 1,120 | 100.0% |
Employment Status by Age in East Gaffney
According to the labor force statistics for East Gaffney, out of the total population over 16 years of age (2,387), 48.9% or 1,167 individuals are in the labor force, with 3.6% or 42 of them unemployed. The age group with the highest labor force participation rate is 45 to 54 years, with 79.6% or 328 individuals in the labor force. Within the labor force, the 25 to 29 years age range has the highest percentage of unemployed individuals, with 9.7% or 10 of them being unemployed.
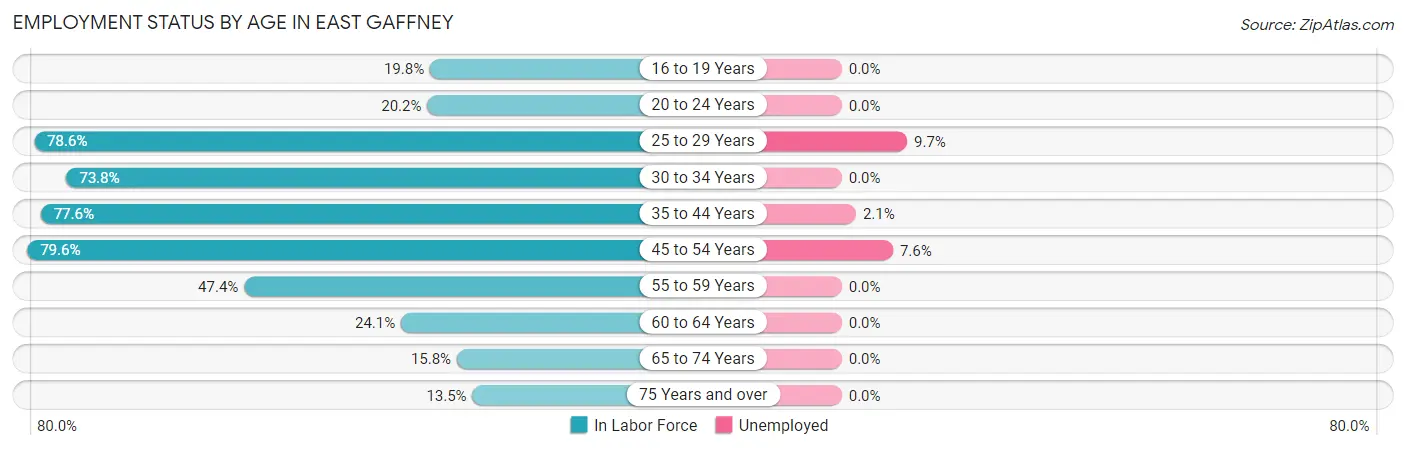
| Age Bracket | In Labor Force | Unemployed |
| 16 to 19 Years | 18 (19.8%) | 0 (0.0%) |
| 20 to 24 Years | 22 (20.2%) | 0 (0.0%) |
| 25 to 29 Years | 103 (78.6%) | 10 (9.7%) |
| 30 to 34 Years | 163 (73.8%) | 0 (0.0%) |
| 35 to 44 Years | 330 (77.6%) | 7 (2.1%) |
| 45 to 54 Years | 328 (79.6%) | 25 (7.6%) |
| 55 to 59 Years | 37 (47.4%) | 0 (0.0%) |
| 60 to 64 Years | 71 (24.1%) | 0 (0.0%) |
| 65 to 74 Years | 71 (15.8%) | 0 (0.0%) |
| 75 Years and over | 24 (13.5%) | 0 (0.0%) |
| Total | 1,167 (48.9%) | 42 (3.6%) |
Employment Status by Educational Attainment in East Gaffney
According to labor force statistics for East Gaffney, 66.1% of individuals (1,032) out of the total population between 25 and 64 years of age (1,561) are in the labor force, with 4.1% or 42 of them being unemployed. The group with the highest labor force participation rate are those with the educational attainment of bachelor's degree or higher, with 100.0% or 274 individuals in the labor force. Within the labor force, individuals with less than high school education have the highest percentage of unemployment, with 22.9% or 16 of them being unemployed.
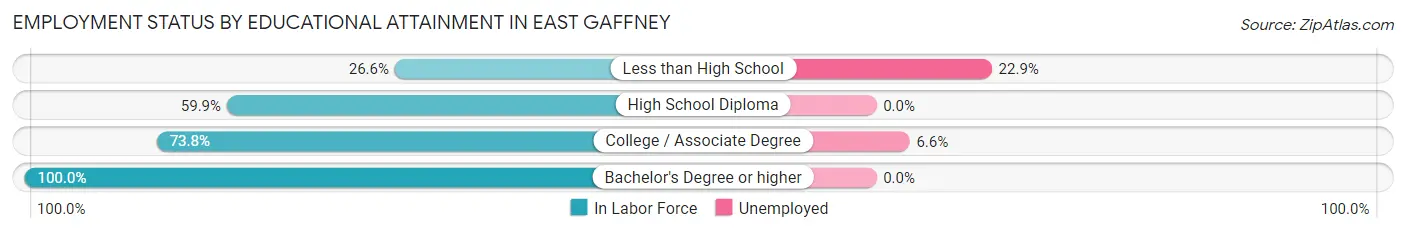
| Educational Attainment | In Labor Force | Unemployed |
| Less than High School | 70 (26.6%) | 60 (22.9%) |
| High School Diploma | 293 (59.9%) | 0 (0.0%) |
| College / Associate Degree | 395 (73.8%) | 35 (6.6%) |
| Bachelor's Degree or higher | 274 (100.0%) | 0 (0.0%) |
| Total | 1,032 (66.1%) | 64 (4.1%) |
Employment Occupations by Sex in East Gaffney
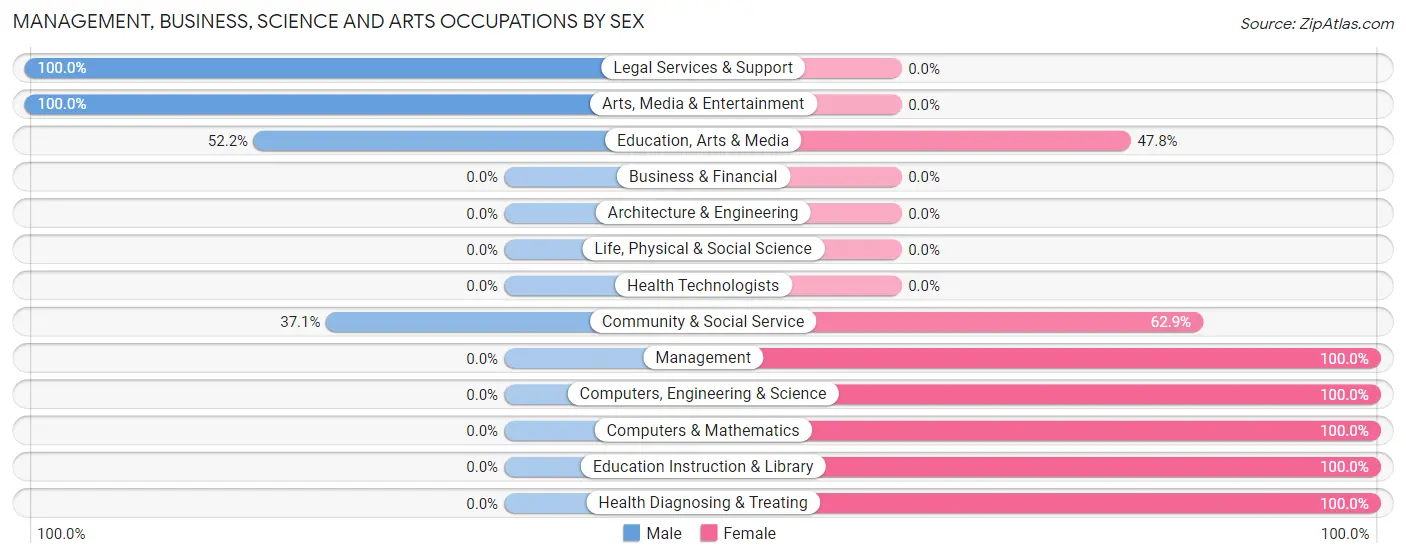
Management, Business, Science and Arts Occupations
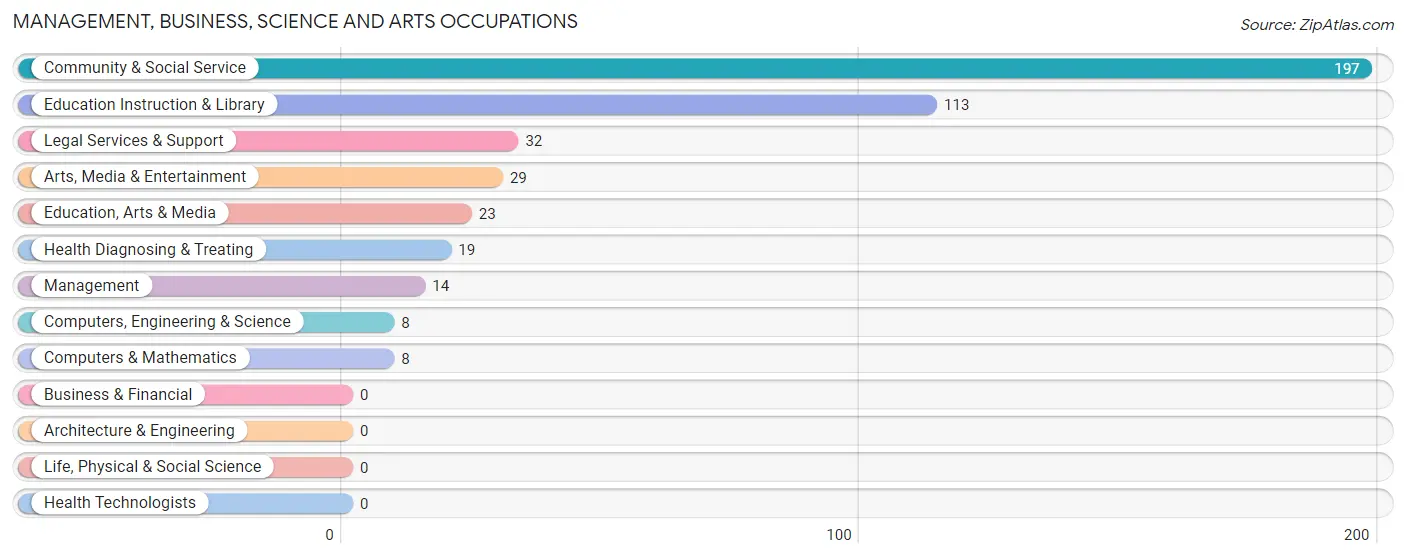
The most common Management, Business, Science and Arts occupations in East Gaffney are Community & Social Service (197 | 17.5%), Education Instruction & Library (113 | 10.0%), Legal Services & Support (32 | 2.8%), Arts, Media & Entertainment (29 | 2.6%), and Education, Arts & Media (23 | 2.0%).
Management, Business, Science and Arts Occupations by Sex
Within the Management, Business, Science and Arts occupations in East Gaffney, the most male-oriented occupations are Legal Services & Support (100.0%), Arts, Media & Entertainment (100.0%), and Education, Arts & Media (52.2%), while the most female-oriented occupations are Management (100.0%), Computers, Engineering & Science (100.0%), and Computers & Mathematics (100.0%).
| Occupation | Male | Female |
| Management | 0 (0.0%) | 14 (100.0%) |
| Business & Financial | 0 (0.0%) | 0 (0.0%) |
| Computers, Engineering & Science | 0 (0.0%) | 8 (100.0%) |
| Computers & Mathematics | 0 (0.0%) | 8 (100.0%) |
| Architecture & Engineering | 0 (0.0%) | 0 (0.0%) |
| Life, Physical & Social Science | 0 (0.0%) | 0 (0.0%) |
| Community & Social Service | 73 (37.1%) | 124 (62.9%) |
| Education, Arts & Media | 12 (52.2%) | 11 (47.8%) |
| Legal Services & Support | 32 (100.0%) | 0 (0.0%) |
| Education Instruction & Library | 0 (0.0%) | 113 (100.0%) |
| Arts, Media & Entertainment | 29 (100.0%) | 0 (0.0%) |
| Health Diagnosing & Treating | 0 (0.0%) | 19 (100.0%) |
| Health Technologists | 0 (0.0%) | 0 (0.0%) |
| Total (Category) | 73 (30.7%) | 165 (69.3%) |
| Total (Overall) | 585 (52.0%) | 540 (48.0%) |
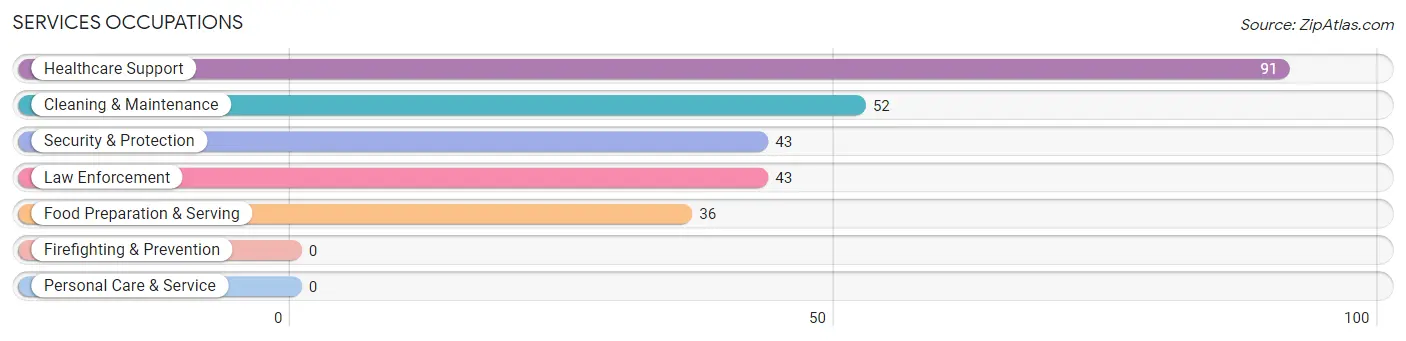
Services Occupations
The most common Services occupations in East Gaffney are Healthcare Support (91 | 8.1%), Cleaning & Maintenance (52 | 4.6%), Security & Protection (43 | 3.8%), Law Enforcement (43 | 3.8%), and Food Preparation & Serving (36 | 3.2%).
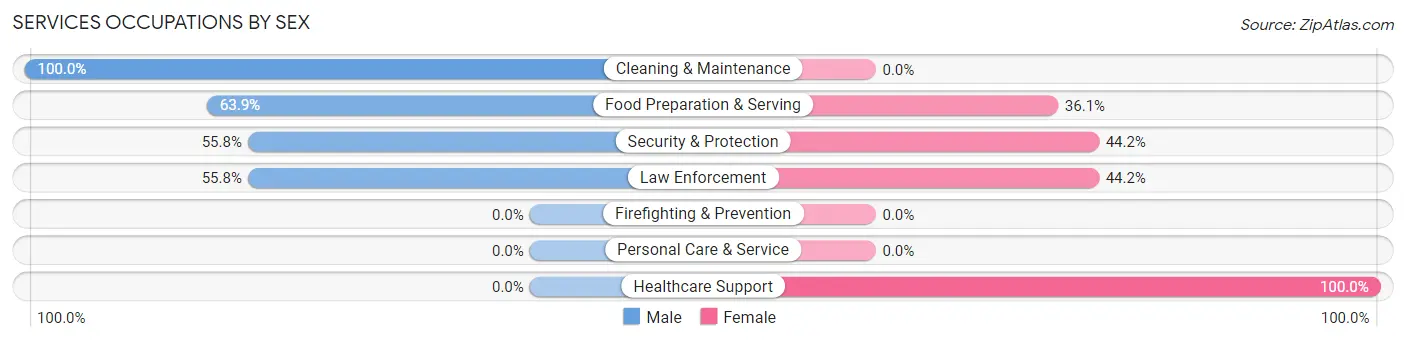
Services Occupations by Sex
Within the Services occupations in East Gaffney, the most male-oriented occupations are Cleaning & Maintenance (100.0%), Food Preparation & Serving (63.9%), and Security & Protection (55.8%), while the most female-oriented occupations are Healthcare Support (100.0%), Security & Protection (44.2%), and Law Enforcement (44.2%).
| Occupation | Male | Female |
| Healthcare Support | 0 (0.0%) | 91 (100.0%) |
| Security & Protection | 24 (55.8%) | 19 (44.2%) |
| Firefighting & Prevention | 0 (0.0%) | 0 (0.0%) |
| Law Enforcement | 24 (55.8%) | 19 (44.2%) |
| Food Preparation & Serving | 23 (63.9%) | 13 (36.1%) |
| Cleaning & Maintenance | 52 (100.0%) | 0 (0.0%) |
| Personal Care & Service | 0 (0.0%) | 0 (0.0%) |
| Total (Category) | 99 (44.6%) | 123 (55.4%) |
| Total (Overall) | 585 (52.0%) | 540 (48.0%) |
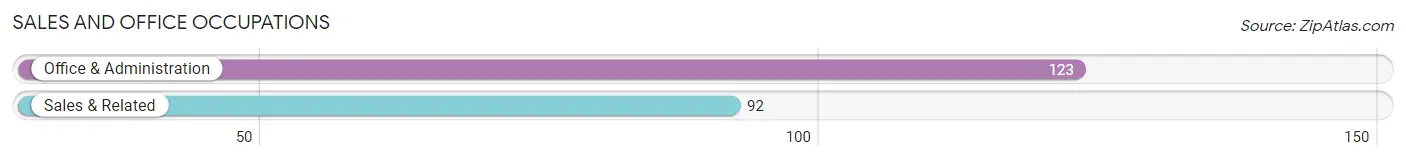
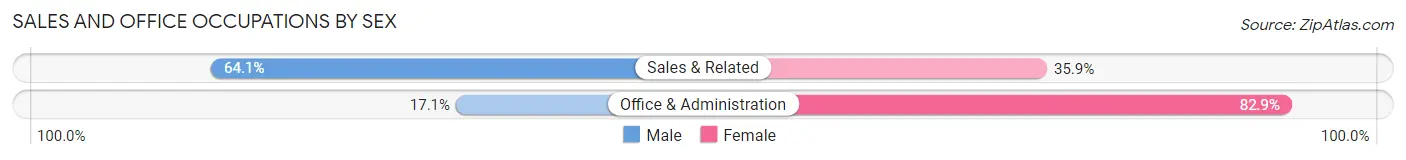
Sales and Office Occupations
The most common Sales and Office occupations in East Gaffney are Office & Administration (123 | 10.9%), and Sales & Related (92 | 8.2%).
Sales and Office Occupations by Sex
| Occupation | Male | Female |
| Sales & Related | 59 (64.1%) | 33 (35.9%) |
| Office & Administration | 21 (17.1%) | 102 (82.9%) |
| Total (Category) | 80 (37.2%) | 135 (62.8%) |
| Total (Overall) | 585 (52.0%) | 540 (48.0%) |
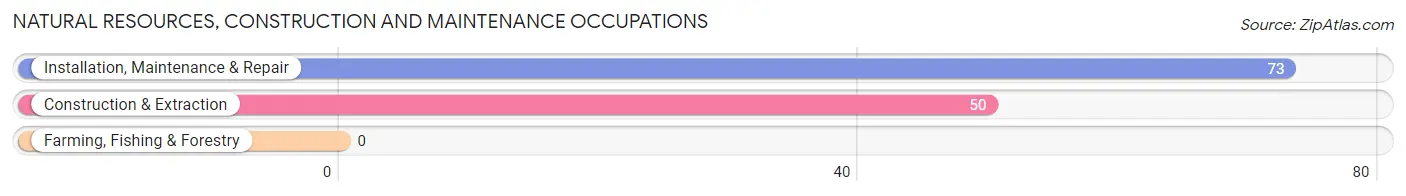
Natural Resources, Construction and Maintenance Occupations
The most common Natural Resources, Construction and Maintenance occupations in East Gaffney are Installation, Maintenance & Repair (73 | 6.5%), and Construction & Extraction (50 | 4.4%).
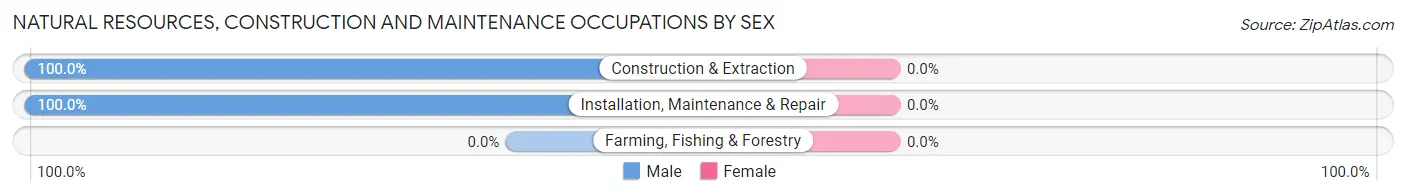
Natural Resources, Construction and Maintenance Occupations by Sex
| Occupation | Male | Female |
| Farming, Fishing & Forestry | 0 (0.0%) | 0 (0.0%) |
| Construction & Extraction | 50 (100.0%) | 0 (0.0%) |
| Installation, Maintenance & Repair | 73 (100.0%) | 0 (0.0%) |
| Total (Category) | 123 (100.0%) | 0 (0.0%) |
| Total (Overall) | 585 (52.0%) | 540 (48.0%) |
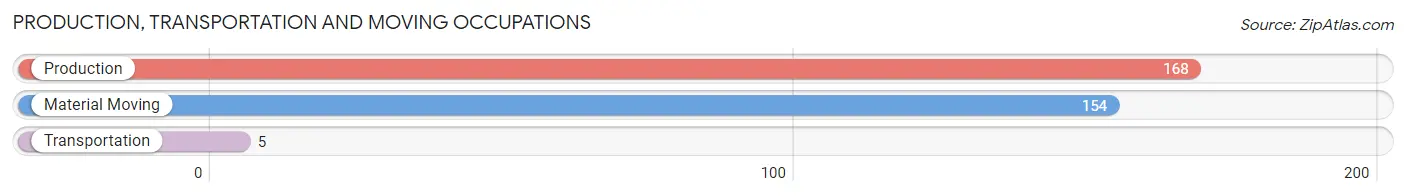
Production, Transportation and Moving Occupations
The most common Production, Transportation and Moving occupations in East Gaffney are Production (168 | 14.9%), Material Moving (154 | 13.7%), and Transportation (5 | 0.4%).
Production, Transportation and Moving Occupations by Sex
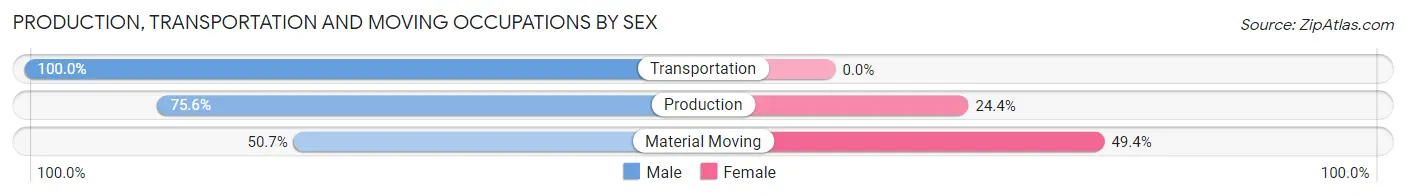
| Occupation | Male | Female |
| Production | 127 (75.6%) | 41 (24.4%) |
| Transportation | 5 (100.0%) | 0 (0.0%) |
| Material Moving | 78 (50.6%) | 76 (49.3%) |
| Total (Category) | 210 (64.2%) | 117 (35.8%) |
| Total (Overall) | 585 (52.0%) | 540 (48.0%) |
Employment Industries by Sex in East Gaffney
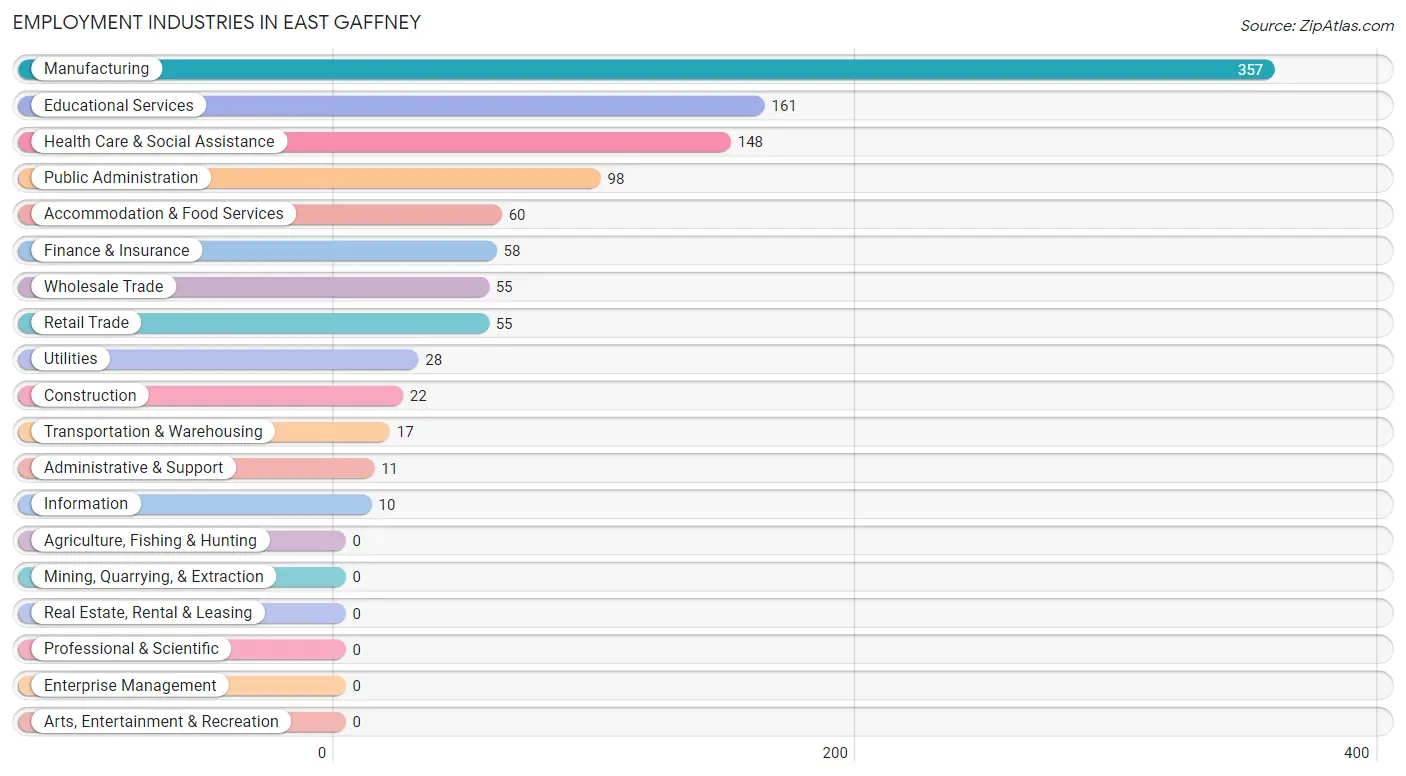
Employment Industries in East Gaffney
The major employment industries in East Gaffney include Manufacturing (357 | 31.7%), Educational Services (161 | 14.3%), Health Care & Social Assistance (148 | 13.2%), Public Administration (98 | 8.7%), and Accommodation & Food Services (60 | 5.3%).
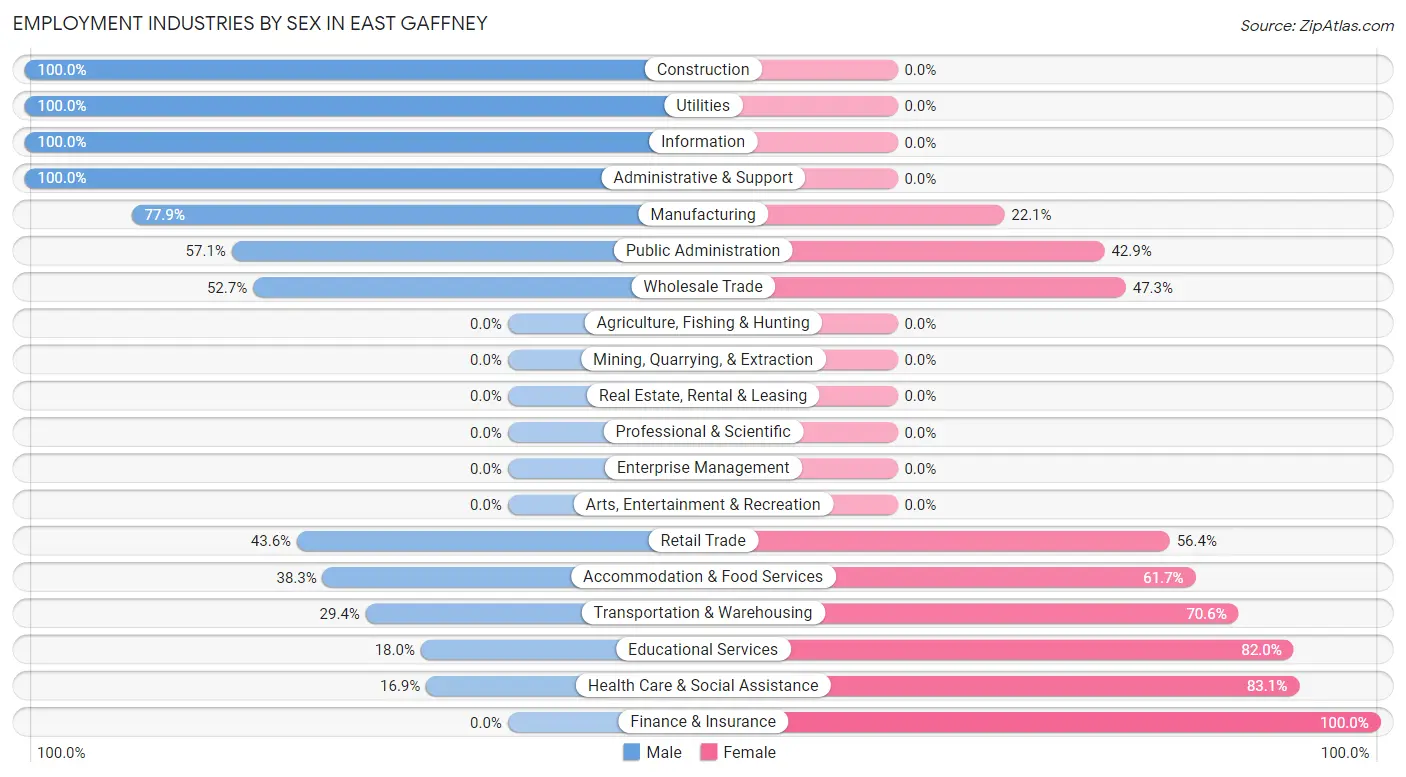
Employment Industries by Sex in East Gaffney
The East Gaffney industries that see more men than women are Construction (100.0%), Utilities (100.0%), and Information (100.0%), whereas the industries that tend to have a higher number of women are Finance & Insurance (100.0%), Health Care & Social Assistance (83.1%), and Educational Services (82.0%).
| Industry | Male | Female |
| Agriculture, Fishing & Hunting | 0 (0.0%) | 0 (0.0%) |
| Mining, Quarrying, & Extraction | 0 (0.0%) | 0 (0.0%) |
| Construction | 22 (100.0%) | 0 (0.0%) |
| Manufacturing | 278 (77.9%) | 79 (22.1%) |
| Wholesale Trade | 29 (52.7%) | 26 (47.3%) |
| Retail Trade | 24 (43.6%) | 31 (56.4%) |
| Transportation & Warehousing | 5 (29.4%) | 12 (70.6%) |
| Utilities | 28 (100.0%) | 0 (0.0%) |
| Information | 10 (100.0%) | 0 (0.0%) |
| Finance & Insurance | 0 (0.0%) | 58 (100.0%) |
| Real Estate, Rental & Leasing | 0 (0.0%) | 0 (0.0%) |
| Professional & Scientific | 0 (0.0%) | 0 (0.0%) |
| Enterprise Management | 0 (0.0%) | 0 (0.0%) |
| Administrative & Support | 11 (100.0%) | 0 (0.0%) |
| Educational Services | 29 (18.0%) | 132 (82.0%) |
| Health Care & Social Assistance | 25 (16.9%) | 123 (83.1%) |
| Arts, Entertainment & Recreation | 0 (0.0%) | 0 (0.0%) |
| Accommodation & Food Services | 23 (38.3%) | 37 (61.7%) |
| Public Administration | 56 (57.1%) | 42 (42.9%) |
| Total | 585 (52.0%) | 540 (48.0%) |
Education in East Gaffney
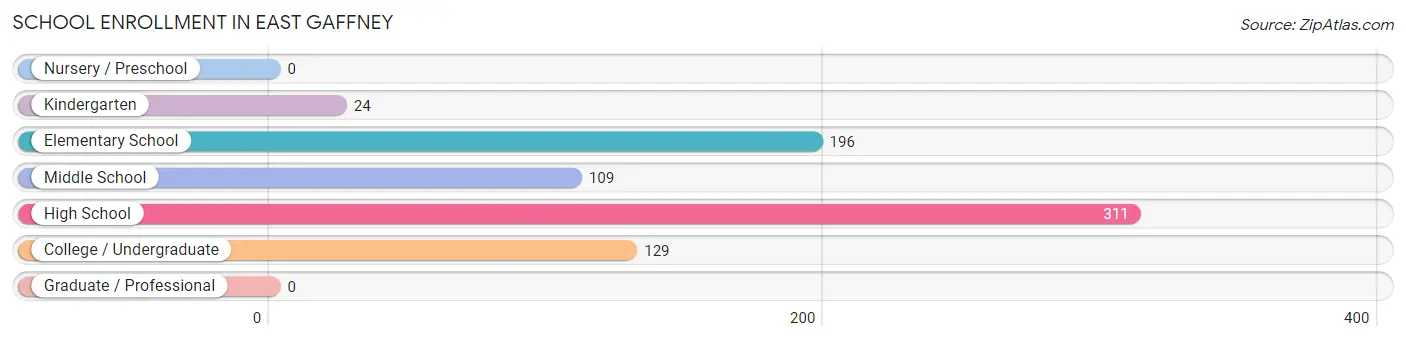
School Enrollment in East Gaffney
The most common levels of schooling among the 769 students in East Gaffney are high school (311 | 40.4%), elementary school (196 | 25.5%), and college / undergraduate (129 | 16.8%).
| School Level | # Students | % Students |
| Nursery / Preschool | 0 | 0.0% |
| Kindergarten | 24 | 3.1% |
| Elementary School | 196 | 25.5% |
| Middle School | 109 | 14.2% |
| High School | 311 | 40.4% |
| College / Undergraduate | 129 | 16.8% |
| Graduate / Professional | 0 | 0.0% |
| Total | 769 | 100.0% |
School Enrollment by Age by Funding Source in East Gaffney
Out of a total of 769 students who are enrolled in schools in East Gaffney, 55 (7.2%) attend a private institution, while the remaining 714 (92.8%) are enrolled in public schools. The age group of 35 years and over has the highest likelihood of being enrolled in private schools, with 55 (50.5% in the age bracket) enrolled. Conversely, the age group of 5 to 9 year old has the lowest likelihood of being enrolled in a private school, with 220 (100.0% in the age bracket) attending a public institution.
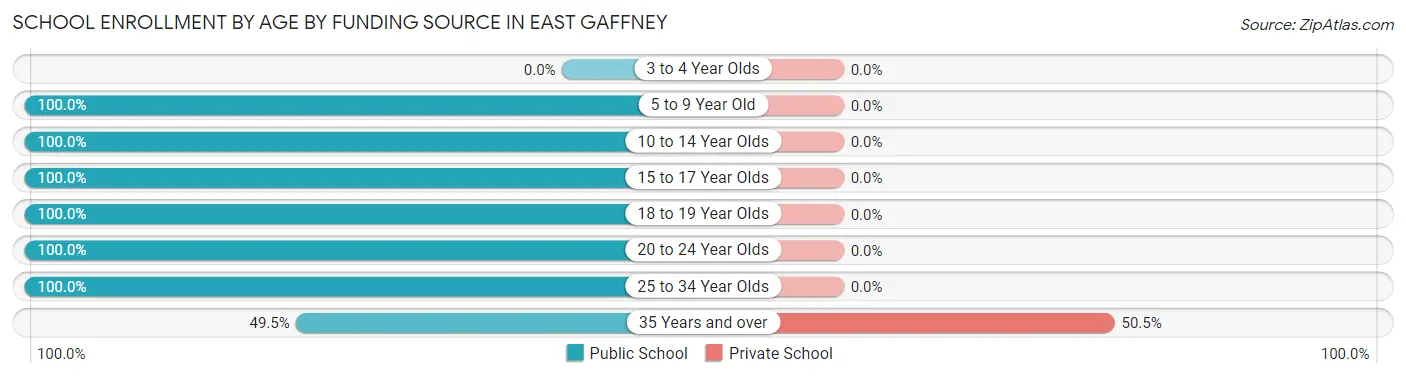
| Age Bracket | Public School | Private School |
| 3 to 4 Year Olds | 0 (0.0%) | 0 (0.0%) |
| 5 to 9 Year Old | 220 (100.0%) | 0 (0.0%) |
| 10 to 14 Year Olds | 118 (100.0%) | 0 (0.0%) |
| 15 to 17 Year Olds | 150 (100.0%) | 0 (0.0%) |
| 18 to 19 Year Olds | 58 (100.0%) | 0 (0.0%) |
| 20 to 24 Year Olds | 82 (100.0%) | 0 (0.0%) |
| 25 to 34 Year Olds | 32 (100.0%) | 0 (0.0%) |
| 35 Years and over | 54 (49.5%) | 55 (50.5%) |
| Total | 714 (92.8%) | 55 (7.2%) |
Educational Attainment by Field of Study in East Gaffney
Liberal arts & history (72 | 23.8%), business (66 | 21.8%), bio, nature & agricultural (59 | 19.5%), communications (53 | 17.5%), and psychology (23 | 7.6%) are the most common fields of study among 303 individuals in East Gaffney who have obtained a bachelor's degree or higher.
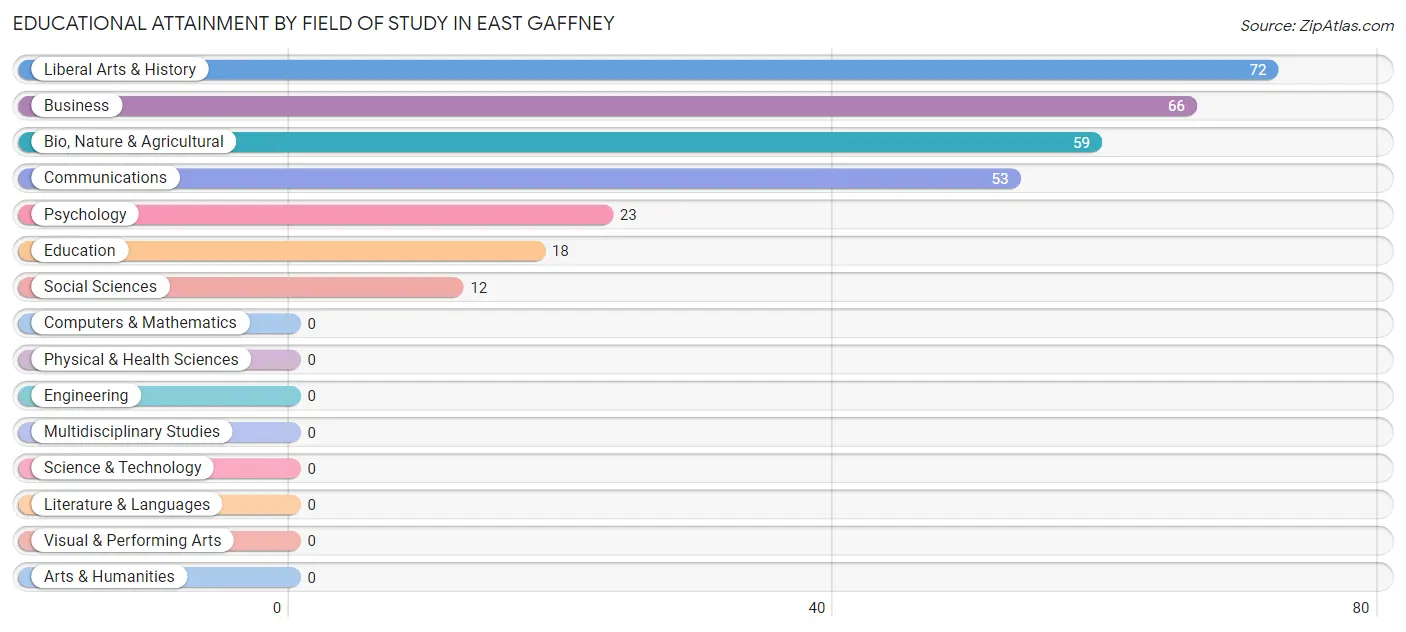
| Field of Study | # Graduates | % Graduates |
| Computers & Mathematics | 0 | 0.0% |
| Bio, Nature & Agricultural | 59 | 19.5% |
| Physical & Health Sciences | 0 | 0.0% |
| Psychology | 23 | 7.6% |
| Social Sciences | 12 | 4.0% |
| Engineering | 0 | 0.0% |
| Multidisciplinary Studies | 0 | 0.0% |
| Science & Technology | 0 | 0.0% |
| Business | 66 | 21.8% |
| Education | 18 | 5.9% |
| Literature & Languages | 0 | 0.0% |
| Liberal Arts & History | 72 | 23.8% |
| Visual & Performing Arts | 0 | 0.0% |
| Communications | 53 | 17.5% |
| Arts & Humanities | 0 | 0.0% |
| Total | 303 | 100.0% |
Transportation & Commute in East Gaffney
Vehicle Availability by Sex in East Gaffney
The most prevalent vehicle ownership categories in East Gaffney are males with 5 or more vehicles (178, accounting for 30.7%) and females with 5 or more vehicles (0, making up 33.0%).
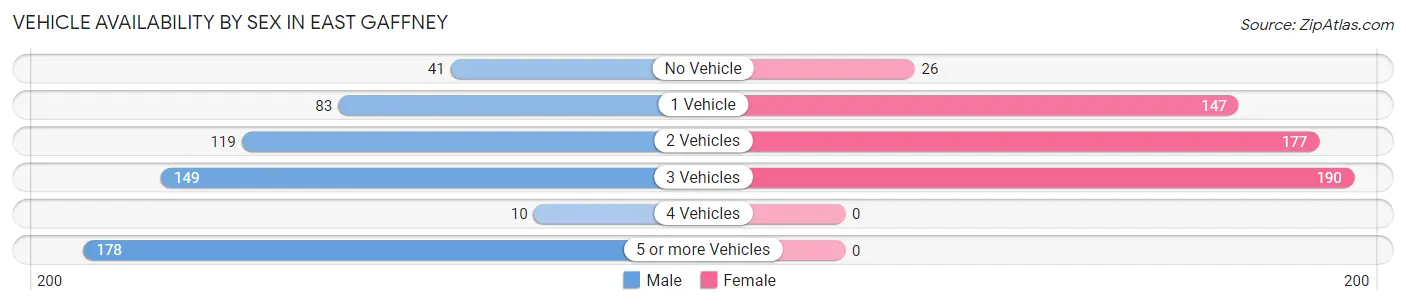
| Vehicles Available | Male | Female |
| No Vehicle | 41 (7.1%) | 26 (4.8%) |
| 1 Vehicle | 83 (14.3%) | 147 (27.2%) |
| 2 Vehicles | 119 (20.5%) | 177 (32.8%) |
| 3 Vehicles | 149 (25.7%) | 190 (35.2%) |
| 4 Vehicles | 10 (1.7%) | 0 (0.0%) |
| 5 or more Vehicles | 178 (30.7%) | 0 (0.0%) |
| Total | 580 (100.0%) | 540 (100.0%) |
Commute Time in East Gaffney
The most frequently occuring commute durations in East Gaffney are 5 to 9 minutes (251 commuters, 22.4%), 10 to 14 minutes (244 commuters, 21.8%), and 15 to 19 minutes (210 commuters, 18.8%).
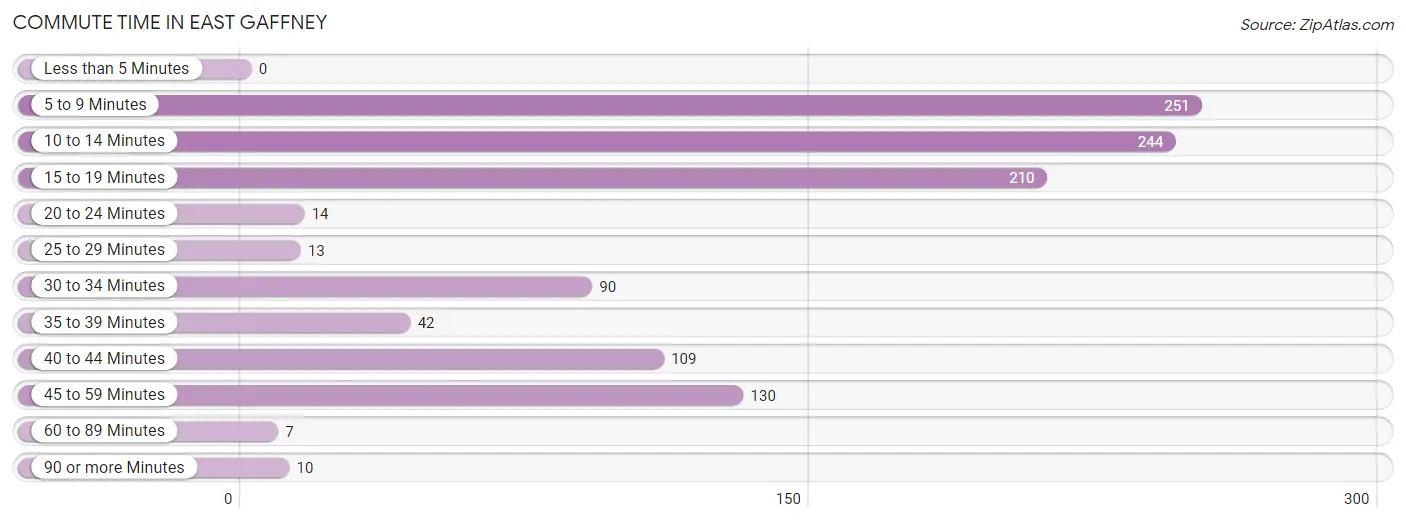
| Commute Time | # Commuters | % Commuters |
| Less than 5 Minutes | 0 | 0.0% |
| 5 to 9 Minutes | 251 | 22.4% |
| 10 to 14 Minutes | 244 | 21.8% |
| 15 to 19 Minutes | 210 | 18.8% |
| 20 to 24 Minutes | 14 | 1.3% |
| 25 to 29 Minutes | 13 | 1.2% |
| 30 to 34 Minutes | 90 | 8.0% |
| 35 to 39 Minutes | 42 | 3.7% |
| 40 to 44 Minutes | 109 | 9.7% |
| 45 to 59 Minutes | 130 | 11.6% |
| 60 to 89 Minutes | 7 | 0.6% |
| 90 or more Minutes | 10 | 0.9% |
Commute Time by Sex in East Gaffney
The most common commute times in East Gaffney are 10 to 14 minutes (178 commuters, 30.7%) for males and 5 to 9 minutes (209 commuters, 38.7%) for females.
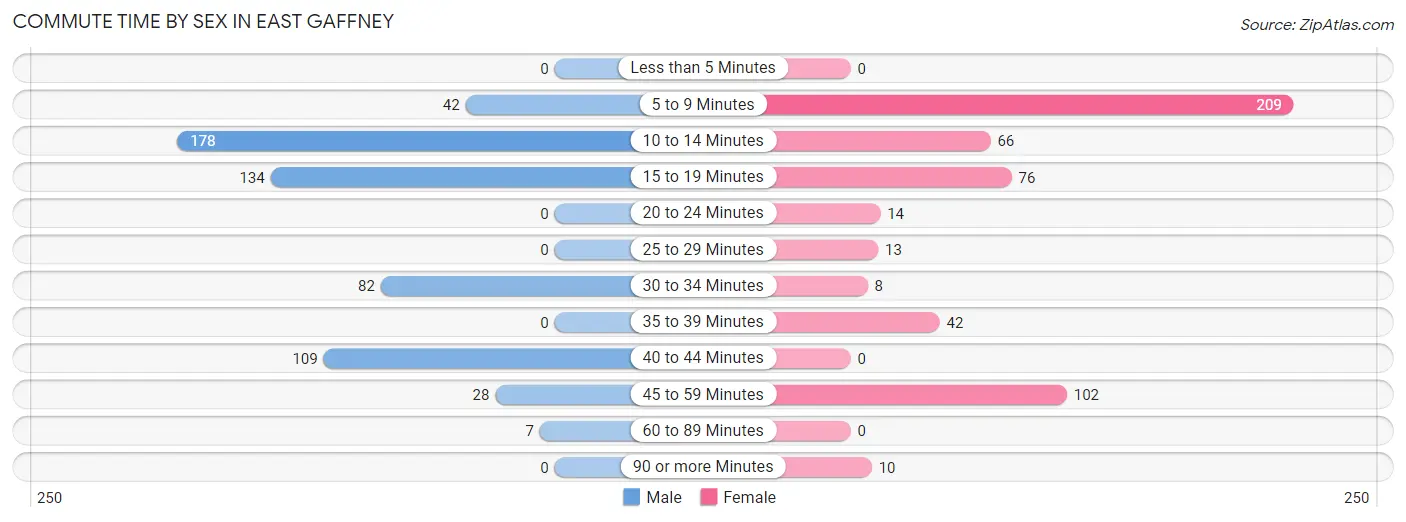
| Commute Time | Male | Female |
| Less than 5 Minutes | 0 (0.0%) | 0 (0.0%) |
| 5 to 9 Minutes | 42 (7.2%) | 209 (38.7%) |
| 10 to 14 Minutes | 178 (30.7%) | 66 (12.2%) |
| 15 to 19 Minutes | 134 (23.1%) | 76 (14.1%) |
| 20 to 24 Minutes | 0 (0.0%) | 14 (2.6%) |
| 25 to 29 Minutes | 0 (0.0%) | 13 (2.4%) |
| 30 to 34 Minutes | 82 (14.1%) | 8 (1.5%) |
| 35 to 39 Minutes | 0 (0.0%) | 42 (7.8%) |
| 40 to 44 Minutes | 109 (18.8%) | 0 (0.0%) |
| 45 to 59 Minutes | 28 (4.8%) | 102 (18.9%) |
| 60 to 89 Minutes | 7 (1.2%) | 0 (0.0%) |
| 90 or more Minutes | 0 (0.0%) | 10 (1.8%) |
Time of Departure to Work by Sex in East Gaffney
The most frequent times of departure to work in East Gaffney are 6:30 AM to 6:59 AM (186, 32.1%) for males and 6:30 AM to 6:59 AM (198, 36.7%) for females.
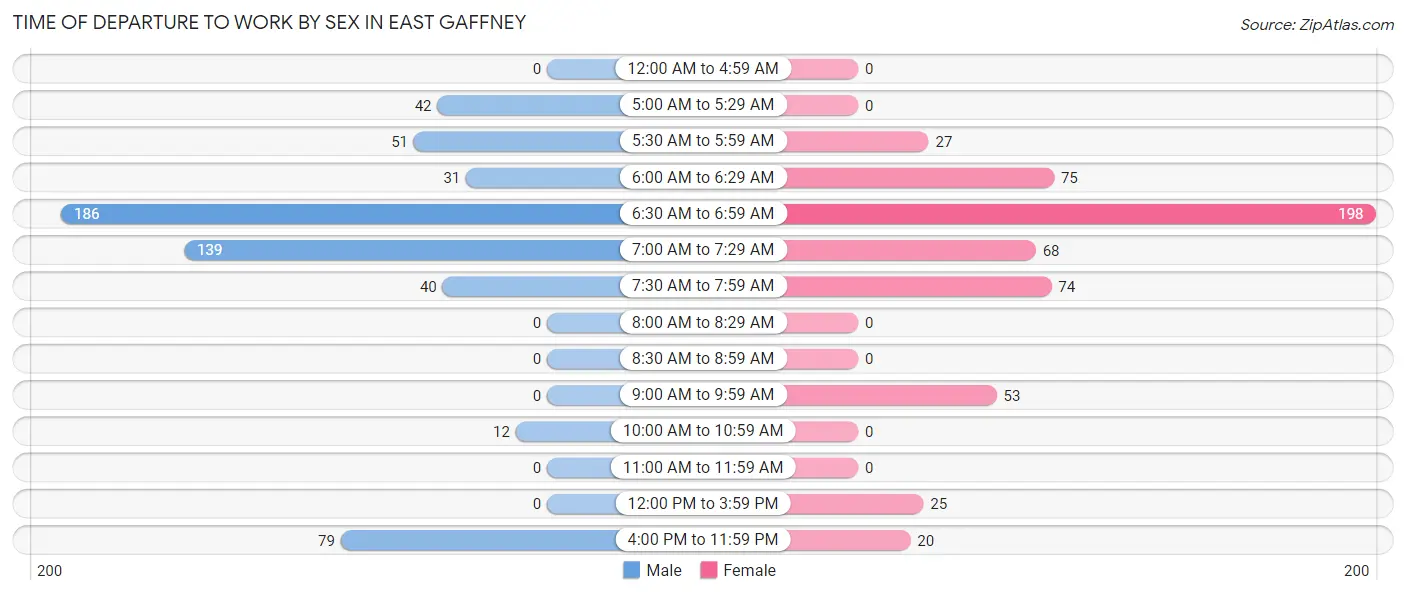
| Time of Departure | Male | Female |
| 12:00 AM to 4:59 AM | 0 (0.0%) | 0 (0.0%) |
| 5:00 AM to 5:29 AM | 42 (7.2%) | 0 (0.0%) |
| 5:30 AM to 5:59 AM | 51 (8.8%) | 27 (5.0%) |
| 6:00 AM to 6:29 AM | 31 (5.3%) | 75 (13.9%) |
| 6:30 AM to 6:59 AM | 186 (32.1%) | 198 (36.7%) |
| 7:00 AM to 7:29 AM | 139 (24.0%) | 68 (12.6%) |
| 7:30 AM to 7:59 AM | 40 (6.9%) | 74 (13.7%) |
| 8:00 AM to 8:29 AM | 0 (0.0%) | 0 (0.0%) |
| 8:30 AM to 8:59 AM | 0 (0.0%) | 0 (0.0%) |
| 9:00 AM to 9:59 AM | 0 (0.0%) | 53 (9.8%) |
| 10:00 AM to 10:59 AM | 12 (2.1%) | 0 (0.0%) |
| 11:00 AM to 11:59 AM | 0 (0.0%) | 0 (0.0%) |
| 12:00 PM to 3:59 PM | 0 (0.0%) | 25 (4.6%) |
| 4:00 PM to 11:59 PM | 79 (13.6%) | 20 (3.7%) |
| Total | 580 (100.0%) | 540 (100.0%) |
Housing Occupancy in East Gaffney
Occupancy by Ownership in East Gaffney
Of the total 1,325 dwellings in East Gaffney, owner-occupied units account for 988 (74.6%), while renter-occupied units make up 337 (25.4%).
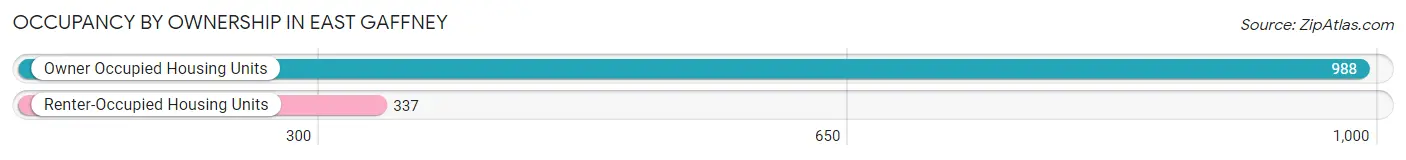
| Occupancy | # Housing Units | % Housing Units |
| Owner Occupied Housing Units | 988 | 74.6% |
| Renter-Occupied Housing Units | 337 | 25.4% |
| Total Occupied Housing Units | 1,325 | 100.0% |
Occupancy by Household Size in East Gaffney
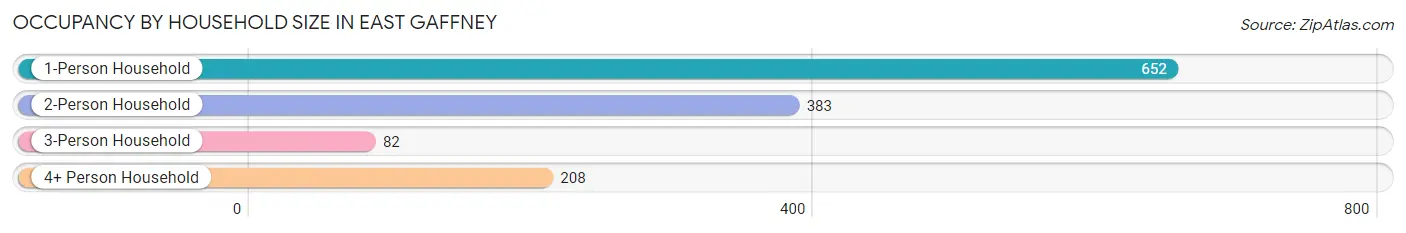
| Household Size | # Housing Units | % Housing Units |
| 1-Person Household | 652 | 49.2% |
| 2-Person Household | 383 | 28.9% |
| 3-Person Household | 82 | 6.2% |
| 4+ Person Household | 208 | 15.7% |
| Total Housing Units | 1,325 | 100.0% |
Occupancy by Ownership by Household Size in East Gaffney
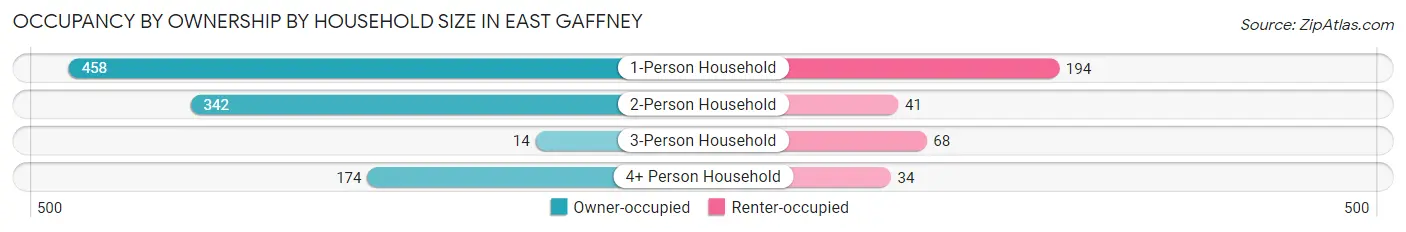
| Household Size | Owner-occupied | Renter-occupied |
| 1-Person Household | 458 (70.3%) | 194 (29.7%) |
| 2-Person Household | 342 (89.3%) | 41 (10.7%) |
| 3-Person Household | 14 (17.1%) | 68 (82.9%) |
| 4+ Person Household | 174 (83.7%) | 34 (16.4%) |
| Total Housing Units | 988 (74.6%) | 337 (25.4%) |
Occupancy by Educational Attainment in East Gaffney
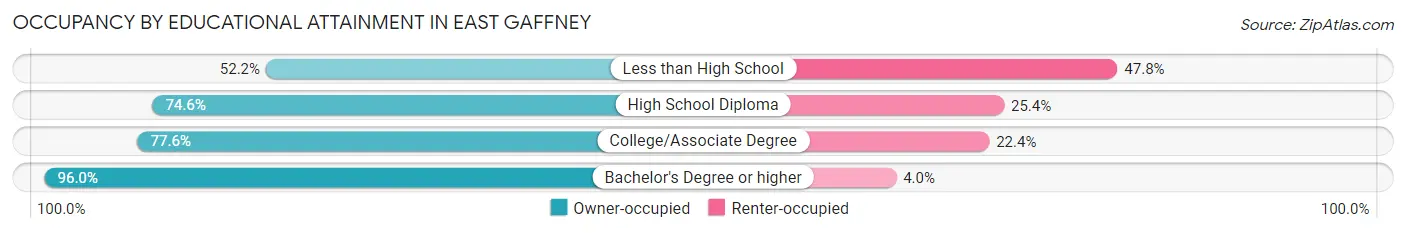
| Household Size | Owner-occupied | Renter-occupied |
| Less than High School | 84 (52.2%) | 77 (47.8%) |
| High School Diploma | 565 (74.6%) | 192 (25.4%) |
| College/Associate Degree | 218 (77.6%) | 63 (22.4%) |
| Bachelor's Degree or higher | 121 (96.0%) | 5 (4.0%) |
Occupancy by Age of Householder in East Gaffney
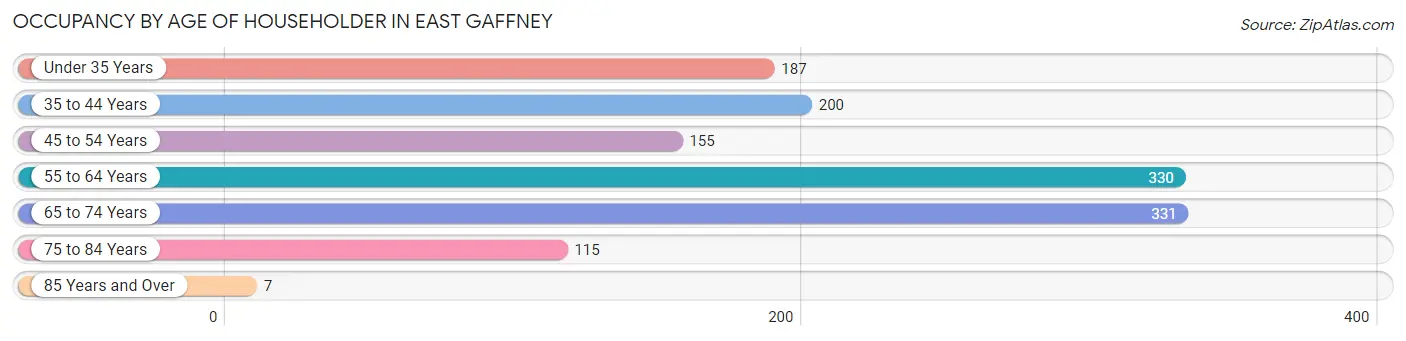
| Age Bracket | # Households | % Households |
| Under 35 Years | 187 | 14.1% |
| 35 to 44 Years | 200 | 15.1% |
| 45 to 54 Years | 155 | 11.7% |
| 55 to 64 Years | 330 | 24.9% |
| 65 to 74 Years | 331 | 25.0% |
| 75 to 84 Years | 115 | 8.7% |
| 85 Years and Over | 7 | 0.5% |
| Total | 1,325 | 100.0% |
Housing Finances in East Gaffney
Median Income by Occupancy in East Gaffney
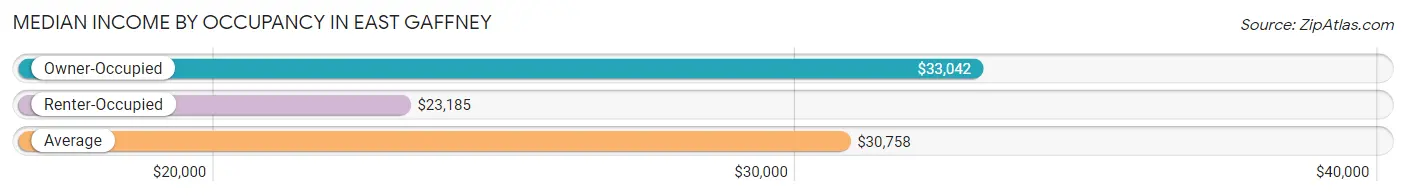
| Occupancy Type | # Households | Median Income |
| Owner-Occupied | 988 (74.6%) | $33,042 |
| Renter-Occupied | 337 (25.4%) | $23,185 |
| Average | 1,325 (100.0%) | $30,758 |
Occupancy by Householder Income Bracket in East Gaffney
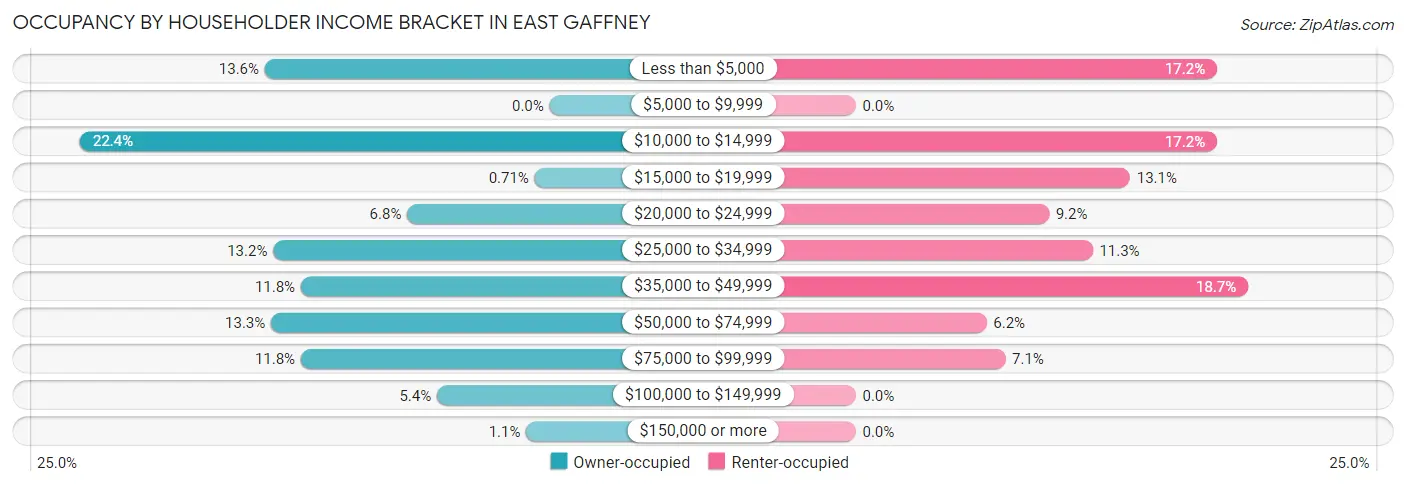
| Income Bracket | Owner-occupied | Renter-occupied |
| Less than $5,000 | 134 (13.6%) | 58 (17.2%) |
| $5,000 to $9,999 | 0 (0.0%) | 0 (0.0%) |
| $10,000 to $14,999 | 221 (22.4%) | 58 (17.2%) |
| $15,000 to $19,999 | 7 (0.7%) | 44 (13.1%) |
| $20,000 to $24,999 | 67 (6.8%) | 31 (9.2%) |
| $25,000 to $34,999 | 130 (13.2%) | 38 (11.3%) |
| $35,000 to $49,999 | 117 (11.8%) | 63 (18.7%) |
| $50,000 to $74,999 | 131 (13.3%) | 21 (6.2%) |
| $75,000 to $99,999 | 117 (11.8%) | 24 (7.1%) |
| $100,000 to $149,999 | 53 (5.4%) | 0 (0.0%) |
| $150,000 or more | 11 (1.1%) | 0 (0.0%) |
| Total | 988 (100.0%) | 337 (100.0%) |
Monthly Housing Cost Tiers in East Gaffney
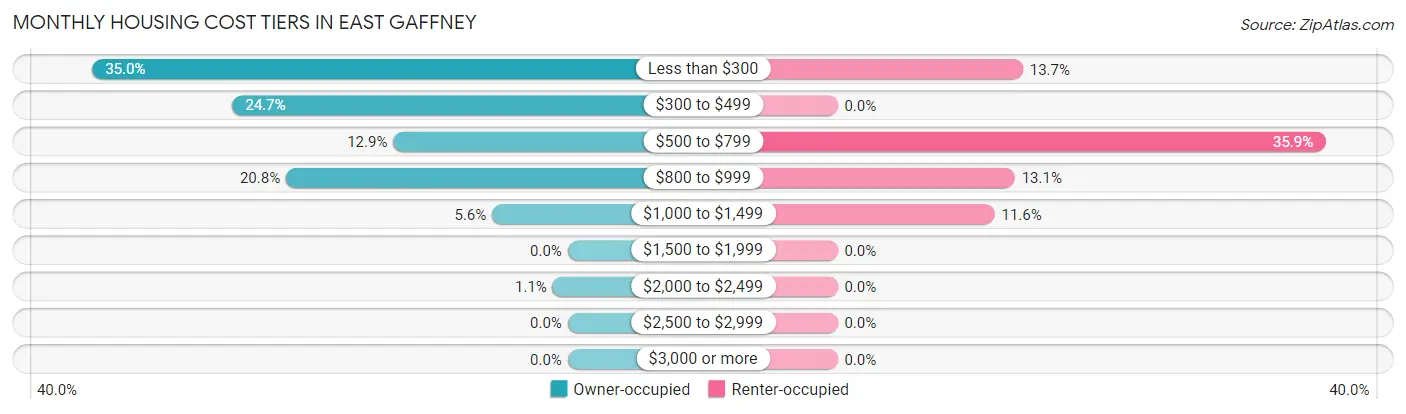
| Monthly Cost | Owner-occupied | Renter-occupied |
| Less than $300 | 346 (35.0%) | 46 (13.7%) |
| $300 to $499 | 244 (24.7%) | 0 (0.0%) |
| $500 to $799 | 127 (12.9%) | 121 (35.9%) |
| $800 to $999 | 205 (20.7%) | 44 (13.1%) |
| $1,000 to $1,499 | 55 (5.6%) | 39 (11.6%) |
| $1,500 to $1,999 | 0 (0.0%) | 0 (0.0%) |
| $2,000 to $2,499 | 11 (1.1%) | 0 (0.0%) |
| $2,500 to $2,999 | 0 (0.0%) | 0 (0.0%) |
| $3,000 or more | 0 (0.0%) | 0 (0.0%) |
| Total | 988 (100.0%) | 337 (100.0%) |
Physical Housing Characteristics in East Gaffney
Housing Structures in East Gaffney
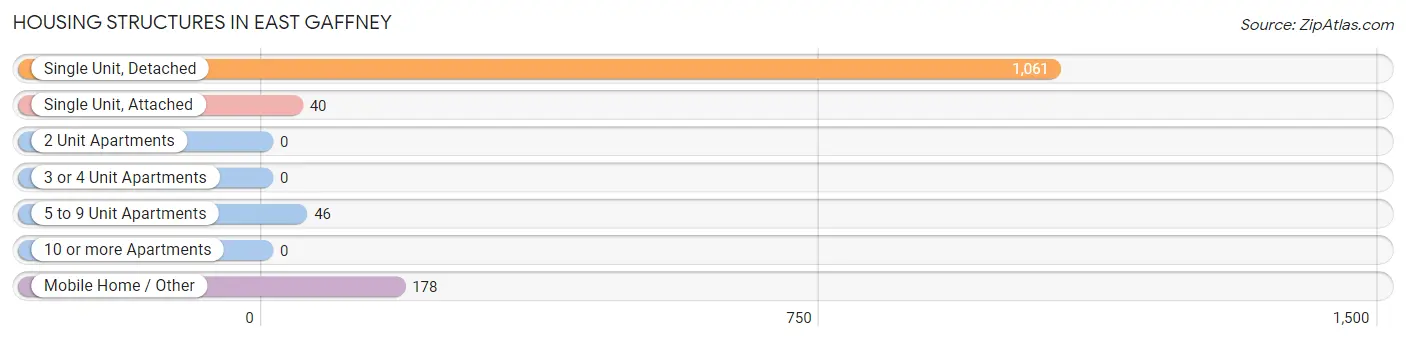
| Structure Type | # Housing Units | % Housing Units |
| Single Unit, Detached | 1,061 | 80.1% |
| Single Unit, Attached | 40 | 3.0% |
| 2 Unit Apartments | 0 | 0.0% |
| 3 or 4 Unit Apartments | 0 | 0.0% |
| 5 to 9 Unit Apartments | 46 | 3.5% |
| 10 or more Apartments | 0 | 0.0% |
| Mobile Home / Other | 178 | 13.4% |
| Total | 1,325 | 100.0% |
Housing Structures by Occupancy in East Gaffney
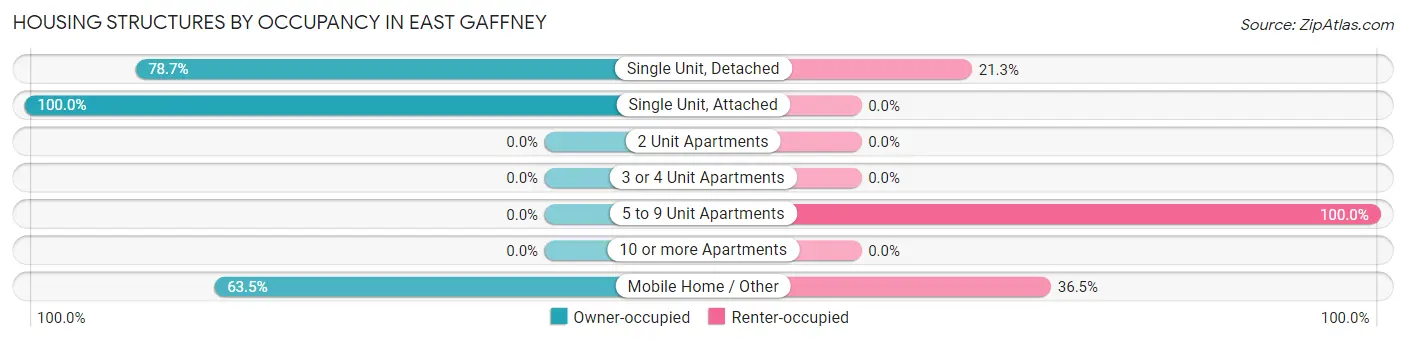
| Structure Type | Owner-occupied | Renter-occupied |
| Single Unit, Detached | 835 (78.7%) | 226 (21.3%) |
| Single Unit, Attached | 40 (100.0%) | 0 (0.0%) |
| 2 Unit Apartments | 0 (0.0%) | 0 (0.0%) |
| 3 or 4 Unit Apartments | 0 (0.0%) | 0 (0.0%) |
| 5 to 9 Unit Apartments | 0 (0.0%) | 46 (100.0%) |
| 10 or more Apartments | 0 (0.0%) | 0 (0.0%) |
| Mobile Home / Other | 113 (63.5%) | 65 (36.5%) |
| Total | 988 (74.6%) | 337 (25.4%) |
Housing Structures by Number of Rooms in East Gaffney
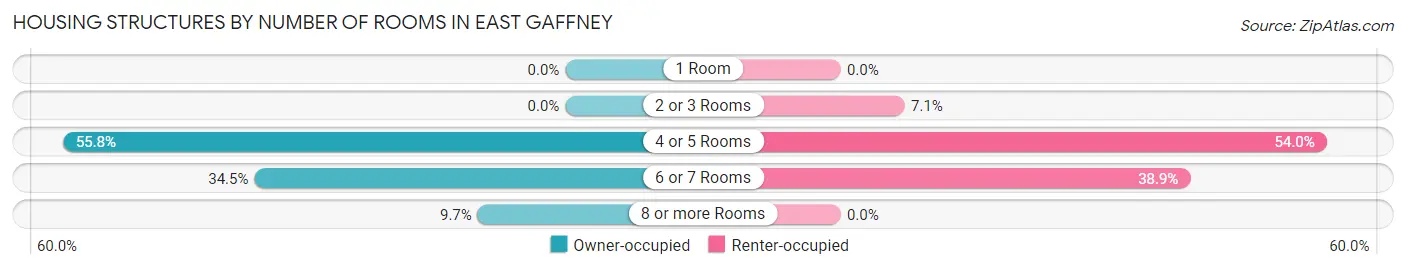
| Number of Rooms | Owner-occupied | Renter-occupied |
| 1 Room | 0 (0.0%) | 0 (0.0%) |
| 2 or 3 Rooms | 0 (0.0%) | 24 (7.1%) |
| 4 or 5 Rooms | 551 (55.8%) | 182 (54.0%) |
| 6 or 7 Rooms | 341 (34.5%) | 131 (38.9%) |
| 8 or more Rooms | 96 (9.7%) | 0 (0.0%) |
| Total | 988 (100.0%) | 337 (100.0%) |
Housing Structure by Heating Type in East Gaffney
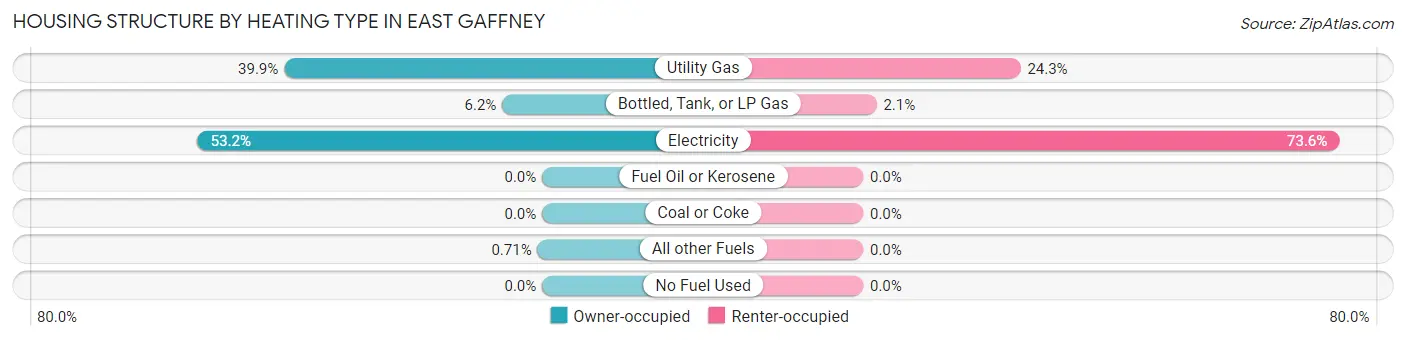
| Heating Type | Owner-occupied | Renter-occupied |
| Utility Gas | 394 (39.9%) | 82 (24.3%) |
| Bottled, Tank, or LP Gas | 61 (6.2%) | 7 (2.1%) |
| Electricity | 526 (53.2%) | 248 (73.6%) |
| Fuel Oil or Kerosene | 0 (0.0%) | 0 (0.0%) |
| Coal or Coke | 0 (0.0%) | 0 (0.0%) |
| All other Fuels | 7 (0.7%) | 0 (0.0%) |
| No Fuel Used | 0 (0.0%) | 0 (0.0%) |
| Total | 988 (100.0%) | 337 (100.0%) |
Household Vehicle Usage in East Gaffney
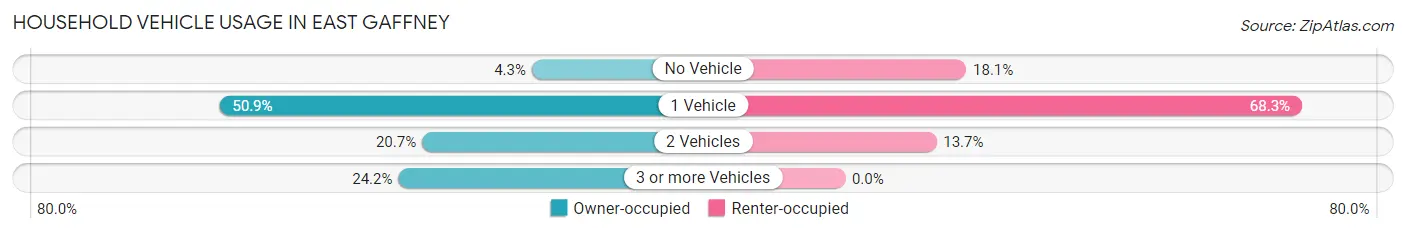
| Vehicles per Household | Owner-occupied | Renter-occupied |
| No Vehicle | 42 (4.3%) | 61 (18.1%) |
| 1 Vehicle | 503 (50.9%) | 230 (68.2%) |
| 2 Vehicles | 204 (20.6%) | 46 (13.7%) |
| 3 or more Vehicles | 239 (24.2%) | 0 (0.0%) |
| Total | 988 (100.0%) | 337 (100.0%) |
Real Estate & Mortgages in East Gaffney
Real Estate and Mortgage Overview in East Gaffney
| Characteristic | Without Mortgage | With Mortgage |
| Housing Units | 586 | 402 |
| Median Property Value | $74,900 | $129,200 |
| Median Household Income | - | - |
| Monthly Housing Costs | $246 | $0 |
| Real Estate Taxes | $287 | $45 |
Property Value by Mortgage Status in East Gaffney
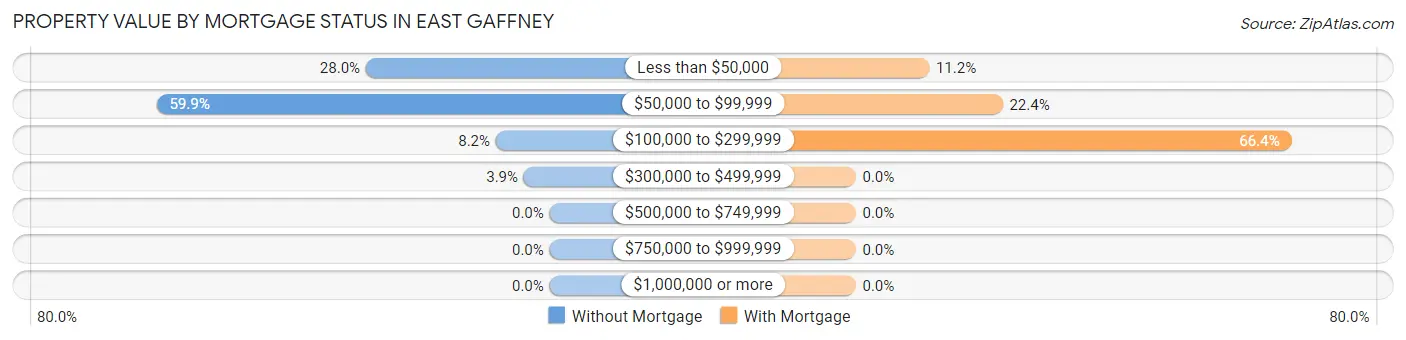
| Property Value | Without Mortgage | With Mortgage |
| Less than $50,000 | 164 (28.0%) | 45 (11.2%) |
| $50,000 to $99,999 | 351 (59.9%) | 90 (22.4%) |
| $100,000 to $299,999 | 48 (8.2%) | 267 (66.4%) |
| $300,000 to $499,999 | 23 (3.9%) | 0 (0.0%) |
| $500,000 to $749,999 | 0 (0.0%) | 0 (0.0%) |
| $750,000 to $999,999 | 0 (0.0%) | 0 (0.0%) |
| $1,000,000 or more | 0 (0.0%) | 0 (0.0%) |
| Total | 586 (100.0%) | 402 (100.0%) |
Household Income by Mortgage Status in East Gaffney
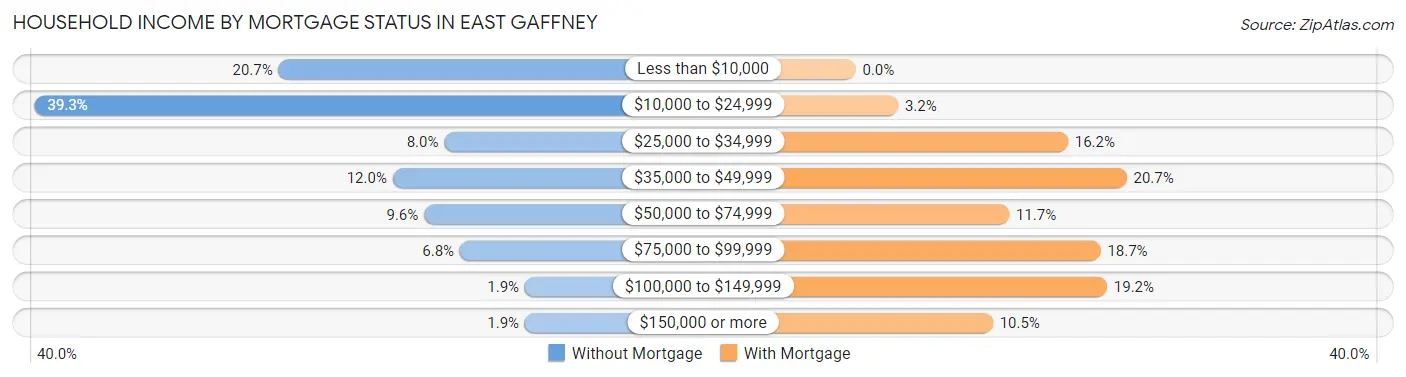
| Household Income | Without Mortgage | With Mortgage |
| Less than $10,000 | 121 (20.6%) | 0 (0.0%) |
| $10,000 to $24,999 | 230 (39.3%) | 13 (3.2%) |
| $25,000 to $34,999 | 47 (8.0%) | 65 (16.2%) |
| $35,000 to $49,999 | 70 (11.9%) | 83 (20.6%) |
| $50,000 to $74,999 | 56 (9.6%) | 47 (11.7%) |
| $75,000 to $99,999 | 40 (6.8%) | 75 (18.7%) |
| $100,000 to $149,999 | 11 (1.9%) | 77 (19.2%) |
| $150,000 or more | 11 (1.9%) | 42 (10.4%) |
| Total | 586 (100.0%) | 402 (100.0%) |
Property Value to Household Income Ratio in East Gaffney
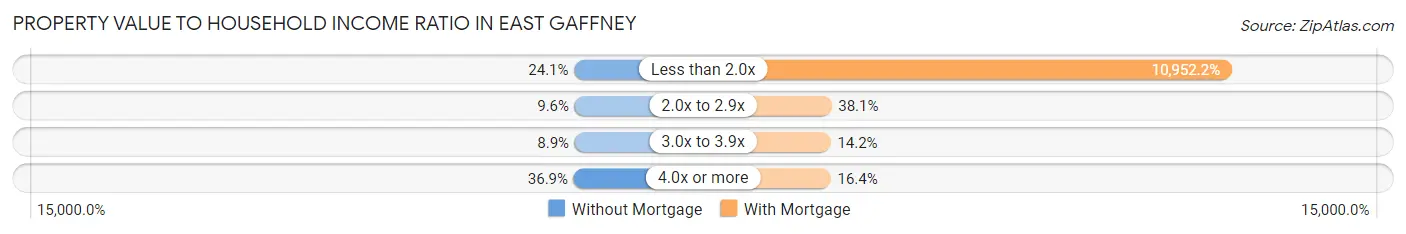
| Value-to-Income Ratio | Without Mortgage | With Mortgage |
| Less than 2.0x | 141 (24.1%) | 44,028 (10,952.2%) |
| 2.0x to 2.9x | 56 (9.6%) | 153 (38.1%) |
| 3.0x to 3.9x | 52 (8.9%) | 57 (14.2%) |
| 4.0x or more | 216 (36.9%) | 66 (16.4%) |
| Total | 586 (100.0%) | 402 (100.0%) |
Real Estate Taxes by Mortgage Status in East Gaffney
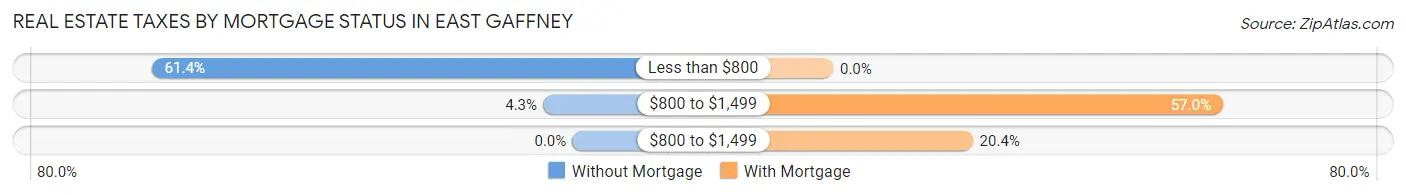
| Property Taxes | Without Mortgage | With Mortgage |
| Less than $800 | 360 (61.4%) | 0 (0.0%) |
| $800 to $1,499 | 25 (4.3%) | 229 (57.0%) |
| $800 to $1,499 | 0 (0.0%) | 82 (20.4%) |
| Total | 586 (100.0%) | 402 (100.0%) |
Health & Disability in East Gaffney
Health Insurance Coverage by Age in East Gaffney
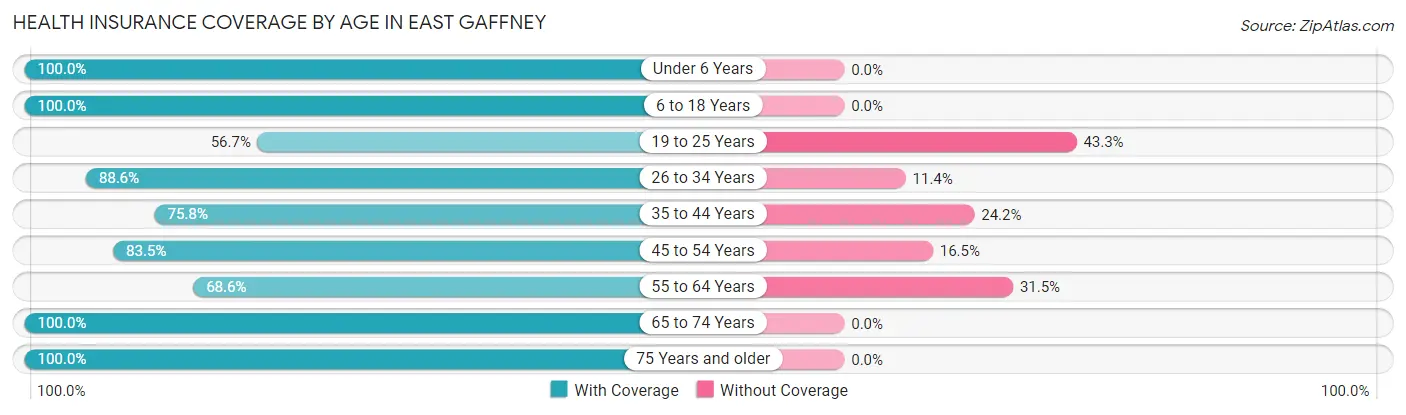
| Age Bracket | With Coverage | Without Coverage |
| Under 6 Years | 137 (100.0%) | 0 (0.0%) |
| 6 to 18 Years | 521 (100.0%) | 0 (0.0%) |
| 19 to 25 Years | 93 (56.7%) | 71 (43.3%) |
| 26 to 34 Years | 279 (88.6%) | 36 (11.4%) |
| 35 to 44 Years | 322 (75.8%) | 103 (24.2%) |
| 45 to 54 Years | 344 (83.5%) | 68 (16.5%) |
| 55 to 64 Years | 255 (68.5%) | 117 (31.5%) |
| 65 to 74 Years | 448 (100.0%) | 0 (0.0%) |
| 75 Years and older | 178 (100.0%) | 0 (0.0%) |
| Total | 2,577 (86.7%) | 395 (13.3%) |
Health Insurance Coverage by Citizenship Status in East Gaffney
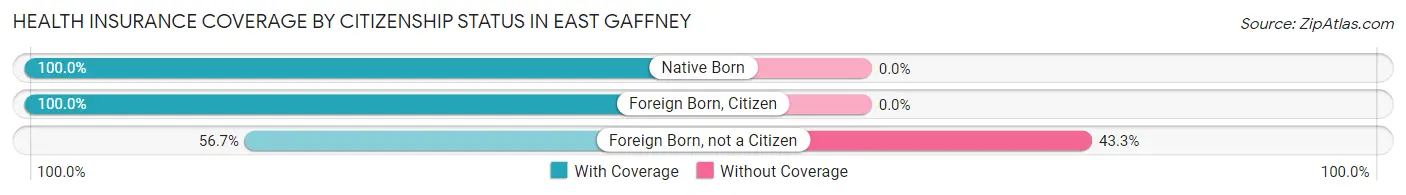
| Citizenship Status | With Coverage | Without Coverage |
| Native Born | 137 (100.0%) | 0 (0.0%) |
| Foreign Born, Citizen | 521 (100.0%) | 0 (0.0%) |
| Foreign Born, not a Citizen | 93 (56.7%) | 71 (43.3%) |
Health Insurance Coverage by Household Income in East Gaffney
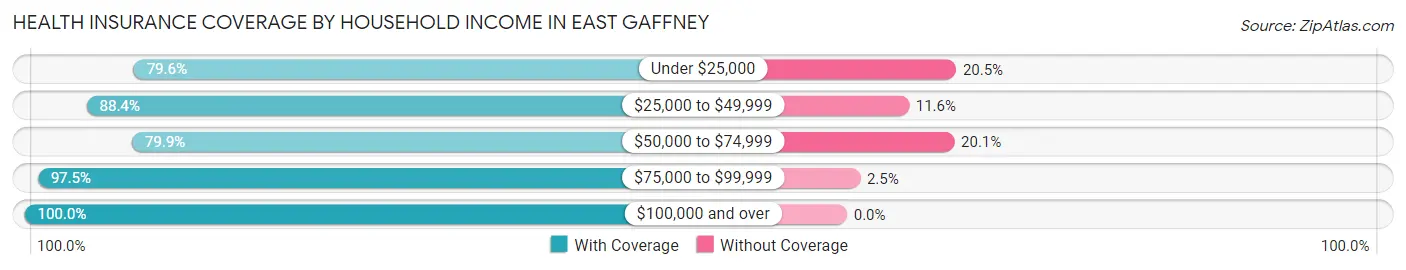
| Household Income | With Coverage | Without Coverage |
| Under $25,000 | 743 (79.5%) | 191 (20.4%) |
| $25,000 to $49,999 | 601 (88.4%) | 79 (11.6%) |
| $50,000 to $74,999 | 449 (79.9%) | 113 (20.1%) |
| $75,000 to $99,999 | 476 (97.5%) | 12 (2.5%) |
| $100,000 and over | 308 (100.0%) | 0 (0.0%) |
Public vs Private Health Insurance Coverage by Age in East Gaffney
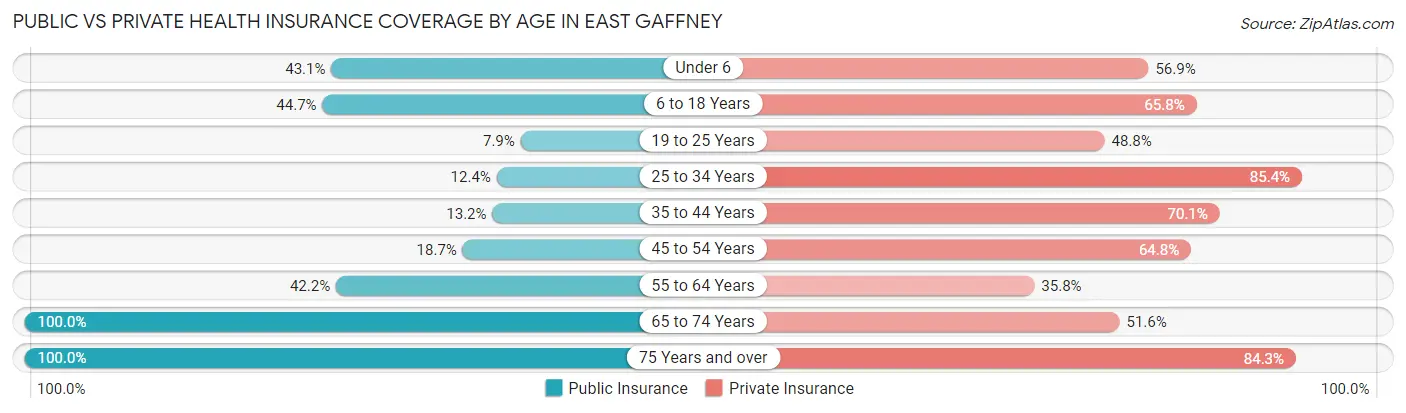
| Age Bracket | Public Insurance | Private Insurance |
| Under 6 | 59 (43.1%) | 78 (56.9%) |
| 6 to 18 Years | 233 (44.7%) | 343 (65.8%) |
| 19 to 25 Years | 13 (7.9%) | 80 (48.8%) |
| 25 to 34 Years | 39 (12.4%) | 269 (85.4%) |
| 35 to 44 Years | 56 (13.2%) | 298 (70.1%) |
| 45 to 54 Years | 77 (18.7%) | 267 (64.8%) |
| 55 to 64 Years | 157 (42.2%) | 133 (35.7%) |
| 65 to 74 Years | 448 (100.0%) | 231 (51.6%) |
| 75 Years and over | 178 (100.0%) | 150 (84.3%) |
| Total | 1,260 (42.4%) | 1,849 (62.2%) |
Disability Status by Sex by Age in East Gaffney
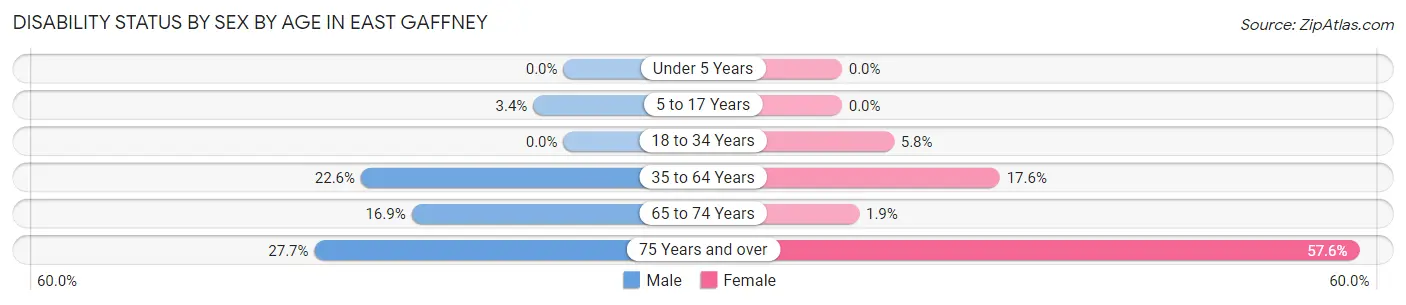
| Age Bracket | Male | Female |
| Under 5 Years | 0 (0.0%) | 0 (0.0%) |
| 5 to 17 Years | 10 (3.4%) | 0 (0.0%) |
| 18 to 34 Years | 0 (0.0%) | 18 (5.8%) |
| 35 to 64 Years | 138 (22.6%) | 105 (17.6%) |
| 65 to 74 Years | 23 (16.9%) | 6 (1.9%) |
| 75 Years and over | 33 (27.7%) | 34 (57.6%) |
Disability Class by Sex by Age in East Gaffney
Disability Class: Hearing Difficulty
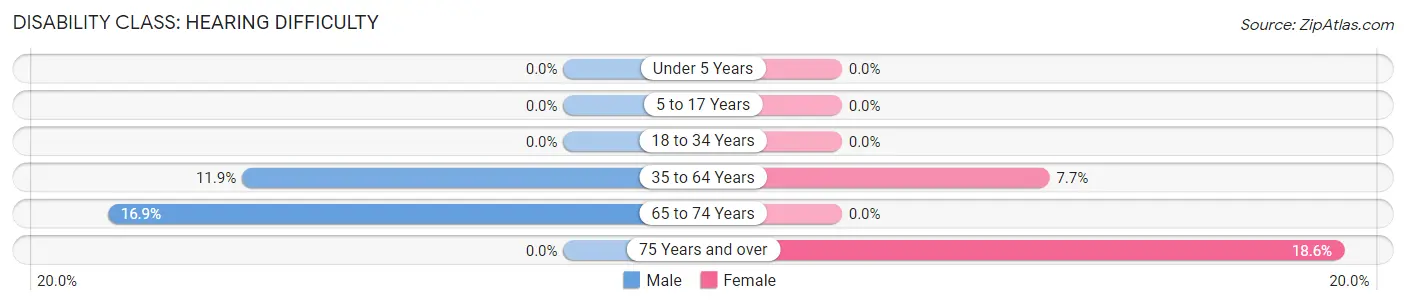
| Age Bracket | Male | Female |
| Under 5 Years | 0 (0.0%) | 0 (0.0%) |
| 5 to 17 Years | 0 (0.0%) | 0 (0.0%) |
| 18 to 34 Years | 0 (0.0%) | 0 (0.0%) |
| 35 to 64 Years | 73 (11.9%) | 46 (7.7%) |
| 65 to 74 Years | 23 (16.9%) | 0 (0.0%) |
| 75 Years and over | 0 (0.0%) | 11 (18.6%) |
Disability Class: Vision Difficulty
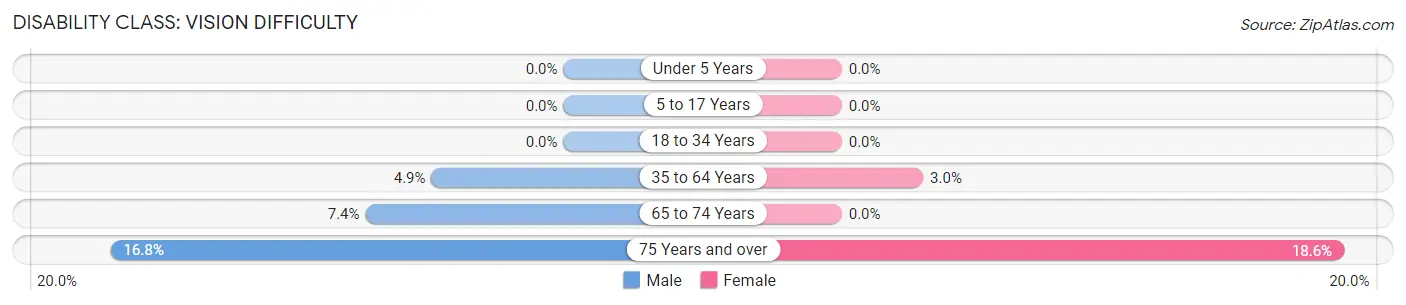
| Age Bracket | Male | Female |
| Under 5 Years | 0 (0.0%) | 0 (0.0%) |
| 5 to 17 Years | 0 (0.0%) | 0 (0.0%) |
| 18 to 34 Years | 0 (0.0%) | 0 (0.0%) |
| 35 to 64 Years | 30 (4.9%) | 18 (3.0%) |
| 65 to 74 Years | 10 (7.3%) | 0 (0.0%) |
| 75 Years and over | 20 (16.8%) | 11 (18.6%) |
Disability Class: Cognitive Difficulty
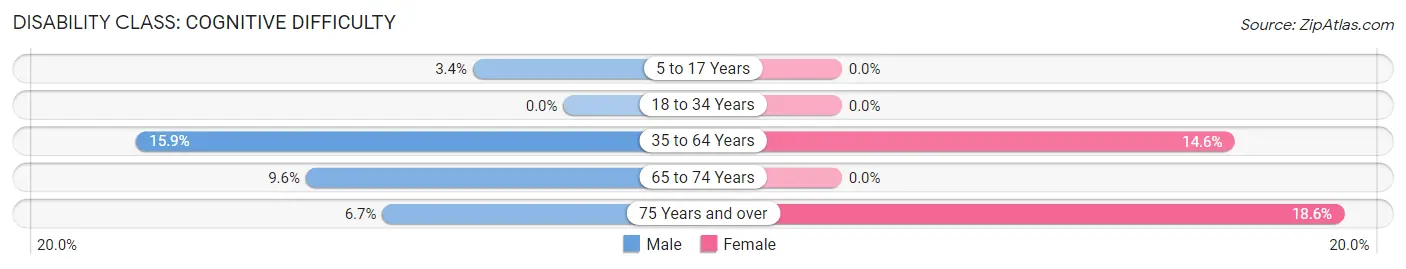
| Age Bracket | Male | Female |
| 5 to 17 Years | 10 (3.4%) | 0 (0.0%) |
| 18 to 34 Years | 0 (0.0%) | 0 (0.0%) |
| 35 to 64 Years | 97 (15.9%) | 87 (14.6%) |
| 65 to 74 Years | 13 (9.6%) | 0 (0.0%) |
| 75 Years and over | 8 (6.7%) | 11 (18.6%) |
Disability Class: Ambulatory Difficulty
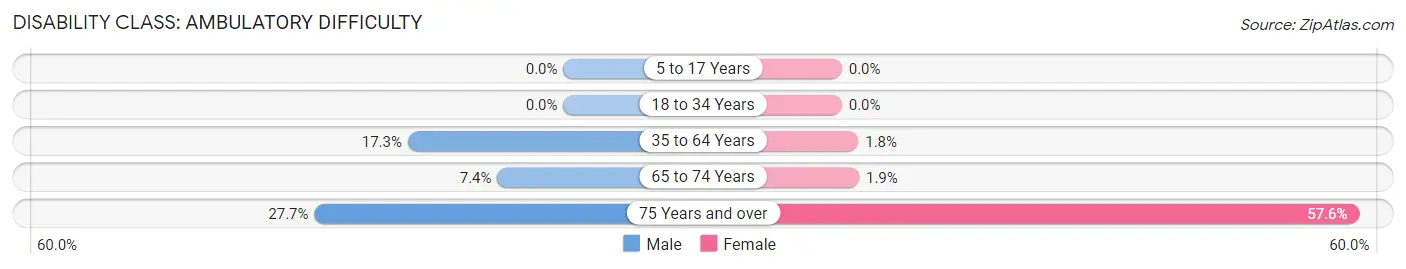
| Age Bracket | Male | Female |
| 5 to 17 Years | 0 (0.0%) | 0 (0.0%) |
| 18 to 34 Years | 0 (0.0%) | 0 (0.0%) |
| 35 to 64 Years | 106 (17.3%) | 11 (1.8%) |
| 65 to 74 Years | 10 (7.3%) | 6 (1.9%) |
| 75 Years and over | 33 (27.7%) | 34 (57.6%) |
Disability Class: Self-Care Difficulty
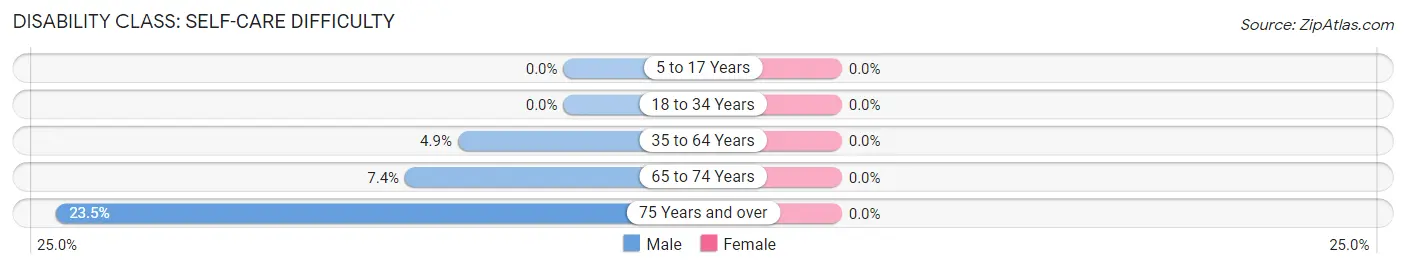
| Age Bracket | Male | Female |
| 5 to 17 Years | 0 (0.0%) | 0 (0.0%) |
| 18 to 34 Years | 0 (0.0%) | 0 (0.0%) |
| 35 to 64 Years | 30 (4.9%) | 0 (0.0%) |
| 65 to 74 Years | 10 (7.3%) | 0 (0.0%) |
| 75 Years and over | 28 (23.5%) | 0 (0.0%) |
Technology Access in East Gaffney
Computing Device Access in East Gaffney
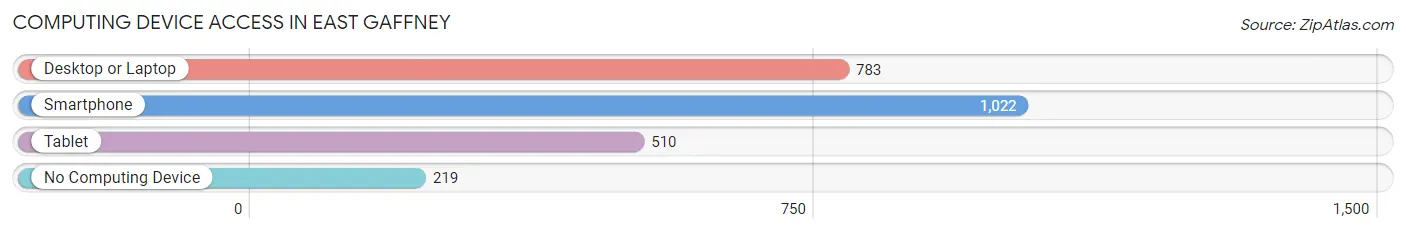
| Device Type | # Households | % Households |
| Desktop or Laptop | 783 | 59.1% |
| Smartphone | 1,022 | 77.1% |
| Tablet | 510 | 38.5% |
| No Computing Device | 219 | 16.5% |
| Total | 1,325 | 100.0% |
Internet Access in East Gaffney
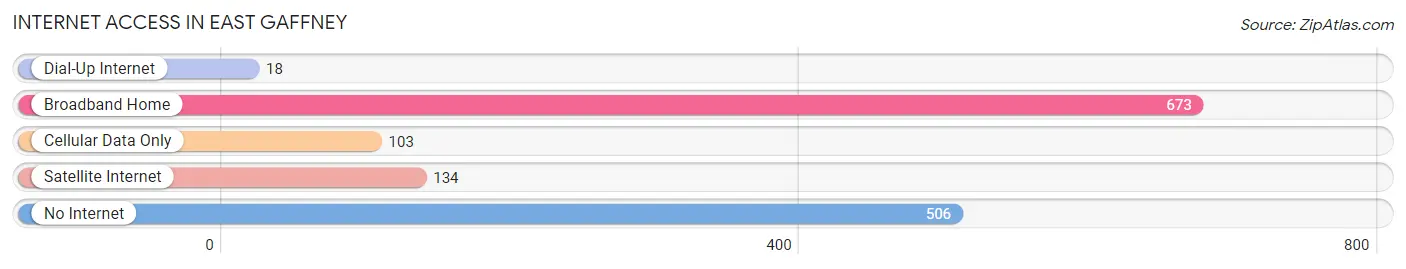
| Internet Type | # Households | % Households |
| Dial-Up Internet | 18 | 1.4% |
| Broadband Home | 673 | 50.8% |
| Cellular Data Only | 103 | 7.8% |
| Satellite Internet | 134 | 10.1% |
| No Internet | 506 | 38.2% |
| Total | 1,325 | 100.0% |
East Gaffney Summary
East Gaffney is a small town located in Cherokee County, South Carolina. It is situated in the foothills of the Blue Ridge Mountains, approximately 25 miles west of Charlotte, North Carolina. The town is home to approximately 4,000 people and is part of the larger Gaffney metropolitan area.
History
East Gaffney was founded in 1872 by a group of settlers from the nearby town of Gaffney. The town was originally known as “East Gaffney” due to its location east of the original Gaffney settlement. The town was incorporated in 1887 and has remained a small, rural community ever since.
The town was originally a farming community, with cotton and tobacco being the primary crops. In the early 1900s, the town began to diversify its economy with the establishment of several small manufacturing plants. These included a cotton mill, a furniture factory, and a brickyard.
The town experienced a period of growth in the 1950s and 1960s, as the population increased and new businesses opened. The town was also home to a number of small retail stores, including a grocery store, a hardware store, and a drug store.
Geography
East Gaffney is located in the foothills of the Blue Ridge Mountains in Cherokee County, South Carolina. The town is situated at an elevation of 890 feet above sea level and is approximately 25 miles west of Charlotte, North Carolina.
The town is located in a rural area, with the nearest major city being Spartanburg, South Carolina, which is approximately 25 miles to the east. The town is also located near several lakes, including Lake Wylie, Lake Norman, and Lake Hartwell.
Economy
East Gaffney’s economy is largely based on manufacturing and agriculture. The town is home to several small manufacturing plants, including a cotton mill, a furniture factory, and a brickyard. The town is also home to several small retail stores, including a grocery store, a hardware store, and a drug store.
The town is also home to several farms, which produce a variety of crops, including cotton, tobacco, and soybeans. The town is also home to several small businesses, including restaurants, auto repair shops, and a variety of other services.
Demographics
As of the 2010 census, East Gaffney had a population of 4,000 people. The town is predominantly white, with approximately 75% of the population being white and 25% being African American. The town also has a small Hispanic population, with approximately 5% of the population being Hispanic.
The median household income in East Gaffney is approximately $35,000, which is slightly lower than the national average. The town also has a higher than average poverty rate, with approximately 20% of the population living below the poverty line.
Conclusion
East Gaffney is a small town located in Cherokee County, South Carolina. The town was founded in 1872 and has remained a small, rural community ever since. The town is situated in the foothills of the Blue Ridge Mountains and is home to approximately 4,000 people. The town’s economy is largely based on manufacturing and agriculture, with several small manufacturing plants and farms located in the area. The town is predominantly white, with approximately 75% of the population being white and 25% being African American. The median household income in East Gaffney is approximately $35,000, which is slightly lower than the national average.
Common Questions
What is Per Capita Income in East Gaffney?
Per Capita income in East Gaffney is $19,694.
What is the Median Family Income in East Gaffney?
Median Family Income in East Gaffney is $40,000.
What is the Median Household income in East Gaffney?
Median Household Income in East Gaffney is $30,758.
What is Income or Wage Gap in East Gaffney?
Income or Wage Gap in East Gaffney is 22.4%.
Women in East Gaffney earn 77.6 cents for every dollar earned by a man.
What is Inequality or Gini Index in East Gaffney?
Inequality or Gini Index in East Gaffney is 0.49.
What is the Total Population of East Gaffney?
Total Population of East Gaffney is 2,972.
What is the Total Male Population of East Gaffney?
Total Male Population of East Gaffney is 1,468.
What is the Total Female Population of East Gaffney?
Total Female Population of East Gaffney is 1,504.
What is the Ratio of Males per 100 Females in East Gaffney?
There are 97.61 Males per 100 Females in East Gaffney.
What is the Ratio of Females per 100 Males in East Gaffney?
There are 102.45 Females per 100 Males in East Gaffney.
What is the Median Population Age in East Gaffney?
Median Population Age in East Gaffney is 43.8 Years.
What is the Average Family Size in East Gaffney
Average Family Size in East Gaffney is 3.3 People.
What is the Average Household Size in East Gaffney
Average Household Size in East Gaffney is 2.2 People.
How Large is the Labor Force in East Gaffney?
There are 1,167 People in the Labor Forcein in East Gaffney.
What is the Percentage of People in the Labor Force in East Gaffney?
48.9% of People are in the Labor Force in East Gaffney.
What is the Unemployment Rate in East Gaffney?
Unemployment Rate in East Gaffney is 3.6%.