Zip Codes with the Highest Percentage of Population Employed in Security & Protection in Conway, SC
RELATED REPORTS & OPTIONS
Security & Protection
Conway
Compare Zip Codes
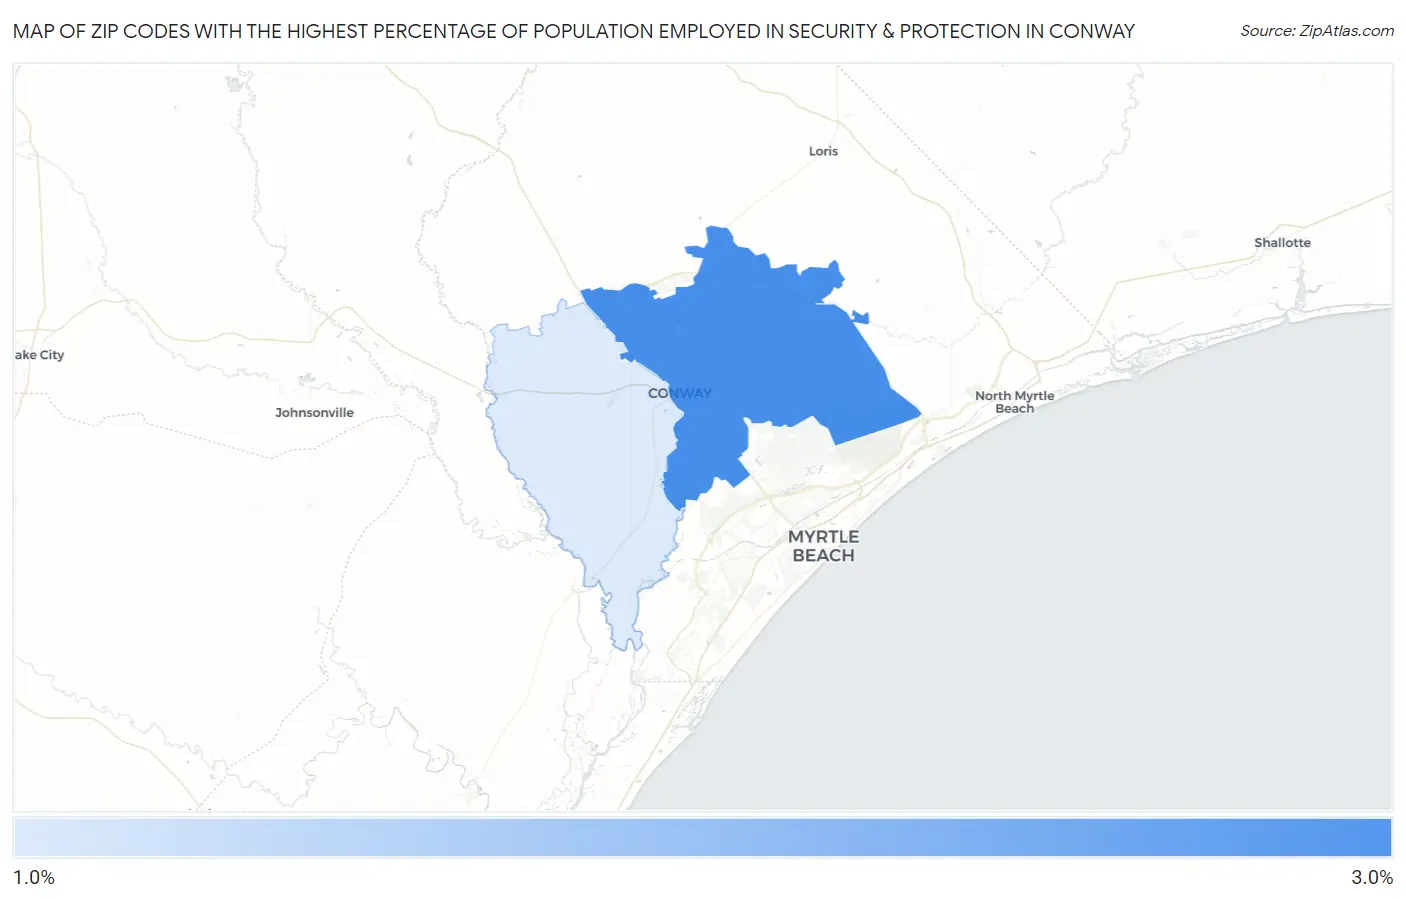
Map of Zip Codes with the Highest Percentage of Population Employed in Security & Protection in Conway
1.6%
2.9%
Zip Codes with the Highest Percentage of Population Employed in Security & Protection in Conway, SC
| Zip Code | % Employed | vs State | vs National | |
| 1. | 29526 | 2.9% | 2.1%(+0.800)#106 | 2.1%(+0.752)#7,635 |
| 2. | 29527 | 1.6% | 2.1%(-0.547)#226 | 2.1%(-0.595)#15,778 |
1
Common Questions
What are the Top Zip Codes with the Highest Percentage of Population Employed in Security & Protection in Conway, SC?
Top Zip Codes with the Highest Percentage of Population Employed in Security & Protection in Conway, SC are:
What zip code has the Highest Percentage of Population Employed in Security & Protection in Conway, SC?
29526 has the Highest Percentage of Population Employed in Security & Protection in Conway, SC with 2.9%.
What is the Percentage of Population Employed in Security & Protection in Conway, SC?
Percentage of Population Employed in Security & Protection in Conway is 1.6%.
What is the Percentage of Population Employed in Security & Protection in South Carolina?
Percentage of Population Employed in Security & Protection in South Carolina is 2.1%.
What is the Percentage of Population Employed in Security & Protection in the United States?
Percentage of Population Employed in Security & Protection in the United States is 2.1%.