Bonneau Beach, SC Map & Demographics
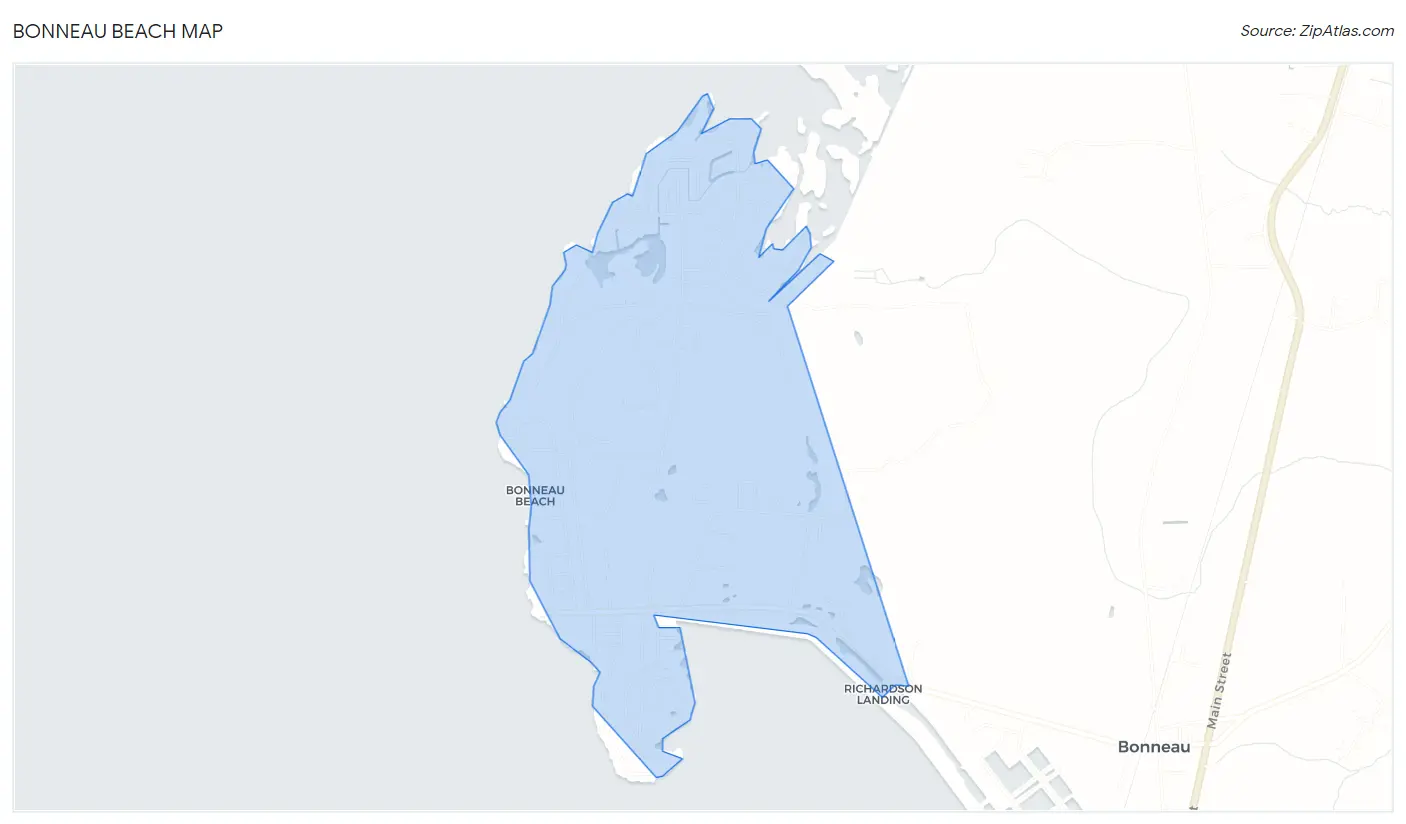
Bonneau Beach Map
Bonneau Beach Overview
$34,816
PER CAPITA INCOME
$63,413
AVG FAMILY INCOME
$56,635
AVG HOUSEHOLD INCOME
50.5%
WAGE / INCOME GAP [ % ]
49.5¢/ $1
WAGE / INCOME GAP [ $ ]
0.44
INEQUALITY / GINI INDEX
1,500
TOTAL POPULATION
821
MALE POPULATION
679
FEMALE POPULATION
120.91
MALES / 100 FEMALES
82.70
FEMALES / 100 MALES
57.9
MEDIAN AGE
2.6
AVG FAMILY SIZE
2.2
AVG HOUSEHOLD SIZE
488
LABOR FORCE [ PEOPLE ]
38.1%
PERCENT IN LABOR FORCE
Income in Bonneau Beach
Income Overview in Bonneau Beach
Per Capita Income in Bonneau Beach is $34,816, while median incomes of families and households are $63,413 and $56,635 respectively.
| Characteristic | Number | Measure |
| Per Capita Income | 1,500 | $34,816 |
| Median Family Income | 477 | $63,413 |
| Mean Family Income | 477 | $77,119 |
| Median Household Income | 696 | $56,635 |
| Mean Household Income | 696 | $74,817 |
| Income Deficit | 477 | $0 |
| Wage / Income Gap (%) | 1,500 | 50.49% |
| Wage / Income Gap ($) | 1,500 | 49.51¢ per $1 |
| Gini / Inequality Index | 1,500 | 0.44 |
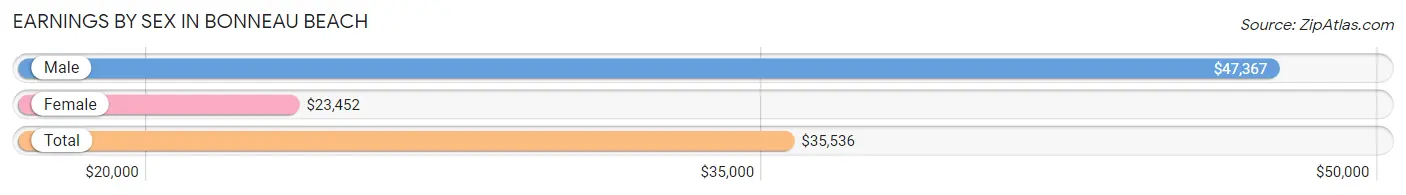
Earnings by Sex in Bonneau Beach
Average Earnings in Bonneau Beach are $35,536, $47,367 for men and $23,452 for women, a difference of 50.5%.
| Sex | Number | Average Earnings |
| Male | 281 (49.0%) | $47,367 |
| Female | 292 (51.0%) | $23,452 |
| Total | 573 (100.0%) | $35,536 |
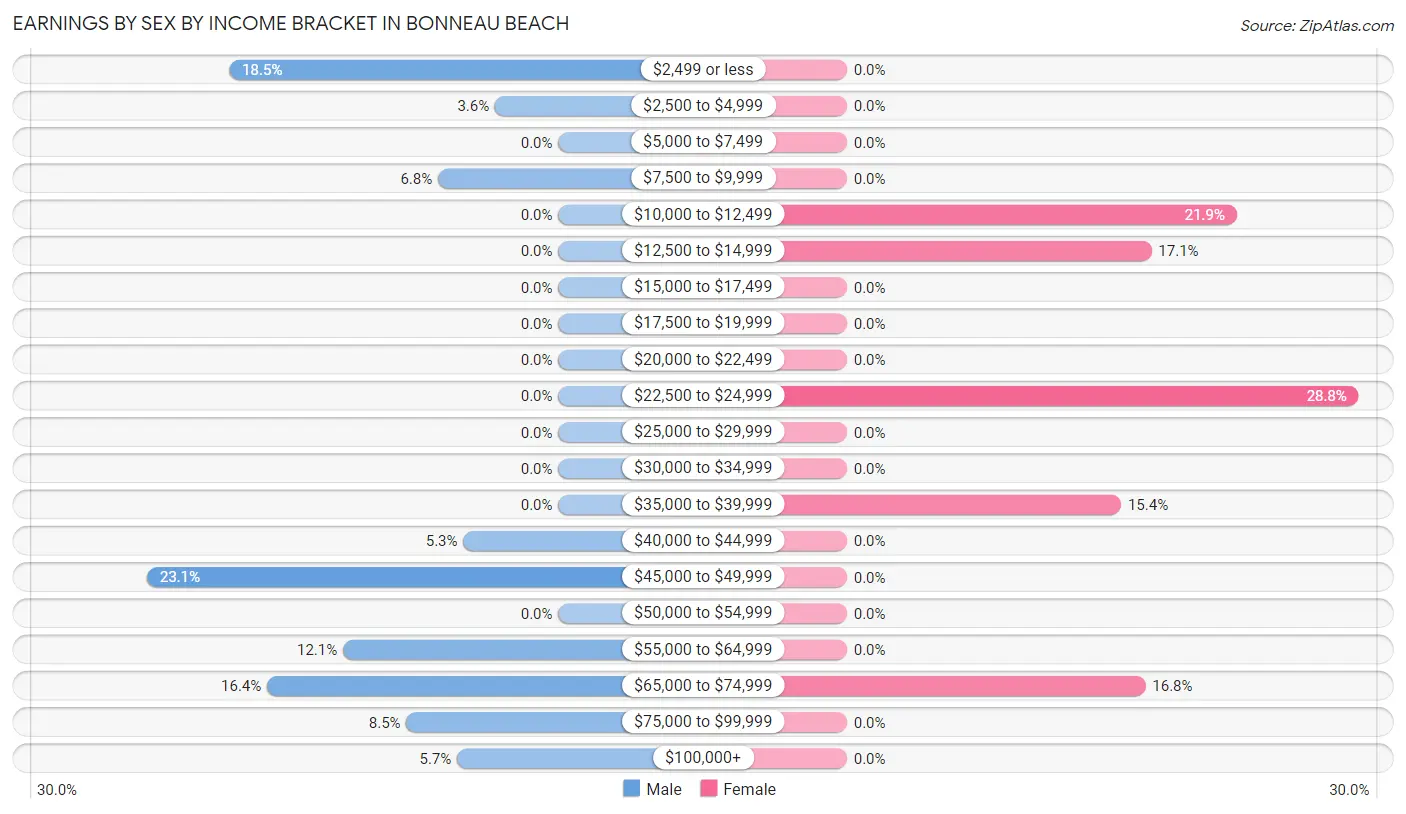
Earnings by Sex by Income Bracket in Bonneau Beach
The most common earnings brackets in Bonneau Beach are $45,000 to $49,999 for men (65 | 23.1%) and $22,500 to $24,999 for women (84 | 28.8%).
| Income | Male | Female |
| $2,499 or less | 52 (18.5%) | 0 (0.0%) |
| $2,500 to $4,999 | 10 (3.6%) | 0 (0.0%) |
| $5,000 to $7,499 | 0 (0.0%) | 0 (0.0%) |
| $7,500 to $9,999 | 19 (6.8%) | 0 (0.0%) |
| $10,000 to $12,499 | 0 (0.0%) | 64 (21.9%) |
| $12,500 to $14,999 | 0 (0.0%) | 50 (17.1%) |
| $15,000 to $17,499 | 0 (0.0%) | 0 (0.0%) |
| $17,500 to $19,999 | 0 (0.0%) | 0 (0.0%) |
| $20,000 to $22,499 | 0 (0.0%) | 0 (0.0%) |
| $22,500 to $24,999 | 0 (0.0%) | 84 (28.8%) |
| $25,000 to $29,999 | 0 (0.0%) | 0 (0.0%) |
| $30,000 to $34,999 | 0 (0.0%) | 0 (0.0%) |
| $35,000 to $39,999 | 0 (0.0%) | 45 (15.4%) |
| $40,000 to $44,999 | 15 (5.3%) | 0 (0.0%) |
| $45,000 to $49,999 | 65 (23.1%) | 0 (0.0%) |
| $50,000 to $54,999 | 0 (0.0%) | 0 (0.0%) |
| $55,000 to $64,999 | 34 (12.1%) | 0 (0.0%) |
| $65,000 to $74,999 | 46 (16.4%) | 49 (16.8%) |
| $75,000 to $99,999 | 24 (8.5%) | 0 (0.0%) |
| $100,000+ | 16 (5.7%) | 0 (0.0%) |
| Total | 281 (100.0%) | 292 (100.0%) |
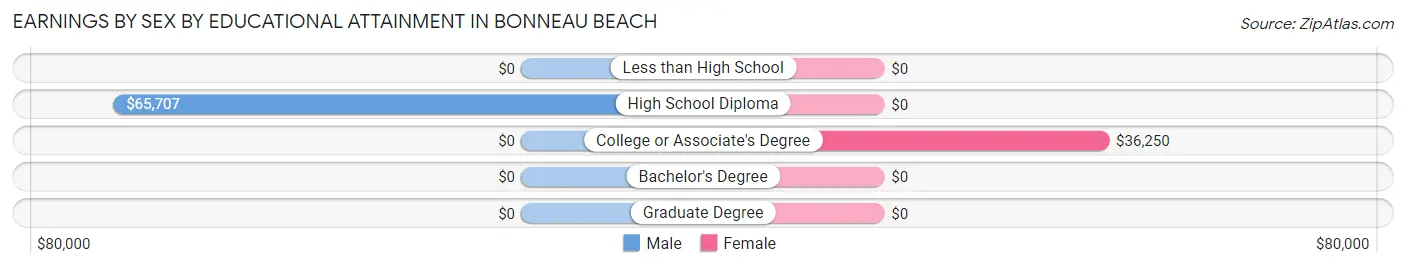
Earnings by Sex by Educational Attainment in Bonneau Beach
Average earnings in Bonneau Beach are $49,583 for men and $23,452 for women, a difference of 52.7%. Men with an educational attainment of high school diploma enjoy the highest average annual earnings of $65,707, while those with high school diploma education earn the least with $65,707. Women with an educational attainment of college or associate's degree earn the most with the average annual earnings of $36,250, while those with college or associate's degree education have the smallest earnings of $36,250.
| Educational Attainment | Male Income | Female Income |
| Less than High School | - | - |
| High School Diploma | $65,707 | $0 |
| College or Associate's Degree | - | - |
| Bachelor's Degree | - | - |
| Graduate Degree | - | - |
| Total | $49,583 | $23,452 |
Family Income in Bonneau Beach
Family Income Brackets in Bonneau Beach
According to the Bonneau Beach family income data, there are 146 families falling into the $100,000 to $149,999 income range, which is the most common income bracket and makes up 30.6% of all families.
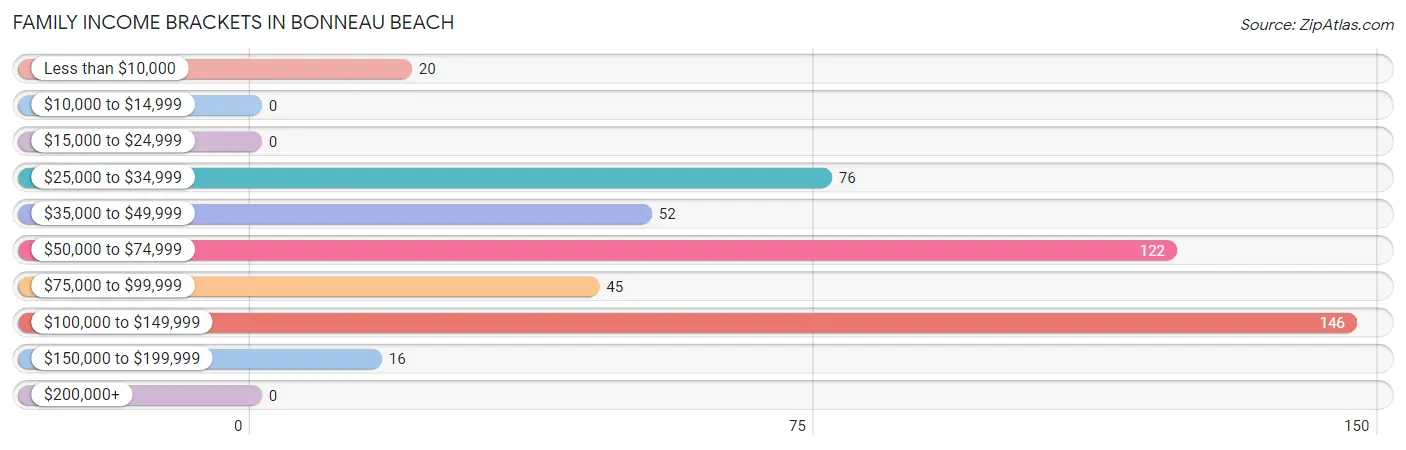
| Income Bracket | # Families | % Families |
| Less than $10,000 | 20 | 4.2% |
| $10,000 to $14,999 | 0 | 0.0% |
| $15,000 to $24,999 | 0 | 0.0% |
| $25,000 to $34,999 | 76 | 15.9% |
| $35,000 to $49,999 | 52 | 10.9% |
| $50,000 to $74,999 | 122 | 25.6% |
| $75,000 to $99,999 | 45 | 9.4% |
| $100,000 to $149,999 | 146 | 30.6% |
| $150,000 to $199,999 | 16 | 3.4% |
| $200,000+ | 0 | 0.0% |
Family Income by Famaliy Size in Bonneau Beach
3-person families (76 | 15.9%) account for the highest median family income in Bonneau Beach with $80,268 per family, while 3-person families (76 | 15.9%) have the highest median income of $26,756 per family member.
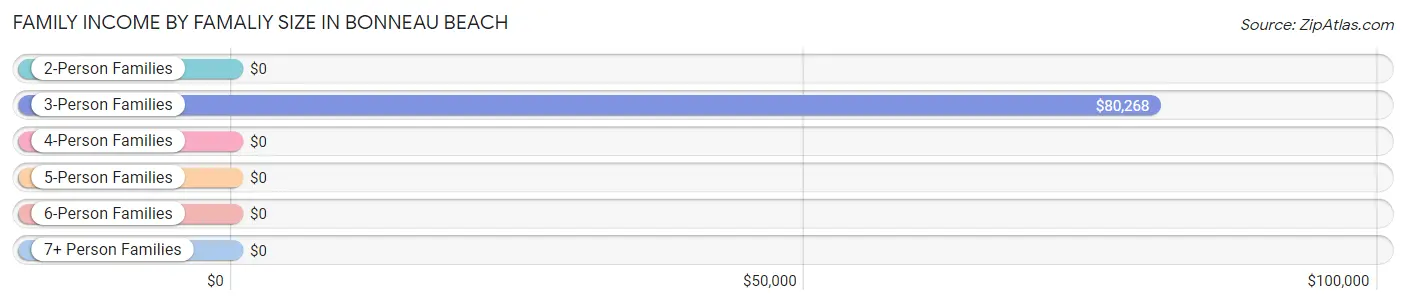
| Income Bracket | # Families | Median Income |
| 2-Person Families | 349 (73.2%) | $0 |
| 3-Person Families | 76 (15.9%) | $80,268 |
| 4-Person Families | 17 (3.6%) | $0 |
| 5-Person Families | 0 (0.0%) | $0 |
| 6-Person Families | 35 (7.3%) | $0 |
| 7+ Person Families | 0 (0.0%) | $0 |
| Total | 477 (100.0%) | $63,413 |
Family Income by Number of Earners in Bonneau Beach
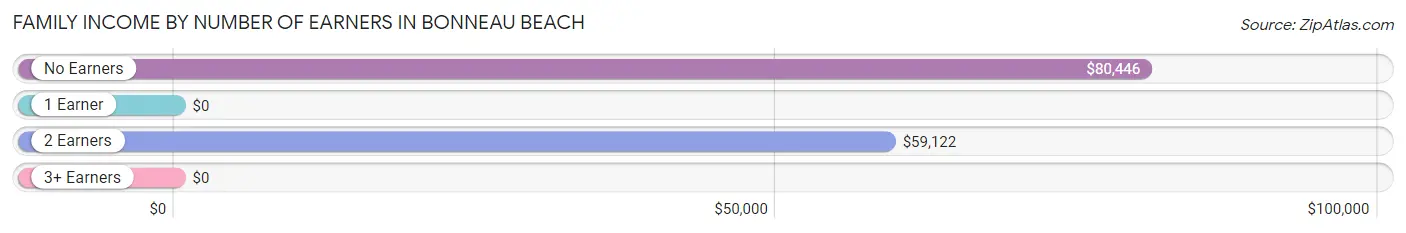
| Number of Earners | # Families | Median Income |
| No Earners | 170 (35.6%) | $80,446 |
| 1 Earner | 138 (28.9%) | $0 |
| 2 Earners | 169 (35.4%) | $59,122 |
| 3+ Earners | 0 (0.0%) | $0 |
| Total | 477 (100.0%) | $63,413 |
Household Income in Bonneau Beach
Household Income Brackets in Bonneau Beach
With 178 households falling in the category, the $100,000 to $149,999 income range is the most frequent in Bonneau Beach, accounting for 25.6% of all households.
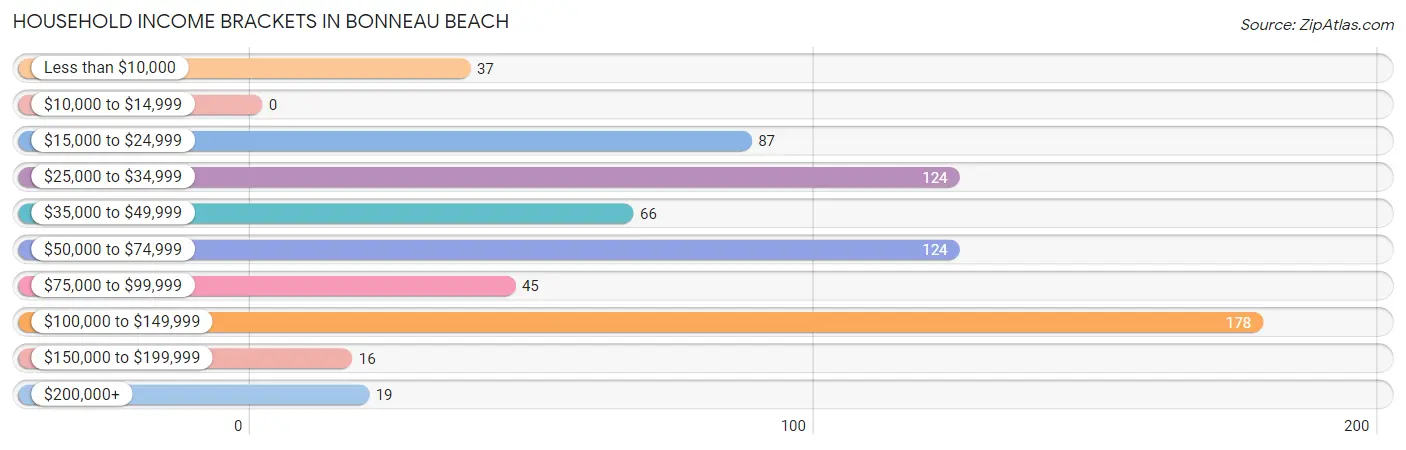
| Income Bracket | # Households | % Households |
| Less than $10,000 | 37 | 5.3% |
| $10,000 to $14,999 | 0 | 0.0% |
| $15,000 to $24,999 | 87 | 12.5% |
| $25,000 to $34,999 | 124 | 17.8% |
| $35,000 to $49,999 | 66 | 9.5% |
| $50,000 to $74,999 | 124 | 17.8% |
| $75,000 to $99,999 | 45 | 6.5% |
| $100,000 to $149,999 | 178 | 25.6% |
| $150,000 to $199,999 | 16 | 2.3% |
| $200,000+ | 19 | 2.7% |
Household Income by Householder Age in Bonneau Beach
The median household income in Bonneau Beach is $56,635, with the highest median household income of $127,525 found in the 45 to 64 years age bracket for the primary householder. A total of 217 households (31.2%) fall into this category.
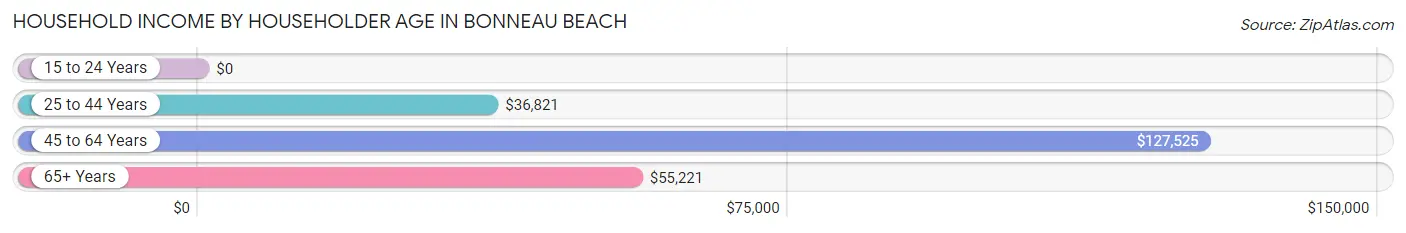
| Income Bracket | # Households | Median Income |
| 15 to 24 Years | 0 (0.0%) | $0 |
| 25 to 44 Years | 85 (12.2%) | $36,821 |
| 45 to 64 Years | 217 (31.2%) | $127,525 |
| 65+ Years | 394 (56.6%) | $55,221 |
| Total | 696 (100.0%) | $56,635 |
Poverty in Bonneau Beach
Income Below Poverty by Sex and Age in Bonneau Beach
With 19.8% poverty level for males and 19.6% for females among the residents of Bonneau Beach, 35 to 44 year old males and 5 year old females are the most vulnerable to poverty, with 17 males (100.0%) and 44 females (100.0%) in their respective age groups living below the poverty level.
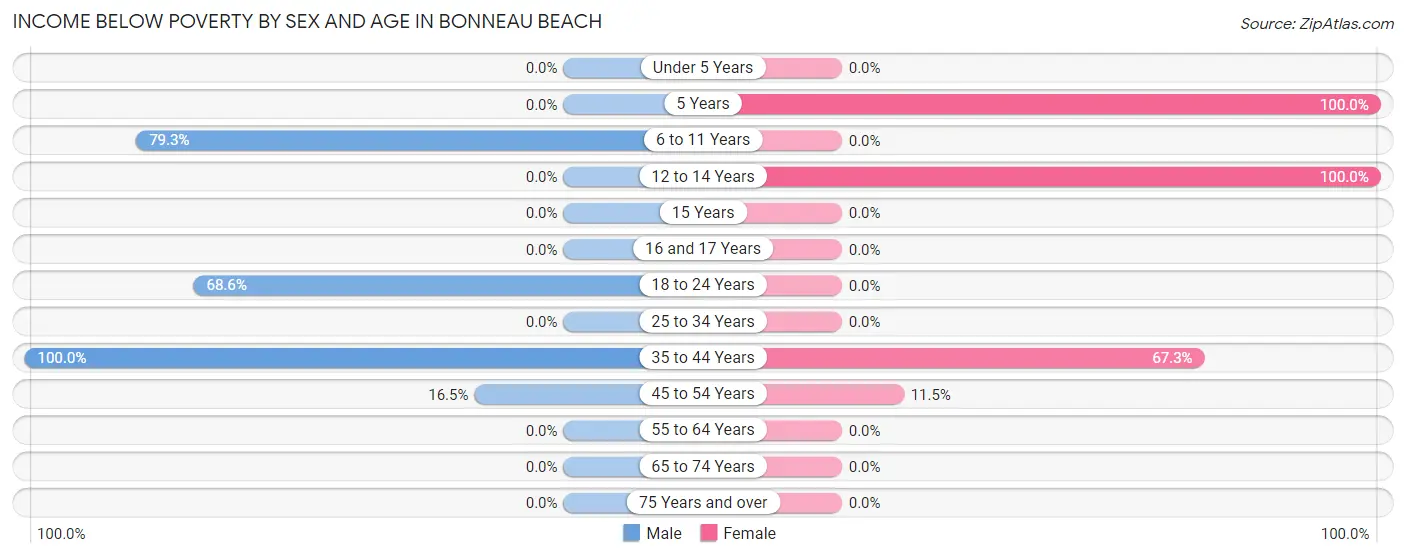
| Age Bracket | Male | Female |
| Under 5 Years | 0 (0.0%) | 0 (0.0%) |
| 5 Years | 0 (0.0%) | 44 (100.0%) |
| 6 to 11 Years | 88 (79.3%) | 0 (0.0%) |
| 12 to 14 Years | 0 (0.0%) | 44 (100.0%) |
| 15 Years | 0 (0.0%) | 0 (0.0%) |
| 16 and 17 Years | 0 (0.0%) | 0 (0.0%) |
| 18 to 24 Years | 35 (68.6%) | 0 (0.0%) |
| 25 to 34 Years | 0 (0.0%) | 0 (0.0%) |
| 35 to 44 Years | 17 (100.0%) | 35 (67.3%) |
| 45 to 54 Years | 20 (16.5%) | 10 (11.5%) |
| 55 to 64 Years | 0 (0.0%) | 0 (0.0%) |
| 65 to 74 Years | 0 (0.0%) | 0 (0.0%) |
| 75 Years and over | 0 (0.0%) | 0 (0.0%) |
| Total | 160 (19.8%) | 133 (19.6%) |
Income Above Poverty by Sex and Age in Bonneau Beach
According to the poverty statistics in Bonneau Beach, males aged 25 to 34 years and females aged 6 to 11 years are the age groups that are most secure financially, with 100.0% of males and 100.0% of females in these age groups living above the poverty line.
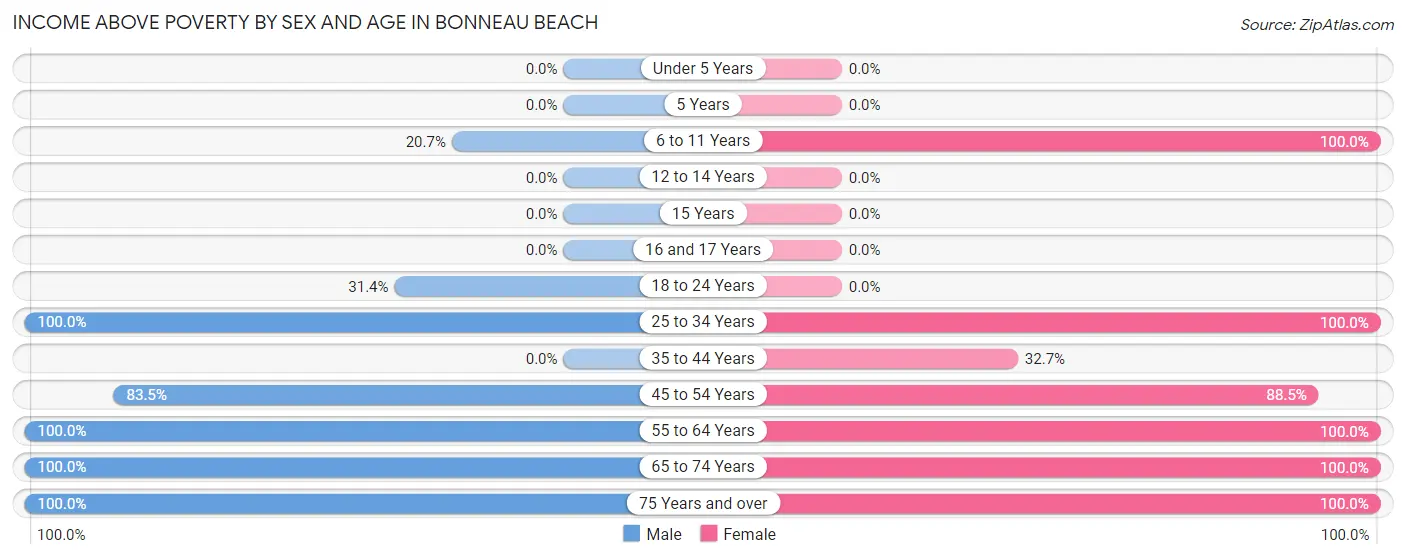
| Age Bracket | Male | Female |
| Under 5 Years | 0 (0.0%) | 0 (0.0%) |
| 5 Years | 0 (0.0%) | 0 (0.0%) |
| 6 to 11 Years | 23 (20.7%) | 7 (100.0%) |
| 12 to 14 Years | 0 (0.0%) | 0 (0.0%) |
| 15 Years | 0 (0.0%) | 0 (0.0%) |
| 16 and 17 Years | 0 (0.0%) | 0 (0.0%) |
| 18 to 24 Years | 16 (31.4%) | 0 (0.0%) |
| 25 to 34 Years | 16 (100.0%) | 7 (100.0%) |
| 35 to 44 Years | 0 (0.0%) | 17 (32.7%) |
| 45 to 54 Years | 101 (83.5%) | 77 (88.5%) |
| 55 to 64 Years | 156 (100.0%) | 152 (100.0%) |
| 65 to 74 Years | 147 (100.0%) | 187 (100.0%) |
| 75 Years and over | 190 (100.0%) | 99 (100.0%) |
| Total | 649 (80.2%) | 546 (80.4%) |
Income Below Poverty Among Married-Couple Families in Bonneau Beach
The poverty statistics for married-couple families in Bonneau Beach show that 4.7% or 20 of the total 426 families live below the poverty line. Families with no children have the highest poverty rate of 4.9%, comprising of 20 families. On the other hand, families with 1 or 2 children have the lowest poverty rate of 0.0%, which includes 0 families.
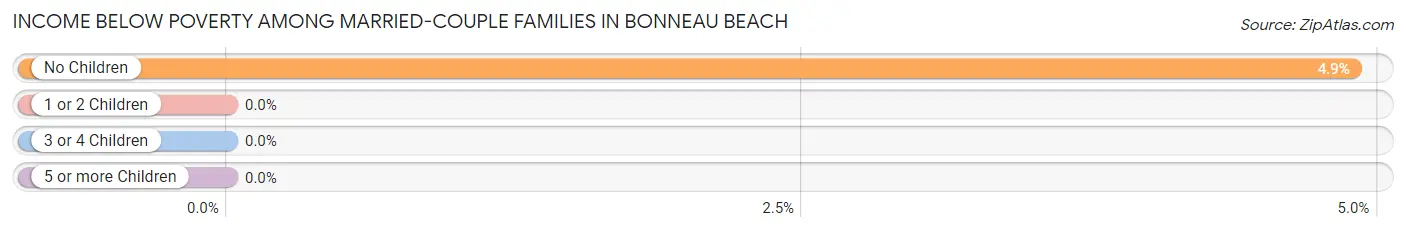
| Children | Above Poverty | Below Poverty |
| No Children | 389 (95.1%) | 20 (4.9%) |
| 1 or 2 Children | 17 (100.0%) | 0 (0.0%) |
| 3 or 4 Children | 0 (0.0%) | 0 (0.0%) |
| 5 or more Children | 0 (0.0%) | 0 (0.0%) |
| Total | 406 (95.3%) | 20 (4.7%) |
Income Below Poverty Among Single-Parent Households in Bonneau Beach
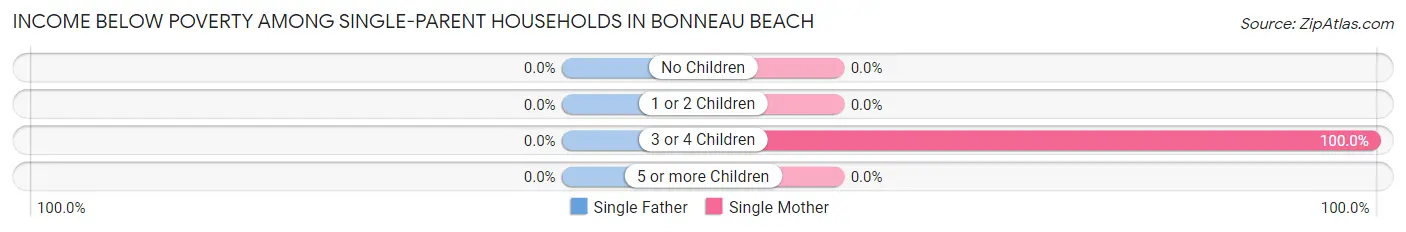
| Children | Single Father | Single Mother |
| No Children | 0 (0.0%) | 0 (0.0%) |
| 1 or 2 Children | 0 (0.0%) | 0 (0.0%) |
| 3 or 4 Children | 0 (0.0%) | 35 (100.0%) |
| 5 or more Children | 0 (0.0%) | 0 (0.0%) |
| Total | 0 (0.0%) | 35 (100.0%) |
Income Below Poverty Among Married-Couple vs Single-Parent Households in Bonneau Beach
The poverty data for Bonneau Beach shows that 20 of the married-couple family households (4.7%) and 35 of the single-parent households (68.6%) are living below the poverty level. Within the married-couple family households, those with no children have the highest poverty rate, with 20 households (4.9%) falling below the poverty line. Among the single-parent households, those with 3 or 4 children have the highest poverty rate, with 35 household (100.0%) living below poverty.
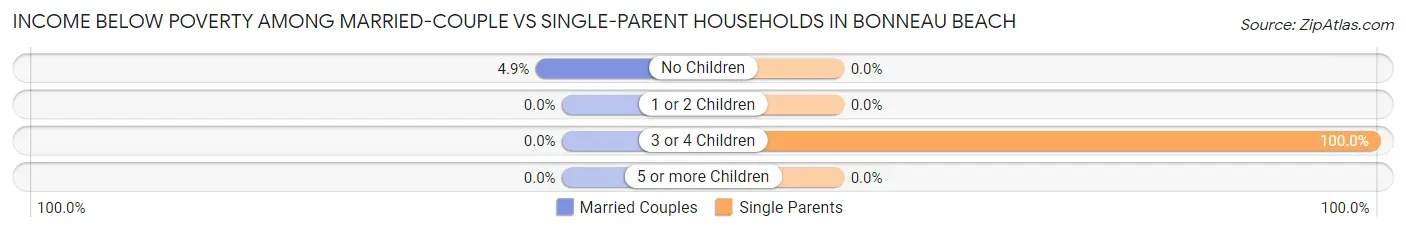
| Children | Married-Couple Families | Single-Parent Households |
| No Children | 20 (4.9%) | 0 (0.0%) |
| 1 or 2 Children | 0 (0.0%) | 0 (0.0%) |
| 3 or 4 Children | 0 (0.0%) | 35 (100.0%) |
| 5 or more Children | 0 (0.0%) | 0 (0.0%) |
| Total | 20 (4.7%) | 35 (68.6%) |
Race in Bonneau Beach
The most populous races in Bonneau Beach are White / Caucasian (1,089 | 72.6%), Black / African American (246 | 16.4%), and Two or more Races (84 | 5.6%).
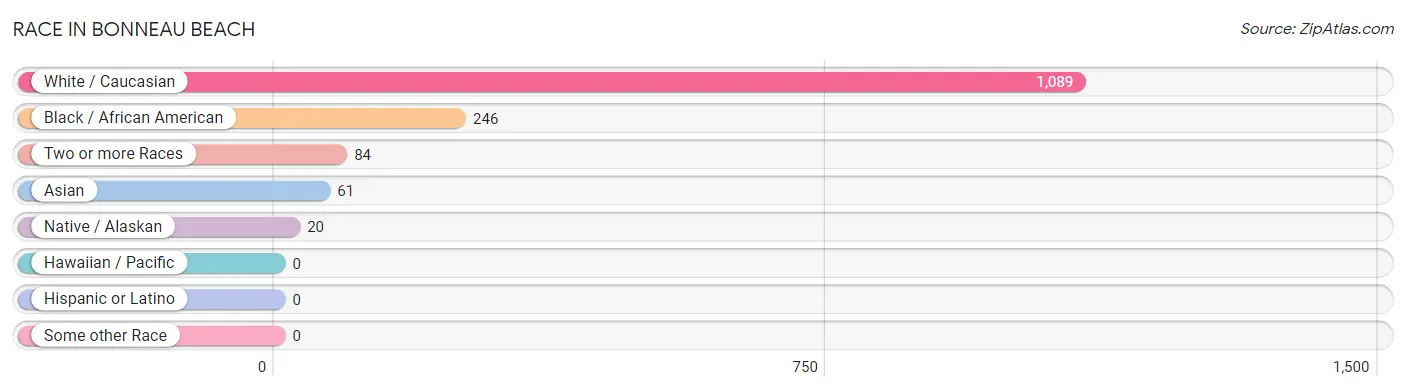
| Race | # Population | % Population |
| Asian | 61 | 4.1% |
| Black / African American | 246 | 16.4% |
| Hawaiian / Pacific | 0 | 0.0% |
| Hispanic or Latino | 0 | 0.0% |
| Native / Alaskan | 20 | 1.3% |
| White / Caucasian | 1,089 | 72.6% |
| Two or more Races | 84 | 5.6% |
| Some other Race | 0 | 0.0% |
| Total | 1,500 | 100.0% |
Ancestry in Bonneau Beach
The most populous ancestries reported in Bonneau Beach are English (251 | 16.7%), American (165 | 11.0%), French (79 | 5.3%), German (70 | 4.7%), and Italian (54 | 3.6%), together accounting for 41.3% of all Bonneau Beach residents.
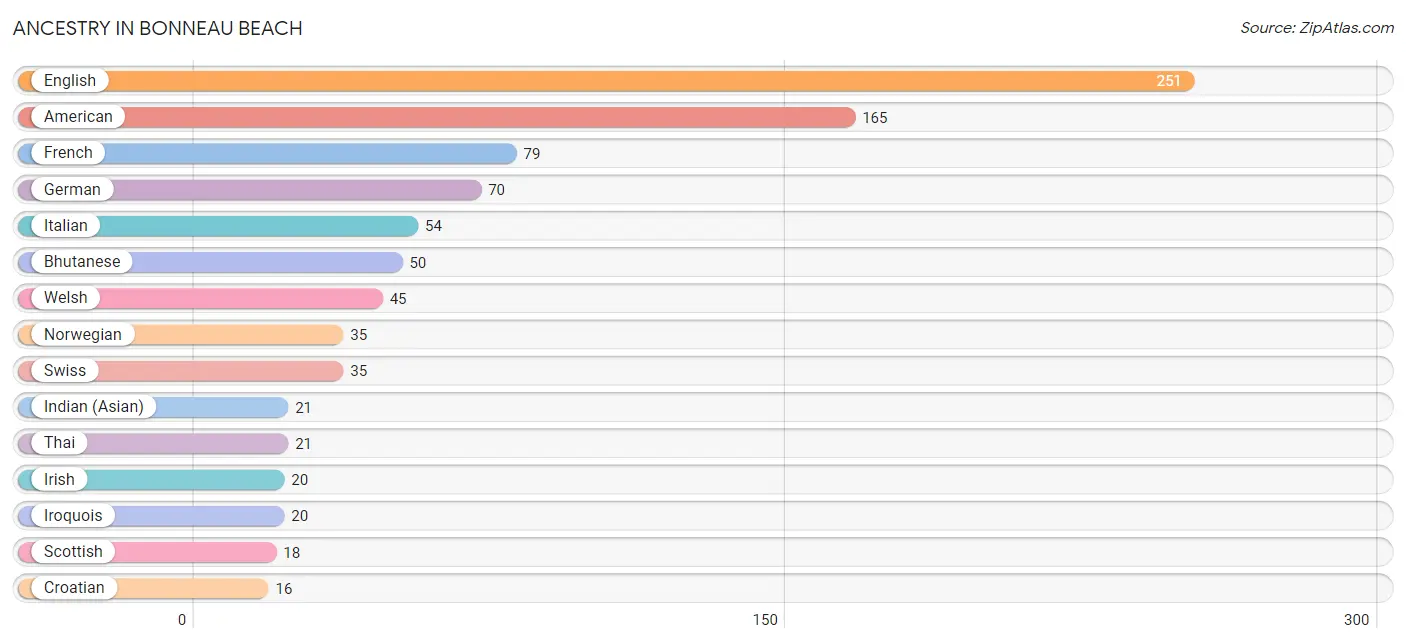
| Ancestry | # Population | % Population |
| American | 165 | 11.0% |
| Bhutanese | 50 | 3.3% |
| Croatian | 16 | 1.1% |
| English | 251 | 16.7% |
| French | 79 | 5.3% |
| German | 70 | 4.7% |
| Indian (Asian) | 21 | 1.4% |
| Irish | 20 | 1.3% |
| Iroquois | 20 | 1.3% |
| Italian | 54 | 3.6% |
| Korean | 12 | 0.8% |
| Norwegian | 35 | 2.3% |
| Scotch-Irish | 13 | 0.9% |
| Scottish | 18 | 1.2% |
| Swiss | 35 | 2.3% |
| Thai | 21 | 1.4% |
| Welsh | 45 | 3.0% | View All 17 Rows |
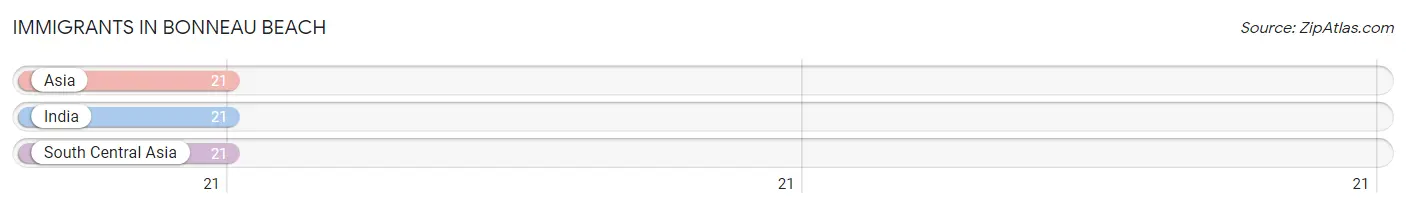
Immigrants in Bonneau Beach
The most numerous immigrant groups reported in Bonneau Beach came from Asia (21 | 1.4%), India (21 | 1.4%), and South Central Asia (21 | 1.4%), together accounting for 4.2% of all Bonneau Beach residents.
| Immigration Origin | # Population | % Population |
| Asia | 21 | 1.4% |
| India | 21 | 1.4% |
| South Central Asia | 21 | 1.4% | View All 3 Rows |
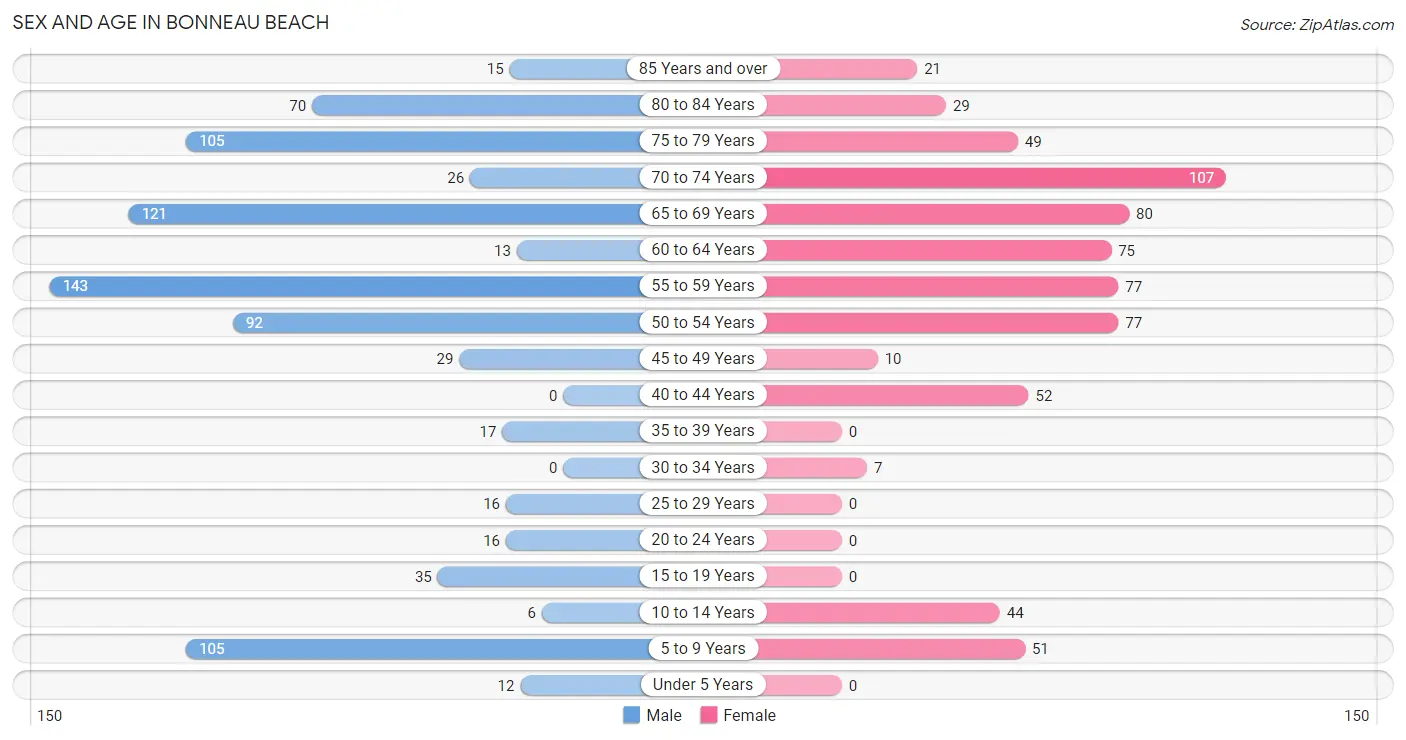
Sex and Age in Bonneau Beach
Sex and Age in Bonneau Beach
The most populous age groups in Bonneau Beach are 55 to 59 Years (143 | 17.4%) for men and 70 to 74 Years (107 | 15.8%) for women.
| Age Bracket | Male | Female |
| Under 5 Years | 12 (1.5%) | 0 (0.0%) |
| 5 to 9 Years | 105 (12.8%) | 51 (7.5%) |
| 10 to 14 Years | 6 (0.7%) | 44 (6.5%) |
| 15 to 19 Years | 35 (4.3%) | 0 (0.0%) |
| 20 to 24 Years | 16 (1.9%) | 0 (0.0%) |
| 25 to 29 Years | 16 (1.9%) | 0 (0.0%) |
| 30 to 34 Years | 0 (0.0%) | 7 (1.0%) |
| 35 to 39 Years | 17 (2.1%) | 0 (0.0%) |
| 40 to 44 Years | 0 (0.0%) | 52 (7.7%) |
| 45 to 49 Years | 29 (3.5%) | 10 (1.5%) |
| 50 to 54 Years | 92 (11.2%) | 77 (11.3%) |
| 55 to 59 Years | 143 (17.4%) | 77 (11.3%) |
| 60 to 64 Years | 13 (1.6%) | 75 (11.1%) |
| 65 to 69 Years | 121 (14.7%) | 80 (11.8%) |
| 70 to 74 Years | 26 (3.2%) | 107 (15.8%) |
| 75 to 79 Years | 105 (12.8%) | 49 (7.2%) |
| 80 to 84 Years | 70 (8.5%) | 29 (4.3%) |
| 85 Years and over | 15 (1.8%) | 21 (3.1%) |
| Total | 821 (100.0%) | 679 (100.0%) |
Families and Households in Bonneau Beach
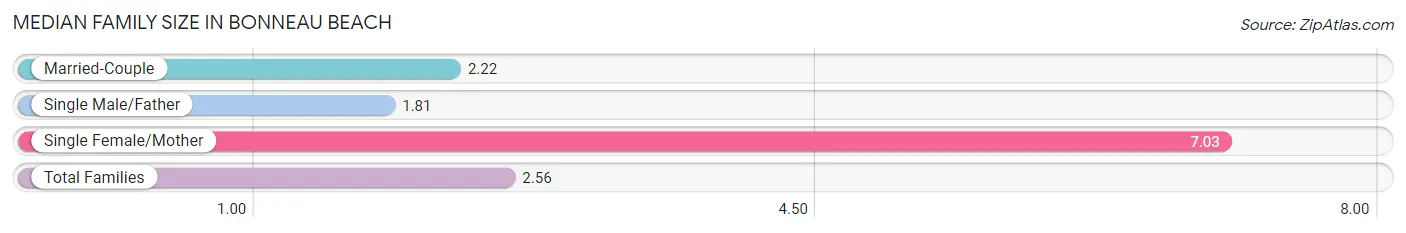
Median Family Size in Bonneau Beach
The median family size in Bonneau Beach is 2.56 persons per family, with single female/mother families (35 | 7.3%) accounting for the largest median family size of 7.03 persons per family. On the other hand, single male/father families (16 | 3.4%) represent the smallest median family size with 1.81 persons per family.
| Family Type | # Families | Family Size |
| Married-Couple | 426 (89.3%) | 2.22 |
| Single Male/Father | 16 (3.4%) | 1.81 |
| Single Female/Mother | 35 (7.3%) | 7.03 |
| Total Families | 477 (100.0%) | 2.56 |
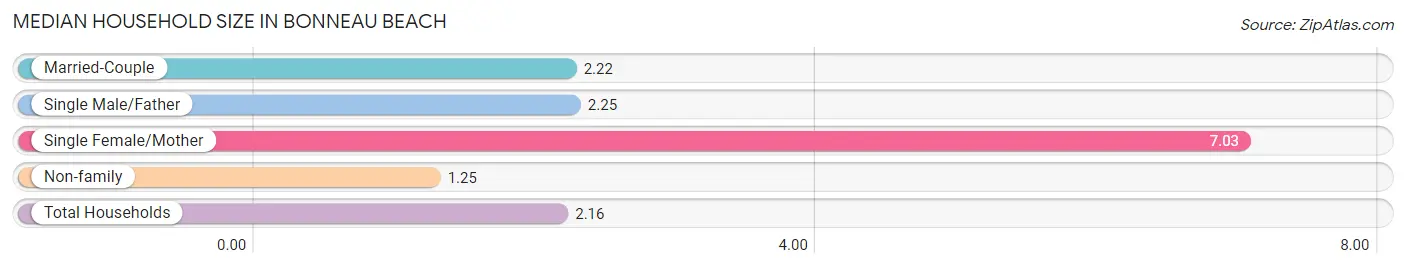
Median Household Size in Bonneau Beach
The median household size in Bonneau Beach is 2.16 persons per household, with single female/mother households (35 | 5.0%) accounting for the largest median household size of 7.03 persons per household. non-family households (219 | 31.5%) represent the smallest median household size with 1.25 persons per household.
| Household Type | # Households | Household Size |
| Married-Couple | 426 (61.2%) | 2.22 |
| Single Male/Father | 16 (2.3%) | 2.25 |
| Single Female/Mother | 35 (5.0%) | 7.03 |
| Non-family | 219 (31.5%) | 1.25 |
| Total Households | 696 (100.0%) | 2.16 |
Household Size by Marriage Status in Bonneau Beach
Out of a total of 696 households in Bonneau Beach, 477 (68.5%) are family households, while 219 (31.5%) are nonfamily households. The most numerous type of family households are 2-person households, comprising 349, and the most common type of nonfamily households are 1-person households, comprising 200.
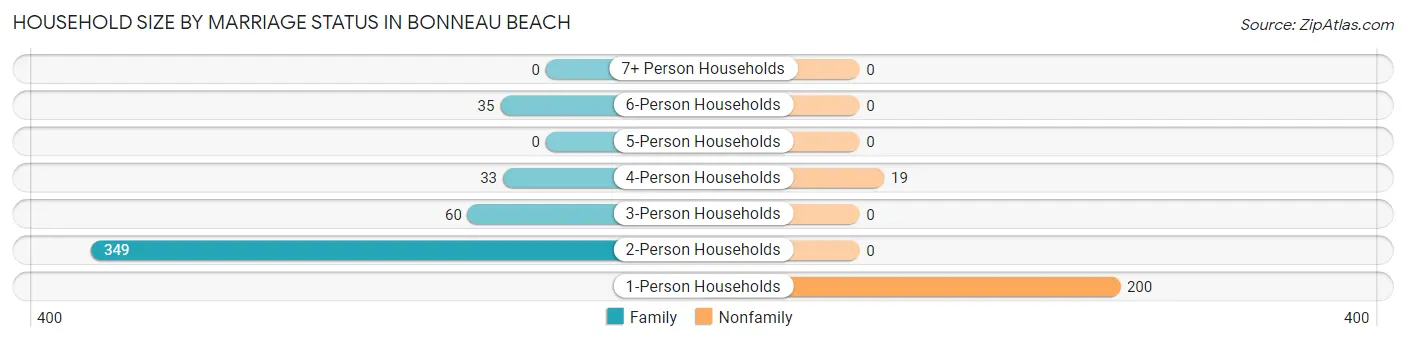
| Household Size | Family Households | Nonfamily Households |
| 1-Person Households | - | 200 (28.7%) |
| 2-Person Households | 349 (50.1%) | 0 (0.0%) |
| 3-Person Households | 60 (8.6%) | 0 (0.0%) |
| 4-Person Households | 33 (4.7%) | 19 (2.7%) |
| 5-Person Households | 0 (0.0%) | 0 (0.0%) |
| 6-Person Households | 35 (5.0%) | 0 (0.0%) |
| 7+ Person Households | 0 (0.0%) | 0 (0.0%) |
| Total | 477 (68.5%) | 219 (31.5%) |
Female Fertility in Bonneau Beach
Fertility by Age in Bonneau Beach
| Age Bracket | Women with Births | Births / 1,000 Women |
| 15 to 19 years | 0 (0.0%) | 0.0 |
| 20 to 34 years | 0 (0.0%) | 0.0 |
| 35 to 50 years | 0 (0.0%) | 0.0 |
| Total | 0 (0.0%) | 0.0 |
Fertility by Age by Marriage Status in Bonneau Beach
| Age Bracket | Married | Unmarried |
| 15 to 19 years | 0 (0.0%) | 0 (0.0%) |
| 20 to 34 years | 0 (0.0%) | 0 (0.0%) |
| 35 to 50 years | 0 (0.0%) | 0 (0.0%) |
| Total | 0 (0.0%) | 0 (0.0%) |
Fertility by Education in Bonneau Beach
| Educational Attainment | Women with Births | Births / 1,000 Women |
| Less than High School | 0 (0.0%) | 0.0 |
| High School Diploma | 0 (0.0%) | 0.0 |
| College or Associate's Degree | 0 (0.0%) | 0.0 |
| Bachelor's Degree | 0 (0.0%) | 0.0 |
| Graduate Degree | 0 (0.0%) | 0.0 |
| Total | 0 (0.0%) | 0.0 |
Fertility by Education by Marriage Status in Bonneau Beach
| Educational Attainment | Married | Unmarried |
| Less than High School | 0 (0.0%) | 0 (0.0%) |
| High School Diploma | 0 (0.0%) | 0 (0.0%) |
| College or Associate's Degree | 0 (0.0%) | 0 (0.0%) |
| Bachelor's Degree | 0 (0.0%) | 0 (0.0%) |
| Graduate Degree | 0 (0.0%) | 0 (0.0%) |
| Total | 0 (0.0%) | 0 (0.0%) |
Employment Characteristics in Bonneau Beach
Employment by Class of Employer in Bonneau Beach
Among the 470 employed individuals in Bonneau Beach, private company employees (341 | 72.6%), self-employed (not incorporated) (99 | 21.1%), and local government employees (17 | 3.6%) make up the most common classes of employment.
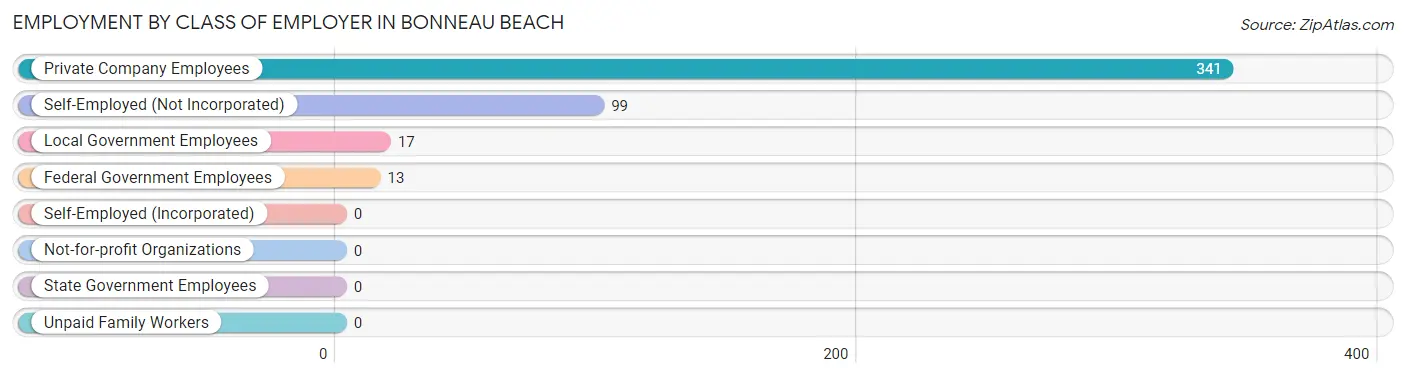
| Employer Class | # Employees | % Employees |
| Private Company Employees | 341 | 72.6% |
| Self-Employed (Incorporated) | 0 | 0.0% |
| Self-Employed (Not Incorporated) | 99 | 21.1% |
| Not-for-profit Organizations | 0 | 0.0% |
| Local Government Employees | 17 | 3.6% |
| State Government Employees | 0 | 0.0% |
| Federal Government Employees | 13 | 2.8% |
| Unpaid Family Workers | 0 | 0.0% |
| Total | 470 | 100.0% |
Employment Status by Age in Bonneau Beach
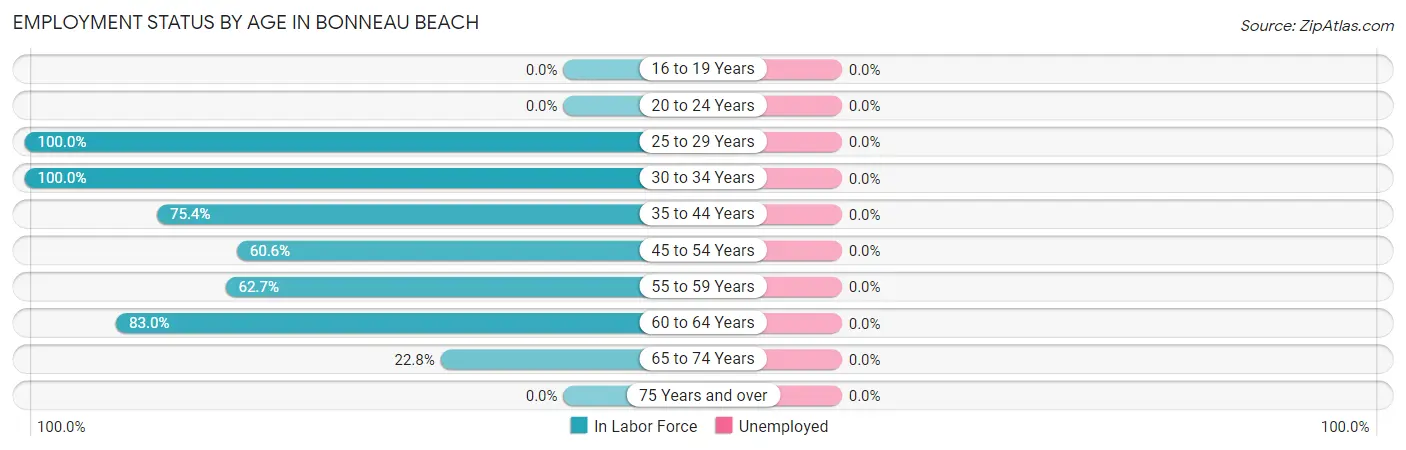
| Age Bracket | In Labor Force | Unemployed |
| 16 to 19 Years | 0 (0.0%) | 0 (0.0%) |
| 20 to 24 Years | 0 (0.0%) | 0 (0.0%) |
| 25 to 29 Years | 16 (100.0%) | 0 (0.0%) |
| 30 to 34 Years | 7 (100.0%) | 0 (0.0%) |
| 35 to 44 Years | 52 (75.4%) | 0 (0.0%) |
| 45 to 54 Years | 126 (60.6%) | 0 (0.0%) |
| 55 to 59 Years | 138 (62.7%) | 0 (0.0%) |
| 60 to 64 Years | 73 (83.0%) | 0 (0.0%) |
| 65 to 74 Years | 76 (22.8%) | 0 (0.0%) |
| 75 Years and over | 0 (0.0%) | 0 (0.0%) |
| Total | 488 (38.1%) | 0 (0.0%) |
Employment Status by Educational Attainment in Bonneau Beach
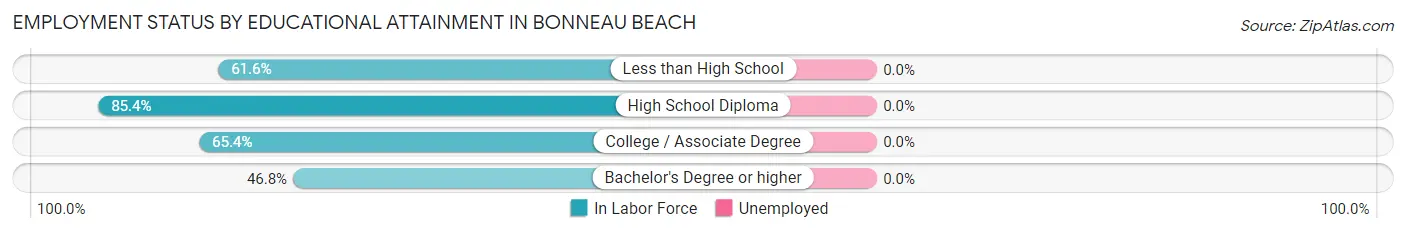
| Educational Attainment | In Labor Force | Unemployed |
| Less than High School | 61 (61.6%) | 0 (0.0%) |
| High School Diploma | 176 (85.4%) | 0 (0.0%) |
| College / Associate Degree | 117 (65.4%) | 0 (0.0%) |
| Bachelor's Degree or higher | 58 (46.8%) | 0 (0.0%) |
| Total | 412 (67.8%) | 0 (0.0%) |
Employment Occupations by Sex in Bonneau Beach
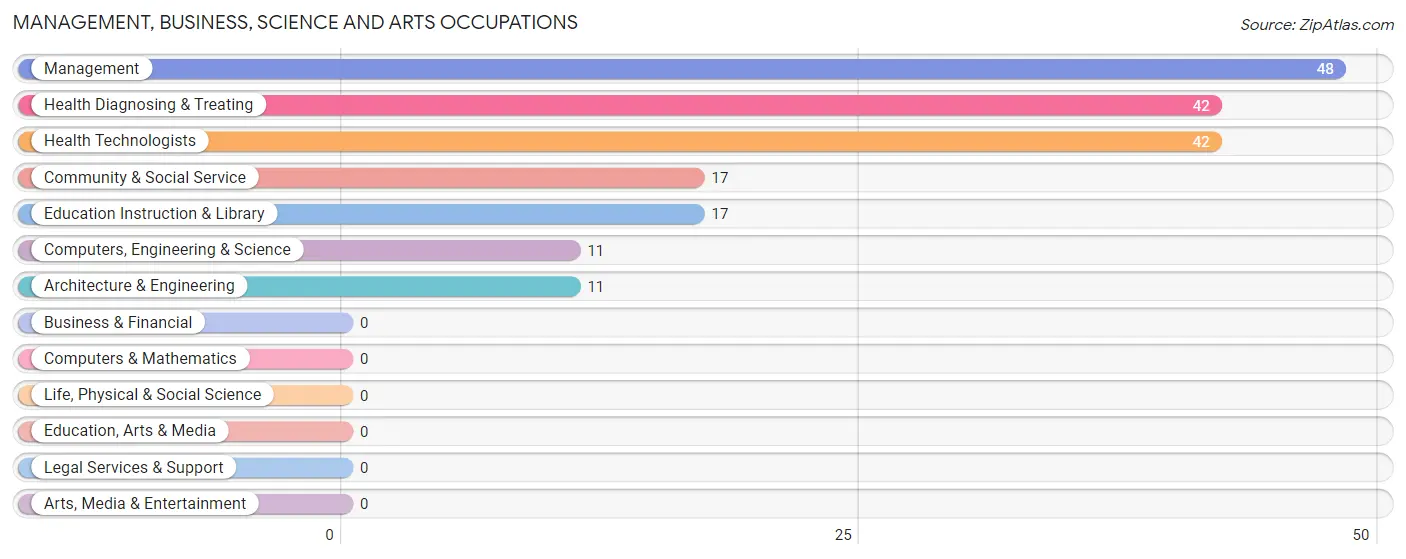
Management, Business, Science and Arts Occupations
The most common Management, Business, Science and Arts occupations in Bonneau Beach are Management (48 | 9.8%), Health Diagnosing & Treating (42 | 8.6%), Health Technologists (42 | 8.6%), Community & Social Service (17 | 3.5%), and Education Instruction & Library (17 | 3.5%).
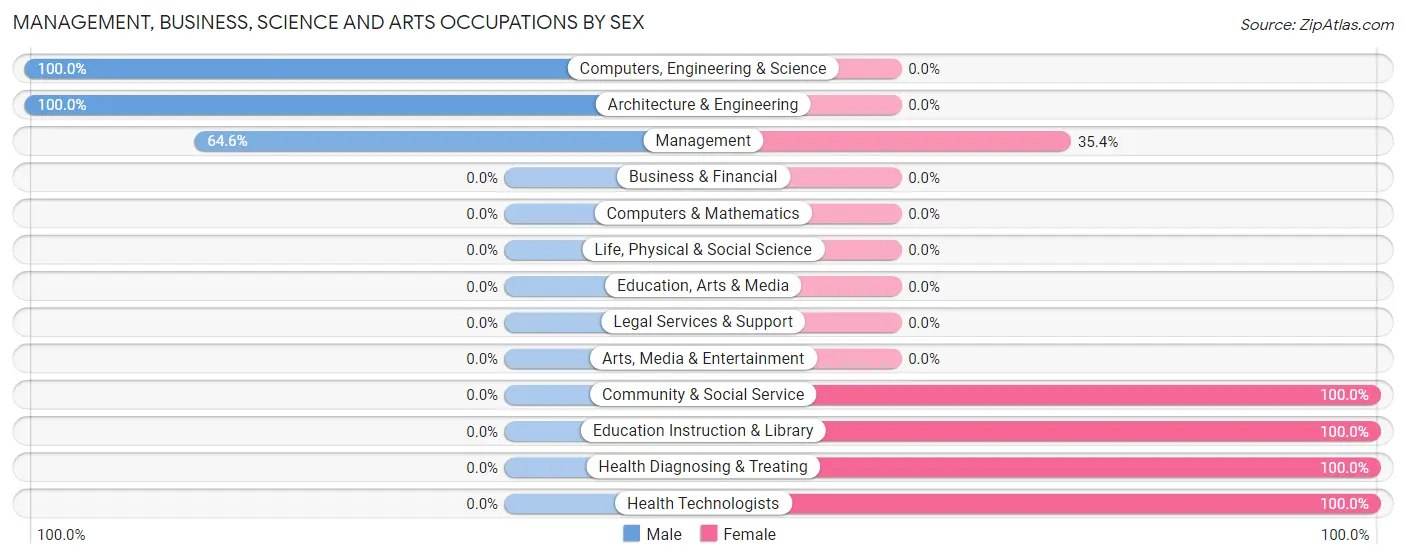
Management, Business, Science and Arts Occupations by Sex
Within the Management, Business, Science and Arts occupations in Bonneau Beach, the most male-oriented occupations are Computers, Engineering & Science (100.0%), Architecture & Engineering (100.0%), and Management (64.6%), while the most female-oriented occupations are Community & Social Service (100.0%), Education Instruction & Library (100.0%), and Health Diagnosing & Treating (100.0%).
| Occupation | Male | Female |
| Management | 31 (64.6%) | 17 (35.4%) |
| Business & Financial | 0 (0.0%) | 0 (0.0%) |
| Computers, Engineering & Science | 11 (100.0%) | 0 (0.0%) |
| Computers & Mathematics | 0 (0.0%) | 0 (0.0%) |
| Architecture & Engineering | 11 (100.0%) | 0 (0.0%) |
| Life, Physical & Social Science | 0 (0.0%) | 0 (0.0%) |
| Community & Social Service | 0 (0.0%) | 17 (100.0%) |
| Education, Arts & Media | 0 (0.0%) | 0 (0.0%) |
| Legal Services & Support | 0 (0.0%) | 0 (0.0%) |
| Education Instruction & Library | 0 (0.0%) | 17 (100.0%) |
| Arts, Media & Entertainment | 0 (0.0%) | 0 (0.0%) |
| Health Diagnosing & Treating | 0 (0.0%) | 42 (100.0%) |
| Health Technologists | 0 (0.0%) | 42 (100.0%) |
| Total (Category) | 42 (35.6%) | 76 (64.4%) |
| Total (Overall) | 246 (50.4%) | 242 (49.6%) |
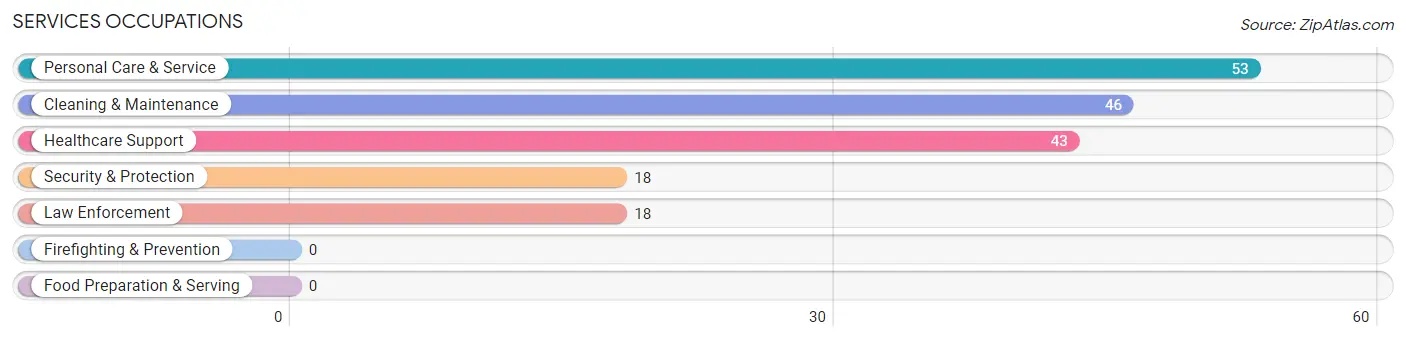
Services Occupations
The most common Services occupations in Bonneau Beach are Personal Care & Service (53 | 10.9%), Cleaning & Maintenance (46 | 9.4%), Healthcare Support (43 | 8.8%), Security & Protection (18 | 3.7%), and Law Enforcement (18 | 3.7%).
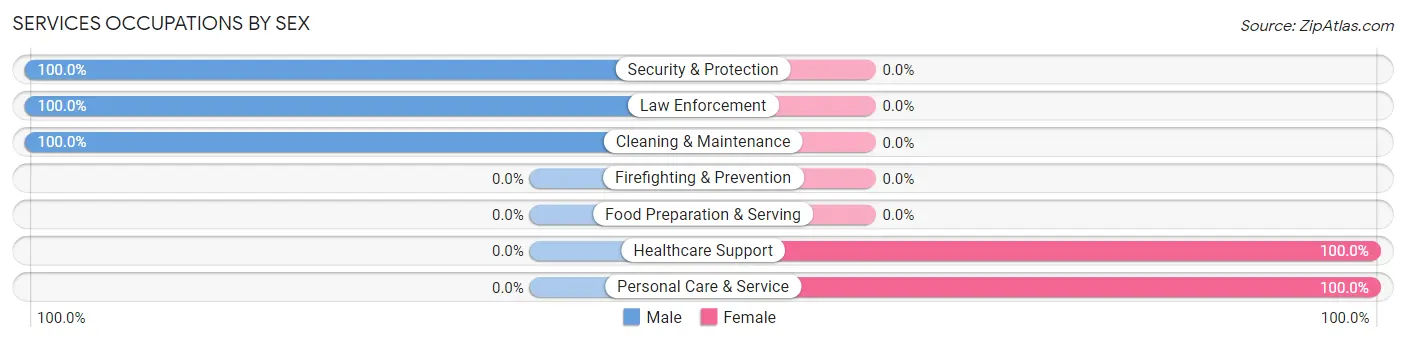
Services Occupations by Sex
Within the Services occupations in Bonneau Beach, the most male-oriented occupations are Security & Protection (100.0%), Law Enforcement (100.0%), and Cleaning & Maintenance (100.0%), while the most female-oriented occupations are Healthcare Support (100.0%), and Personal Care & Service (100.0%).
| Occupation | Male | Female |
| Healthcare Support | 0 (0.0%) | 43 (100.0%) |
| Security & Protection | 18 (100.0%) | 0 (0.0%) |
| Firefighting & Prevention | 0 (0.0%) | 0 (0.0%) |
| Law Enforcement | 18 (100.0%) | 0 (0.0%) |
| Food Preparation & Serving | 0 (0.0%) | 0 (0.0%) |
| Cleaning & Maintenance | 46 (100.0%) | 0 (0.0%) |
| Personal Care & Service | 0 (0.0%) | 53 (100.0%) |
| Total (Category) | 64 (40.0%) | 96 (60.0%) |
| Total (Overall) | 246 (50.4%) | 242 (49.6%) |
Sales and Office Occupations
The most common Sales and Office occupations in Bonneau Beach are Office & Administration (65 | 13.3%), and Sales & Related (54 | 11.1%).
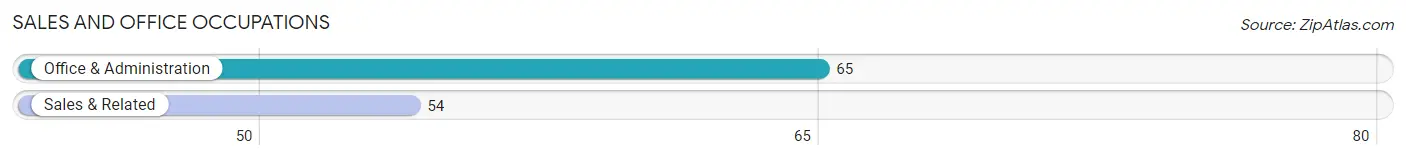
Sales and Office Occupations by Sex
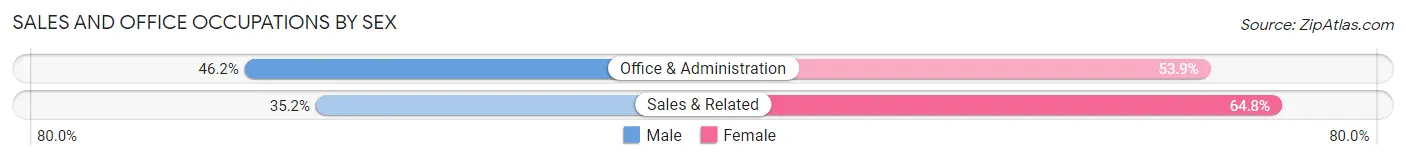
| Occupation | Male | Female |
| Sales & Related | 19 (35.2%) | 35 (64.8%) |
| Office & Administration | 30 (46.2%) | 35 (53.8%) |
| Total (Category) | 49 (41.2%) | 70 (58.8%) |
| Total (Overall) | 246 (50.4%) | 242 (49.6%) |
Natural Resources, Construction and Maintenance Occupations
The most common Natural Resources, Construction and Maintenance occupations in Bonneau Beach are , and Construction & Extraction (65 | 13.3%).
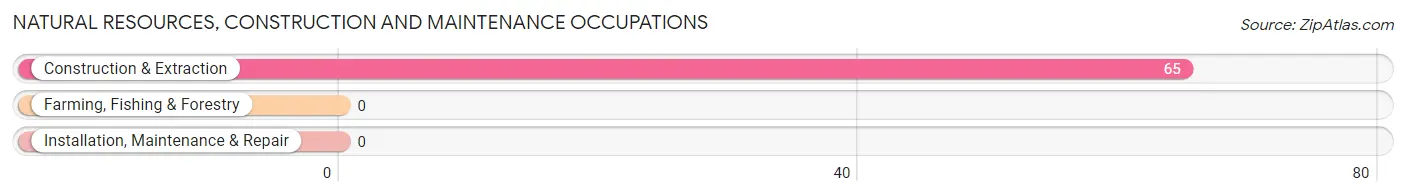
Natural Resources, Construction and Maintenance Occupations by Sex
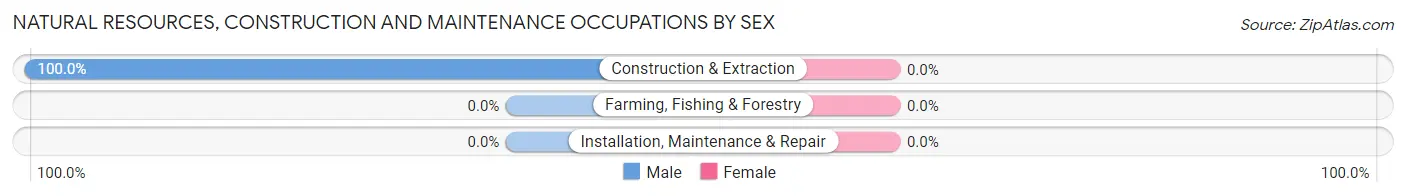
| Occupation | Male | Female |
| Farming, Fishing & Forestry | 0 (0.0%) | 0 (0.0%) |
| Construction & Extraction | 65 (100.0%) | 0 (0.0%) |
| Installation, Maintenance & Repair | 0 (0.0%) | 0 (0.0%) |
| Total (Category) | 65 (100.0%) | 0 (0.0%) |
| Total (Overall) | 246 (50.4%) | 242 (49.6%) |
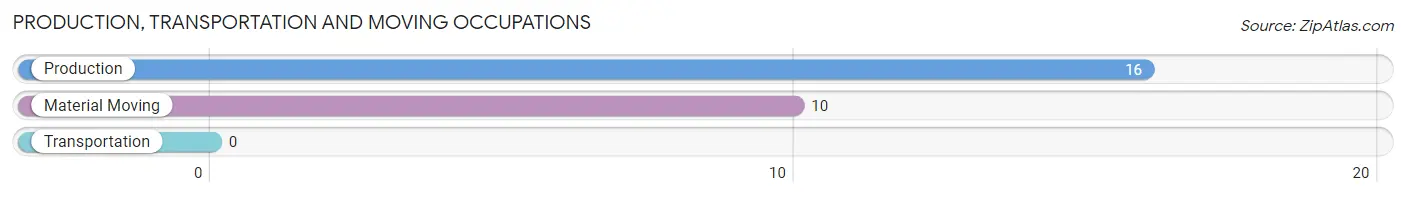
Production, Transportation and Moving Occupations
The most common Production, Transportation and Moving occupations in Bonneau Beach are Production (16 | 3.3%), and Material Moving (10 | 2.1%).
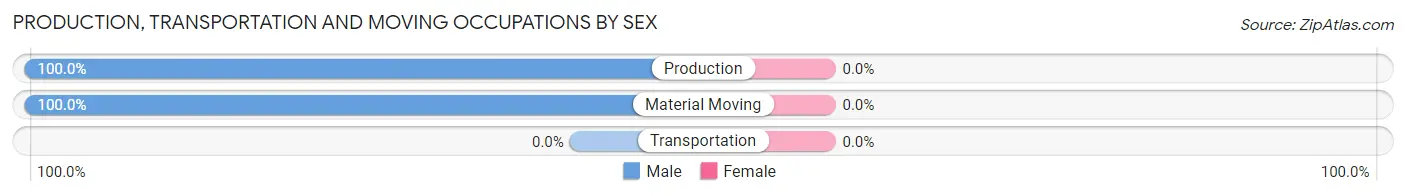
Production, Transportation and Moving Occupations by Sex
| Occupation | Male | Female |
| Production | 16 (100.0%) | 0 (0.0%) |
| Transportation | 0 (0.0%) | 0 (0.0%) |
| Material Moving | 10 (100.0%) | 0 (0.0%) |
| Total (Category) | 26 (100.0%) | 0 (0.0%) |
| Total (Overall) | 246 (50.4%) | 242 (49.6%) |
Employment Industries by Sex in Bonneau Beach
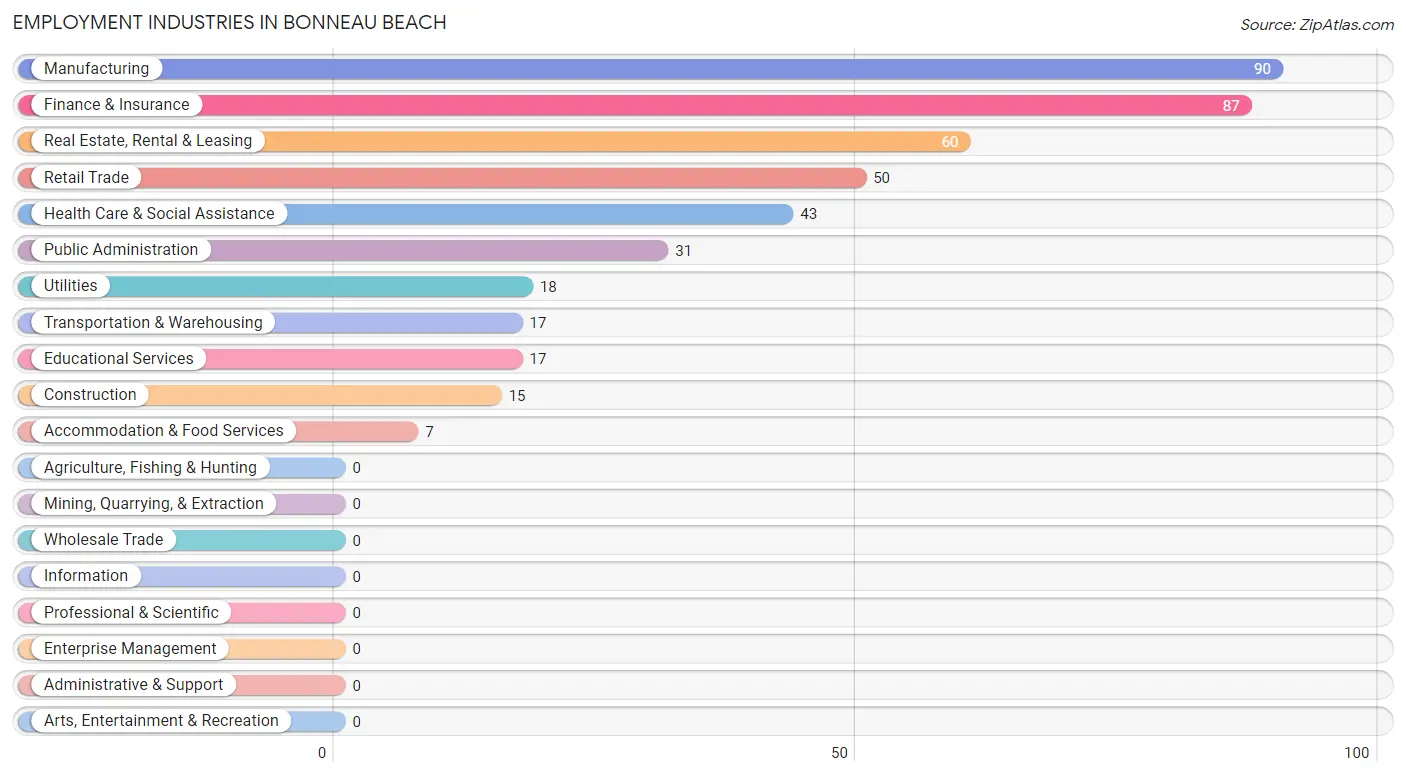
Employment Industries in Bonneau Beach
The major employment industries in Bonneau Beach include Manufacturing (90 | 18.4%), Finance & Insurance (87 | 17.8%), Real Estate, Rental & Leasing (60 | 12.3%), Retail Trade (50 | 10.2%), and Health Care & Social Assistance (43 | 8.8%).
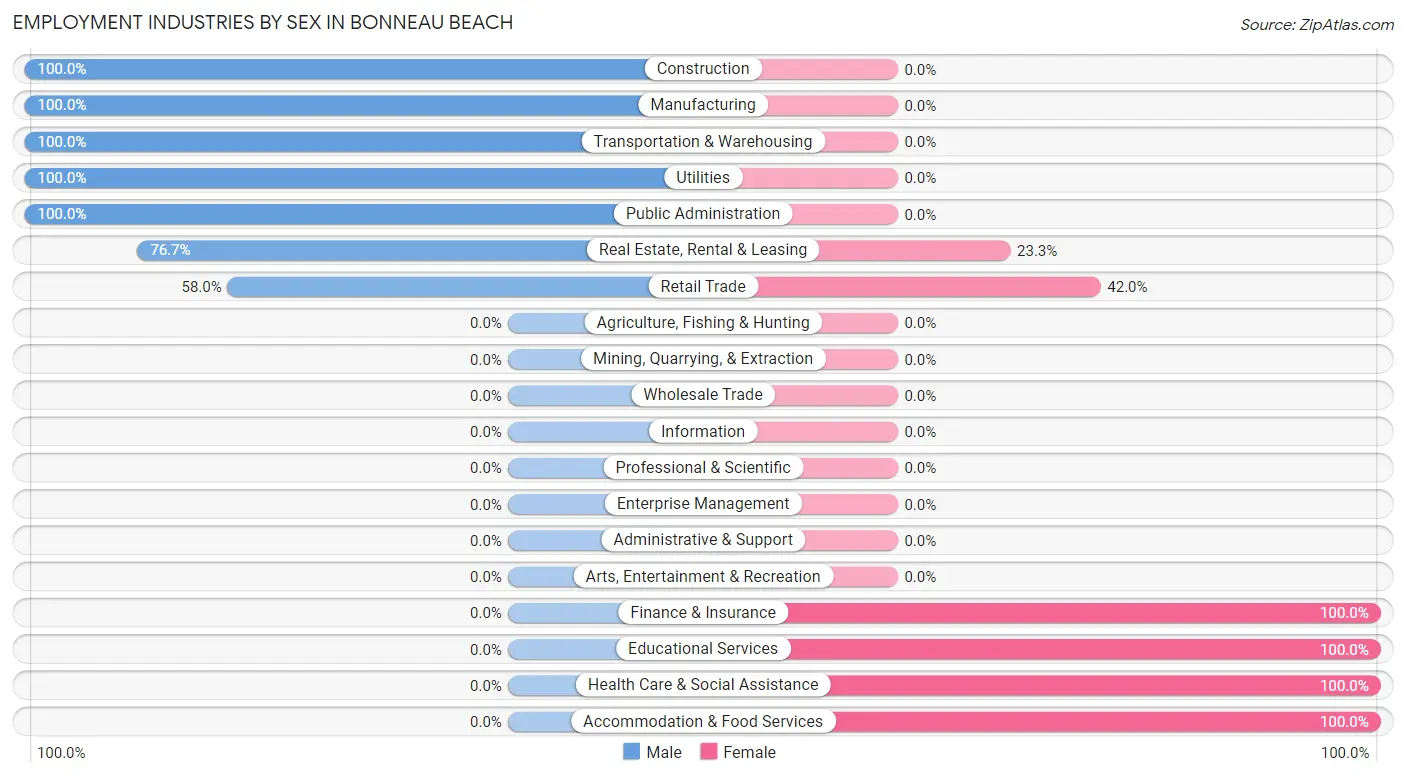
Employment Industries by Sex in Bonneau Beach
The Bonneau Beach industries that see more men than women are Construction (100.0%), Manufacturing (100.0%), and Transportation & Warehousing (100.0%), whereas the industries that tend to have a higher number of women are Finance & Insurance (100.0%), Educational Services (100.0%), and Health Care & Social Assistance (100.0%).
| Industry | Male | Female |
| Agriculture, Fishing & Hunting | 0 (0.0%) | 0 (0.0%) |
| Mining, Quarrying, & Extraction | 0 (0.0%) | 0 (0.0%) |
| Construction | 15 (100.0%) | 0 (0.0%) |
| Manufacturing | 90 (100.0%) | 0 (0.0%) |
| Wholesale Trade | 0 (0.0%) | 0 (0.0%) |
| Retail Trade | 29 (58.0%) | 21 (42.0%) |
| Transportation & Warehousing | 17 (100.0%) | 0 (0.0%) |
| Utilities | 18 (100.0%) | 0 (0.0%) |
| Information | 0 (0.0%) | 0 (0.0%) |
| Finance & Insurance | 0 (0.0%) | 87 (100.0%) |
| Real Estate, Rental & Leasing | 46 (76.7%) | 14 (23.3%) |
| Professional & Scientific | 0 (0.0%) | 0 (0.0%) |
| Enterprise Management | 0 (0.0%) | 0 (0.0%) |
| Administrative & Support | 0 (0.0%) | 0 (0.0%) |
| Educational Services | 0 (0.0%) | 17 (100.0%) |
| Health Care & Social Assistance | 0 (0.0%) | 43 (100.0%) |
| Arts, Entertainment & Recreation | 0 (0.0%) | 0 (0.0%) |
| Accommodation & Food Services | 0 (0.0%) | 7 (100.0%) |
| Public Administration | 31 (100.0%) | 0 (0.0%) |
| Total | 246 (50.4%) | 242 (49.6%) |
Education in Bonneau Beach
School Enrollment in Bonneau Beach
The most common levels of schooling among the 257 students in Bonneau Beach are elementary school (112 | 43.6%), middle school (50 | 19.5%), and kindergarten (44 | 17.1%).
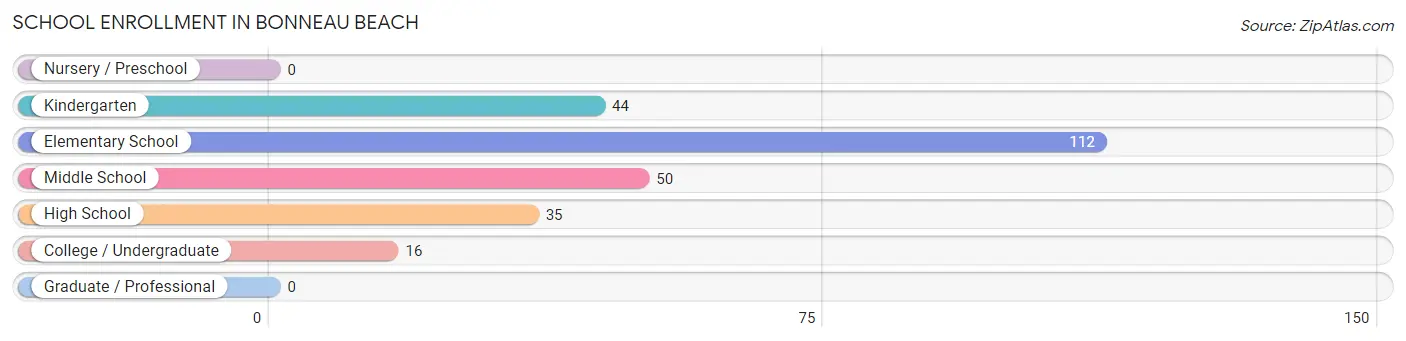
| School Level | # Students | % Students |
| Nursery / Preschool | 0 | 0.0% |
| Kindergarten | 44 | 17.1% |
| Elementary School | 112 | 43.6% |
| Middle School | 50 | 19.5% |
| High School | 35 | 13.6% |
| College / Undergraduate | 16 | 6.2% |
| Graduate / Professional | 0 | 0.0% |
| Total | 257 | 100.0% |
School Enrollment by Age by Funding Source in Bonneau Beach
Out of a total of 257 students who are enrolled in schools in Bonneau Beach, 7 (2.7%) attend a private institution, while the remaining 250 (97.3%) are enrolled in public schools. The age group of 5 to 9 year old has the highest likelihood of being enrolled in private schools, with 7 (4.5% in the age bracket) enrolled. Conversely, the age group of 10 to 14 year olds has the lowest likelihood of being enrolled in a private school, with 50 (100.0% in the age bracket) attending a public institution.
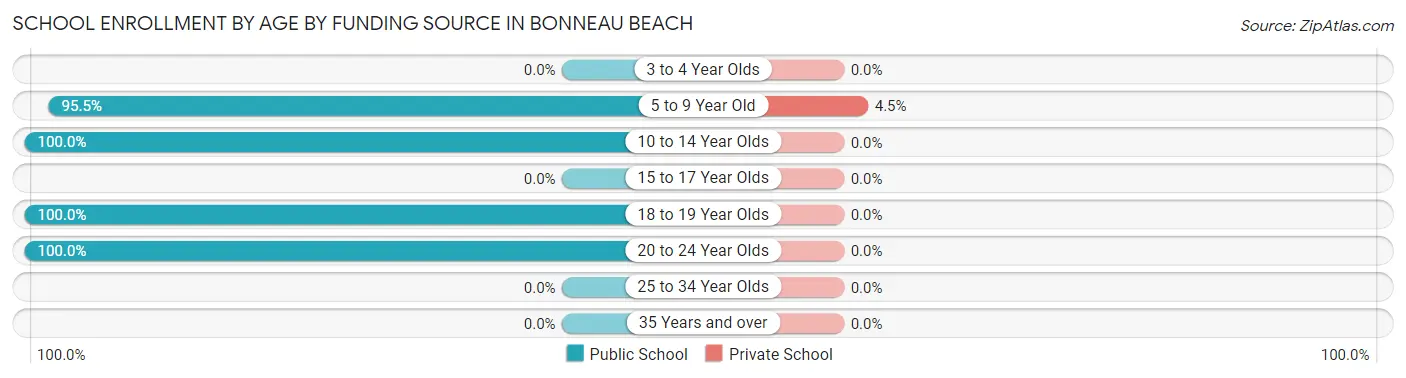
| Age Bracket | Public School | Private School |
| 3 to 4 Year Olds | 0 (0.0%) | 0 (0.0%) |
| 5 to 9 Year Old | 149 (95.5%) | 7 (4.5%) |
| 10 to 14 Year Olds | 50 (100.0%) | 0 (0.0%) |
| 15 to 17 Year Olds | 0 (0.0%) | 0 (0.0%) |
| 18 to 19 Year Olds | 35 (100.0%) | 0 (0.0%) |
| 20 to 24 Year Olds | 16 (100.0%) | 0 (0.0%) |
| 25 to 34 Year Olds | 0 (0.0%) | 0 (0.0%) |
| 35 Years and over | 0 (0.0%) | 0 (0.0%) |
| Total | 250 (97.3%) | 7 (2.7%) |
Educational Attainment by Field of Study in Bonneau Beach
Engineering (80 | 28.8%), education (67 | 24.1%), business (61 | 21.9%), science & technology (42 | 15.1%), and social sciences (19 | 6.8%) are the most common fields of study among 278 individuals in Bonneau Beach who have obtained a bachelor's degree or higher.
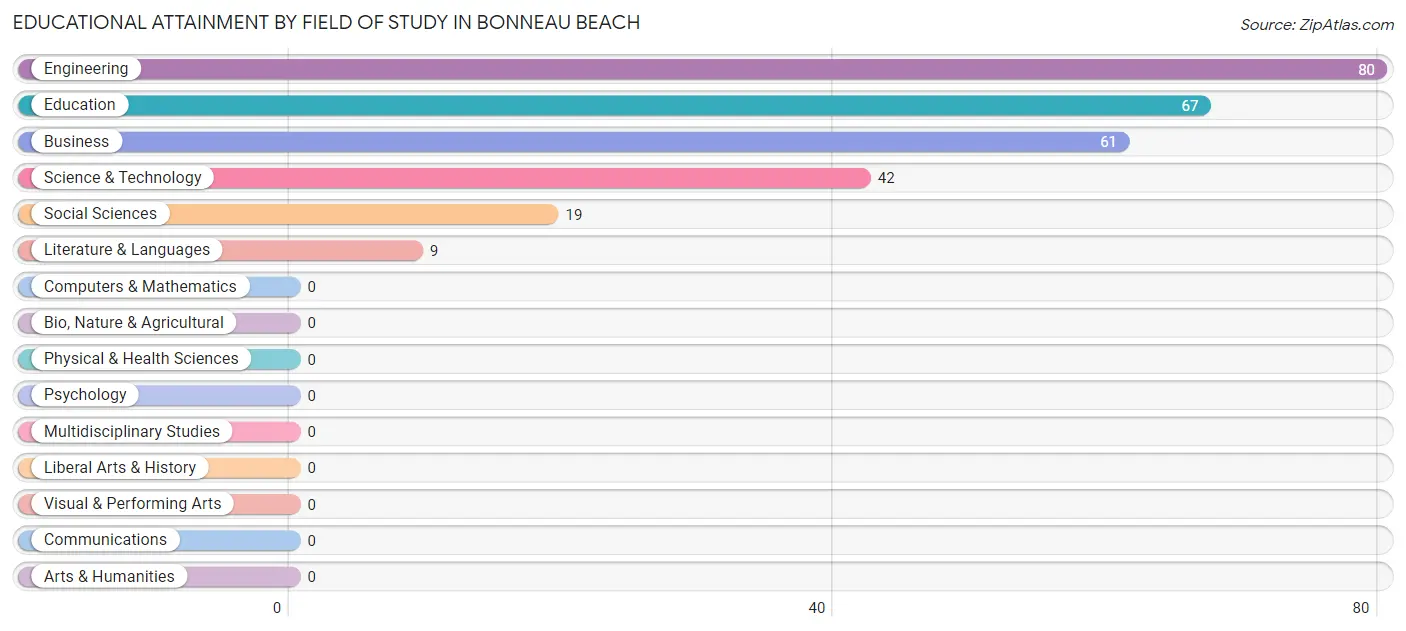
| Field of Study | # Graduates | % Graduates |
| Computers & Mathematics | 0 | 0.0% |
| Bio, Nature & Agricultural | 0 | 0.0% |
| Physical & Health Sciences | 0 | 0.0% |
| Psychology | 0 | 0.0% |
| Social Sciences | 19 | 6.8% |
| Engineering | 80 | 28.8% |
| Multidisciplinary Studies | 0 | 0.0% |
| Science & Technology | 42 | 15.1% |
| Business | 61 | 21.9% |
| Education | 67 | 24.1% |
| Literature & Languages | 9 | 3.2% |
| Liberal Arts & History | 0 | 0.0% |
| Visual & Performing Arts | 0 | 0.0% |
| Communications | 0 | 0.0% |
| Arts & Humanities | 0 | 0.0% |
| Total | 278 | 100.0% |
Transportation & Commute in Bonneau Beach
Vehicle Availability by Sex in Bonneau Beach
The most prevalent vehicle ownership categories in Bonneau Beach are males with 2 vehicles (92, accounting for 40.4%) and females with 2 vehicles (162, making up 38.0%).
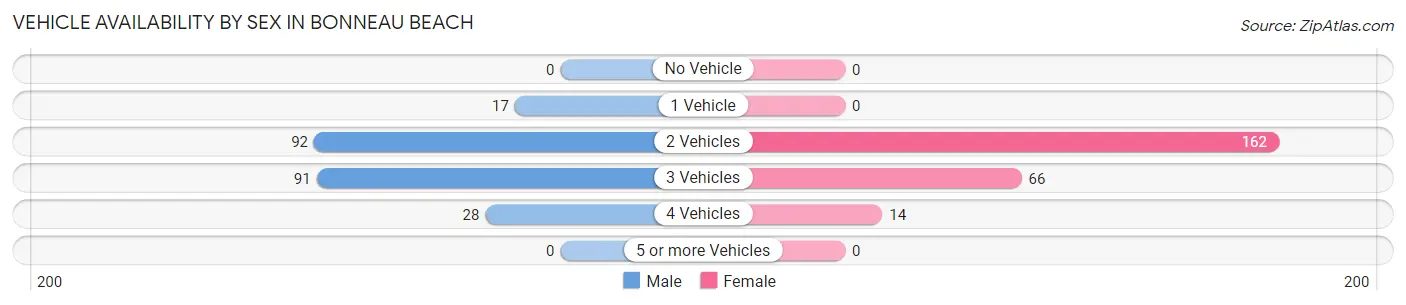
| Vehicles Available | Male | Female |
| No Vehicle | 0 (0.0%) | 0 (0.0%) |
| 1 Vehicle | 17 (7.5%) | 0 (0.0%) |
| 2 Vehicles | 92 (40.4%) | 162 (66.9%) |
| 3 Vehicles | 91 (39.9%) | 66 (27.3%) |
| 4 Vehicles | 28 (12.3%) | 14 (5.8%) |
| 5 or more Vehicles | 0 (0.0%) | 0 (0.0%) |
| Total | 228 (100.0%) | 242 (100.0%) |
Commute Time in Bonneau Beach
The most frequently occuring commute durations in Bonneau Beach are 45 to 59 minutes (153 commuters, 36.6%), 20 to 24 minutes (91 commuters, 21.8%), and 10 to 14 minutes (77 commuters, 18.4%).
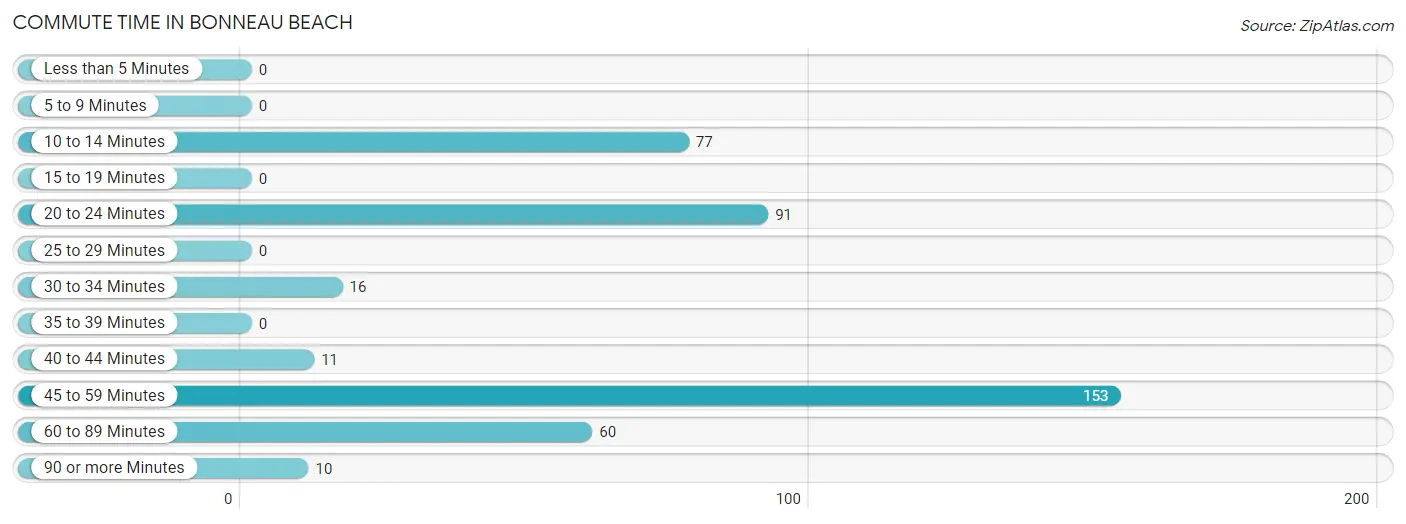
| Commute Time | # Commuters | % Commuters |
| Less than 5 Minutes | 0 | 0.0% |
| 5 to 9 Minutes | 0 | 0.0% |
| 10 to 14 Minutes | 77 | 18.4% |
| 15 to 19 Minutes | 0 | 0.0% |
| 20 to 24 Minutes | 91 | 21.8% |
| 25 to 29 Minutes | 0 | 0.0% |
| 30 to 34 Minutes | 16 | 3.8% |
| 35 to 39 Minutes | 0 | 0.0% |
| 40 to 44 Minutes | 11 | 2.6% |
| 45 to 59 Minutes | 153 | 36.6% |
| 60 to 89 Minutes | 60 | 14.3% |
| 90 or more Minutes | 10 | 2.4% |
Commute Time by Sex in Bonneau Beach
The most common commute times in Bonneau Beach are 45 to 59 minutes (110 commuters, 52.1%) for males and 20 to 24 minutes (81 commuters, 39.1%) for females.
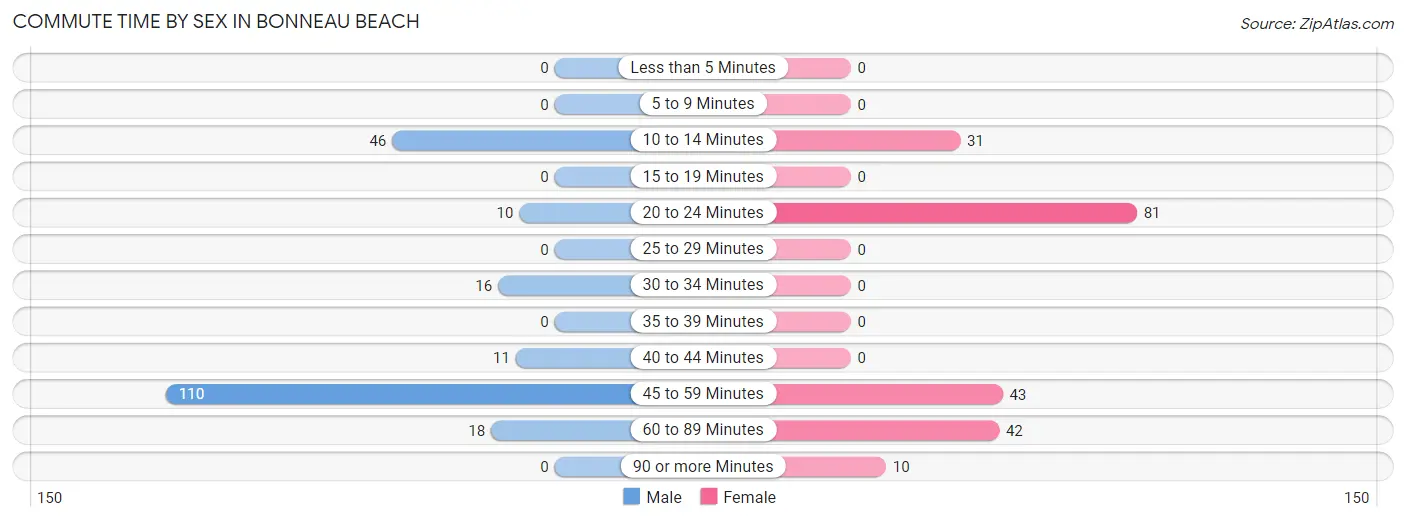
| Commute Time | Male | Female |
| Less than 5 Minutes | 0 (0.0%) | 0 (0.0%) |
| 5 to 9 Minutes | 0 (0.0%) | 0 (0.0%) |
| 10 to 14 Minutes | 46 (21.8%) | 31 (15.0%) |
| 15 to 19 Minutes | 0 (0.0%) | 0 (0.0%) |
| 20 to 24 Minutes | 10 (4.7%) | 81 (39.1%) |
| 25 to 29 Minutes | 0 (0.0%) | 0 (0.0%) |
| 30 to 34 Minutes | 16 (7.6%) | 0 (0.0%) |
| 35 to 39 Minutes | 0 (0.0%) | 0 (0.0%) |
| 40 to 44 Minutes | 11 (5.2%) | 0 (0.0%) |
| 45 to 59 Minutes | 110 (52.1%) | 43 (20.8%) |
| 60 to 89 Minutes | 18 (8.5%) | 42 (20.3%) |
| 90 or more Minutes | 0 (0.0%) | 10 (4.8%) |
Time of Departure to Work by Sex in Bonneau Beach
The most frequent times of departure to work in Bonneau Beach are 6:00 AM to 6:29 AM (63, 29.9%) for males and 6:30 AM to 6:59 AM (112, 54.1%) for females.
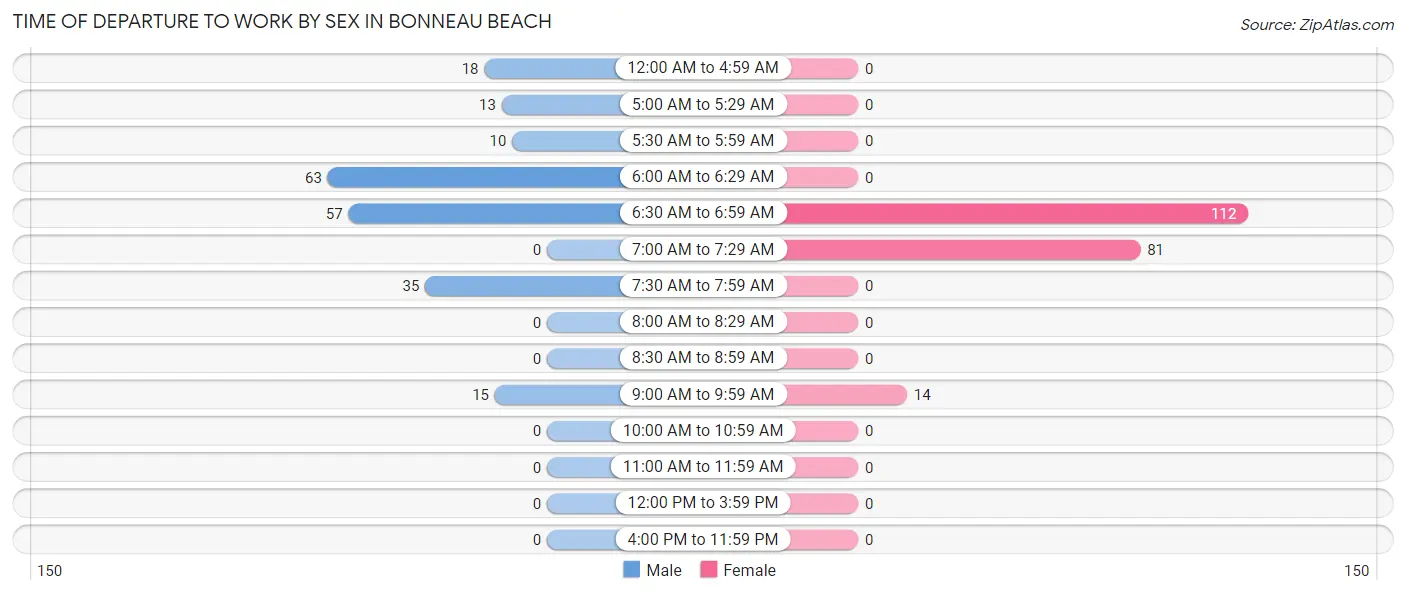
| Time of Departure | Male | Female |
| 12:00 AM to 4:59 AM | 18 (8.5%) | 0 (0.0%) |
| 5:00 AM to 5:29 AM | 13 (6.2%) | 0 (0.0%) |
| 5:30 AM to 5:59 AM | 10 (4.7%) | 0 (0.0%) |
| 6:00 AM to 6:29 AM | 63 (29.9%) | 0 (0.0%) |
| 6:30 AM to 6:59 AM | 57 (27.0%) | 112 (54.1%) |
| 7:00 AM to 7:29 AM | 0 (0.0%) | 81 (39.1%) |
| 7:30 AM to 7:59 AM | 35 (16.6%) | 0 (0.0%) |
| 8:00 AM to 8:29 AM | 0 (0.0%) | 0 (0.0%) |
| 8:30 AM to 8:59 AM | 0 (0.0%) | 0 (0.0%) |
| 9:00 AM to 9:59 AM | 15 (7.1%) | 14 (6.8%) |
| 10:00 AM to 10:59 AM | 0 (0.0%) | 0 (0.0%) |
| 11:00 AM to 11:59 AM | 0 (0.0%) | 0 (0.0%) |
| 12:00 PM to 3:59 PM | 0 (0.0%) | 0 (0.0%) |
| 4:00 PM to 11:59 PM | 0 (0.0%) | 0 (0.0%) |
| Total | 211 (100.0%) | 207 (100.0%) |
Housing Occupancy in Bonneau Beach
Occupancy by Ownership in Bonneau Beach
Of the total 696 dwellings in Bonneau Beach, owner-occupied units account for 591 (84.9%), while renter-occupied units make up 105 (15.1%).
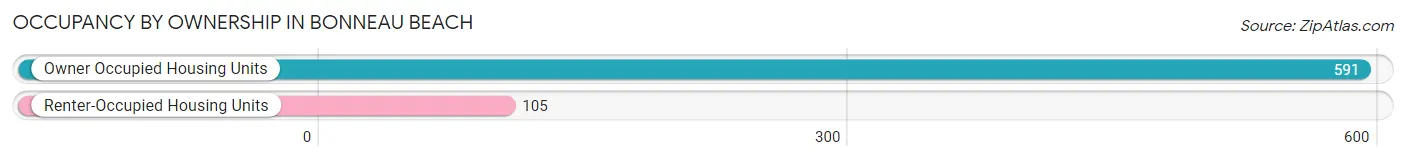
| Occupancy | # Housing Units | % Housing Units |
| Owner Occupied Housing Units | 591 | 84.9% |
| Renter-Occupied Housing Units | 105 | 15.1% |
| Total Occupied Housing Units | 696 | 100.0% |
Occupancy by Household Size in Bonneau Beach
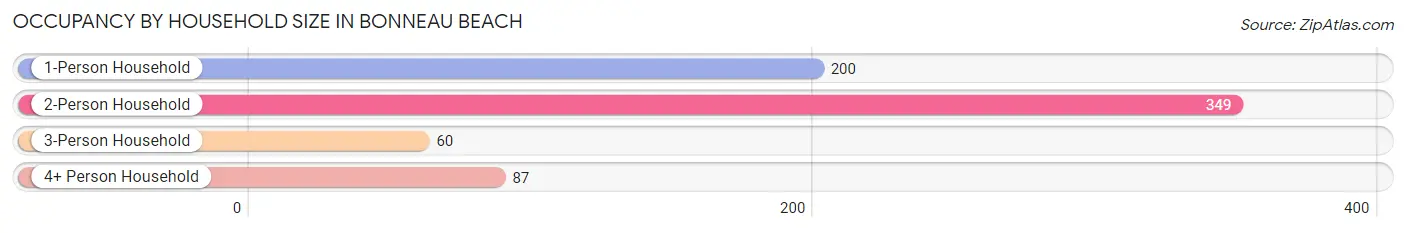
| Household Size | # Housing Units | % Housing Units |
| 1-Person Household | 200 | 28.7% |
| 2-Person Household | 349 | 50.1% |
| 3-Person Household | 60 | 8.6% |
| 4+ Person Household | 87 | 12.5% |
| Total Housing Units | 696 | 100.0% |
Occupancy by Ownership by Household Size in Bonneau Beach
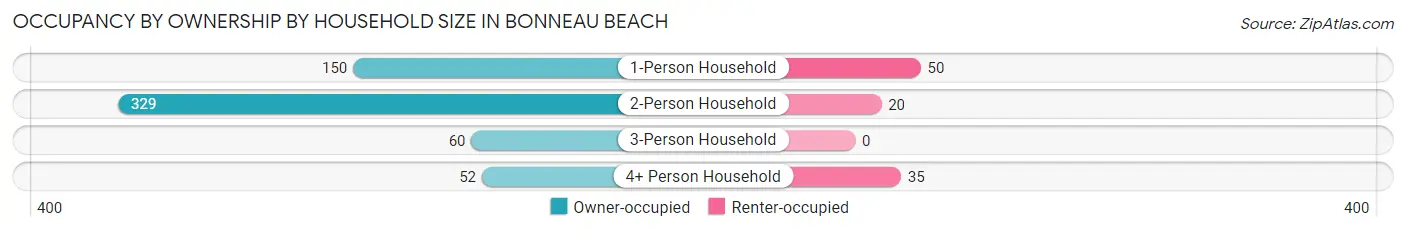
| Household Size | Owner-occupied | Renter-occupied |
| 1-Person Household | 150 (75.0%) | 50 (25.0%) |
| 2-Person Household | 329 (94.3%) | 20 (5.7%) |
| 3-Person Household | 60 (100.0%) | 0 (0.0%) |
| 4+ Person Household | 52 (59.8%) | 35 (40.2%) |
| Total Housing Units | 591 (84.9%) | 105 (15.1%) |
Occupancy by Educational Attainment in Bonneau Beach
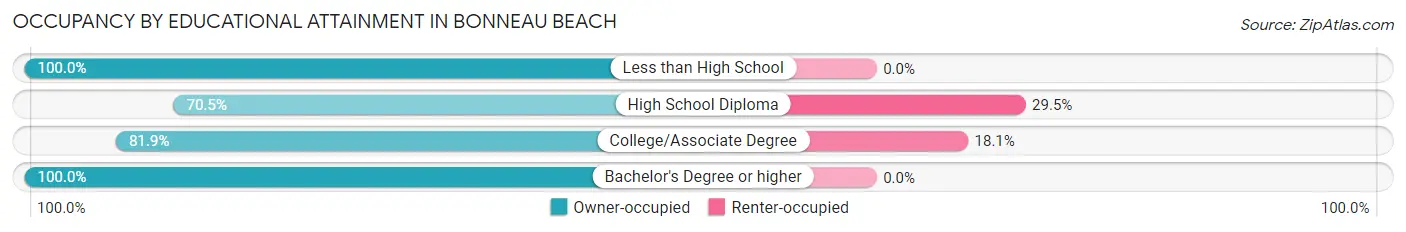
| Household Size | Owner-occupied | Renter-occupied |
| Less than High School | 84 (100.0%) | 0 (0.0%) |
| High School Diploma | 167 (70.5%) | 70 (29.5%) |
| College/Associate Degree | 158 (81.9%) | 35 (18.1%) |
| Bachelor's Degree or higher | 182 (100.0%) | 0 (0.0%) |
Occupancy by Age of Householder in Bonneau Beach
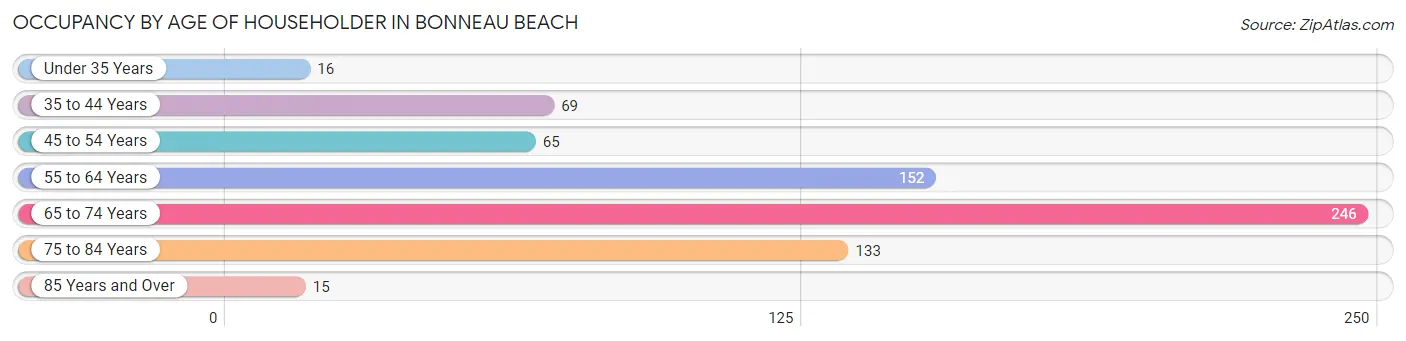
| Age Bracket | # Households | % Households |
| Under 35 Years | 16 | 2.3% |
| 35 to 44 Years | 69 | 9.9% |
| 45 to 54 Years | 65 | 9.3% |
| 55 to 64 Years | 152 | 21.8% |
| 65 to 74 Years | 246 | 35.3% |
| 75 to 84 Years | 133 | 19.1% |
| 85 Years and Over | 15 | 2.2% |
| Total | 696 | 100.0% |
Housing Finances in Bonneau Beach
Median Income by Occupancy in Bonneau Beach
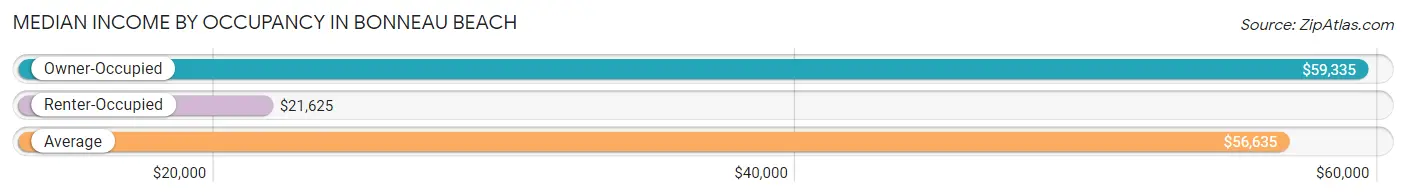
| Occupancy Type | # Households | Median Income |
| Owner-Occupied | 591 (84.9%) | $59,335 |
| Renter-Occupied | 105 (15.1%) | $21,625 |
| Average | 696 (100.0%) | $56,635 |
Occupancy by Householder Income Bracket in Bonneau Beach
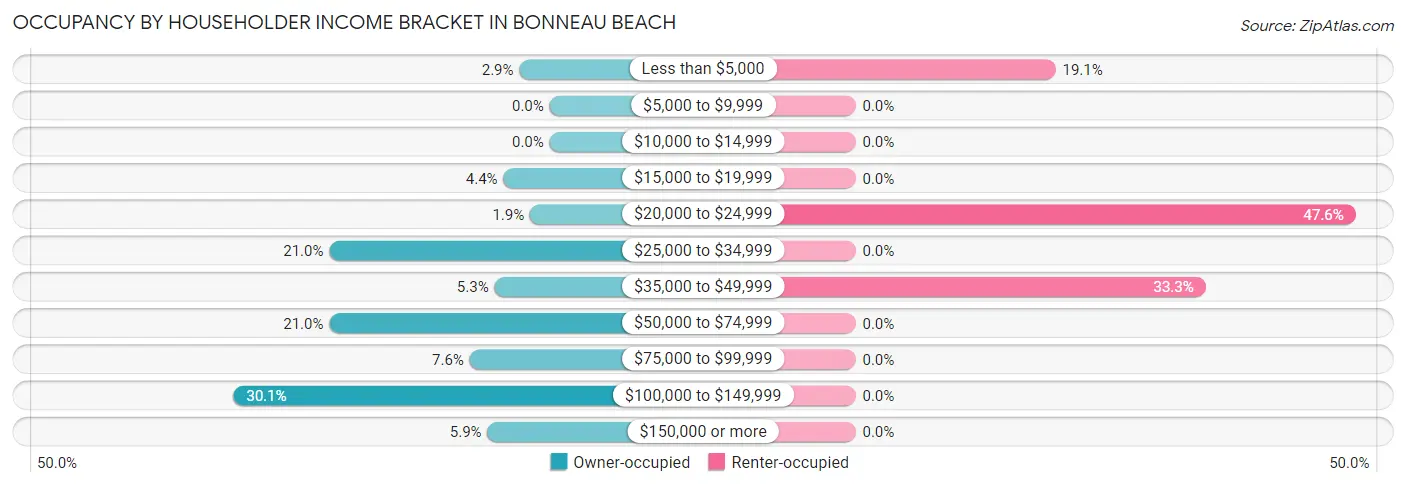
| Income Bracket | Owner-occupied | Renter-occupied |
| Less than $5,000 | 17 (2.9%) | 20 (19.1%) |
| $5,000 to $9,999 | 0 (0.0%) | 0 (0.0%) |
| $10,000 to $14,999 | 0 (0.0%) | 0 (0.0%) |
| $15,000 to $19,999 | 26 (4.4%) | 0 (0.0%) |
| $20,000 to $24,999 | 11 (1.9%) | 50 (47.6%) |
| $25,000 to $34,999 | 124 (21.0%) | 0 (0.0%) |
| $35,000 to $49,999 | 31 (5.2%) | 35 (33.3%) |
| $50,000 to $74,999 | 124 (21.0%) | 0 (0.0%) |
| $75,000 to $99,999 | 45 (7.6%) | 0 (0.0%) |
| $100,000 to $149,999 | 178 (30.1%) | 0 (0.0%) |
| $150,000 or more | 35 (5.9%) | 0 (0.0%) |
| Total | 591 (100.0%) | 105 (100.0%) |
Monthly Housing Cost Tiers in Bonneau Beach
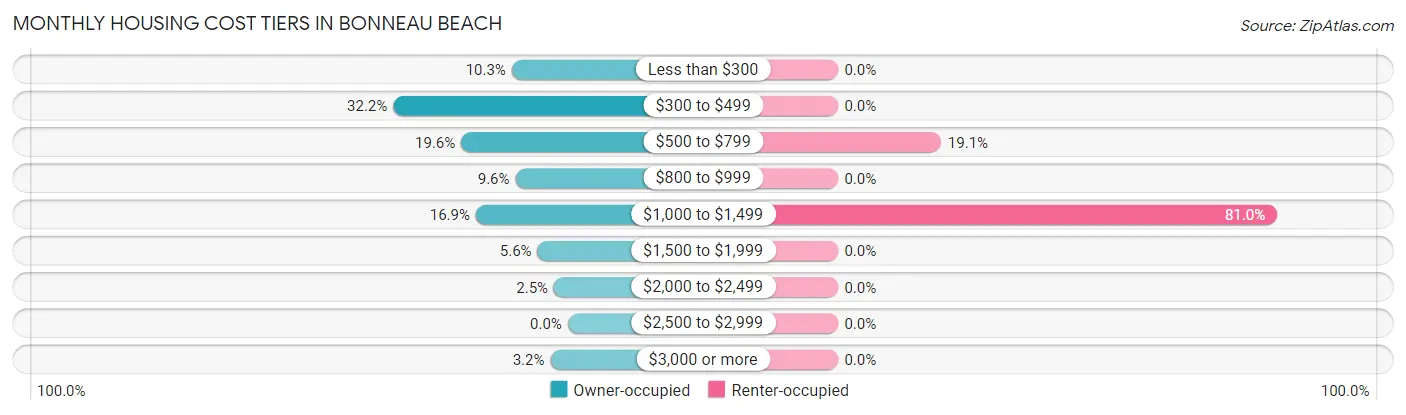
| Monthly Cost | Owner-occupied | Renter-occupied |
| Less than $300 | 61 (10.3%) | 0 (0.0%) |
| $300 to $499 | 190 (32.2%) | 0 (0.0%) |
| $500 to $799 | 116 (19.6%) | 20 (19.1%) |
| $800 to $999 | 57 (9.6%) | 0 (0.0%) |
| $1,000 to $1,499 | 100 (16.9%) | 85 (80.9%) |
| $1,500 to $1,999 | 33 (5.6%) | 0 (0.0%) |
| $2,000 to $2,499 | 15 (2.5%) | 0 (0.0%) |
| $2,500 to $2,999 | 0 (0.0%) | 0 (0.0%) |
| $3,000 or more | 19 (3.2%) | 0 (0.0%) |
| Total | 591 (100.0%) | 105 (100.0%) |
Physical Housing Characteristics in Bonneau Beach
Housing Structures in Bonneau Beach
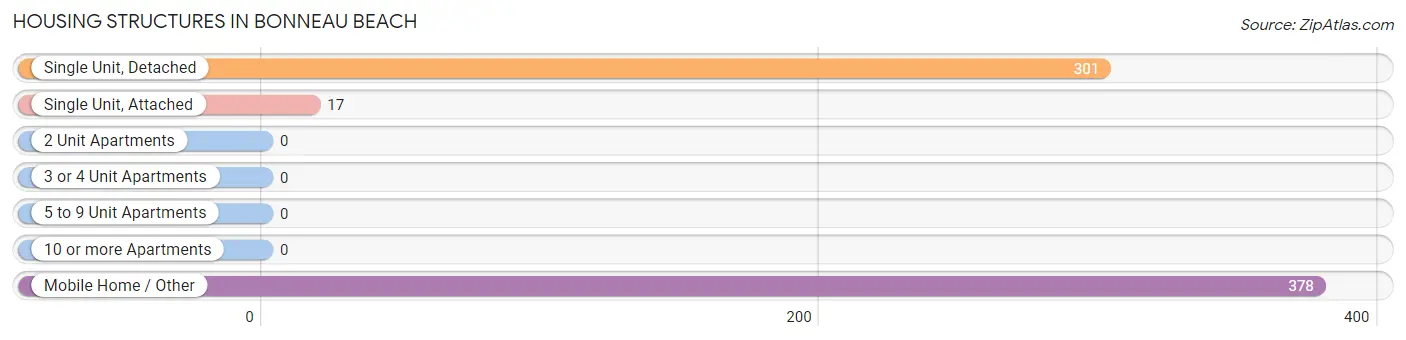
| Structure Type | # Housing Units | % Housing Units |
| Single Unit, Detached | 301 | 43.2% |
| Single Unit, Attached | 17 | 2.4% |
| 2 Unit Apartments | 0 | 0.0% |
| 3 or 4 Unit Apartments | 0 | 0.0% |
| 5 to 9 Unit Apartments | 0 | 0.0% |
| 10 or more Apartments | 0 | 0.0% |
| Mobile Home / Other | 378 | 54.3% |
| Total | 696 | 100.0% |
Housing Structures by Occupancy in Bonneau Beach
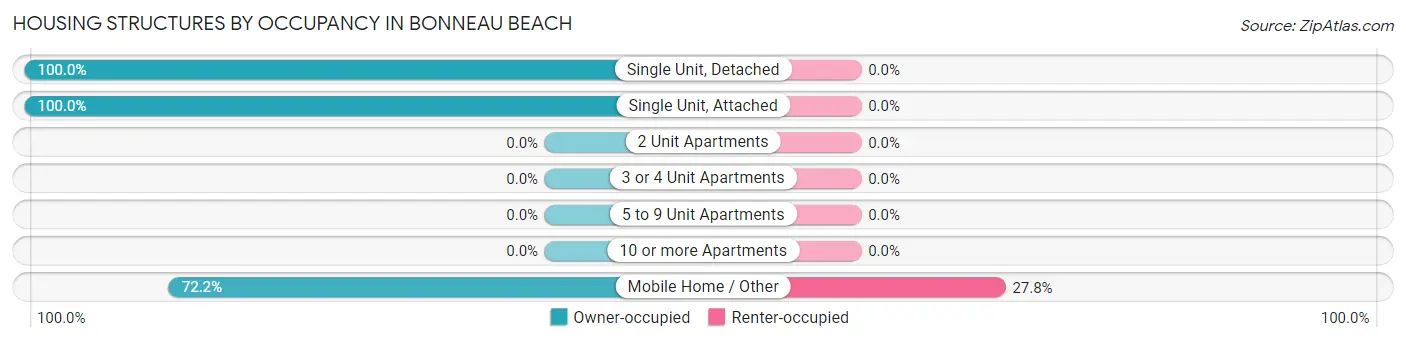
| Structure Type | Owner-occupied | Renter-occupied |
| Single Unit, Detached | 301 (100.0%) | 0 (0.0%) |
| Single Unit, Attached | 17 (100.0%) | 0 (0.0%) |
| 2 Unit Apartments | 0 (0.0%) | 0 (0.0%) |
| 3 or 4 Unit Apartments | 0 (0.0%) | 0 (0.0%) |
| 5 to 9 Unit Apartments | 0 (0.0%) | 0 (0.0%) |
| 10 or more Apartments | 0 (0.0%) | 0 (0.0%) |
| Mobile Home / Other | 273 (72.2%) | 105 (27.8%) |
| Total | 591 (84.9%) | 105 (15.1%) |
Housing Structures by Number of Rooms in Bonneau Beach
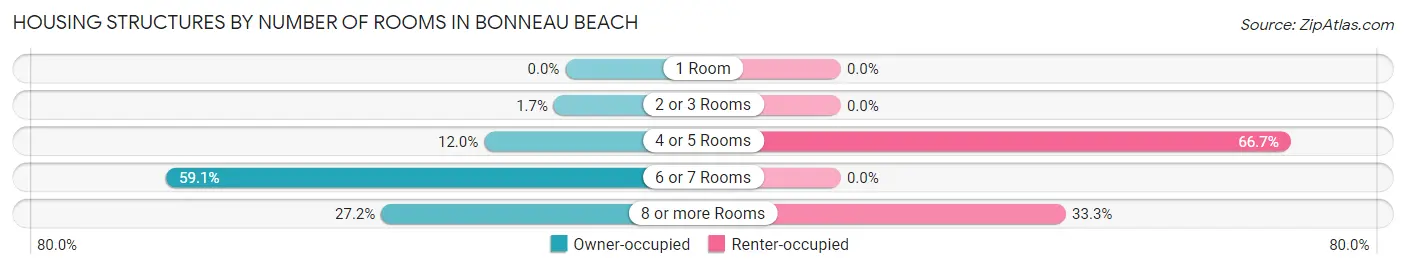
| Number of Rooms | Owner-occupied | Renter-occupied |
| 1 Room | 0 (0.0%) | 0 (0.0%) |
| 2 or 3 Rooms | 10 (1.7%) | 0 (0.0%) |
| 4 or 5 Rooms | 71 (12.0%) | 70 (66.7%) |
| 6 or 7 Rooms | 349 (59.1%) | 0 (0.0%) |
| 8 or more Rooms | 161 (27.2%) | 35 (33.3%) |
| Total | 591 (100.0%) | 105 (100.0%) |
Housing Structure by Heating Type in Bonneau Beach
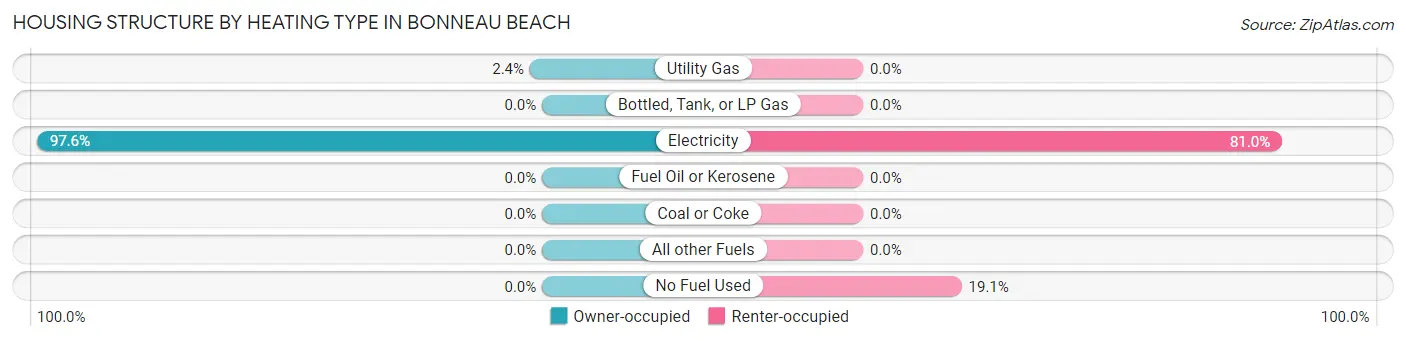
| Heating Type | Owner-occupied | Renter-occupied |
| Utility Gas | 14 (2.4%) | 0 (0.0%) |
| Bottled, Tank, or LP Gas | 0 (0.0%) | 0 (0.0%) |
| Electricity | 577 (97.6%) | 85 (80.9%) |
| Fuel Oil or Kerosene | 0 (0.0%) | 0 (0.0%) |
| Coal or Coke | 0 (0.0%) | 0 (0.0%) |
| All other Fuels | 0 (0.0%) | 0 (0.0%) |
| No Fuel Used | 0 (0.0%) | 20 (19.1%) |
| Total | 591 (100.0%) | 105 (100.0%) |
Household Vehicle Usage in Bonneau Beach
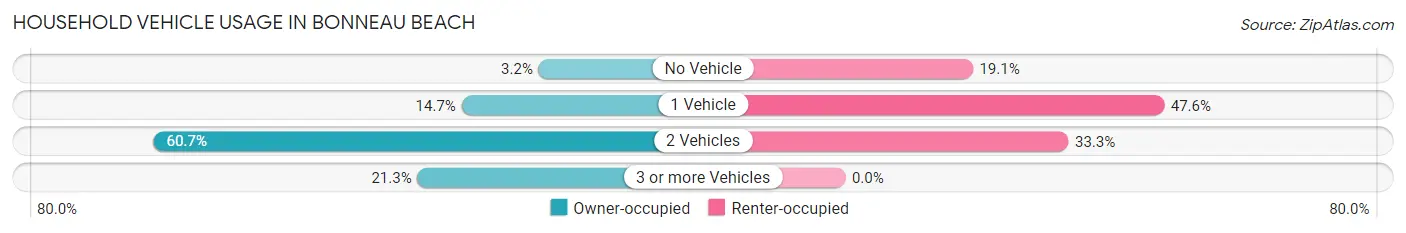
| Vehicles per Household | Owner-occupied | Renter-occupied |
| No Vehicle | 19 (3.2%) | 20 (19.1%) |
| 1 Vehicle | 87 (14.7%) | 50 (47.6%) |
| 2 Vehicles | 359 (60.7%) | 35 (33.3%) |
| 3 or more Vehicles | 126 (21.3%) | 0 (0.0%) |
| Total | 591 (100.0%) | 105 (100.0%) |
Real Estate & Mortgages in Bonneau Beach
Real Estate and Mortgage Overview in Bonneau Beach
| Characteristic | Without Mortgage | With Mortgage |
| Housing Units | 383 | 208 |
| Median Property Value | $216,900 | $266,000 |
| Median Household Income | $59,016 | $0 |
| Monthly Housing Costs | $415 | $19 |
| Real Estate Taxes | $641 | $0 |
Property Value by Mortgage Status in Bonneau Beach
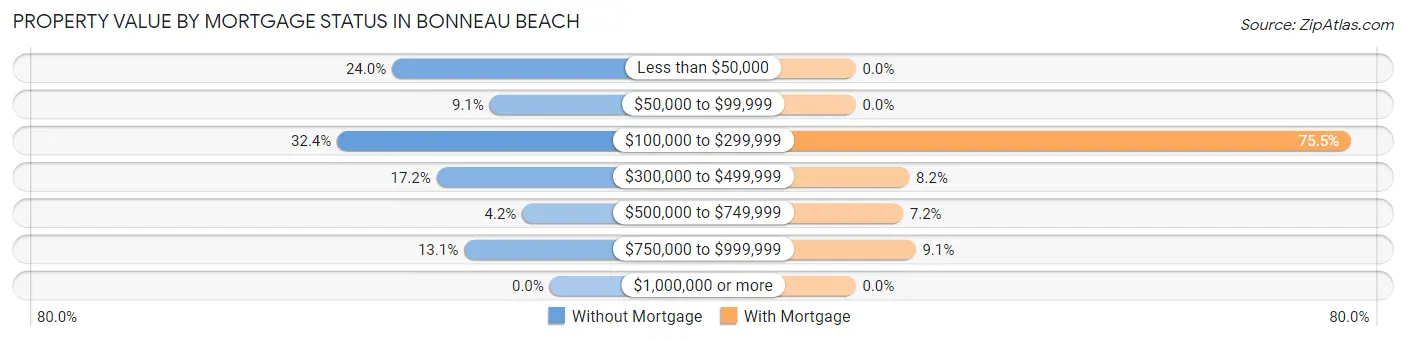
| Property Value | Without Mortgage | With Mortgage |
| Less than $50,000 | 92 (24.0%) | 0 (0.0%) |
| $50,000 to $99,999 | 35 (9.1%) | 0 (0.0%) |
| $100,000 to $299,999 | 124 (32.4%) | 157 (75.5%) |
| $300,000 to $499,999 | 66 (17.2%) | 17 (8.2%) |
| $500,000 to $749,999 | 16 (4.2%) | 15 (7.2%) |
| $750,000 to $999,999 | 50 (13.1%) | 19 (9.1%) |
| $1,000,000 or more | 0 (0.0%) | 0 (0.0%) |
| Total | 383 (100.0%) | 208 (100.0%) |
Household Income by Mortgage Status in Bonneau Beach
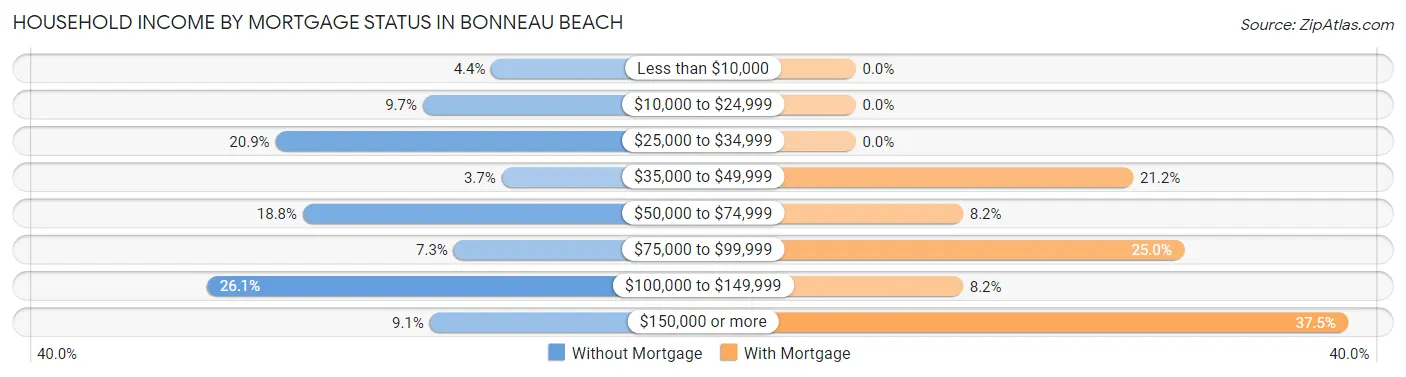
| Household Income | Without Mortgage | With Mortgage |
| Less than $10,000 | 17 (4.4%) | 0 (0.0%) |
| $10,000 to $24,999 | 37 (9.7%) | 0 (0.0%) |
| $25,000 to $34,999 | 80 (20.9%) | 0 (0.0%) |
| $35,000 to $49,999 | 14 (3.7%) | 44 (21.1%) |
| $50,000 to $74,999 | 72 (18.8%) | 17 (8.2%) |
| $75,000 to $99,999 | 28 (7.3%) | 52 (25.0%) |
| $100,000 to $149,999 | 100 (26.1%) | 17 (8.2%) |
| $150,000 or more | 35 (9.1%) | 78 (37.5%) |
| Total | 383 (100.0%) | 208 (100.0%) |
Property Value to Household Income Ratio in Bonneau Beach
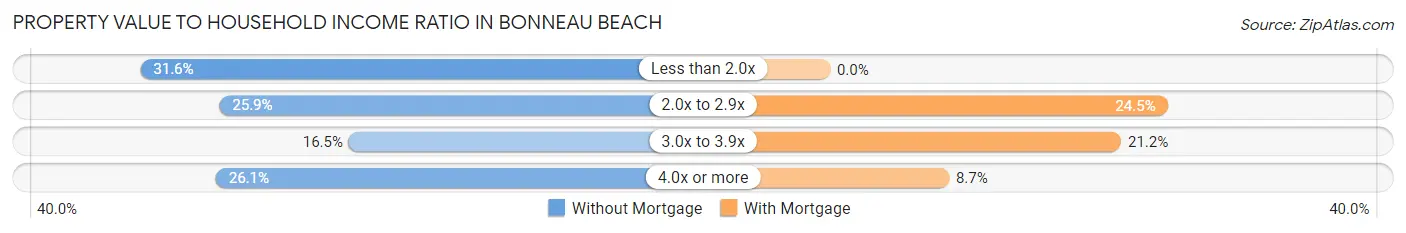
| Value-to-Income Ratio | Without Mortgage | With Mortgage |
| Less than 2.0x | 121 (31.6%) | 0 (0.0%) |
| 2.0x to 2.9x | 99 (25.9%) | 51 (24.5%) |
| 3.0x to 3.9x | 63 (16.5%) | 44 (21.1%) |
| 4.0x or more | 100 (26.1%) | 18 (8.6%) |
| Total | 383 (100.0%) | 208 (100.0%) |
Real Estate Taxes by Mortgage Status in Bonneau Beach
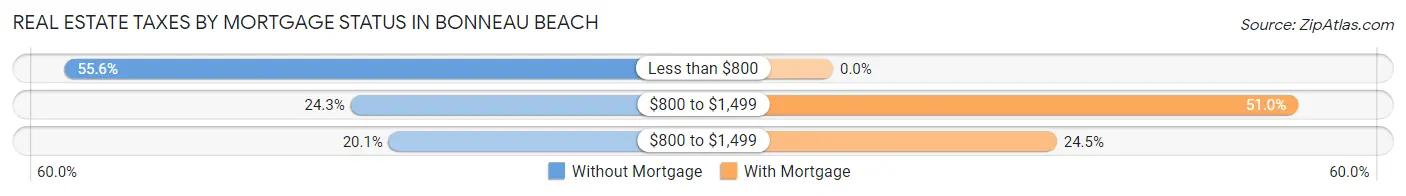
| Property Taxes | Without Mortgage | With Mortgage |
| Less than $800 | 213 (55.6%) | 0 (0.0%) |
| $800 to $1,499 | 93 (24.3%) | 106 (51.0%) |
| $800 to $1,499 | 77 (20.1%) | 51 (24.5%) |
| Total | 383 (100.0%) | 208 (100.0%) |
Health & Disability in Bonneau Beach
Health Insurance Coverage by Age in Bonneau Beach
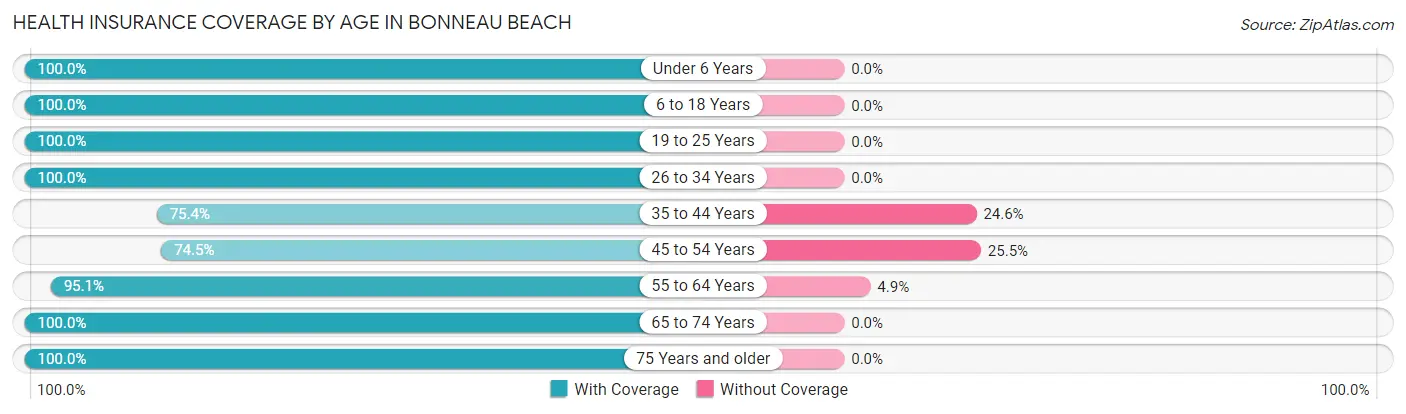
| Age Bracket | With Coverage | Without Coverage |
| Under 6 Years | 56 (100.0%) | 0 (0.0%) |
| 6 to 18 Years | 197 (100.0%) | 0 (0.0%) |
| 19 to 25 Years | 16 (100.0%) | 0 (0.0%) |
| 26 to 34 Years | 23 (100.0%) | 0 (0.0%) |
| 35 to 44 Years | 52 (75.4%) | 17 (24.6%) |
| 45 to 54 Years | 155 (74.5%) | 53 (25.5%) |
| 55 to 64 Years | 293 (95.1%) | 15 (4.9%) |
| 65 to 74 Years | 334 (100.0%) | 0 (0.0%) |
| 75 Years and older | 289 (100.0%) | 0 (0.0%) |
| Total | 1,415 (94.3%) | 85 (5.7%) |
Health Insurance Coverage by Citizenship Status in Bonneau Beach
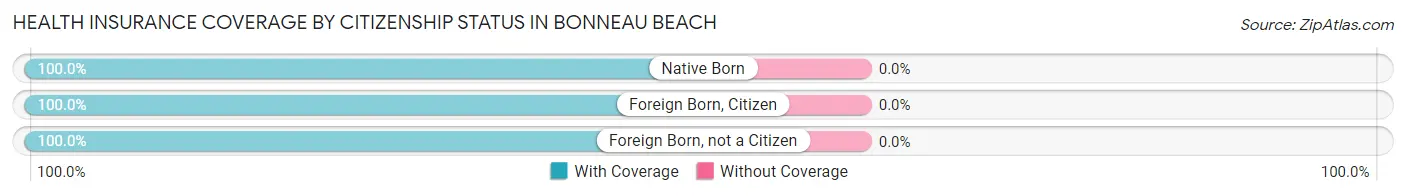
| Citizenship Status | With Coverage | Without Coverage |
| Native Born | 56 (100.0%) | 0 (0.0%) |
| Foreign Born, Citizen | 197 (100.0%) | 0 (0.0%) |
| Foreign Born, not a Citizen | 16 (100.0%) | 0 (0.0%) |
Health Insurance Coverage by Household Income in Bonneau Beach
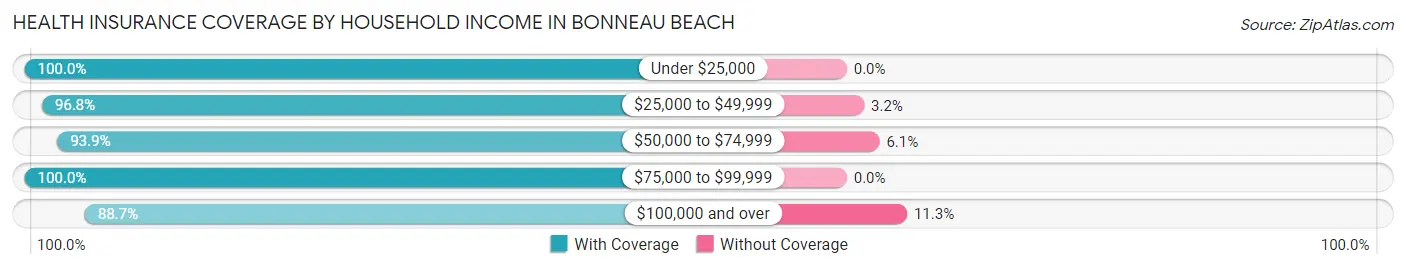
| Household Income | With Coverage | Without Coverage |
| Under $25,000 | 134 (100.0%) | 0 (0.0%) |
| $25,000 to $49,999 | 507 (96.8%) | 17 (3.2%) |
| $50,000 to $74,999 | 230 (93.9%) | 15 (6.1%) |
| $75,000 to $99,999 | 127 (100.0%) | 0 (0.0%) |
| $100,000 and over | 417 (88.7%) | 53 (11.3%) |
Public vs Private Health Insurance Coverage by Age in Bonneau Beach
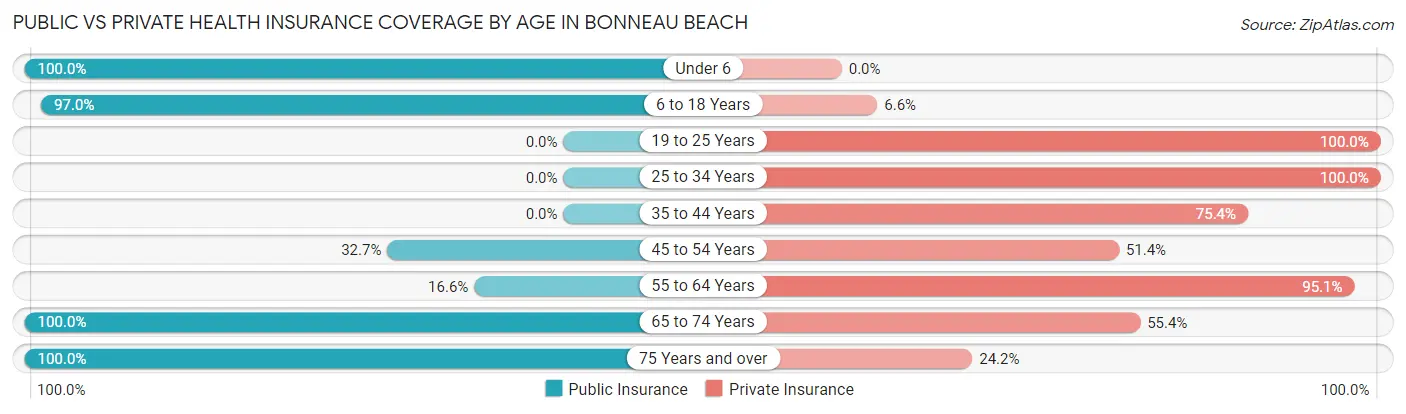
| Age Bracket | Public Insurance | Private Insurance |
| Under 6 | 56 (100.0%) | 0 (0.0%) |
| 6 to 18 Years | 191 (97.0%) | 13 (6.6%) |
| 19 to 25 Years | 0 (0.0%) | 16 (100.0%) |
| 25 to 34 Years | 0 (0.0%) | 23 (100.0%) |
| 35 to 44 Years | 0 (0.0%) | 52 (75.4%) |
| 45 to 54 Years | 68 (32.7%) | 107 (51.4%) |
| 55 to 64 Years | 51 (16.6%) | 293 (95.1%) |
| 65 to 74 Years | 334 (100.0%) | 185 (55.4%) |
| 75 Years and over | 289 (100.0%) | 70 (24.2%) |
| Total | 989 (65.9%) | 759 (50.6%) |
Disability Status by Sex by Age in Bonneau Beach
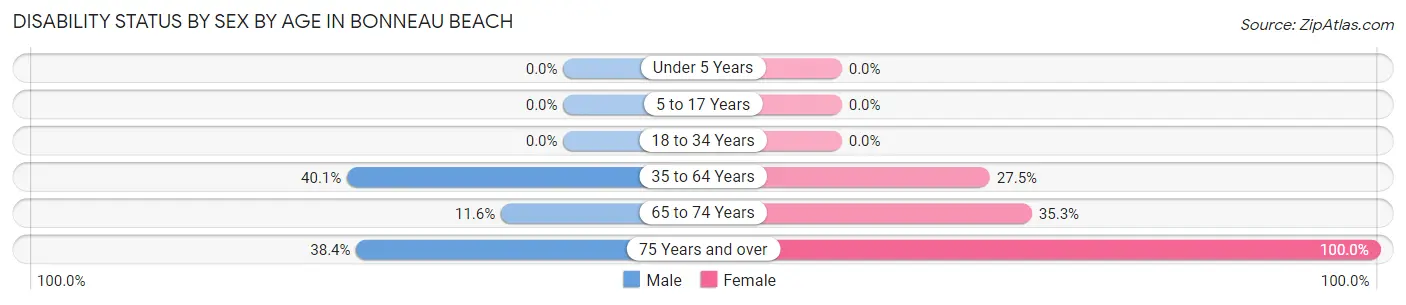
| Age Bracket | Male | Female |
| Under 5 Years | 0 (0.0%) | 0 (0.0%) |
| 5 to 17 Years | 0 (0.0%) | 0 (0.0%) |
| 18 to 34 Years | 0 (0.0%) | 0 (0.0%) |
| 35 to 64 Years | 118 (40.1%) | 80 (27.5%) |
| 65 to 74 Years | 17 (11.6%) | 66 (35.3%) |
| 75 Years and over | 73 (38.4%) | 99 (100.0%) |
Disability Class by Sex by Age in Bonneau Beach
Disability Class: Hearing Difficulty
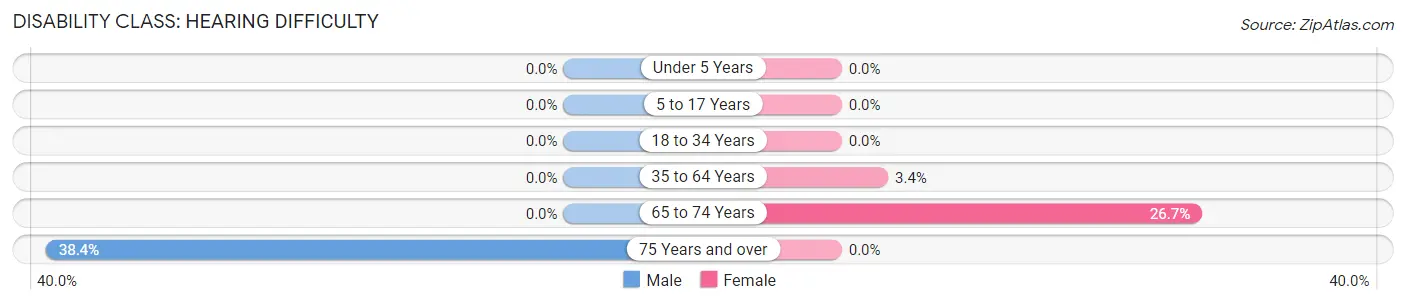
| Age Bracket | Male | Female |
| Under 5 Years | 0 (0.0%) | 0 (0.0%) |
| 5 to 17 Years | 0 (0.0%) | 0 (0.0%) |
| 18 to 34 Years | 0 (0.0%) | 0 (0.0%) |
| 35 to 64 Years | 0 (0.0%) | 10 (3.4%) |
| 65 to 74 Years | 0 (0.0%) | 50 (26.7%) |
| 75 Years and over | 73 (38.4%) | 0 (0.0%) |
Disability Class: Vision Difficulty
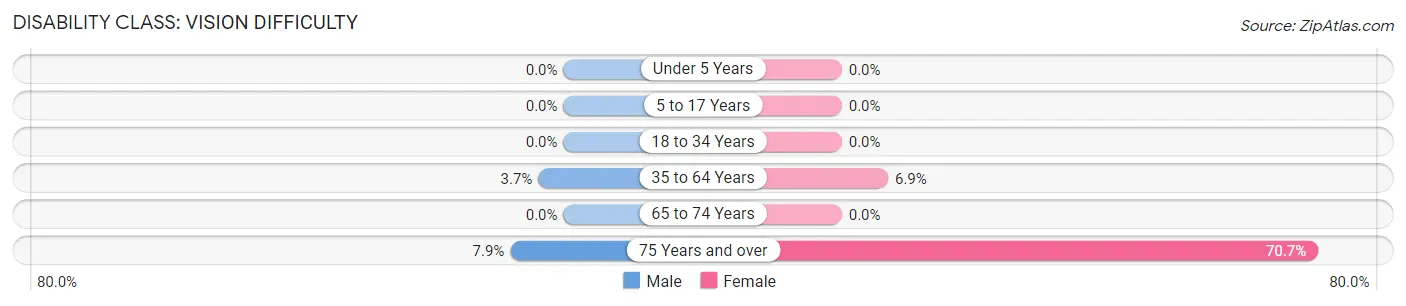
| Age Bracket | Male | Female |
| Under 5 Years | 0 (0.0%) | 0 (0.0%) |
| 5 to 17 Years | 0 (0.0%) | 0 (0.0%) |
| 18 to 34 Years | 0 (0.0%) | 0 (0.0%) |
| 35 to 64 Years | 11 (3.7%) | 20 (6.9%) |
| 65 to 74 Years | 0 (0.0%) | 0 (0.0%) |
| 75 Years and over | 15 (7.9%) | 70 (70.7%) |
Disability Class: Cognitive Difficulty
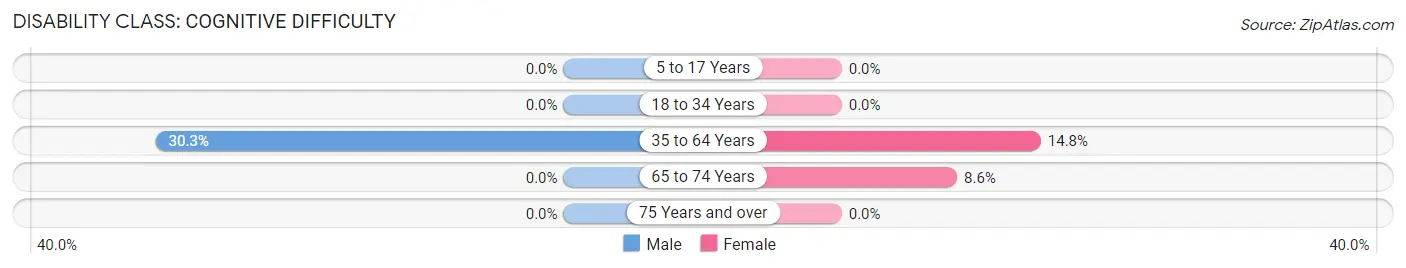
| Age Bracket | Male | Female |
| 5 to 17 Years | 0 (0.0%) | 0 (0.0%) |
| 18 to 34 Years | 0 (0.0%) | 0 (0.0%) |
| 35 to 64 Years | 89 (30.3%) | 43 (14.8%) |
| 65 to 74 Years | 0 (0.0%) | 16 (8.6%) |
| 75 Years and over | 0 (0.0%) | 0 (0.0%) |
Disability Class: Ambulatory Difficulty
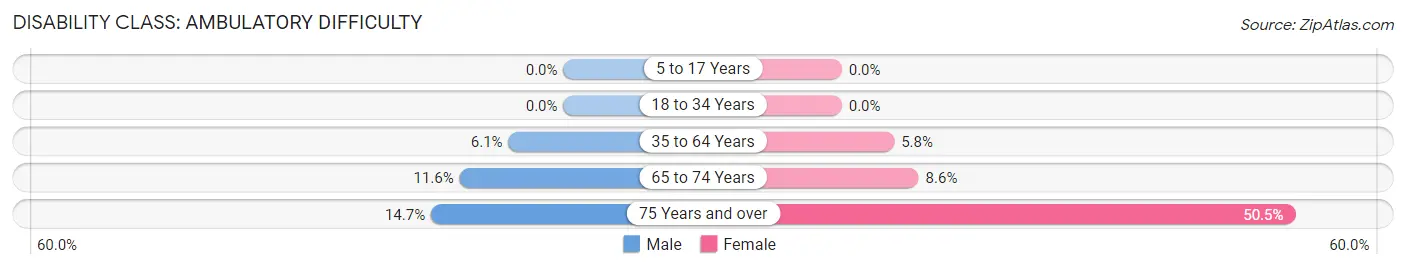
| Age Bracket | Male | Female |
| 5 to 17 Years | 0 (0.0%) | 0 (0.0%) |
| 18 to 34 Years | 0 (0.0%) | 0 (0.0%) |
| 35 to 64 Years | 18 (6.1%) | 17 (5.8%) |
| 65 to 74 Years | 17 (11.6%) | 16 (8.6%) |
| 75 Years and over | 28 (14.7%) | 50 (50.5%) |
Disability Class: Self-Care Difficulty
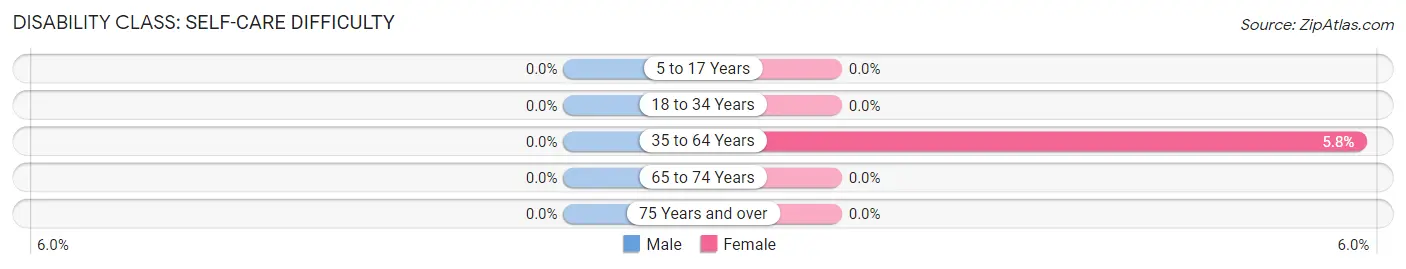
| Age Bracket | Male | Female |
| 5 to 17 Years | 0 (0.0%) | 0 (0.0%) |
| 18 to 34 Years | 0 (0.0%) | 0 (0.0%) |
| 35 to 64 Years | 0 (0.0%) | 17 (5.8%) |
| 65 to 74 Years | 0 (0.0%) | 0 (0.0%) |
| 75 Years and over | 0 (0.0%) | 0 (0.0%) |
Technology Access in Bonneau Beach
Computing Device Access in Bonneau Beach
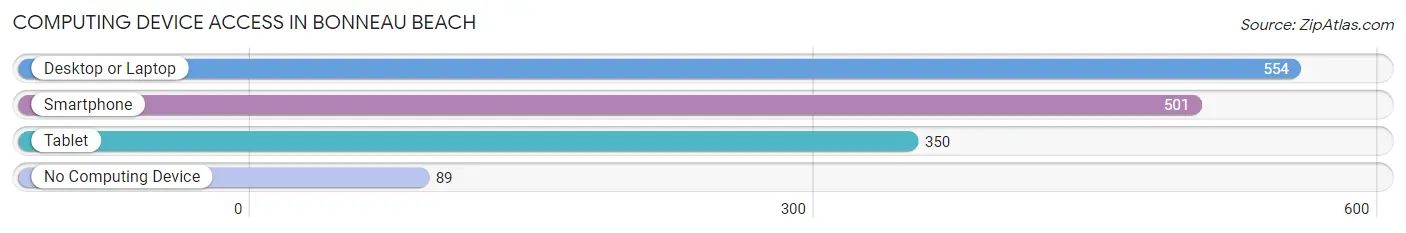
| Device Type | # Households | % Households |
| Desktop or Laptop | 554 | 79.6% |
| Smartphone | 501 | 72.0% |
| Tablet | 350 | 50.3% |
| No Computing Device | 89 | 12.8% |
| Total | 696 | 100.0% |
Internet Access in Bonneau Beach
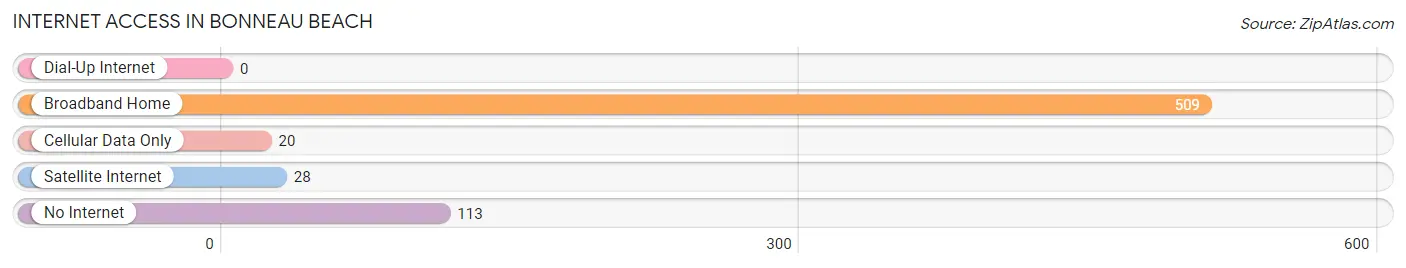
| Internet Type | # Households | % Households |
| Dial-Up Internet | 0 | 0.0% |
| Broadband Home | 509 | 73.1% |
| Cellular Data Only | 20 | 2.9% |
| Satellite Internet | 28 | 4.0% |
| No Internet | 113 | 16.2% |
| Total | 696 | 100.0% |
Bonneau Beach Summary
Bonneau Beach, SC is a small town located in Berkeley County, South Carolina. It is situated on the banks of the Cooper River, just south of the city of Charleston. The town has a population of just over 1,000 people and is a popular destination for tourists and locals alike.
History
Bonneau Beach, SC was first settled in the early 1700s by French Huguenots who had fled religious persecution in France. The town was named after the Huguenot leader, Jean Bonneau, who was the first to settle in the area. The town was originally a small fishing village, but it soon grew to become a popular destination for tourists and locals alike.
In the late 1800s, the town was home to a large number of wealthy plantation owners who built grand homes along the banks of the Cooper River. These homes were often used as summer retreats for the wealthy families of Charleston.
In the early 1900s, the town was home to a large number of African-American residents who worked in the local fishing industry. The town was also home to a number of small businesses, including a general store, a post office, and a hotel.
Geography
Bonneau Beach, SC is located in Berkeley County, South Carolina. It is situated on the banks of the Cooper River, just south of the city of Charleston. The town is surrounded by lush forests and wetlands, making it a popular destination for outdoor enthusiasts. The town is also home to a number of small islands, including the popular Folly Island.
Economy
The economy of Bonneau Beach, SC is largely based on tourism. The town is home to a number of popular attractions, including the historic Bonneau Beach Pier, the Bonneau Beach Marina, and the Bonneau Beach Nature Preserve. The town is also home to a number of small businesses, including restaurants, shops, and hotels.
Demographics
As of the 2010 census, the population of Bonneau Beach, SC was 1,072. The racial makeup of the town was 94.3% White, 2.7% African American, 0.3% Native American, 0.7% Asian, 0.1% Pacific Islander, and 1.9% from two or more races. The median household income in the town was $45,000, and the median home value was $170,000. The town is home to a number of churches, including the Bonneau Beach Baptist Church and the Bonneau Beach Presbyterian Church.
Common Questions
What is Per Capita Income in Bonneau Beach?
Per Capita income in Bonneau Beach is $34,816.
What is the Median Family Income in Bonneau Beach?
Median Family Income in Bonneau Beach is $63,413.
What is the Median Household income in Bonneau Beach?
Median Household Income in Bonneau Beach is $56,635.
What is Income or Wage Gap in Bonneau Beach?
Income or Wage Gap in Bonneau Beach is 50.5%.
Women in Bonneau Beach earn 49.5 cents for every dollar earned by a man.
What is Inequality or Gini Index in Bonneau Beach?
Inequality or Gini Index in Bonneau Beach is 0.44.
What is the Total Population of Bonneau Beach?
Total Population of Bonneau Beach is 1,500.
What is the Total Male Population of Bonneau Beach?
Total Male Population of Bonneau Beach is 821.
What is the Total Female Population of Bonneau Beach?
Total Female Population of Bonneau Beach is 679.
What is the Ratio of Males per 100 Females in Bonneau Beach?
There are 120.91 Males per 100 Females in Bonneau Beach.
What is the Ratio of Females per 100 Males in Bonneau Beach?
There are 82.70 Females per 100 Males in Bonneau Beach.
What is the Median Population Age in Bonneau Beach?
Median Population Age in Bonneau Beach is 57.9 Years.
What is the Average Family Size in Bonneau Beach
Average Family Size in Bonneau Beach is 2.6 People.
What is the Average Household Size in Bonneau Beach
Average Household Size in Bonneau Beach is 2.2 People.
How Large is the Labor Force in Bonneau Beach?
There are 488 People in the Labor Forcein in Bonneau Beach.
What is the Percentage of People in the Labor Force in Bonneau Beach?
38.1% of People are in the Labor Force in Bonneau Beach.