South Congaree, SC Map & Demographics
South Congaree Map
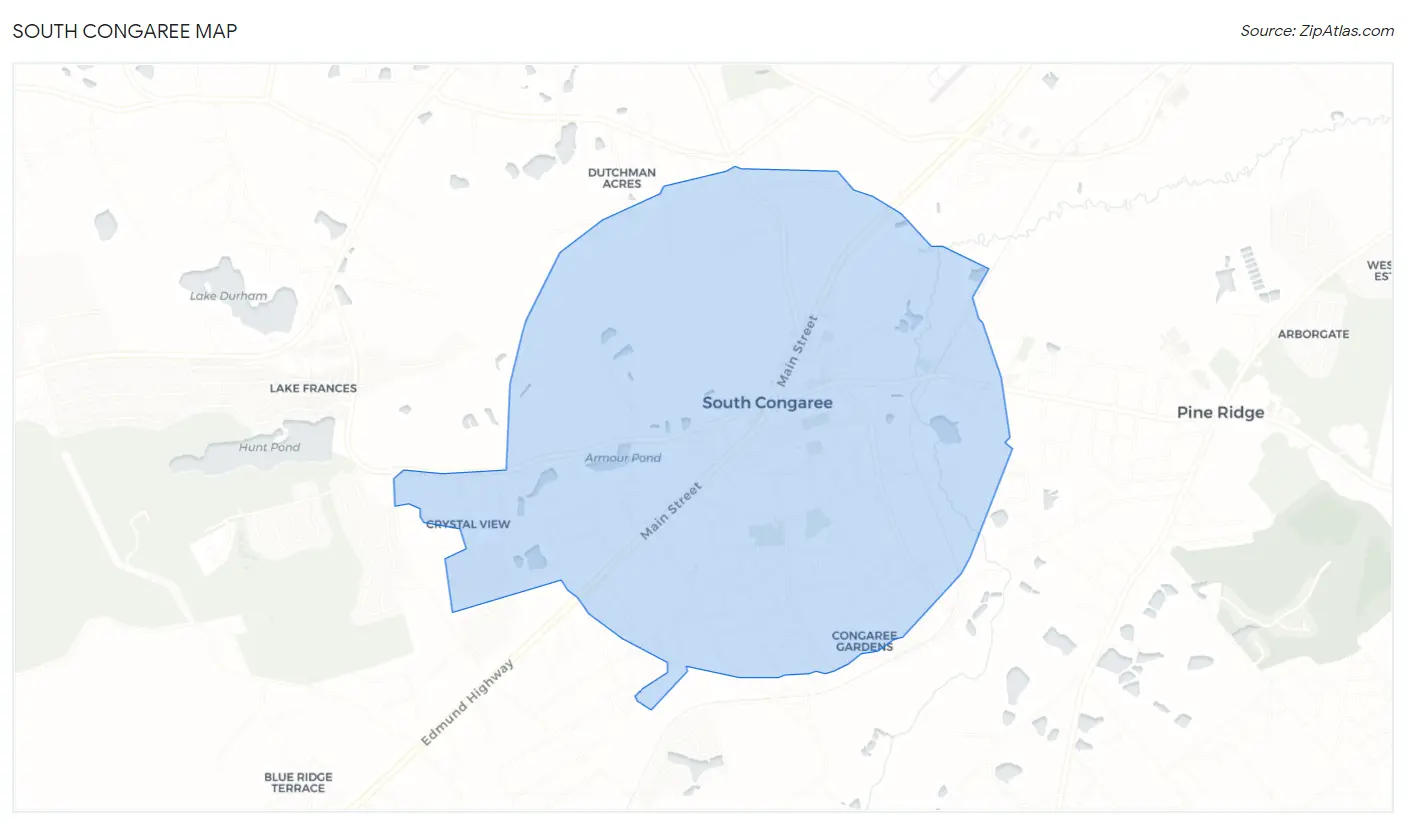
South Congaree Overview
$28,924
PER CAPITA INCOME
$60,542
AVG FAMILY INCOME
$55,636
AVG HOUSEHOLD INCOME
33.0%
WAGE / INCOME GAP [ % ]
67.0¢/ $1
WAGE / INCOME GAP [ $ ]
0.36
INEQUALITY / GINI INDEX
2,256
TOTAL POPULATION
1,076
MALE POPULATION
1,180
FEMALE POPULATION
91.19
MALES / 100 FEMALES
109.67
FEMALES / 100 MALES
37.4
MEDIAN AGE
2.7
AVG FAMILY SIZE
2.4
AVG HOUSEHOLD SIZE
1,269
LABOR FORCE [ PEOPLE ]
69.4%
PERCENT IN LABOR FORCE
2.6%
UNEMPLOYMENT RATE
Income in South Congaree
Income Overview in South Congaree
Per Capita Income in South Congaree is $28,924, while median incomes of families and households are $60,542 and $55,636 respectively.
| Characteristic | Number | Measure |
| Per Capita Income | 2,256 | $28,924 |
| Median Family Income | 669 | $60,542 |
| Mean Family Income | 669 | $78,676 |
| Median Household Income | 934 | $55,636 |
| Mean Household Income | 934 | $68,637 |
| Income Deficit | 669 | $0 |
| Wage / Income Gap (%) | 2,256 | 33.00% |
| Wage / Income Gap ($) | 2,256 | 67.00¢ per $1 |
| Gini / Inequality Index | 2,256 | 0.36 |
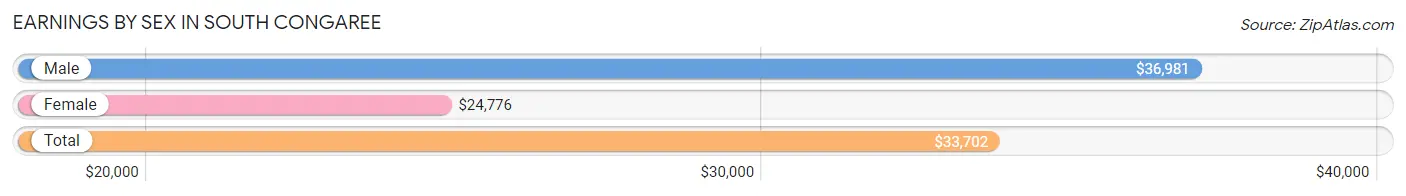
Earnings by Sex in South Congaree
Average Earnings in South Congaree are $33,702, $36,981 for men and $24,776 for women, a difference of 33.0%.
| Sex | Number | Average Earnings |
| Male | 649 (51.1%) | $36,981 |
| Female | 621 (48.9%) | $24,776 |
| Total | 1,270 (100.0%) | $33,702 |
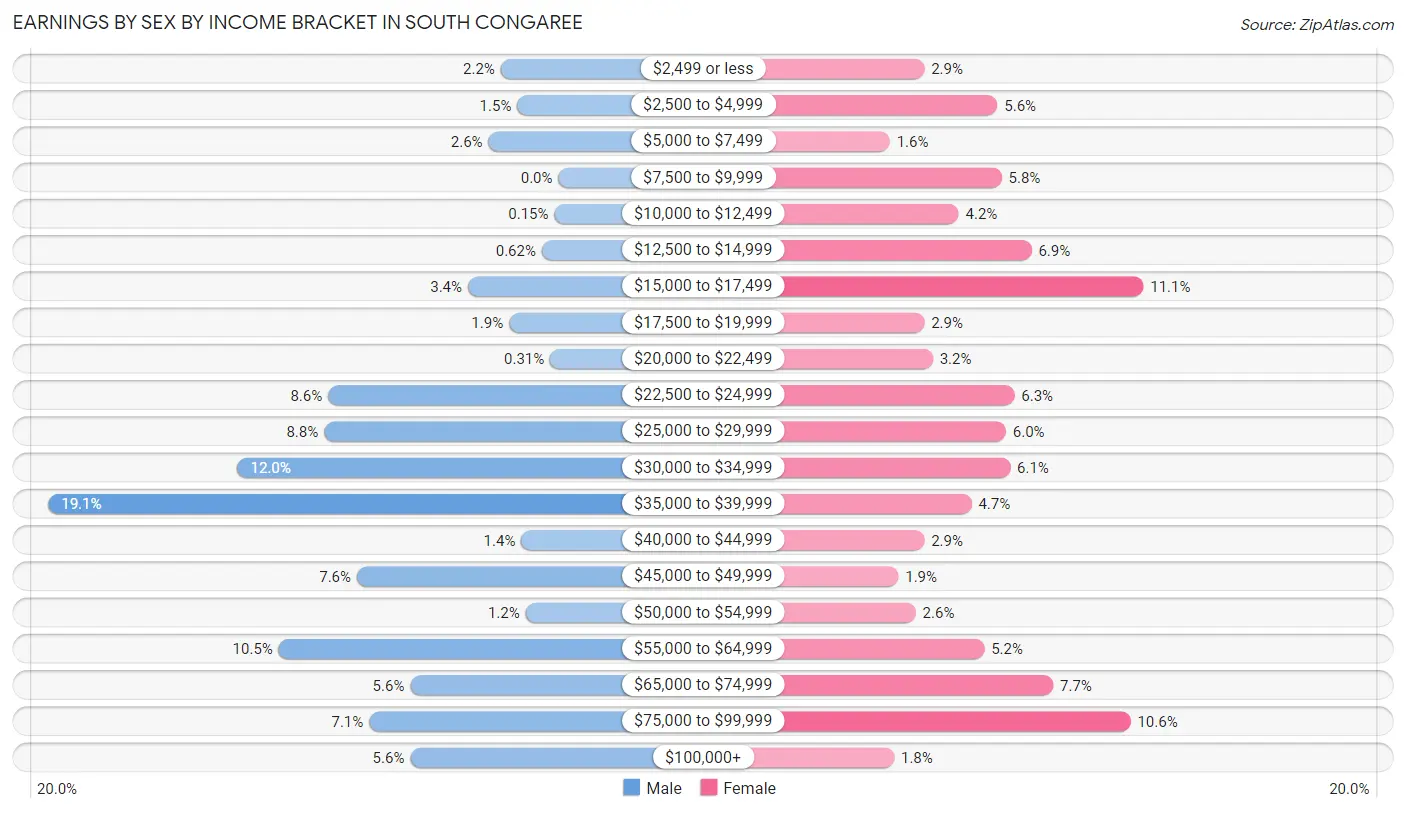
Earnings by Sex by Income Bracket in South Congaree
The most common earnings brackets in South Congaree are $35,000 to $39,999 for men (124 | 19.1%) and $15,000 to $17,499 for women (69 | 11.1%).
| Income | Male | Female |
| $2,499 or less | 14 (2.2%) | 18 (2.9%) |
| $2,500 to $4,999 | 10 (1.5%) | 35 (5.6%) |
| $5,000 to $7,499 | 17 (2.6%) | 10 (1.6%) |
| $7,500 to $9,999 | 0 (0.0%) | 36 (5.8%) |
| $10,000 to $12,499 | 1 (0.2%) | 26 (4.2%) |
| $12,500 to $14,999 | 4 (0.6%) | 43 (6.9%) |
| $15,000 to $17,499 | 22 (3.4%) | 69 (11.1%) |
| $17,500 to $19,999 | 12 (1.8%) | 18 (2.9%) |
| $20,000 to $22,499 | 2 (0.3%) | 20 (3.2%) |
| $22,500 to $24,999 | 56 (8.6%) | 39 (6.3%) |
| $25,000 to $29,999 | 57 (8.8%) | 37 (6.0%) |
| $30,000 to $34,999 | 78 (12.0%) | 38 (6.1%) |
| $35,000 to $39,999 | 124 (19.1%) | 29 (4.7%) |
| $40,000 to $44,999 | 9 (1.4%) | 18 (2.9%) |
| $45,000 to $49,999 | 49 (7.5%) | 12 (1.9%) |
| $50,000 to $54,999 | 8 (1.2%) | 16 (2.6%) |
| $55,000 to $64,999 | 68 (10.5%) | 32 (5.1%) |
| $65,000 to $74,999 | 36 (5.6%) | 48 (7.7%) |
| $75,000 to $99,999 | 46 (7.1%) | 66 (10.6%) |
| $100,000+ | 36 (5.6%) | 11 (1.8%) |
| Total | 649 (100.0%) | 621 (100.0%) |
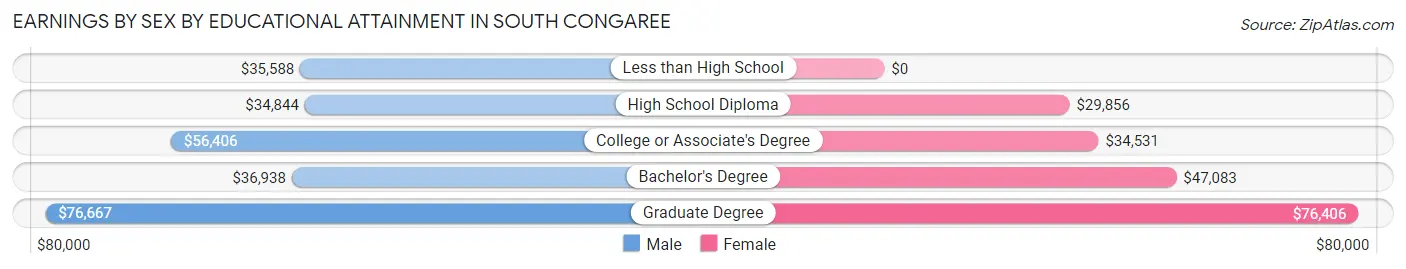
Earnings by Sex by Educational Attainment in South Congaree
Average earnings in South Congaree are $38,792 for men and $33,843 for women, a difference of 12.8%. Men with an educational attainment of graduate degree enjoy the highest average annual earnings of $76,667, while those with high school diploma education earn the least with $34,844. Women with an educational attainment of graduate degree earn the most with the average annual earnings of $76,406, while those with high school diploma education have the smallest earnings of $29,856.
| Educational Attainment | Male Income | Female Income |
| Less than High School | $35,588 | $0 |
| High School Diploma | $34,844 | $29,856 |
| College or Associate's Degree | $56,406 | $34,531 |
| Bachelor's Degree | $36,938 | $47,083 |
| Graduate Degree | $76,667 | $76,406 |
| Total | $38,792 | $33,843 |
Family Income in South Congaree
Family Income Brackets in South Congaree
According to the South Congaree family income data, there are 194 families falling into the $35,000 to $49,999 income range, which is the most common income bracket and makes up 29.0% of all families.
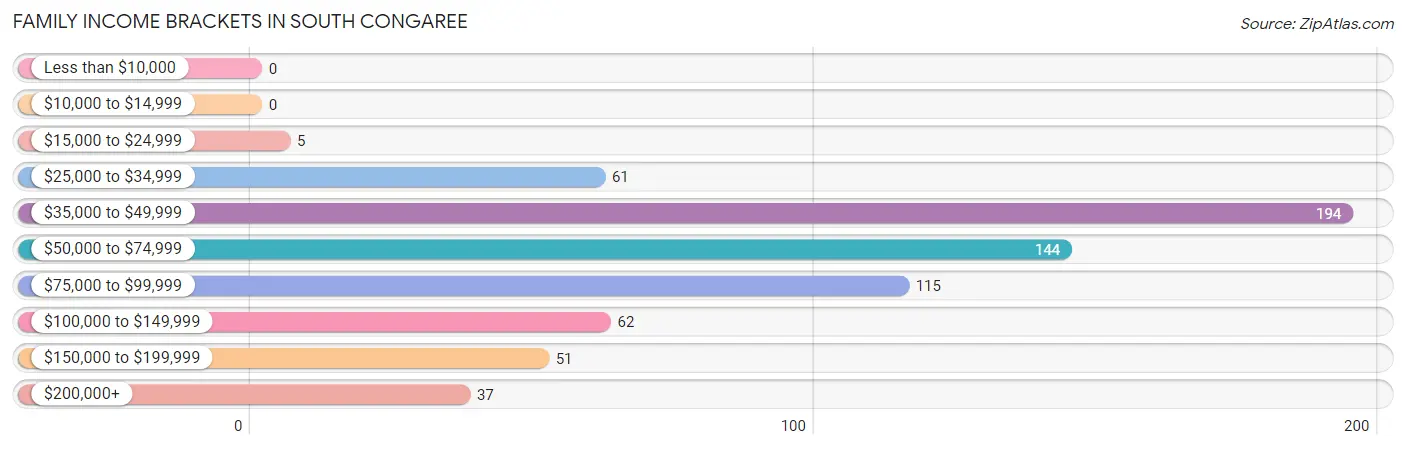
| Income Bracket | # Families | % Families |
| Less than $10,000 | 0 | 0.0% |
| $10,000 to $14,999 | 0 | 0.0% |
| $15,000 to $24,999 | 5 | 0.7% |
| $25,000 to $34,999 | 61 | 9.1% |
| $35,000 to $49,999 | 194 | 29.0% |
| $50,000 to $74,999 | 144 | 21.5% |
| $75,000 to $99,999 | 115 | 17.2% |
| $100,000 to $149,999 | 62 | 9.3% |
| $150,000 to $199,999 | 51 | 7.6% |
| $200,000+ | 37 | 5.5% |
Family Income by Famaliy Size in South Congaree
5-person families (43 | 6.4%) account for the highest median family income in South Congaree with $170,260 per family, while 5-person families (43 | 6.4%) have the highest median income of $34,052 per family member.
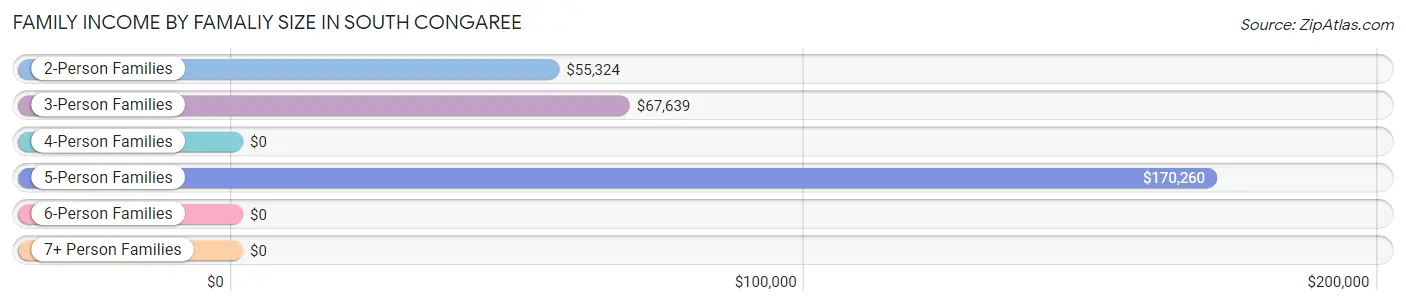
| Income Bracket | # Families | Median Income |
| 2-Person Families | 379 (56.7%) | $55,324 |
| 3-Person Families | 169 (25.3%) | $67,639 |
| 4-Person Families | 60 (9.0%) | $0 |
| 5-Person Families | 43 (6.4%) | $170,260 |
| 6-Person Families | 18 (2.7%) | $0 |
| 7+ Person Families | 0 (0.0%) | $0 |
| Total | 669 (100.0%) | $60,542 |
Family Income by Number of Earners in South Congaree
The median family income in South Congaree is $60,542, with families comprising 3+ earners (100) having the highest median family income of $150,833, while families with no earners (126) have the lowest median family income of $37,738, accounting for 14.9% and 18.8% of families, respectively.
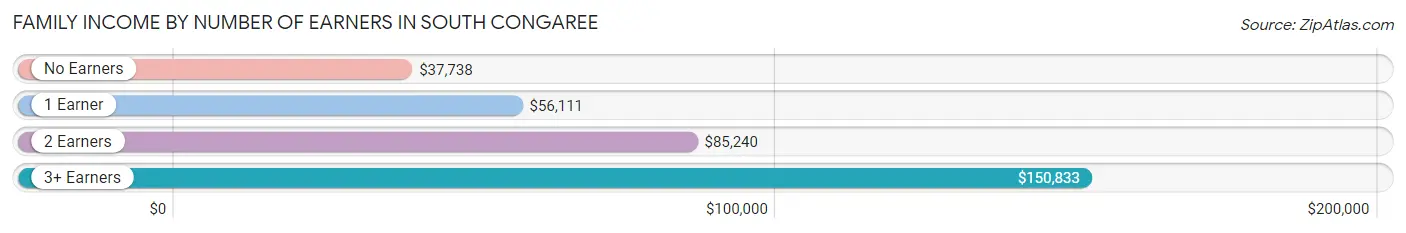
| Number of Earners | # Families | Median Income |
| No Earners | 126 (18.8%) | $37,738 |
| 1 Earner | 232 (34.7%) | $56,111 |
| 2 Earners | 211 (31.5%) | $85,240 |
| 3+ Earners | 100 (14.9%) | $150,833 |
| Total | 669 (100.0%) | $60,542 |
Household Income in South Congaree
Household Income Brackets in South Congaree
With 238 households falling in the category, the $35,000 to $49,999 income range is the most frequent in South Congaree, accounting for 25.5% of all households. In contrast, only 9 households (1.0%) fall into the less than $10,000 income bracket, making it the least populous group.
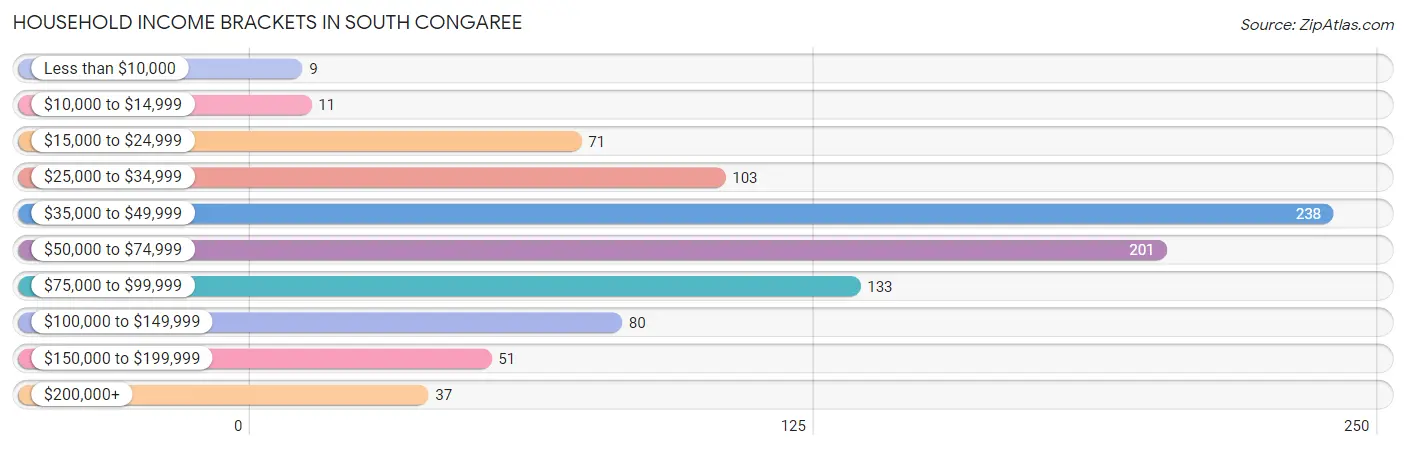
| Income Bracket | # Households | % Households |
| Less than $10,000 | 9 | 1.0% |
| $10,000 to $14,999 | 11 | 1.2% |
| $15,000 to $24,999 | 71 | 7.6% |
| $25,000 to $34,999 | 103 | 11.0% |
| $35,000 to $49,999 | 238 | 25.5% |
| $50,000 to $74,999 | 201 | 21.5% |
| $75,000 to $99,999 | 133 | 14.2% |
| $100,000 to $149,999 | 80 | 8.6% |
| $150,000 to $199,999 | 51 | 5.5% |
| $200,000+ | 37 | 4.0% |
Household Income by Householder Age in South Congaree
The median household income in South Congaree is $55,636, with the highest median household income of $73,482 found in the 45 to 64 years age bracket for the primary householder. A total of 389 households (41.6%) fall into this category. Meanwhile, the 15 to 24 years age bracket for the primary householder has the lowest median household income of $0, with 34 households (3.6%) in this group.
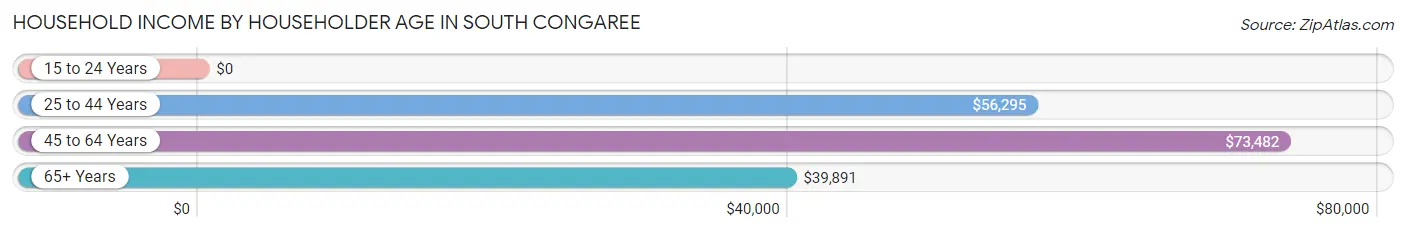
| Income Bracket | # Households | Median Income |
| 15 to 24 Years | 34 (3.6%) | $0 |
| 25 to 44 Years | 327 (35.0%) | $56,295 |
| 45 to 64 Years | 389 (41.6%) | $73,482 |
| 65+ Years | 184 (19.7%) | $39,891 |
| Total | 934 (100.0%) | $55,636 |
Poverty in South Congaree
Income Below Poverty by Sex and Age in South Congaree
With 10.0% poverty level for males and 8.6% for females among the residents of South Congaree, under 5 year old males and 5 year old females are the most vulnerable to poverty, with 23 males (46.0%) and 8 females (100.0%) in their respective age groups living below the poverty level.
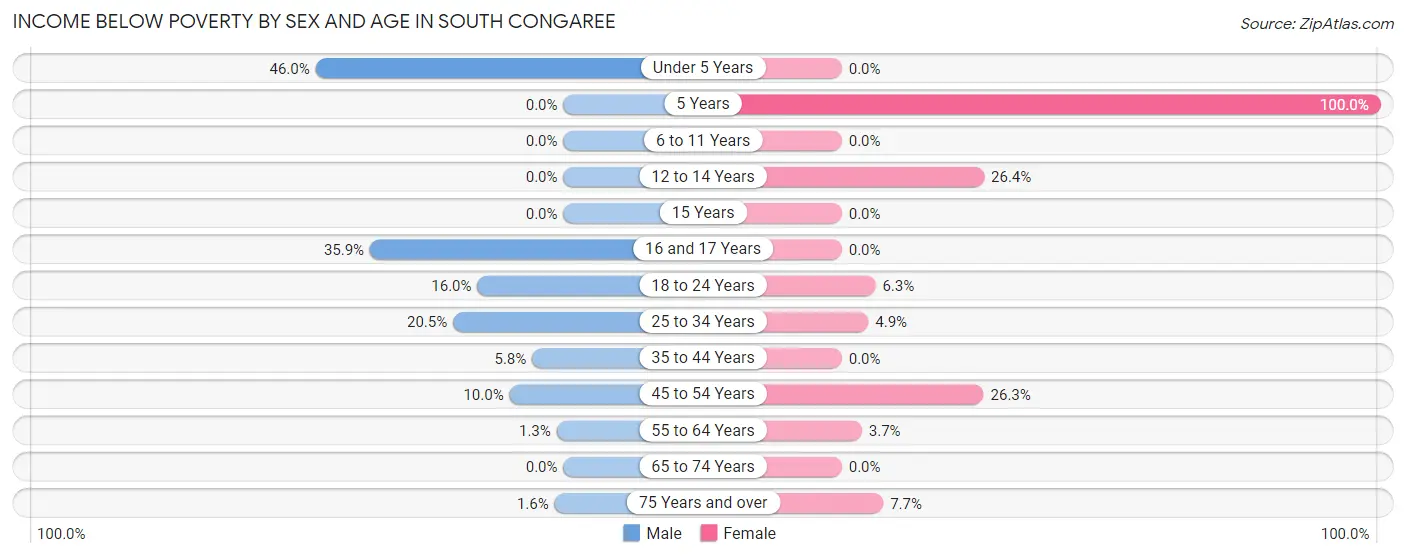
| Age Bracket | Male | Female |
| Under 5 Years | 23 (46.0%) | 0 (0.0%) |
| 5 Years | 0 (0.0%) | 8 (100.0%) |
| 6 to 11 Years | 0 (0.0%) | 0 (0.0%) |
| 12 to 14 Years | 0 (0.0%) | 14 (26.4%) |
| 15 Years | 0 (0.0%) | 0 (0.0%) |
| 16 and 17 Years | 14 (35.9%) | 0 (0.0%) |
| 18 to 24 Years | 15 (16.0%) | 7 (6.2%) |
| 25 to 34 Years | 26 (20.5%) | 10 (4.9%) |
| 35 to 44 Years | 8 (5.8%) | 0 (0.0%) |
| 45 to 54 Years | 19 (10.0%) | 50 (26.3%) |
| 55 to 64 Years | 2 (1.3%) | 5 (3.7%) |
| 65 to 74 Years | 0 (0.0%) | 0 (0.0%) |
| 75 Years and over | 1 (1.6%) | 7 (7.7%) |
| Total | 108 (10.0%) | 101 (8.6%) |
Income Above Poverty by Sex and Age in South Congaree
According to the poverty statistics in South Congaree, males aged 6 to 11 years and females aged under 5 years are the age groups that are most secure financially, with 100.0% of males and 100.0% of females in these age groups living above the poverty line.
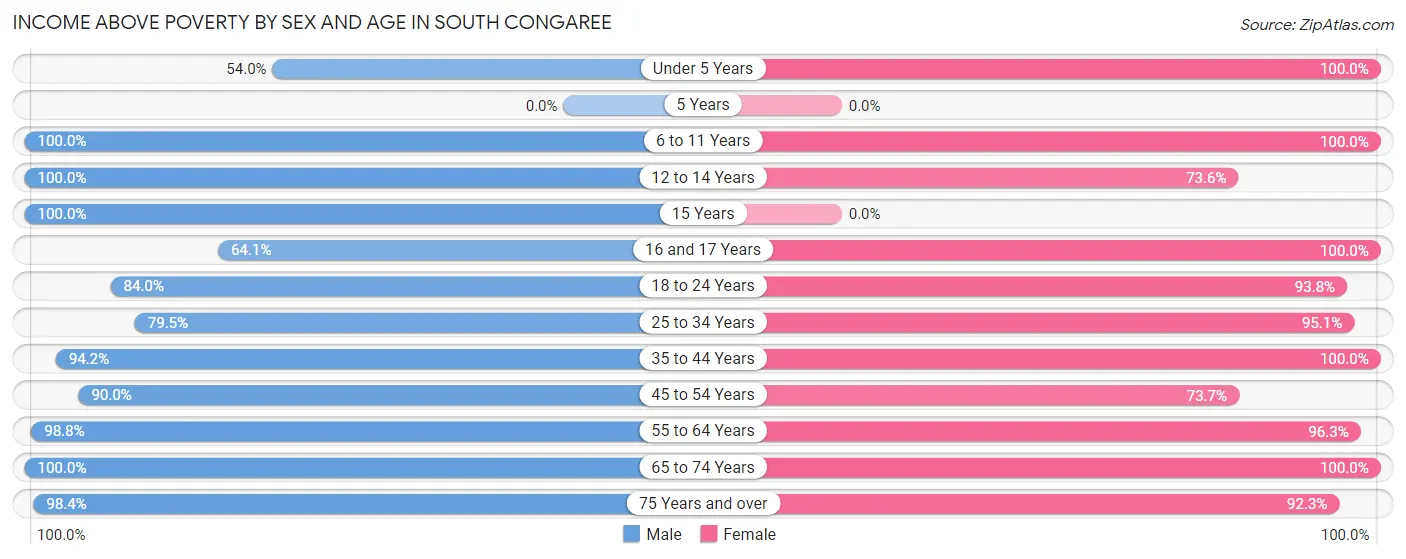
| Age Bracket | Male | Female |
| Under 5 Years | 27 (54.0%) | 100 (100.0%) |
| 5 Years | 0 (0.0%) | 0 (0.0%) |
| 6 to 11 Years | 106 (100.0%) | 65 (100.0%) |
| 12 to 14 Years | 42 (100.0%) | 39 (73.6%) |
| 15 Years | 4 (100.0%) | 0 (0.0%) |
| 16 and 17 Years | 25 (64.1%) | 33 (100.0%) |
| 18 to 24 Years | 79 (84.0%) | 105 (93.8%) |
| 25 to 34 Years | 101 (79.5%) | 193 (95.1%) |
| 35 to 44 Years | 130 (94.2%) | 107 (100.0%) |
| 45 to 54 Years | 171 (90.0%) | 140 (73.7%) |
| 55 to 64 Years | 158 (98.8%) | 129 (96.3%) |
| 65 to 74 Years | 65 (100.0%) | 84 (100.0%) |
| 75 Years and over | 60 (98.4%) | 84 (92.3%) |
| Total | 968 (90.0%) | 1,079 (91.4%) |
Income Below Poverty Among Married-Couple Families in South Congaree
The poverty statistics for married-couple families in South Congaree show that 2.2% or 8 of the total 371 families live below the poverty line. Families with 3 or 4 children have the highest poverty rate of 32.0%, comprising of 8 families. On the other hand, families with no children have the lowest poverty rate of 0.0%, which includes 0 families.
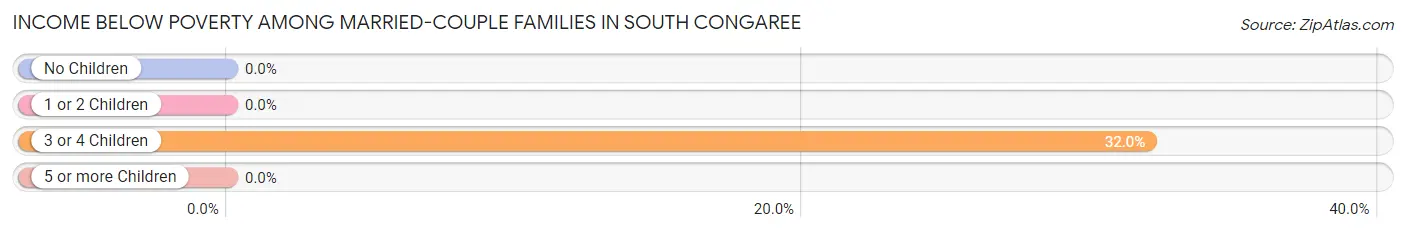
| Children | Above Poverty | Below Poverty |
| No Children | 222 (100.0%) | 0 (0.0%) |
| 1 or 2 Children | 124 (100.0%) | 0 (0.0%) |
| 3 or 4 Children | 17 (68.0%) | 8 (32.0%) |
| 5 or more Children | 0 (0.0%) | 0 (0.0%) |
| Total | 363 (97.8%) | 8 (2.2%) |
Income Below Poverty Among Single-Parent Households in South Congaree
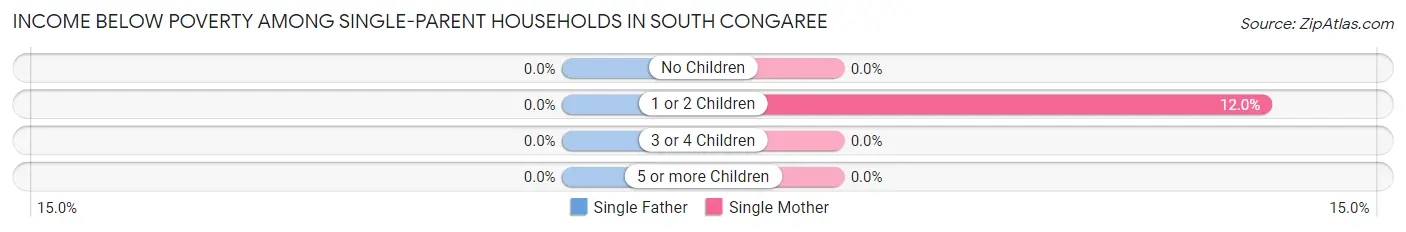
| Children | Single Father | Single Mother |
| No Children | 0 (0.0%) | 0 (0.0%) |
| 1 or 2 Children | 0 (0.0%) | 14 (12.0%) |
| 3 or 4 Children | 0 (0.0%) | 0 (0.0%) |
| 5 or more Children | 0 (0.0%) | 0 (0.0%) |
| Total | 0 (0.0%) | 14 (6.5%) |
Income Below Poverty Among Married-Couple vs Single-Parent Households in South Congaree
The poverty data for South Congaree shows that 8 of the married-couple family households (2.2%) and 14 of the single-parent households (4.7%) are living below the poverty level. Within the married-couple family households, those with 3 or 4 children have the highest poverty rate, with 8 households (32.0%) falling below the poverty line. Among the single-parent households, those with 1 or 2 children have the highest poverty rate, with 14 household (8.5%) living below poverty.
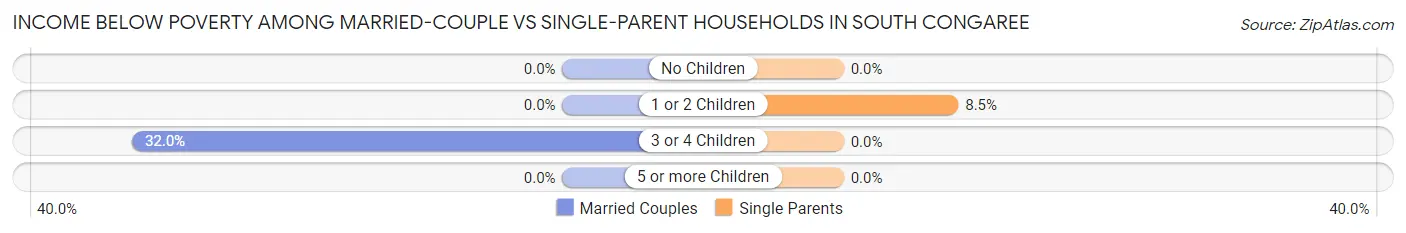
| Children | Married-Couple Families | Single-Parent Households |
| No Children | 0 (0.0%) | 0 (0.0%) |
| 1 or 2 Children | 0 (0.0%) | 14 (8.5%) |
| 3 or 4 Children | 8 (32.0%) | 0 (0.0%) |
| 5 or more Children | 0 (0.0%) | 0 (0.0%) |
| Total | 8 (2.2%) | 14 (4.7%) |
Race in South Congaree
The most populous races in South Congaree are White / Caucasian (1,728 | 76.6%), Black / African American (300 | 13.3%), and Two or more Races (136 | 6.0%).
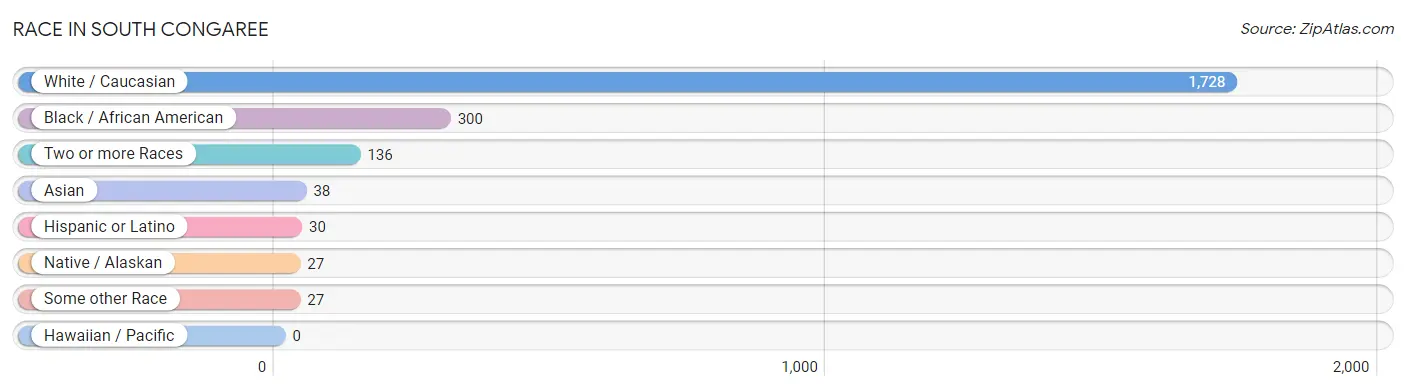
| Race | # Population | % Population |
| Asian | 38 | 1.7% |
| Black / African American | 300 | 13.3% |
| Hawaiian / Pacific | 0 | 0.0% |
| Hispanic or Latino | 30 | 1.3% |
| Native / Alaskan | 27 | 1.2% |
| White / Caucasian | 1,728 | 76.6% |
| Two or more Races | 136 | 6.0% |
| Some other Race | 27 | 1.2% |
| Total | 2,256 | 100.0% |
Ancestry in South Congaree
The most populous ancestries reported in South Congaree are German (343 | 15.2%), English (276 | 12.2%), American (245 | 10.9%), Irish (215 | 9.5%), and Scotch-Irish (91 | 4.0%), together accounting for 51.8% of all South Congaree residents.
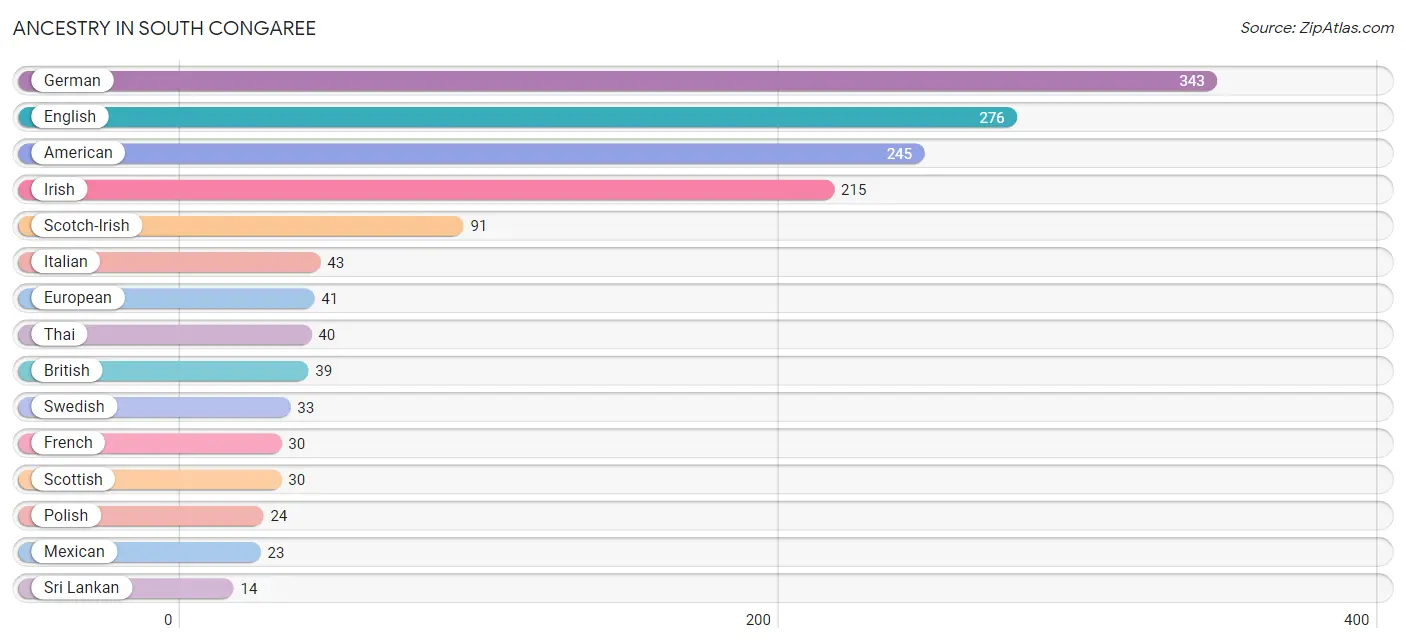
| Ancestry | # Population | % Population |
| American | 245 | 10.9% |
| British | 39 | 1.7% |
| Burmese | 6 | 0.3% |
| Cherokee | 5 | 0.2% |
| Dutch | 6 | 0.3% |
| English | 276 | 12.2% |
| European | 41 | 1.8% |
| French | 30 | 1.3% |
| French Canadian | 6 | 0.3% |
| German | 343 | 15.2% |
| Irish | 215 | 9.5% |
| Italian | 43 | 1.9% |
| Mexican | 23 | 1.0% |
| Native Hawaiian | 12 | 0.5% |
| Nigerian | 3 | 0.1% |
| Norwegian | 12 | 0.5% |
| Polish | 24 | 1.1% |
| Puerto Rican | 7 | 0.3% |
| Russian | 7 | 0.3% |
| Scotch-Irish | 91 | 4.0% |
| Scottish | 30 | 1.3% |
| Slavic | 7 | 0.3% |
| Sri Lankan | 14 | 0.6% |
| Subsaharan African | 3 | 0.1% |
| Swedish | 33 | 1.5% |
| Thai | 40 | 1.8% |
| Yugoslavian | 5 | 0.2% | View All 27 Rows |
Immigrants in South Congaree
The most numerous immigrant groups reported in South Congaree came from Asia (38 | 1.7%), South Eastern Asia (26 | 1.1%), Vietnam (14 | 0.6%), Eastern Asia (12 | 0.5%), and Laos (12 | 0.5%), together accounting for 4.5% of all South Congaree residents.
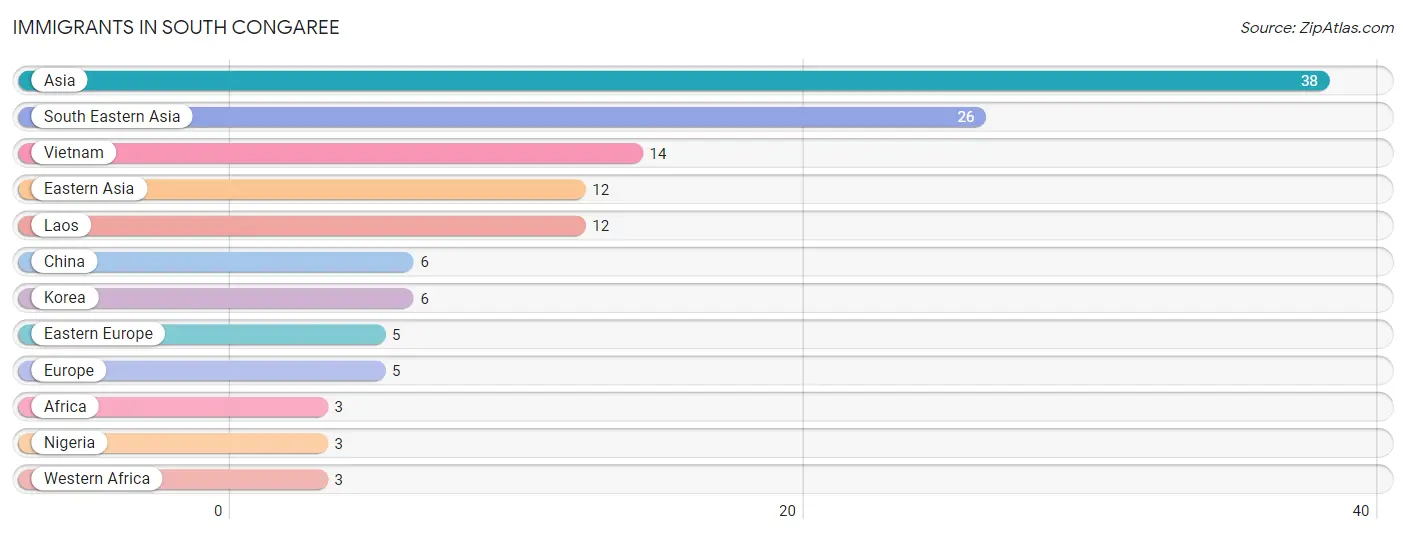
| Immigration Origin | # Population | % Population |
| Africa | 3 | 0.1% |
| Asia | 38 | 1.7% |
| China | 6 | 0.3% |
| Eastern Asia | 12 | 0.5% |
| Eastern Europe | 5 | 0.2% |
| Europe | 5 | 0.2% |
| Korea | 6 | 0.3% |
| Laos | 12 | 0.5% |
| Nigeria | 3 | 0.1% |
| South Eastern Asia | 26 | 1.1% |
| Vietnam | 14 | 0.6% |
| Western Africa | 3 | 0.1% | View All 12 Rows |
Sex and Age in South Congaree
Sex and Age in South Congaree
The most populous age groups in South Congaree are 45 to 49 Years (120 | 11.2%) for men and 25 to 29 Years (107 | 9.1%) for women.
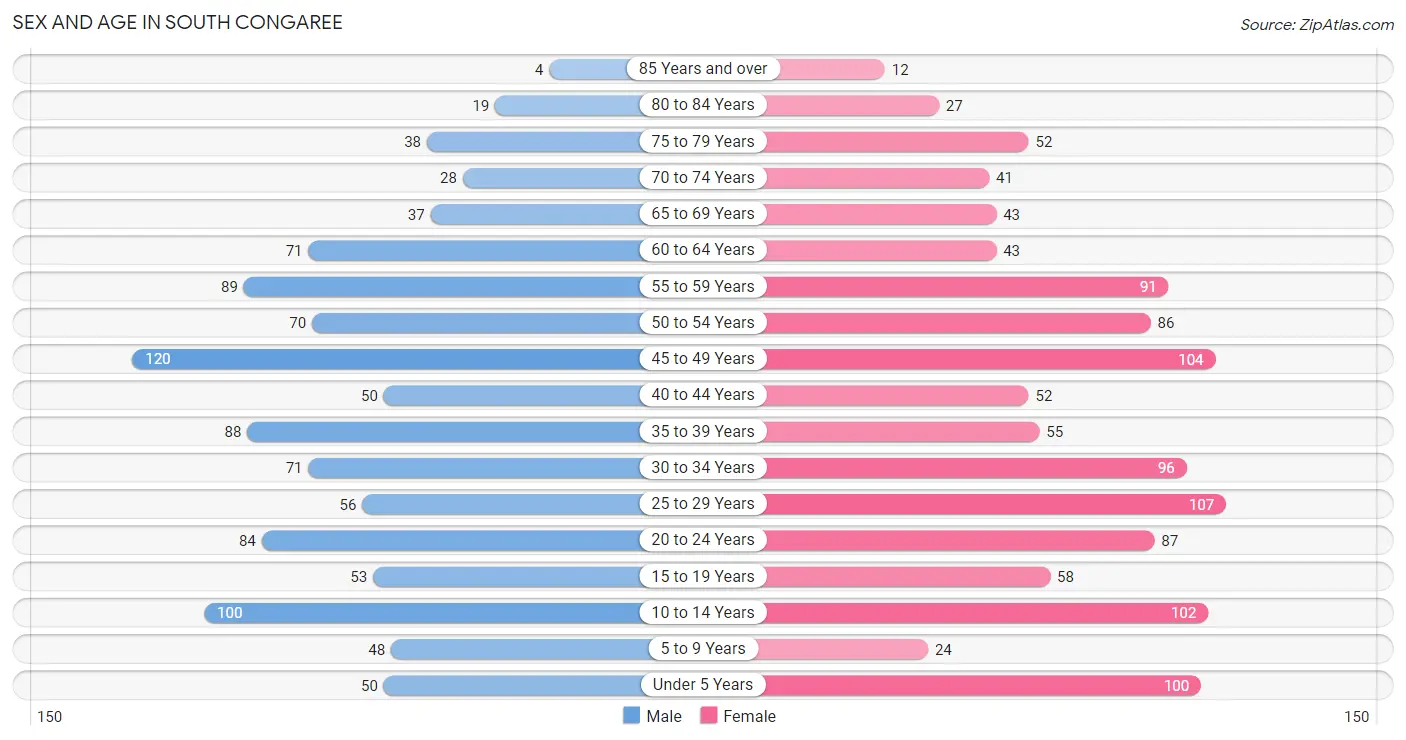
| Age Bracket | Male | Female |
| Under 5 Years | 50 (4.6%) | 100 (8.5%) |
| 5 to 9 Years | 48 (4.5%) | 24 (2.0%) |
| 10 to 14 Years | 100 (9.3%) | 102 (8.6%) |
| 15 to 19 Years | 53 (4.9%) | 58 (4.9%) |
| 20 to 24 Years | 84 (7.8%) | 87 (7.4%) |
| 25 to 29 Years | 56 (5.2%) | 107 (9.1%) |
| 30 to 34 Years | 71 (6.6%) | 96 (8.1%) |
| 35 to 39 Years | 88 (8.2%) | 55 (4.7%) |
| 40 to 44 Years | 50 (4.6%) | 52 (4.4%) |
| 45 to 49 Years | 120 (11.2%) | 104 (8.8%) |
| 50 to 54 Years | 70 (6.5%) | 86 (7.3%) |
| 55 to 59 Years | 89 (8.3%) | 91 (7.7%) |
| 60 to 64 Years | 71 (6.6%) | 43 (3.6%) |
| 65 to 69 Years | 37 (3.4%) | 43 (3.6%) |
| 70 to 74 Years | 28 (2.6%) | 41 (3.5%) |
| 75 to 79 Years | 38 (3.5%) | 52 (4.4%) |
| 80 to 84 Years | 19 (1.8%) | 27 (2.3%) |
| 85 Years and over | 4 (0.4%) | 12 (1.0%) |
| Total | 1,076 (100.0%) | 1,180 (100.0%) |
Families and Households in South Congaree
Median Family Size in South Congaree
The median family size in South Congaree is 2.74 persons per family, with married-couple families (371 | 55.5%) accounting for the largest median family size of 2.99 persons per family. On the other hand, single male/father families (84 | 12.6%) represent the smallest median family size with 1.93 persons per family.
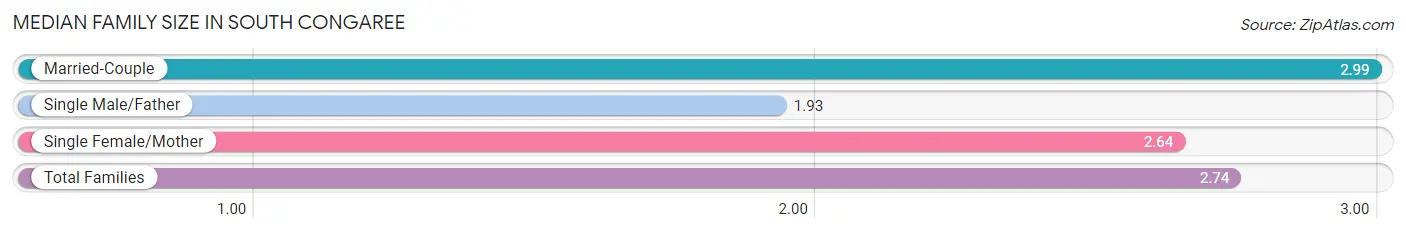
| Family Type | # Families | Family Size |
| Married-Couple | 371 (55.5%) | 2.99 |
| Single Male/Father | 84 (12.6%) | 1.93 |
| Single Female/Mother | 214 (32.0%) | 2.64 |
| Total Families | 669 (100.0%) | 2.74 |
Median Household Size in South Congaree
The median household size in South Congaree is 2.40 persons per household, with married-couple households (371 | 39.7%) accounting for the largest median household size of 2.99 persons per household. non-family households (265 | 28.4%) represent the smallest median household size with 1.28 persons per household.
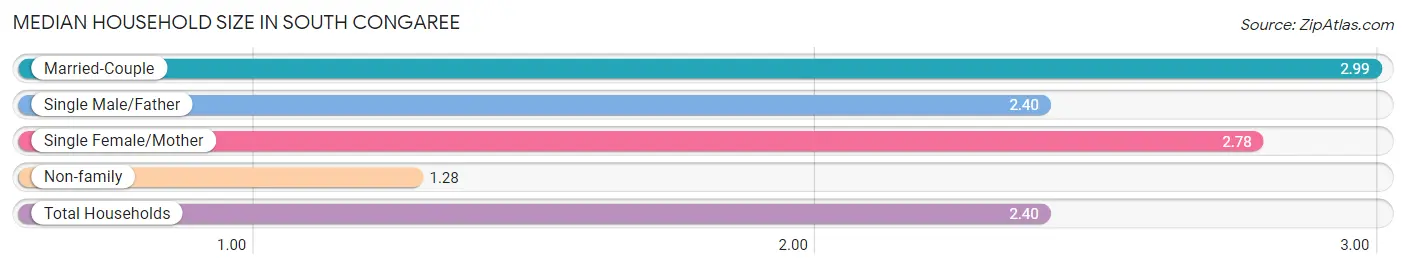
| Household Type | # Households | Household Size |
| Married-Couple | 371 (39.7%) | 2.99 |
| Single Male/Father | 84 (9.0%) | 2.40 |
| Single Female/Mother | 214 (22.9%) | 2.78 |
| Non-family | 265 (28.4%) | 1.28 |
| Total Households | 934 (100.0%) | 2.40 |
Household Size by Marriage Status in South Congaree
Out of a total of 934 households in South Congaree, 669 (71.6%) are family households, while 265 (28.4%) are nonfamily households. The most numerous type of family households are 2-person households, comprising 340, and the most common type of nonfamily households are 1-person households, comprising 222.
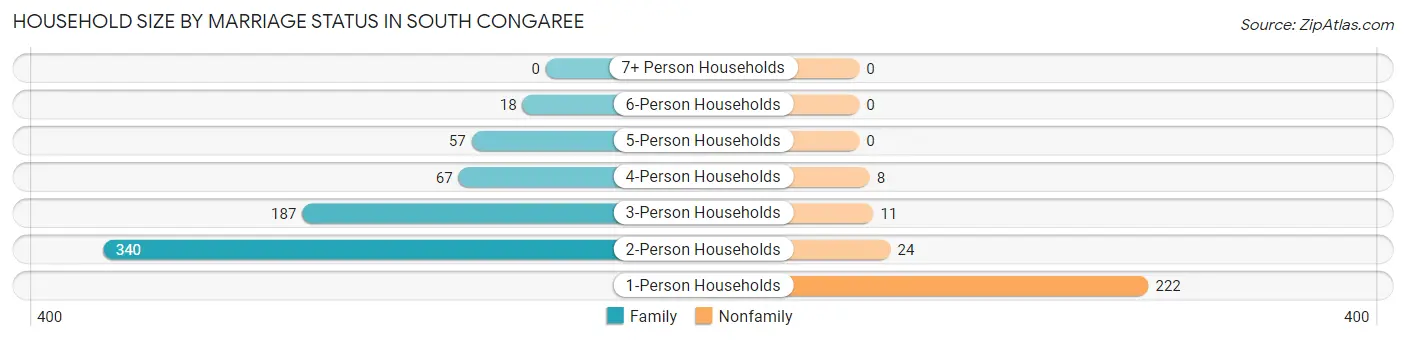
| Household Size | Family Households | Nonfamily Households |
| 1-Person Households | - | 222 (23.8%) |
| 2-Person Households | 340 (36.4%) | 24 (2.6%) |
| 3-Person Households | 187 (20.0%) | 11 (1.2%) |
| 4-Person Households | 67 (7.2%) | 8 (0.9%) |
| 5-Person Households | 57 (6.1%) | 0 (0.0%) |
| 6-Person Households | 18 (1.9%) | 0 (0.0%) |
| 7+ Person Households | 0 (0.0%) | 0 (0.0%) |
| Total | 669 (71.6%) | 265 (28.4%) |
Female Fertility in South Congaree
Fertility by Age in South Congaree
Average fertility rate in South Congaree is 38.0 births per 1,000 women. Women in the age bracket of 20 to 34 years have the highest fertility rate with 55.0 births per 1,000 women. Women in the age bracket of 20 to 34 years acount for 69.6% of all women with births.
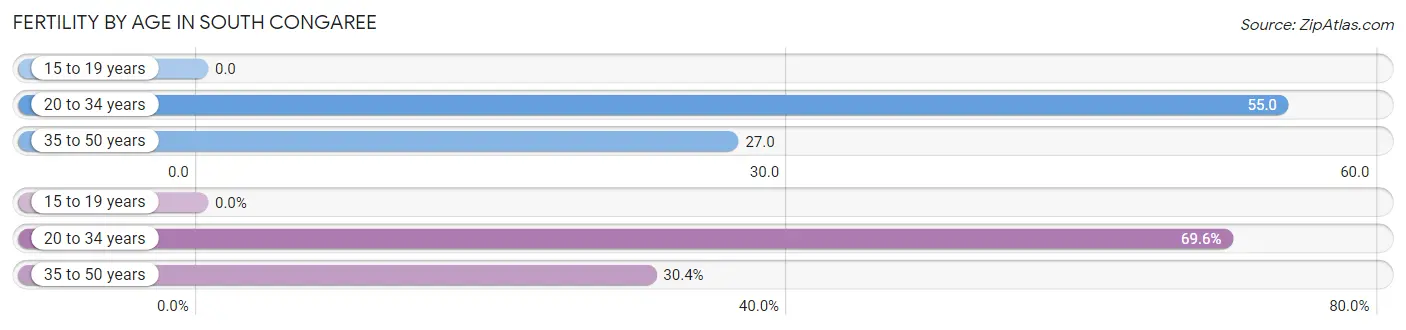
| Age Bracket | Women with Births | Births / 1,000 Women |
| 15 to 19 years | 0 (0.0%) | 0.0 |
| 20 to 34 years | 16 (69.6%) | 55.0 |
| 35 to 50 years | 7 (30.4%) | 27.0 |
| Total | 23 (100.0%) | 38.0 |
Fertility by Age by Marriage Status in South Congaree
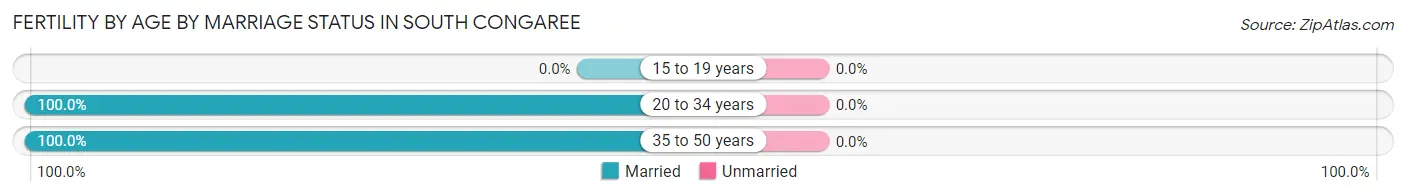
| Age Bracket | Married | Unmarried |
| 15 to 19 years | 0 (0.0%) | 0 (0.0%) |
| 20 to 34 years | 16 (100.0%) | 0 (0.0%) |
| 35 to 50 years | 7 (100.0%) | 0 (0.0%) |
| Total | 23 (100.0%) | 0 (0.0%) |
Fertility by Education in South Congaree
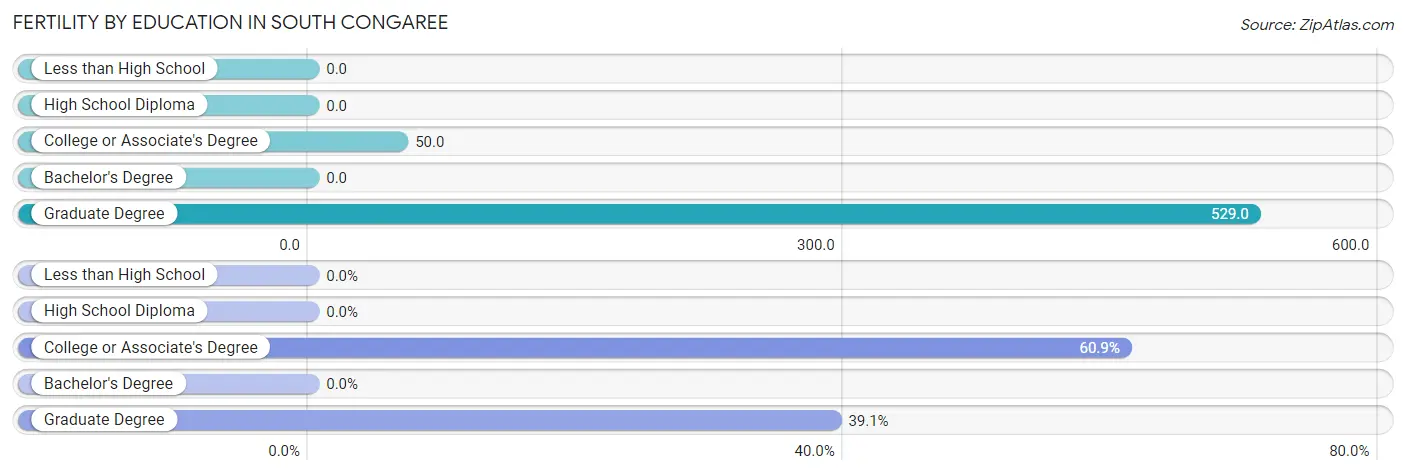
| Educational Attainment | Women with Births | Births / 1,000 Women |
| Less than High School | 0 (0.0%) | 0.0 |
| High School Diploma | 0 (0.0%) | 0.0 |
| College or Associate's Degree | 14 (60.9%) | 50.0 |
| Bachelor's Degree | 0 (0.0%) | 0.0 |
| Graduate Degree | 9 (39.1%) | 529.0 |
| Total | 23 (100.0%) | 38.0 |
Fertility by Education by Marriage Status in South Congaree
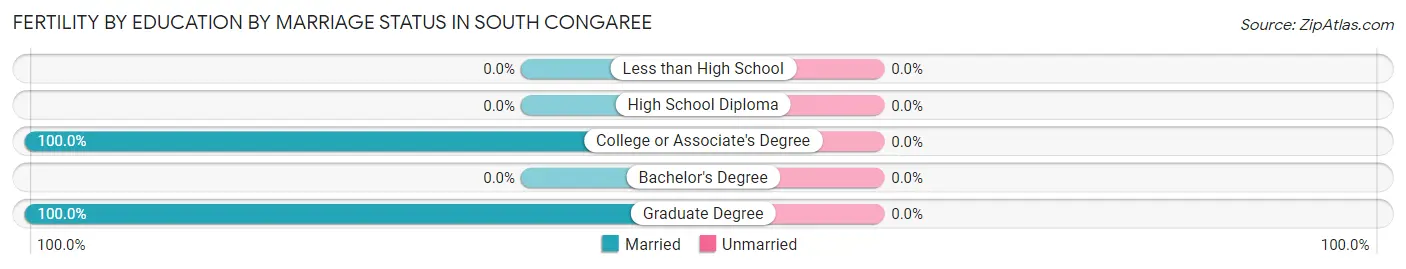
| Educational Attainment | Married | Unmarried |
| Less than High School | 0 (0.0%) | 0 (0.0%) |
| High School Diploma | 0 (0.0%) | 0 (0.0%) |
| College or Associate's Degree | 14 (100.0%) | 0 (0.0%) |
| Bachelor's Degree | 0 (0.0%) | 0 (0.0%) |
| Graduate Degree | 9 (100.0%) | 0 (0.0%) |
| Total | 23 (100.0%) | 0 (0.0%) |
Employment Characteristics in South Congaree
Employment by Class of Employer in South Congaree
Among the 1,227 employed individuals in South Congaree, private company employees (815 | 66.4%), state government employees (121 | 9.9%), and local government employees (91 | 7.4%) make up the most common classes of employment.
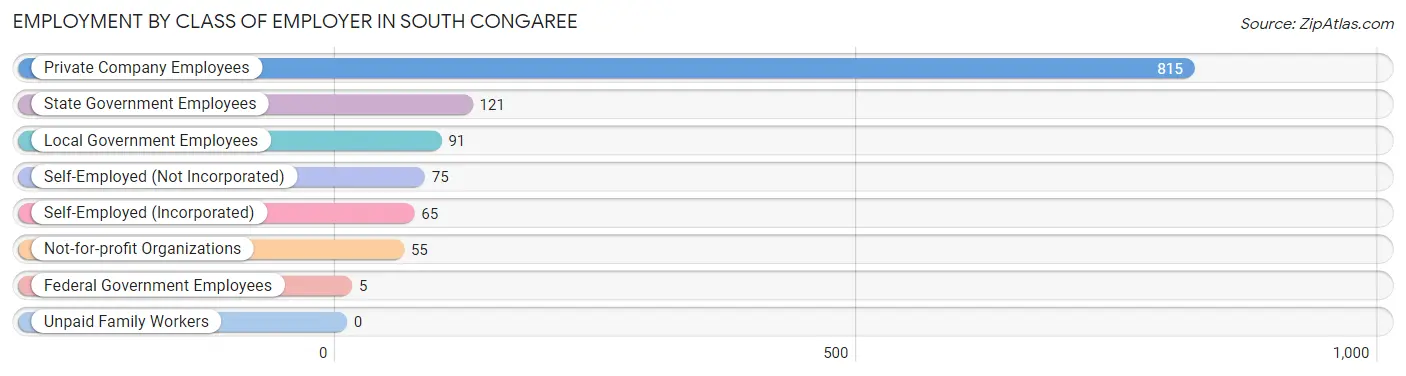
| Employer Class | # Employees | % Employees |
| Private Company Employees | 815 | 66.4% |
| Self-Employed (Incorporated) | 65 | 5.3% |
| Self-Employed (Not Incorporated) | 75 | 6.1% |
| Not-for-profit Organizations | 55 | 4.5% |
| Local Government Employees | 91 | 7.4% |
| State Government Employees | 121 | 9.9% |
| Federal Government Employees | 5 | 0.4% |
| Unpaid Family Workers | 0 | 0.0% |
| Total | 1,227 | 100.0% |
Employment Status by Age in South Congaree
According to the labor force statistics for South Congaree, out of the total population over 16 years of age (1,828), 69.4% or 1,269 individuals are in the labor force, with 2.6% or 33 of them unemployed. The age group with the highest labor force participation rate is 20 to 24 years, with 94.2% or 161 individuals in the labor force. Within the labor force, the 16 to 19 years age range has the highest percentage of unemployed individuals, with 8.7% or 6 of them being unemployed.
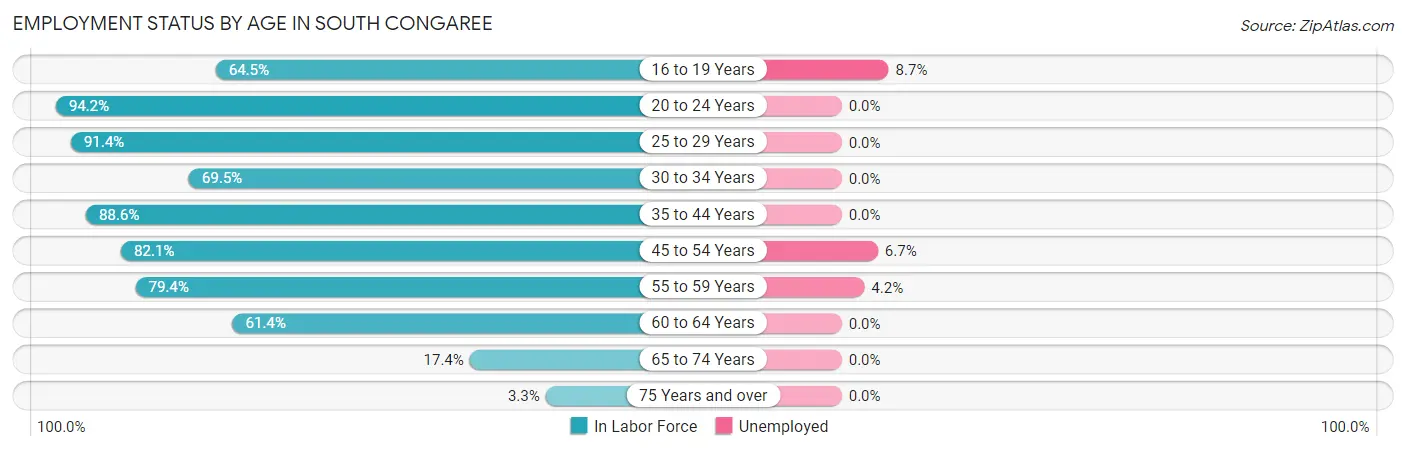
| Age Bracket | In Labor Force | Unemployed |
| 16 to 19 Years | 69 (64.5%) | 6 (8.7%) |
| 20 to 24 Years | 161 (94.2%) | 0 (0.0%) |
| 25 to 29 Years | 149 (91.4%) | 0 (0.0%) |
| 30 to 34 Years | 116 (69.5%) | 0 (0.0%) |
| 35 to 44 Years | 217 (88.6%) | 0 (0.0%) |
| 45 to 54 Years | 312 (82.1%) | 21 (6.7%) |
| 55 to 59 Years | 143 (79.4%) | 6 (4.2%) |
| 60 to 64 Years | 70 (61.4%) | 0 (0.0%) |
| 65 to 74 Years | 26 (17.4%) | 0 (0.0%) |
| 75 Years and over | 5 (3.3%) | 0 (0.0%) |
| Total | 1,269 (69.4%) | 33 (2.6%) |
Employment Status by Educational Attainment in South Congaree
According to labor force statistics for South Congaree, 80.6% of individuals (1,007) out of the total population between 25 and 64 years of age (1,249) are in the labor force, with 2.7% or 27 of them being unemployed. The group with the highest labor force participation rate are those with the educational attainment of bachelor's degree or higher, with 90.1% or 218 individuals in the labor force. Within the labor force, individuals with high school diploma education have the highest percentage of unemployment, with 5.4% or 20 of them being unemployed.
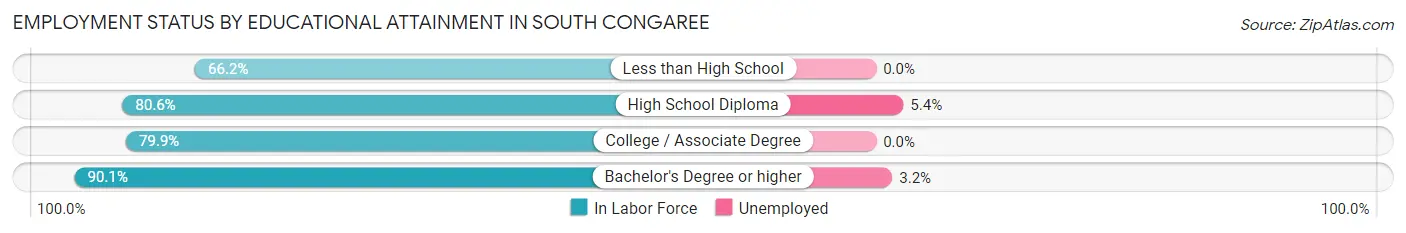
| Educational Attainment | In Labor Force | Unemployed |
| Less than High School | 90 (66.2%) | 0 (0.0%) |
| High School Diploma | 373 (80.6%) | 25 (5.4%) |
| College / Associate Degree | 326 (79.9%) | 0 (0.0%) |
| Bachelor's Degree or higher | 218 (90.1%) | 8 (3.2%) |
| Total | 1,007 (80.6%) | 34 (2.7%) |
Employment Occupations by Sex in South Congaree
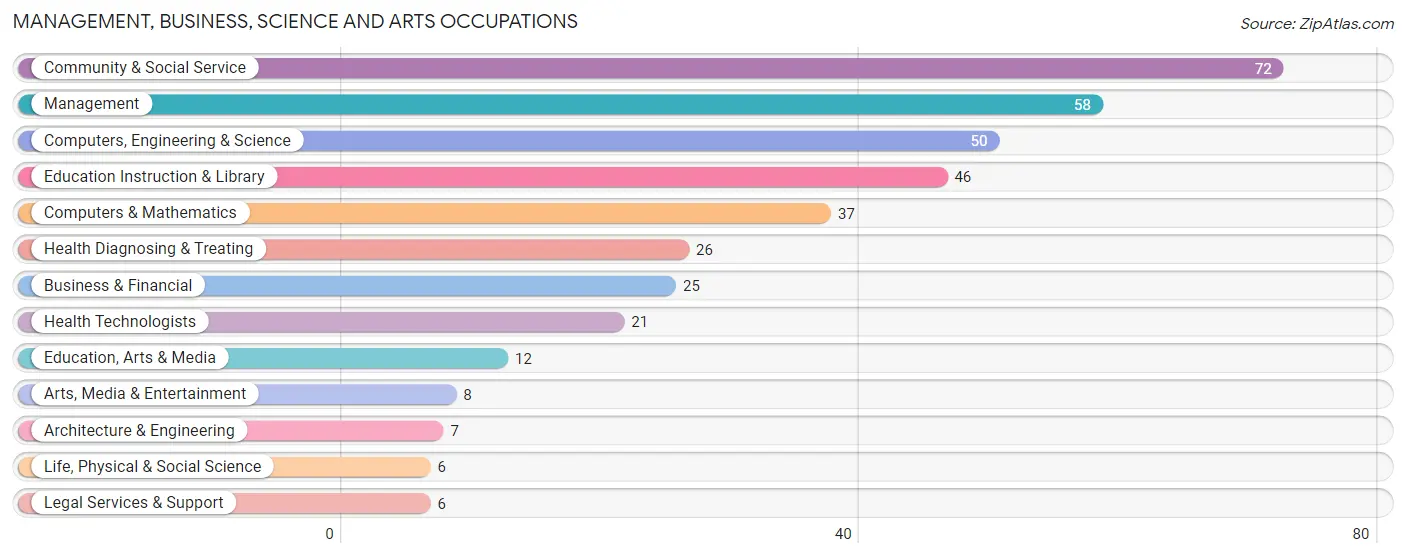
Management, Business, Science and Arts Occupations
The most common Management, Business, Science and Arts occupations in South Congaree are Community & Social Service (72 | 5.9%), Management (58 | 4.7%), Computers, Engineering & Science (50 | 4.1%), Education Instruction & Library (46 | 3.7%), and Computers & Mathematics (37 | 3.0%).
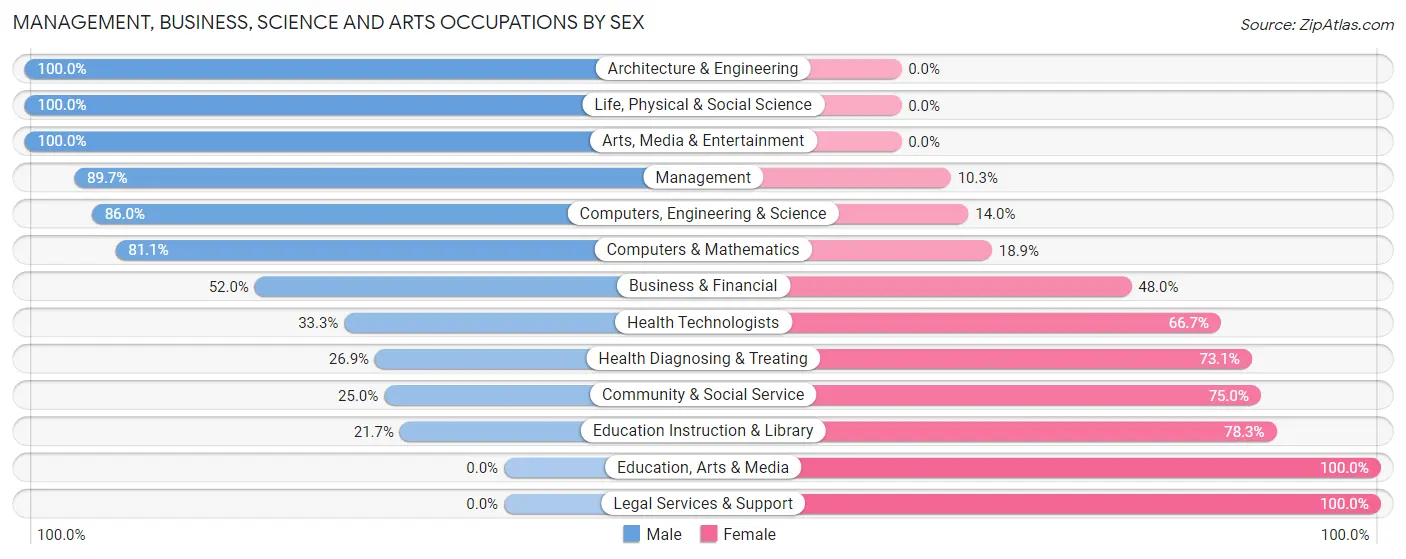
Management, Business, Science and Arts Occupations by Sex
Within the Management, Business, Science and Arts occupations in South Congaree, the most male-oriented occupations are Architecture & Engineering (100.0%), Life, Physical & Social Science (100.0%), and Arts, Media & Entertainment (100.0%), while the most female-oriented occupations are Education, Arts & Media (100.0%), Legal Services & Support (100.0%), and Education Instruction & Library (78.3%).
| Occupation | Male | Female |
| Management | 52 (89.7%) | 6 (10.3%) |
| Business & Financial | 13 (52.0%) | 12 (48.0%) |
| Computers, Engineering & Science | 43 (86.0%) | 7 (14.0%) |
| Computers & Mathematics | 30 (81.1%) | 7 (18.9%) |
| Architecture & Engineering | 7 (100.0%) | 0 (0.0%) |
| Life, Physical & Social Science | 6 (100.0%) | 0 (0.0%) |
| Community & Social Service | 18 (25.0%) | 54 (75.0%) |
| Education, Arts & Media | 0 (0.0%) | 12 (100.0%) |
| Legal Services & Support | 0 (0.0%) | 6 (100.0%) |
| Education Instruction & Library | 10 (21.7%) | 36 (78.3%) |
| Arts, Media & Entertainment | 8 (100.0%) | 0 (0.0%) |
| Health Diagnosing & Treating | 7 (26.9%) | 19 (73.1%) |
| Health Technologists | 7 (33.3%) | 14 (66.7%) |
| Total (Category) | 133 (57.6%) | 98 (42.4%) |
| Total (Overall) | 644 (52.4%) | 586 (47.6%) |
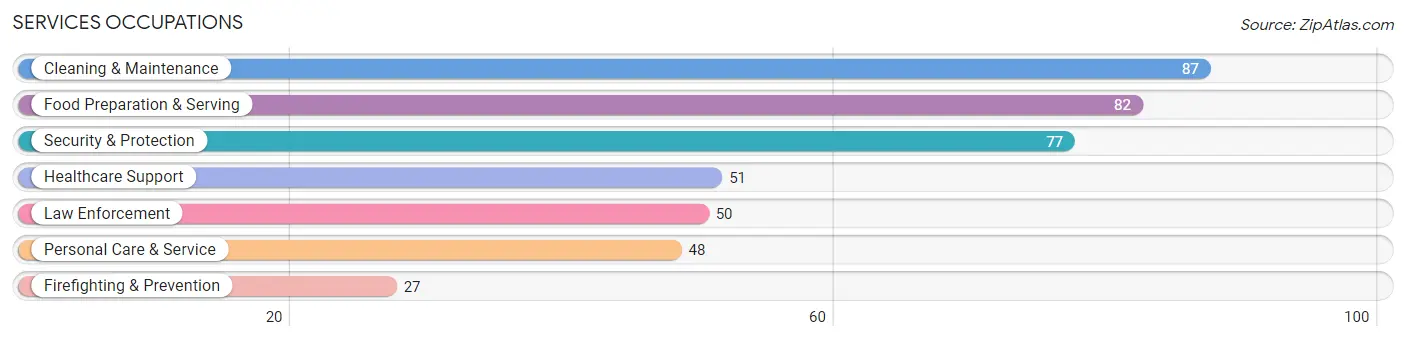
Services Occupations
The most common Services occupations in South Congaree are Cleaning & Maintenance (87 | 7.1%), Food Preparation & Serving (82 | 6.7%), Security & Protection (77 | 6.3%), Healthcare Support (51 | 4.2%), and Law Enforcement (50 | 4.1%).
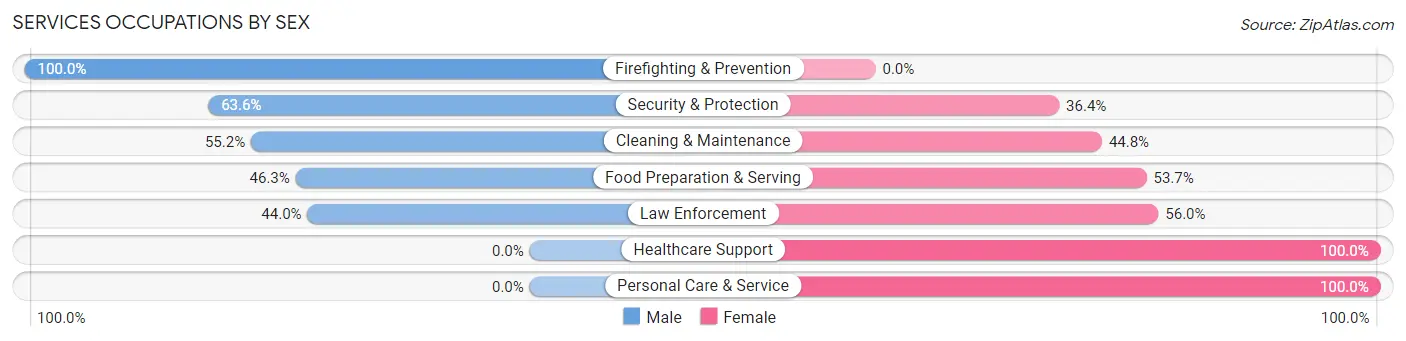
Services Occupations by Sex
Within the Services occupations in South Congaree, the most male-oriented occupations are Firefighting & Prevention (100.0%), Security & Protection (63.6%), and Cleaning & Maintenance (55.2%), while the most female-oriented occupations are Healthcare Support (100.0%), Personal Care & Service (100.0%), and Law Enforcement (56.0%).
| Occupation | Male | Female |
| Healthcare Support | 0 (0.0%) | 51 (100.0%) |
| Security & Protection | 49 (63.6%) | 28 (36.4%) |
| Firefighting & Prevention | 27 (100.0%) | 0 (0.0%) |
| Law Enforcement | 22 (44.0%) | 28 (56.0%) |
| Food Preparation & Serving | 38 (46.3%) | 44 (53.7%) |
| Cleaning & Maintenance | 48 (55.2%) | 39 (44.8%) |
| Personal Care & Service | 0 (0.0%) | 48 (100.0%) |
| Total (Category) | 135 (39.1%) | 210 (60.9%) |
| Total (Overall) | 644 (52.4%) | 586 (47.6%) |
Sales and Office Occupations
The most common Sales and Office occupations in South Congaree are Sales & Related (167 | 13.6%), and Office & Administration (140 | 11.4%).
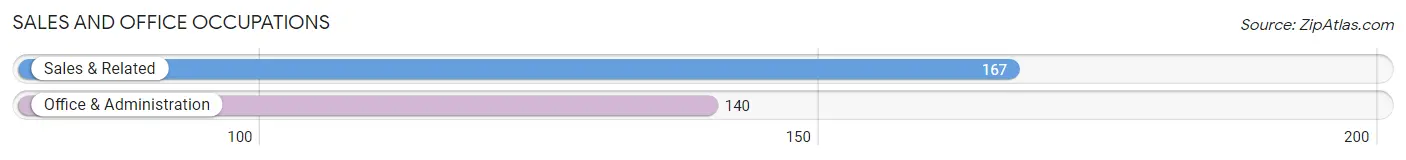
Sales and Office Occupations by Sex
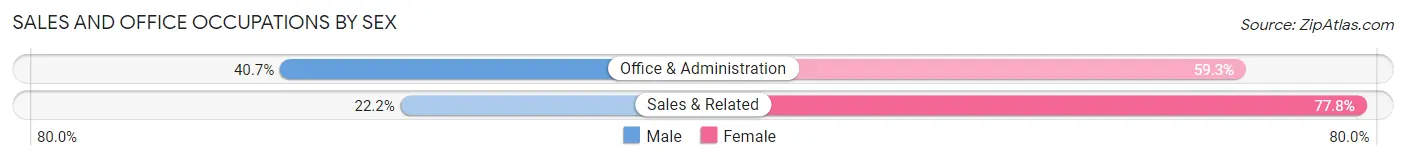
| Occupation | Male | Female |
| Sales & Related | 37 (22.2%) | 130 (77.8%) |
| Office & Administration | 57 (40.7%) | 83 (59.3%) |
| Total (Category) | 94 (30.6%) | 213 (69.4%) |
| Total (Overall) | 644 (52.4%) | 586 (47.6%) |
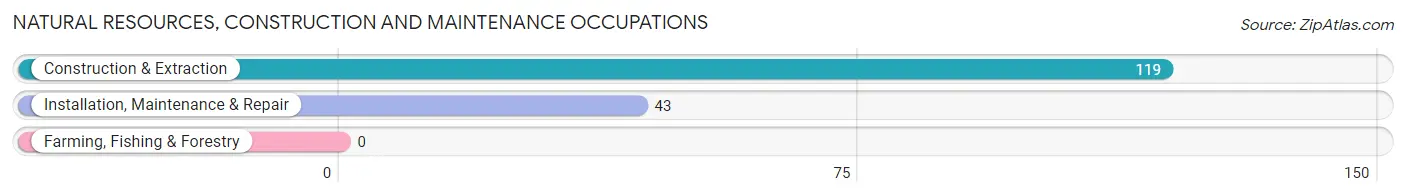
Natural Resources, Construction and Maintenance Occupations
The most common Natural Resources, Construction and Maintenance occupations in South Congaree are Construction & Extraction (119 | 9.7%), and Installation, Maintenance & Repair (43 | 3.5%).
Natural Resources, Construction and Maintenance Occupations by Sex
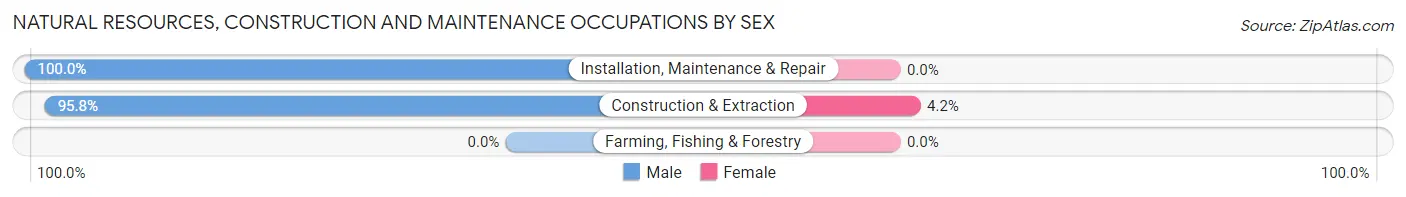
| Occupation | Male | Female |
| Farming, Fishing & Forestry | 0 (0.0%) | 0 (0.0%) |
| Construction & Extraction | 114 (95.8%) | 5 (4.2%) |
| Installation, Maintenance & Repair | 43 (100.0%) | 0 (0.0%) |
| Total (Category) | 157 (96.9%) | 5 (3.1%) |
| Total (Overall) | 644 (52.4%) | 586 (47.6%) |
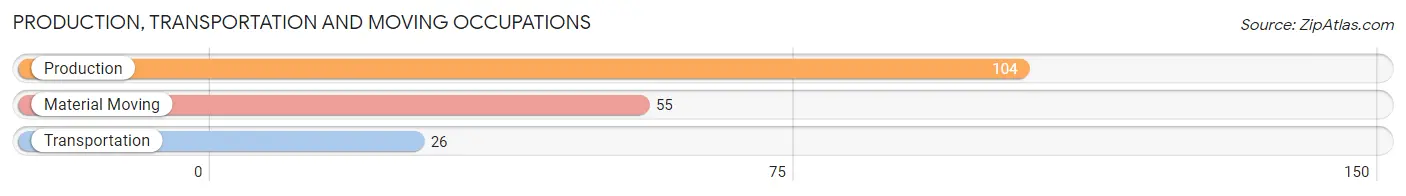
Production, Transportation and Moving Occupations
The most common Production, Transportation and Moving occupations in South Congaree are Production (104 | 8.5%), Material Moving (55 | 4.5%), and Transportation (26 | 2.1%).
Production, Transportation and Moving Occupations by Sex
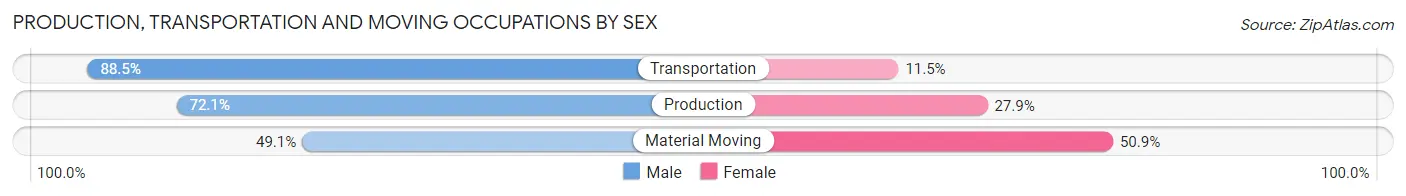
| Occupation | Male | Female |
| Production | 75 (72.1%) | 29 (27.9%) |
| Transportation | 23 (88.5%) | 3 (11.5%) |
| Material Moving | 27 (49.1%) | 28 (50.9%) |
| Total (Category) | 125 (67.6%) | 60 (32.4%) |
| Total (Overall) | 644 (52.4%) | 586 (47.6%) |
Employment Industries by Sex in South Congaree
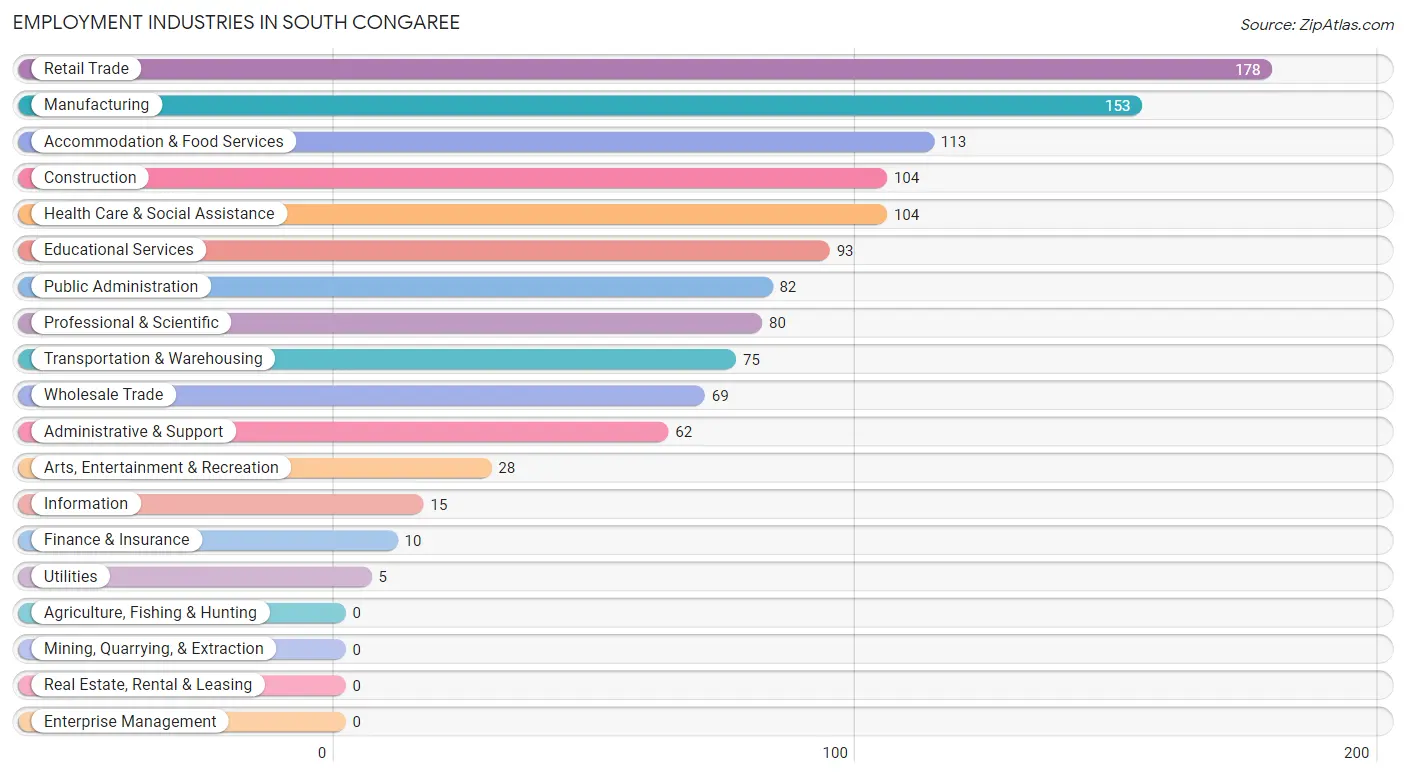
Employment Industries in South Congaree
The major employment industries in South Congaree include Retail Trade (178 | 14.5%), Manufacturing (153 | 12.4%), Accommodation & Food Services (113 | 9.2%), Construction (104 | 8.5%), and Health Care & Social Assistance (104 | 8.5%).
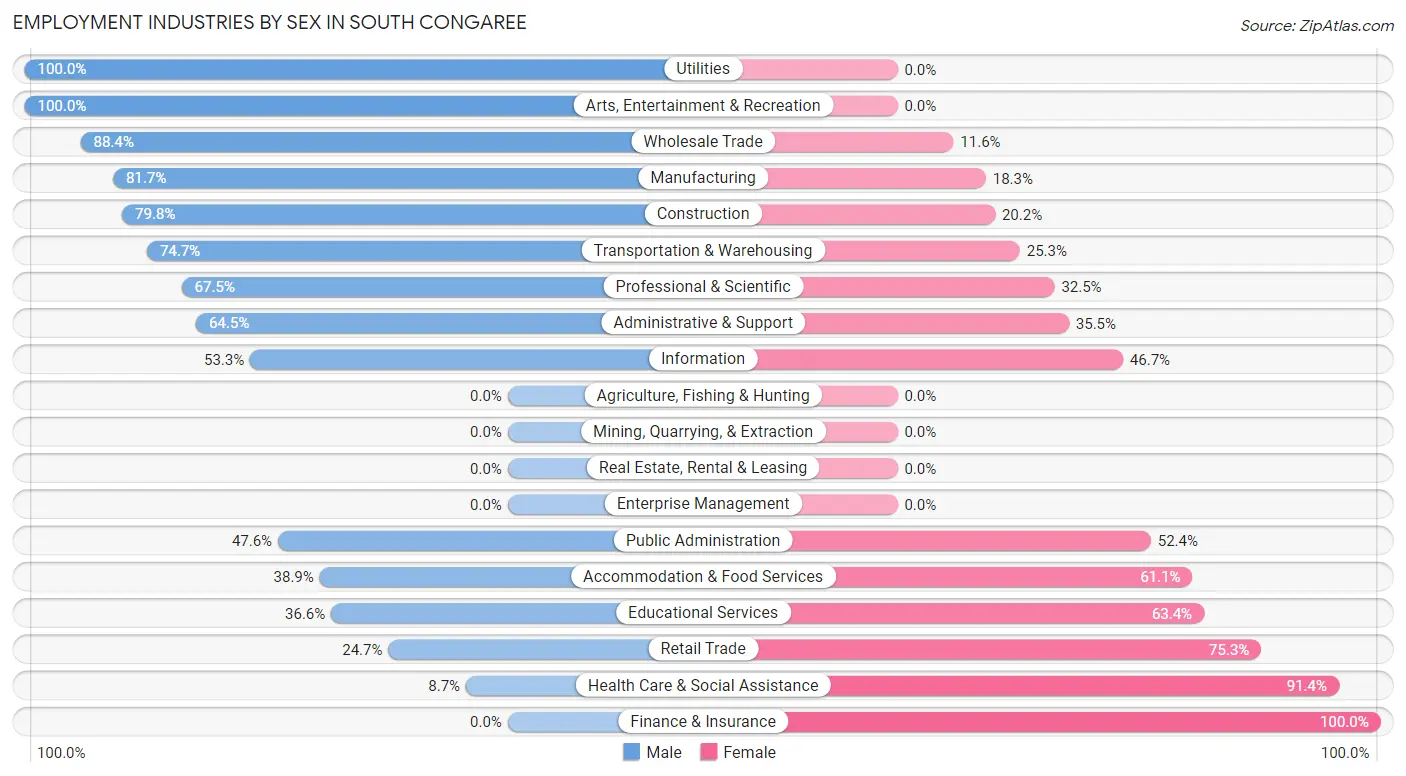
Employment Industries by Sex in South Congaree
The South Congaree industries that see more men than women are Utilities (100.0%), Arts, Entertainment & Recreation (100.0%), and Wholesale Trade (88.4%), whereas the industries that tend to have a higher number of women are Finance & Insurance (100.0%), Health Care & Social Assistance (91.3%), and Retail Trade (75.3%).
| Industry | Male | Female |
| Agriculture, Fishing & Hunting | 0 (0.0%) | 0 (0.0%) |
| Mining, Quarrying, & Extraction | 0 (0.0%) | 0 (0.0%) |
| Construction | 83 (79.8%) | 21 (20.2%) |
| Manufacturing | 125 (81.7%) | 28 (18.3%) |
| Wholesale Trade | 61 (88.4%) | 8 (11.6%) |
| Retail Trade | 44 (24.7%) | 134 (75.3%) |
| Transportation & Warehousing | 56 (74.7%) | 19 (25.3%) |
| Utilities | 5 (100.0%) | 0 (0.0%) |
| Information | 8 (53.3%) | 7 (46.7%) |
| Finance & Insurance | 0 (0.0%) | 10 (100.0%) |
| Real Estate, Rental & Leasing | 0 (0.0%) | 0 (0.0%) |
| Professional & Scientific | 54 (67.5%) | 26 (32.5%) |
| Enterprise Management | 0 (0.0%) | 0 (0.0%) |
| Administrative & Support | 40 (64.5%) | 22 (35.5%) |
| Educational Services | 34 (36.6%) | 59 (63.4%) |
| Health Care & Social Assistance | 9 (8.6%) | 95 (91.3%) |
| Arts, Entertainment & Recreation | 28 (100.0%) | 0 (0.0%) |
| Accommodation & Food Services | 44 (38.9%) | 69 (61.1%) |
| Public Administration | 39 (47.6%) | 43 (52.4%) |
| Total | 644 (52.4%) | 586 (47.6%) |
Education in South Congaree
School Enrollment in South Congaree
The most common levels of schooling among the 427 students in South Congaree are middle school (178 | 41.7%), high school (76 | 17.8%), and elementary school (59 | 13.8%).
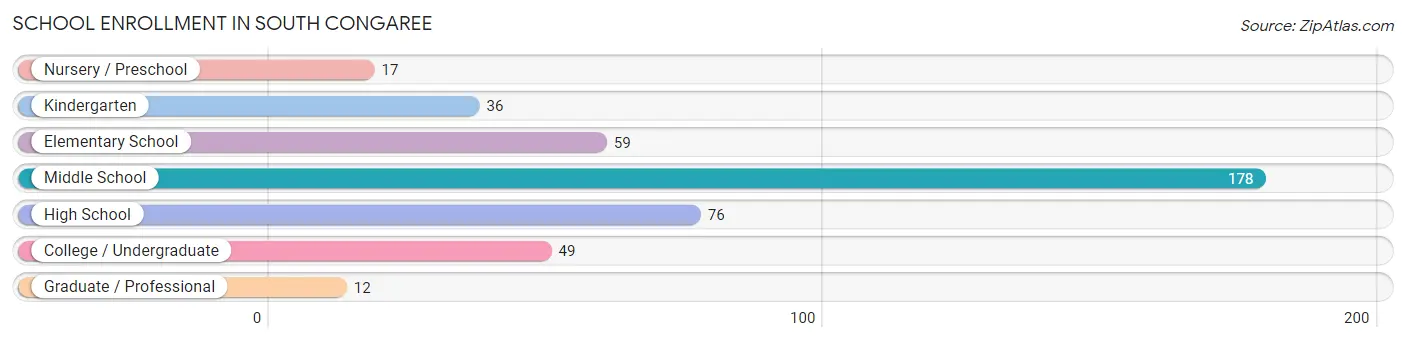
| School Level | # Students | % Students |
| Nursery / Preschool | 17 | 4.0% |
| Kindergarten | 36 | 8.4% |
| Elementary School | 59 | 13.8% |
| Middle School | 178 | 41.7% |
| High School | 76 | 17.8% |
| College / Undergraduate | 49 | 11.5% |
| Graduate / Professional | 12 | 2.8% |
| Total | 427 | 100.0% |
School Enrollment by Age by Funding Source in South Congaree
Out of a total of 427 students who are enrolled in schools in South Congaree, 86 (20.1%) attend a private institution, while the remaining 341 (79.9%) are enrolled in public schools. The age group of 20 to 24 year olds has the highest likelihood of being enrolled in private schools, with 21 (67.7% in the age bracket) enrolled. Conversely, the age group of 10 to 14 year olds has the lowest likelihood of being enrolled in a private school, with 187 (95.9% in the age bracket) attending a public institution.
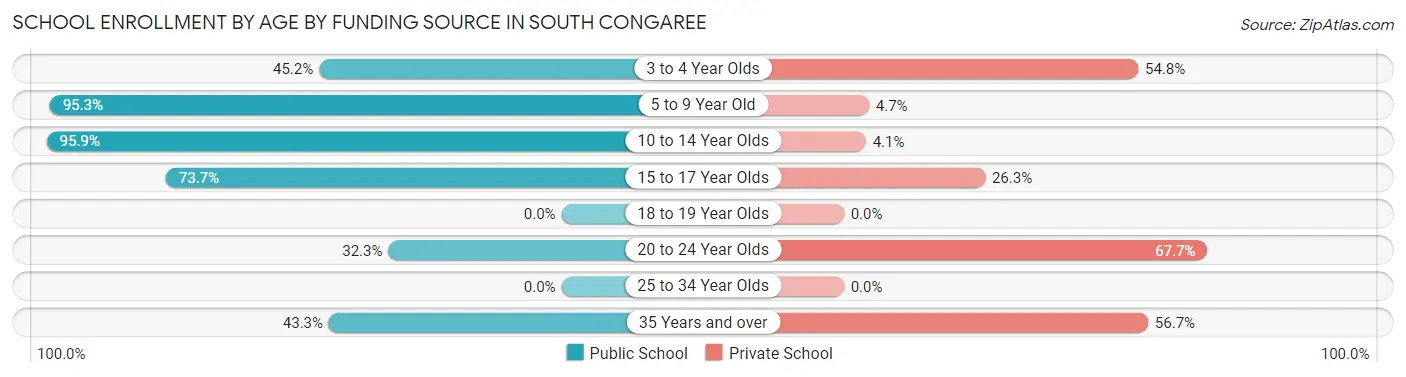
| Age Bracket | Public School | Private School |
| 3 to 4 Year Olds | 14 (45.2%) | 17 (54.8%) |
| 5 to 9 Year Old | 61 (95.3%) | 3 (4.7%) |
| 10 to 14 Year Olds | 187 (95.9%) | 8 (4.1%) |
| 15 to 17 Year Olds | 56 (73.7%) | 20 (26.3%) |
| 18 to 19 Year Olds | 0 (0.0%) | 0 (0.0%) |
| 20 to 24 Year Olds | 10 (32.3%) | 21 (67.7%) |
| 25 to 34 Year Olds | 0 (0.0%) | 0 (0.0%) |
| 35 Years and over | 13 (43.3%) | 17 (56.7%) |
| Total | 341 (79.9%) | 86 (20.1%) |
Educational Attainment by Field of Study in South Congaree
Business (48 | 18.4%), social sciences (39 | 14.9%), visual & performing arts (36 | 13.8%), education (33 | 12.6%), and arts & humanities (20 | 7.7%) are the most common fields of study among 261 individuals in South Congaree who have obtained a bachelor's degree or higher.
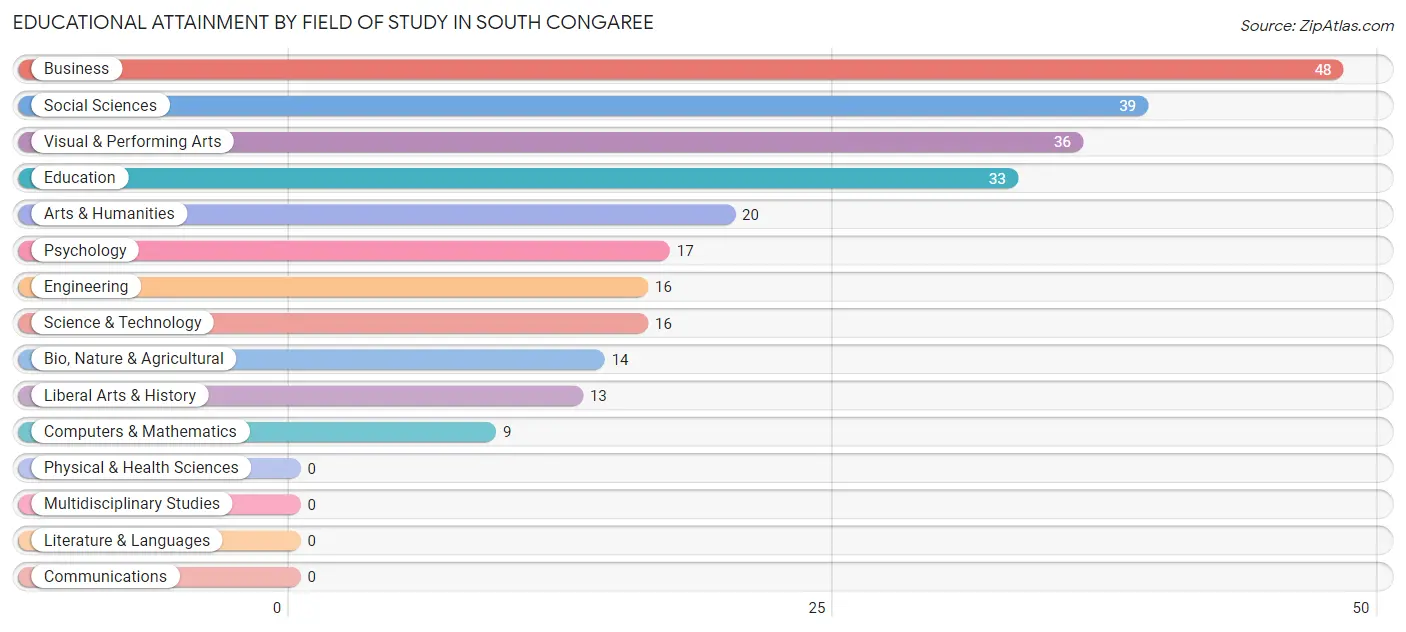
| Field of Study | # Graduates | % Graduates |
| Computers & Mathematics | 9 | 3.5% |
| Bio, Nature & Agricultural | 14 | 5.4% |
| Physical & Health Sciences | 0 | 0.0% |
| Psychology | 17 | 6.5% |
| Social Sciences | 39 | 14.9% |
| Engineering | 16 | 6.1% |
| Multidisciplinary Studies | 0 | 0.0% |
| Science & Technology | 16 | 6.1% |
| Business | 48 | 18.4% |
| Education | 33 | 12.6% |
| Literature & Languages | 0 | 0.0% |
| Liberal Arts & History | 13 | 5.0% |
| Visual & Performing Arts | 36 | 13.8% |
| Communications | 0 | 0.0% |
| Arts & Humanities | 20 | 7.7% |
| Total | 261 | 100.0% |
Transportation & Commute in South Congaree
Vehicle Availability by Sex in South Congaree
The most prevalent vehicle ownership categories in South Congaree are males with 2 vehicles (194, accounting for 30.5%) and females with 2 vehicles (153, making up 33.1%).
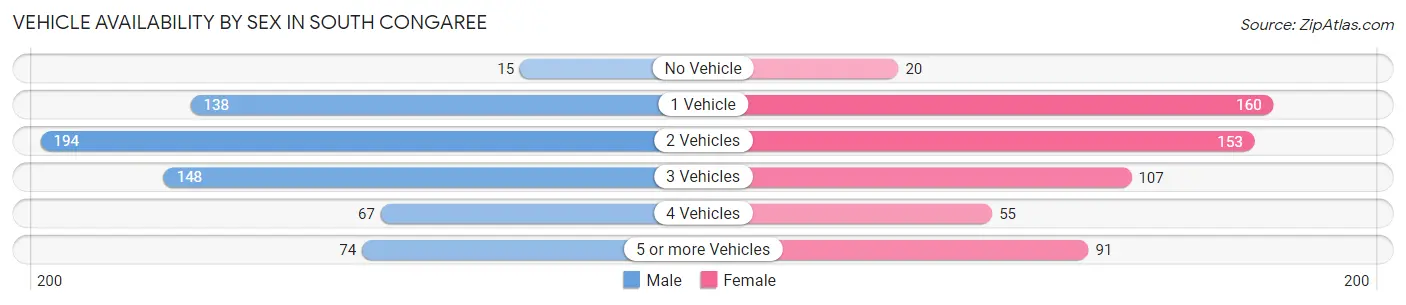
| Vehicles Available | Male | Female |
| No Vehicle | 15 (2.4%) | 20 (3.4%) |
| 1 Vehicle | 138 (21.7%) | 160 (27.3%) |
| 2 Vehicles | 194 (30.5%) | 153 (26.1%) |
| 3 Vehicles | 148 (23.3%) | 107 (18.3%) |
| 4 Vehicles | 67 (10.5%) | 55 (9.4%) |
| 5 or more Vehicles | 74 (11.6%) | 91 (15.5%) |
| Total | 636 (100.0%) | 586 (100.0%) |
Commute Time in South Congaree
The most frequently occuring commute durations in South Congaree are 20 to 24 minutes (394 commuters, 34.6%), 30 to 34 minutes (222 commuters, 19.5%), and 15 to 19 minutes (134 commuters, 11.8%).
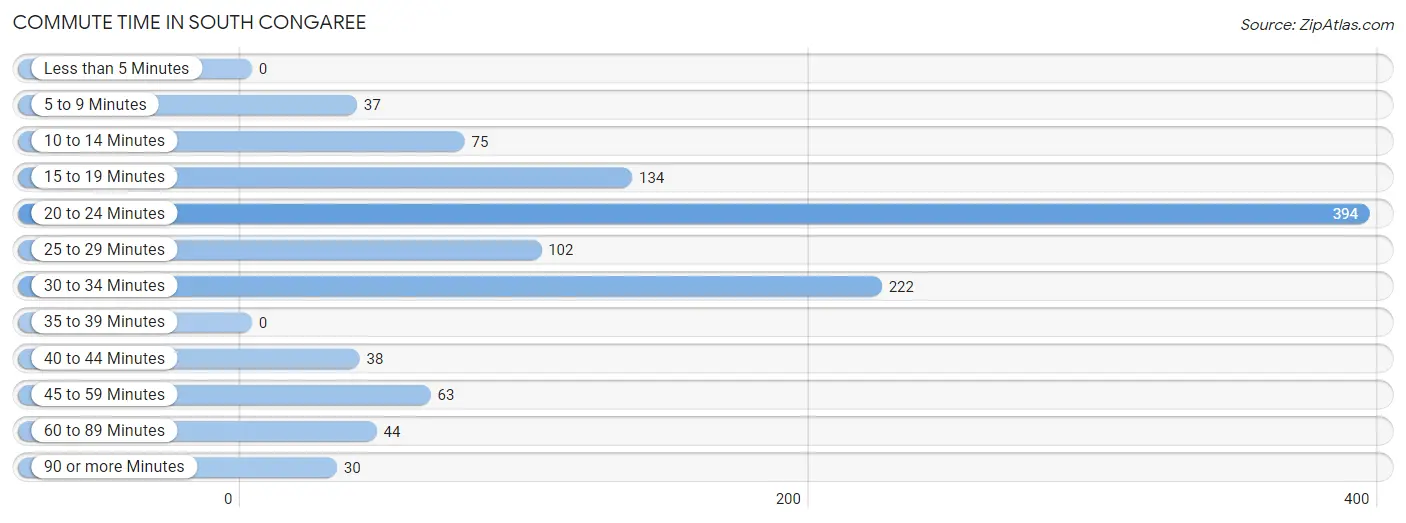
| Commute Time | # Commuters | % Commuters |
| Less than 5 Minutes | 0 | 0.0% |
| 5 to 9 Minutes | 37 | 3.3% |
| 10 to 14 Minutes | 75 | 6.6% |
| 15 to 19 Minutes | 134 | 11.8% |
| 20 to 24 Minutes | 394 | 34.6% |
| 25 to 29 Minutes | 102 | 9.0% |
| 30 to 34 Minutes | 222 | 19.5% |
| 35 to 39 Minutes | 0 | 0.0% |
| 40 to 44 Minutes | 38 | 3.3% |
| 45 to 59 Minutes | 63 | 5.5% |
| 60 to 89 Minutes | 44 | 3.9% |
| 90 or more Minutes | 30 | 2.6% |
Commute Time by Sex in South Congaree
The most common commute times in South Congaree are 20 to 24 minutes (199 commuters, 34.2%) for males and 20 to 24 minutes (195 commuters, 35.0%) for females.
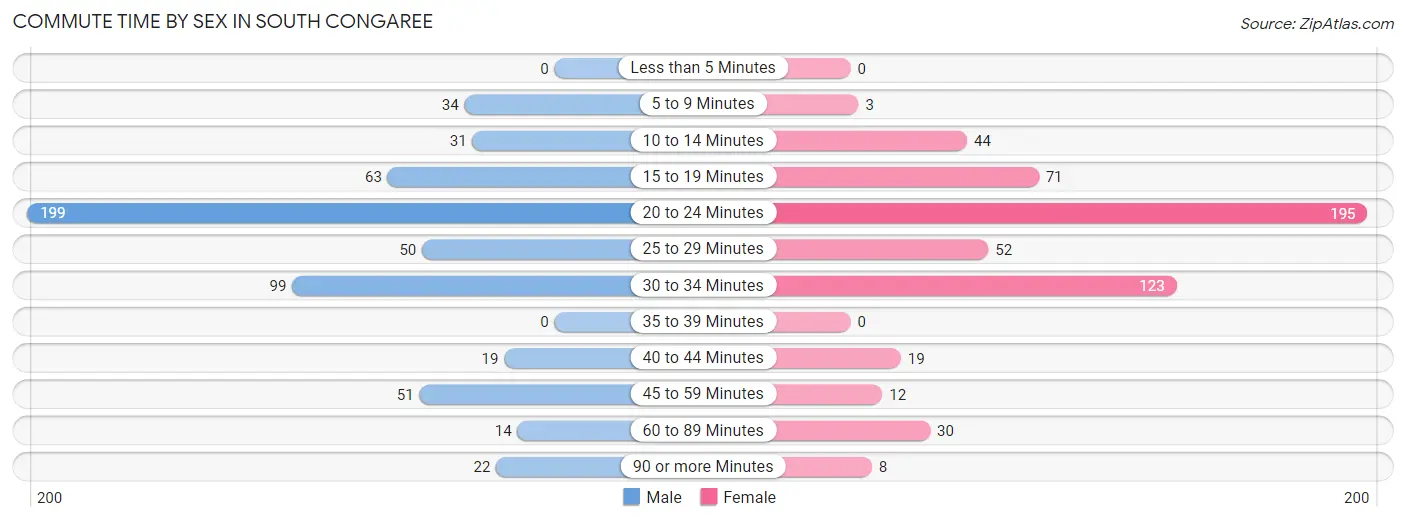
| Commute Time | Male | Female |
| Less than 5 Minutes | 0 (0.0%) | 0 (0.0%) |
| 5 to 9 Minutes | 34 (5.8%) | 3 (0.5%) |
| 10 to 14 Minutes | 31 (5.3%) | 44 (7.9%) |
| 15 to 19 Minutes | 63 (10.8%) | 71 (12.8%) |
| 20 to 24 Minutes | 199 (34.2%) | 195 (35.0%) |
| 25 to 29 Minutes | 50 (8.6%) | 52 (9.3%) |
| 30 to 34 Minutes | 99 (17.0%) | 123 (22.1%) |
| 35 to 39 Minutes | 0 (0.0%) | 0 (0.0%) |
| 40 to 44 Minutes | 19 (3.3%) | 19 (3.4%) |
| 45 to 59 Minutes | 51 (8.8%) | 12 (2.1%) |
| 60 to 89 Minutes | 14 (2.4%) | 30 (5.4%) |
| 90 or more Minutes | 22 (3.8%) | 8 (1.4%) |
Time of Departure to Work by Sex in South Congaree
The most frequent times of departure to work in South Congaree are 12:00 AM to 4:59 AM (84, 14.4%) for males and 8:00 AM to 8:29 AM (101, 18.1%) for females.
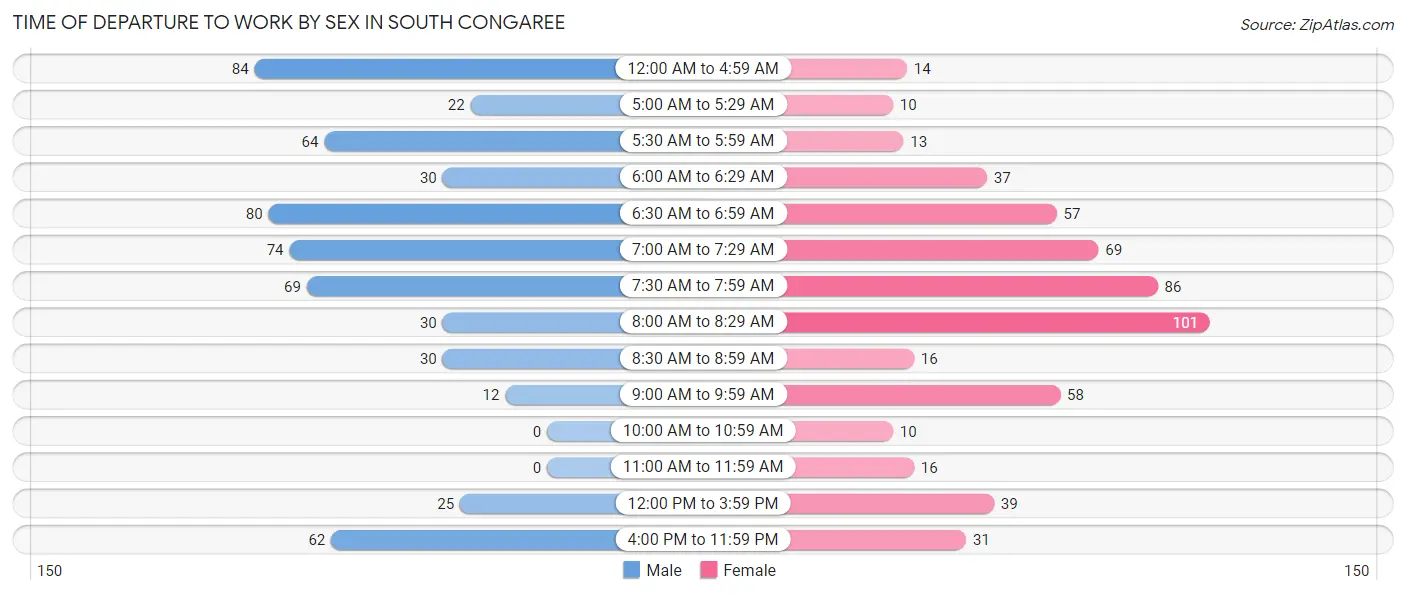
| Time of Departure | Male | Female |
| 12:00 AM to 4:59 AM | 84 (14.4%) | 14 (2.5%) |
| 5:00 AM to 5:29 AM | 22 (3.8%) | 10 (1.8%) |
| 5:30 AM to 5:59 AM | 64 (11.0%) | 13 (2.3%) |
| 6:00 AM to 6:29 AM | 30 (5.1%) | 37 (6.6%) |
| 6:30 AM to 6:59 AM | 80 (13.8%) | 57 (10.2%) |
| 7:00 AM to 7:29 AM | 74 (12.7%) | 69 (12.4%) |
| 7:30 AM to 7:59 AM | 69 (11.9%) | 86 (15.4%) |
| 8:00 AM to 8:29 AM | 30 (5.1%) | 101 (18.1%) |
| 8:30 AM to 8:59 AM | 30 (5.1%) | 16 (2.9%) |
| 9:00 AM to 9:59 AM | 12 (2.1%) | 58 (10.4%) |
| 10:00 AM to 10:59 AM | 0 (0.0%) | 10 (1.8%) |
| 11:00 AM to 11:59 AM | 0 (0.0%) | 16 (2.9%) |
| 12:00 PM to 3:59 PM | 25 (4.3%) | 39 (7.0%) |
| 4:00 PM to 11:59 PM | 62 (10.6%) | 31 (5.6%) |
| Total | 582 (100.0%) | 557 (100.0%) |
Housing Occupancy in South Congaree
Occupancy by Ownership in South Congaree
Of the total 934 dwellings in South Congaree, owner-occupied units account for 671 (71.8%), while renter-occupied units make up 263 (28.2%).
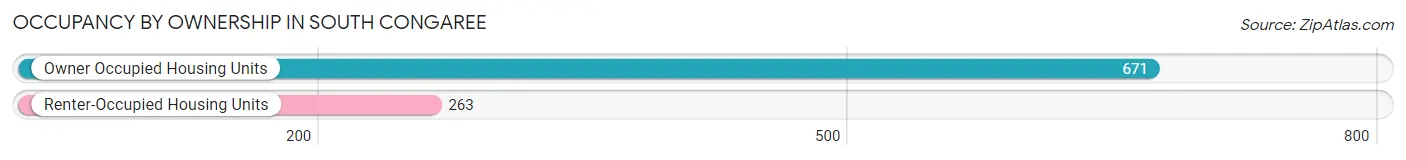
| Occupancy | # Housing Units | % Housing Units |
| Owner Occupied Housing Units | 671 | 71.8% |
| Renter-Occupied Housing Units | 263 | 28.2% |
| Total Occupied Housing Units | 934 | 100.0% |
Occupancy by Household Size in South Congaree
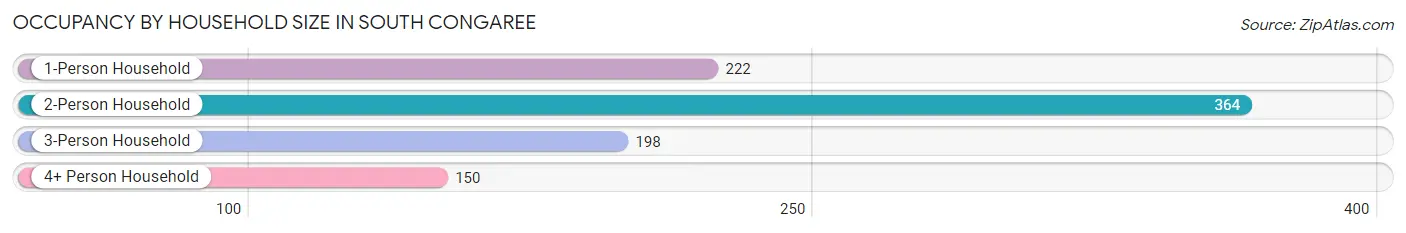
| Household Size | # Housing Units | % Housing Units |
| 1-Person Household | 222 | 23.8% |
| 2-Person Household | 364 | 39.0% |
| 3-Person Household | 198 | 21.2% |
| 4+ Person Household | 150 | 16.1% |
| Total Housing Units | 934 | 100.0% |
Occupancy by Ownership by Household Size in South Congaree
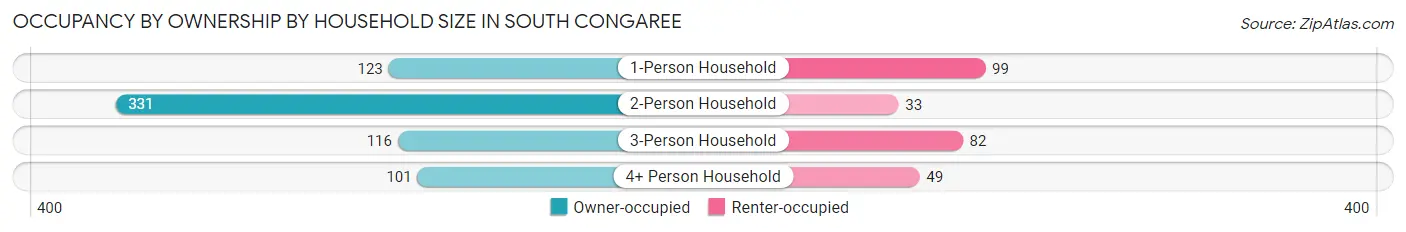
| Household Size | Owner-occupied | Renter-occupied |
| 1-Person Household | 123 (55.4%) | 99 (44.6%) |
| 2-Person Household | 331 (90.9%) | 33 (9.1%) |
| 3-Person Household | 116 (58.6%) | 82 (41.4%) |
| 4+ Person Household | 101 (67.3%) | 49 (32.7%) |
| Total Housing Units | 671 (71.8%) | 263 (28.2%) |
Occupancy by Educational Attainment in South Congaree
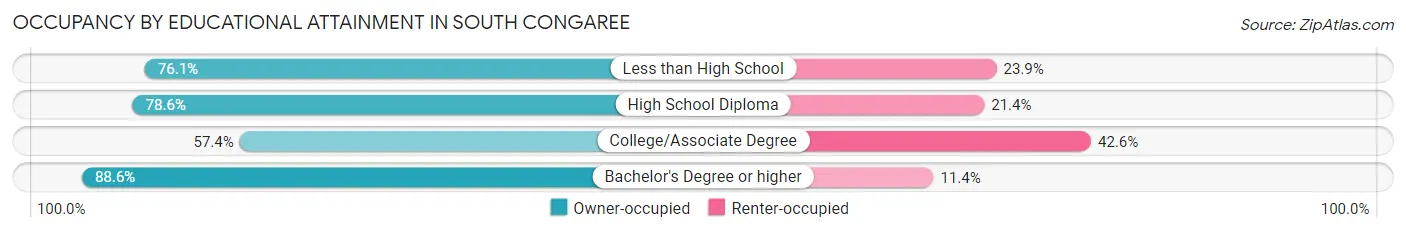
| Household Size | Owner-occupied | Renter-occupied |
| Less than High School | 67 (76.1%) | 21 (23.9%) |
| High School Diploma | 297 (78.6%) | 81 (21.4%) |
| College/Associate Degree | 198 (57.4%) | 147 (42.6%) |
| Bachelor's Degree or higher | 109 (88.6%) | 14 (11.4%) |
Occupancy by Age of Householder in South Congaree
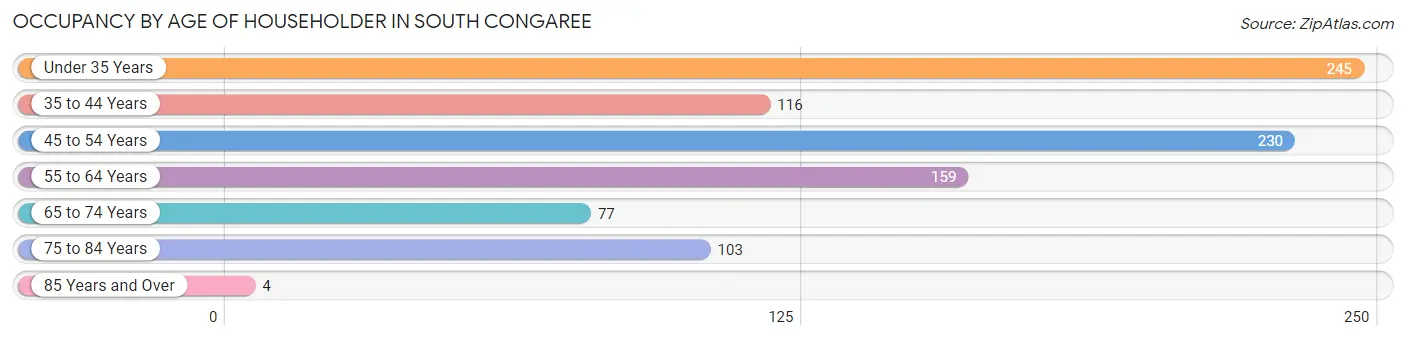
| Age Bracket | # Households | % Households |
| Under 35 Years | 245 | 26.2% |
| 35 to 44 Years | 116 | 12.4% |
| 45 to 54 Years | 230 | 24.6% |
| 55 to 64 Years | 159 | 17.0% |
| 65 to 74 Years | 77 | 8.2% |
| 75 to 84 Years | 103 | 11.0% |
| 85 Years and Over | 4 | 0.4% |
| Total | 934 | 100.0% |
Housing Finances in South Congaree
Median Income by Occupancy in South Congaree
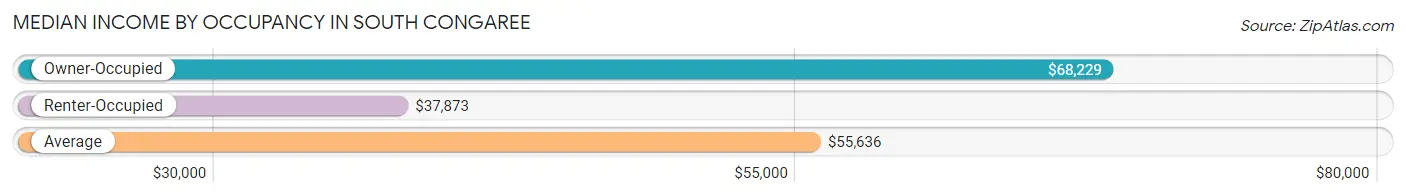
| Occupancy Type | # Households | Median Income |
| Owner-Occupied | 671 (71.8%) | $68,229 |
| Renter-Occupied | 263 (28.2%) | $37,873 |
| Average | 934 (100.0%) | $55,636 |
Occupancy by Householder Income Bracket in South Congaree
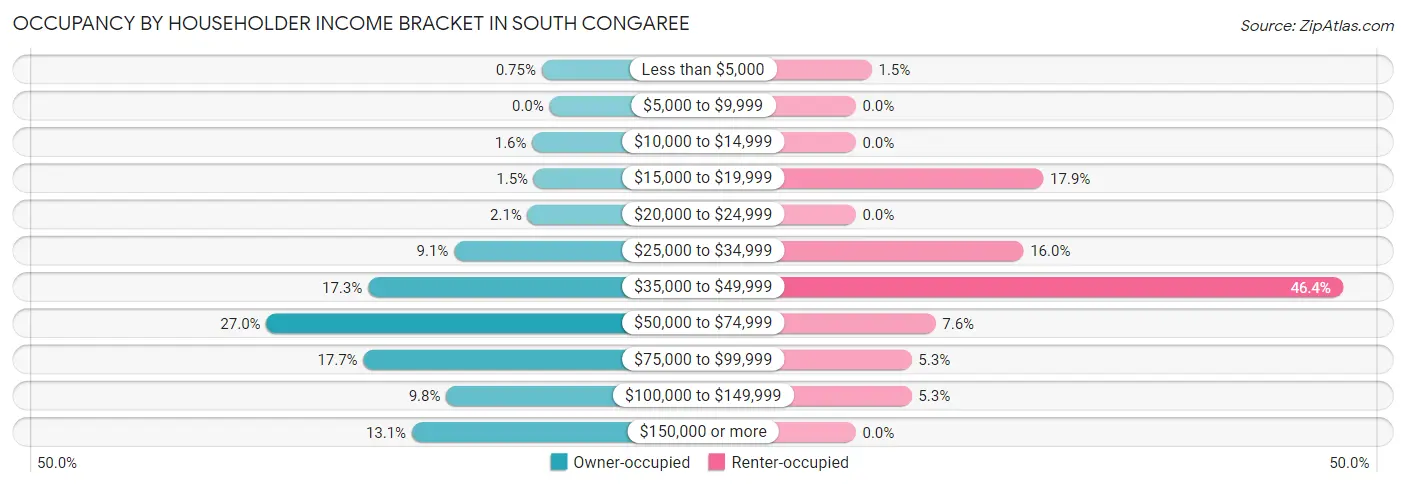
| Income Bracket | Owner-occupied | Renter-occupied |
| Less than $5,000 | 5 (0.7%) | 4 (1.5%) |
| $5,000 to $9,999 | 0 (0.0%) | 0 (0.0%) |
| $10,000 to $14,999 | 11 (1.6%) | 0 (0.0%) |
| $15,000 to $19,999 | 10 (1.5%) | 47 (17.9%) |
| $20,000 to $24,999 | 14 (2.1%) | 0 (0.0%) |
| $25,000 to $34,999 | 61 (9.1%) | 42 (16.0%) |
| $35,000 to $49,999 | 116 (17.3%) | 122 (46.4%) |
| $50,000 to $74,999 | 181 (27.0%) | 20 (7.6%) |
| $75,000 to $99,999 | 119 (17.7%) | 14 (5.3%) |
| $100,000 to $149,999 | 66 (9.8%) | 14 (5.3%) |
| $150,000 or more | 88 (13.1%) | 0 (0.0%) |
| Total | 671 (100.0%) | 263 (100.0%) |
Monthly Housing Cost Tiers in South Congaree
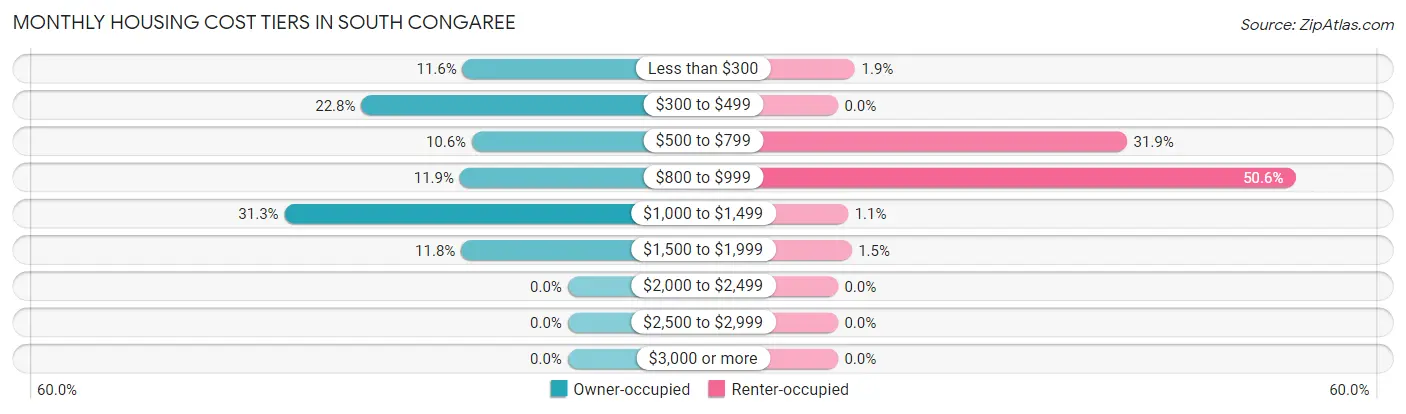
| Monthly Cost | Owner-occupied | Renter-occupied |
| Less than $300 | 78 (11.6%) | 5 (1.9%) |
| $300 to $499 | 153 (22.8%) | 0 (0.0%) |
| $500 to $799 | 71 (10.6%) | 84 (31.9%) |
| $800 to $999 | 80 (11.9%) | 133 (50.6%) |
| $1,000 to $1,499 | 210 (31.3%) | 3 (1.1%) |
| $1,500 to $1,999 | 79 (11.8%) | 4 (1.5%) |
| $2,000 to $2,499 | 0 (0.0%) | 0 (0.0%) |
| $2,500 to $2,999 | 0 (0.0%) | 0 (0.0%) |
| $3,000 or more | 0 (0.0%) | 0 (0.0%) |
| Total | 671 (100.0%) | 263 (100.0%) |
Physical Housing Characteristics in South Congaree
Housing Structures in South Congaree
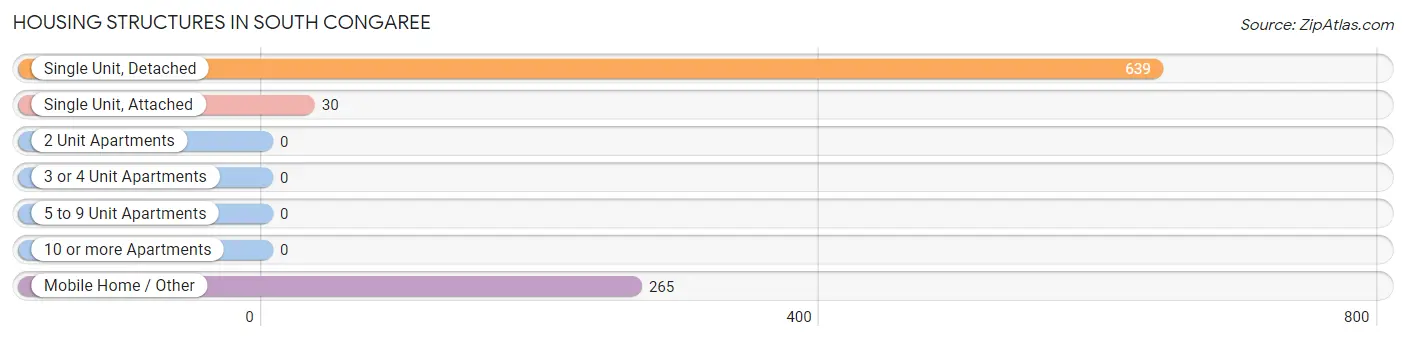
| Structure Type | # Housing Units | % Housing Units |
| Single Unit, Detached | 639 | 68.4% |
| Single Unit, Attached | 30 | 3.2% |
| 2 Unit Apartments | 0 | 0.0% |
| 3 or 4 Unit Apartments | 0 | 0.0% |
| 5 to 9 Unit Apartments | 0 | 0.0% |
| 10 or more Apartments | 0 | 0.0% |
| Mobile Home / Other | 265 | 28.4% |
| Total | 934 | 100.0% |
Housing Structures by Occupancy in South Congaree
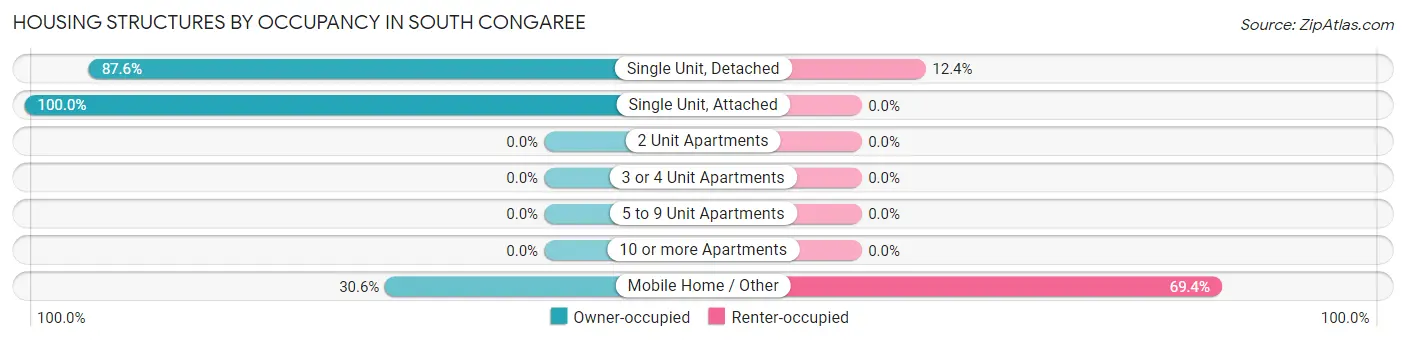
| Structure Type | Owner-occupied | Renter-occupied |
| Single Unit, Detached | 560 (87.6%) | 79 (12.4%) |
| Single Unit, Attached | 30 (100.0%) | 0 (0.0%) |
| 2 Unit Apartments | 0 (0.0%) | 0 (0.0%) |
| 3 or 4 Unit Apartments | 0 (0.0%) | 0 (0.0%) |
| 5 to 9 Unit Apartments | 0 (0.0%) | 0 (0.0%) |
| 10 or more Apartments | 0 (0.0%) | 0 (0.0%) |
| Mobile Home / Other | 81 (30.6%) | 184 (69.4%) |
| Total | 671 (71.8%) | 263 (28.2%) |
Housing Structures by Number of Rooms in South Congaree
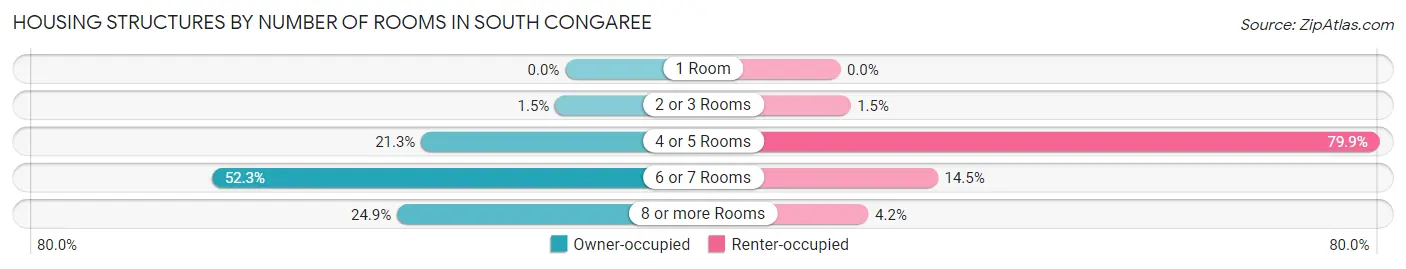
| Number of Rooms | Owner-occupied | Renter-occupied |
| 1 Room | 0 (0.0%) | 0 (0.0%) |
| 2 or 3 Rooms | 10 (1.5%) | 4 (1.5%) |
| 4 or 5 Rooms | 143 (21.3%) | 210 (79.8%) |
| 6 or 7 Rooms | 351 (52.3%) | 38 (14.4%) |
| 8 or more Rooms | 167 (24.9%) | 11 (4.2%) |
| Total | 671 (100.0%) | 263 (100.0%) |
Housing Structure by Heating Type in South Congaree
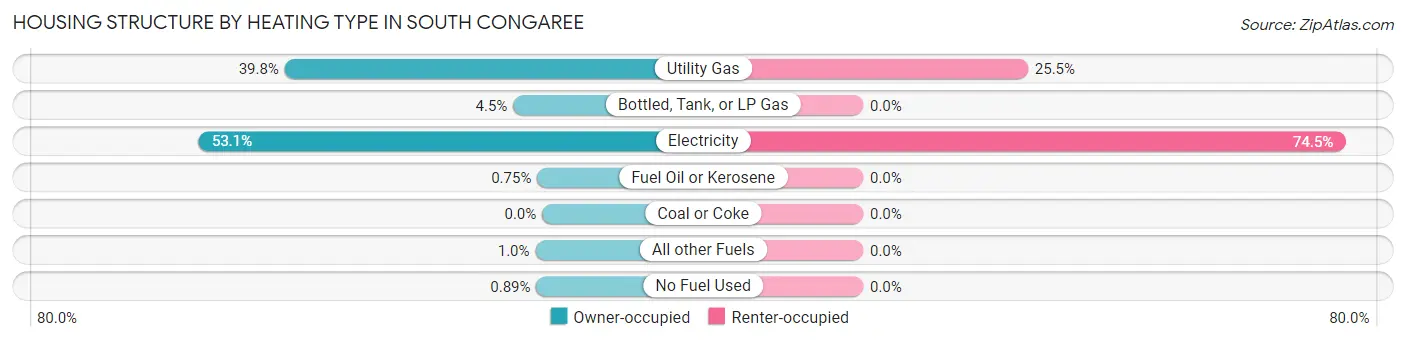
| Heating Type | Owner-occupied | Renter-occupied |
| Utility Gas | 267 (39.8%) | 67 (25.5%) |
| Bottled, Tank, or LP Gas | 30 (4.5%) | 0 (0.0%) |
| Electricity | 356 (53.1%) | 196 (74.5%) |
| Fuel Oil or Kerosene | 5 (0.7%) | 0 (0.0%) |
| Coal or Coke | 0 (0.0%) | 0 (0.0%) |
| All other Fuels | 7 (1.0%) | 0 (0.0%) |
| No Fuel Used | 6 (0.9%) | 0 (0.0%) |
| Total | 671 (100.0%) | 263 (100.0%) |
Household Vehicle Usage in South Congaree
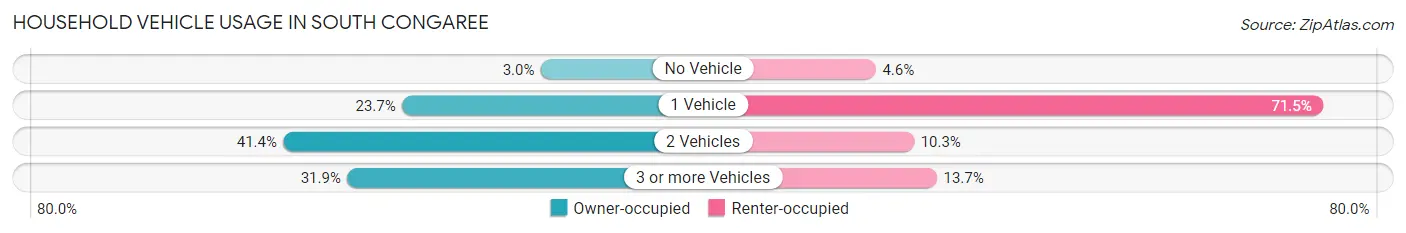
| Vehicles per Household | Owner-occupied | Renter-occupied |
| No Vehicle | 20 (3.0%) | 12 (4.6%) |
| 1 Vehicle | 159 (23.7%) | 188 (71.5%) |
| 2 Vehicles | 278 (41.4%) | 27 (10.3%) |
| 3 or more Vehicles | 214 (31.9%) | 36 (13.7%) |
| Total | 671 (100.0%) | 263 (100.0%) |
Real Estate & Mortgages in South Congaree
Real Estate and Mortgage Overview in South Congaree
| Characteristic | Without Mortgage | With Mortgage |
| Housing Units | 269 | 402 |
| Median Property Value | $125,300 | $180,600 |
| Median Household Income | $56,042 | $52 |
| Monthly Housing Costs | $356 | $0 |
| Real Estate Taxes | $333 | $5 |
Property Value by Mortgage Status in South Congaree
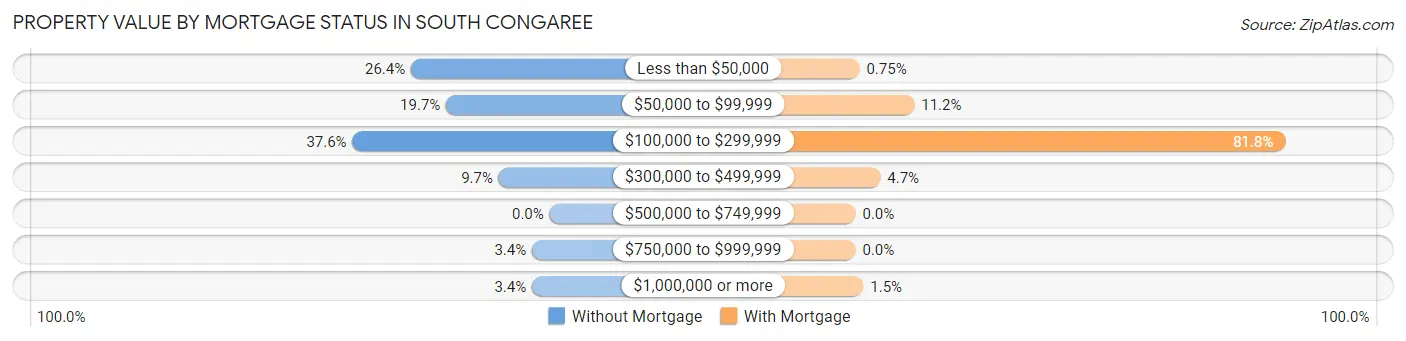
| Property Value | Without Mortgage | With Mortgage |
| Less than $50,000 | 71 (26.4%) | 3 (0.7%) |
| $50,000 to $99,999 | 53 (19.7%) | 45 (11.2%) |
| $100,000 to $299,999 | 101 (37.6%) | 329 (81.8%) |
| $300,000 to $499,999 | 26 (9.7%) | 19 (4.7%) |
| $500,000 to $749,999 | 0 (0.0%) | 0 (0.0%) |
| $750,000 to $999,999 | 9 (3.4%) | 0 (0.0%) |
| $1,000,000 or more | 9 (3.4%) | 6 (1.5%) |
| Total | 269 (100.0%) | 402 (100.0%) |
Household Income by Mortgage Status in South Congaree
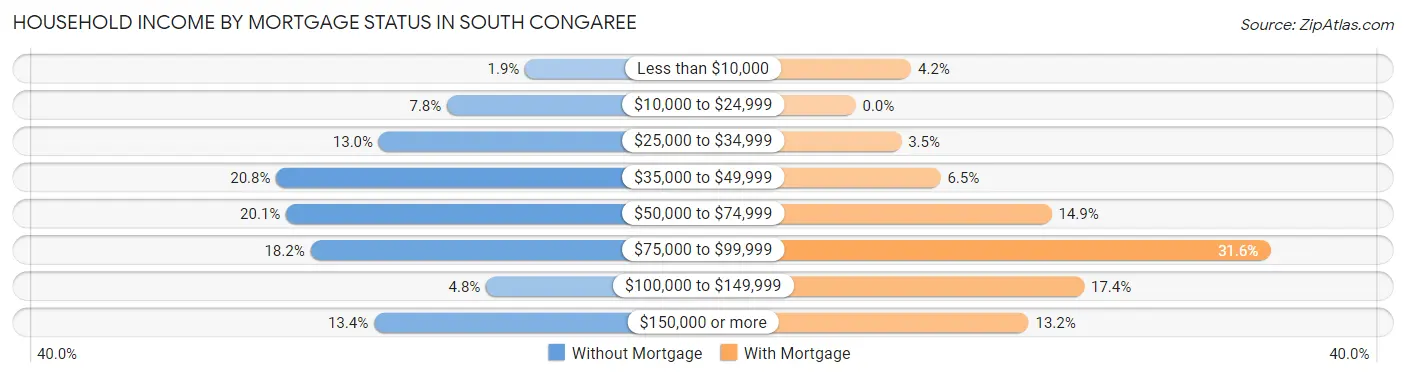
| Household Income | Without Mortgage | With Mortgage |
| Less than $10,000 | 5 (1.9%) | 17 (4.2%) |
| $10,000 to $24,999 | 21 (7.8%) | 0 (0.0%) |
| $25,000 to $34,999 | 35 (13.0%) | 14 (3.5%) |
| $35,000 to $49,999 | 56 (20.8%) | 26 (6.5%) |
| $50,000 to $74,999 | 54 (20.1%) | 60 (14.9%) |
| $75,000 to $99,999 | 49 (18.2%) | 127 (31.6%) |
| $100,000 to $149,999 | 13 (4.8%) | 70 (17.4%) |
| $150,000 or more | 36 (13.4%) | 53 (13.2%) |
| Total | 269 (100.0%) | 402 (100.0%) |
Property Value to Household Income Ratio in South Congaree
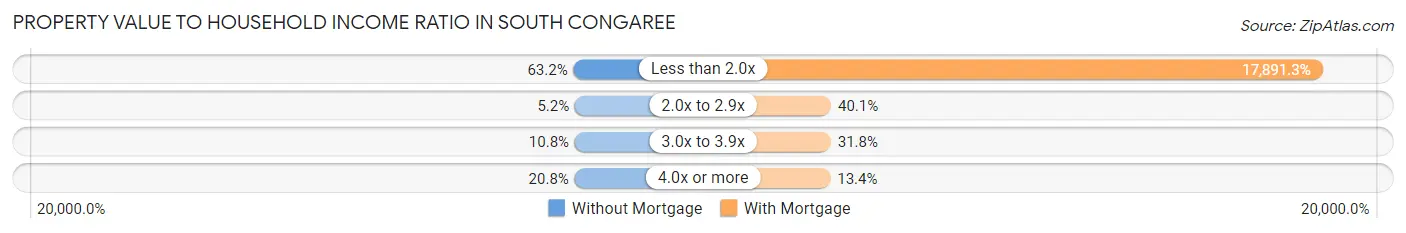
| Value-to-Income Ratio | Without Mortgage | With Mortgage |
| Less than 2.0x | 170 (63.2%) | 71,923 (17,891.3%) |
| 2.0x to 2.9x | 14 (5.2%) | 161 (40.1%) |
| 3.0x to 3.9x | 29 (10.8%) | 128 (31.8%) |
| 4.0x or more | 56 (20.8%) | 54 (13.4%) |
| Total | 269 (100.0%) | 402 (100.0%) |
Real Estate Taxes by Mortgage Status in South Congaree
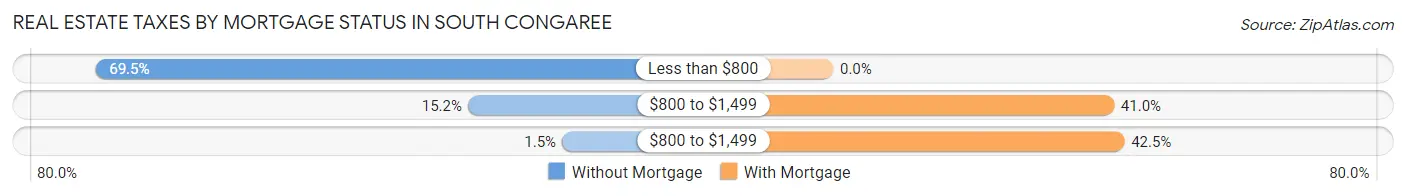
| Property Taxes | Without Mortgage | With Mortgage |
| Less than $800 | 187 (69.5%) | 0 (0.0%) |
| $800 to $1,499 | 41 (15.2%) | 165 (41.0%) |
| $800 to $1,499 | 4 (1.5%) | 171 (42.5%) |
| Total | 269 (100.0%) | 402 (100.0%) |
Health & Disability in South Congaree
Health Insurance Coverage by Age in South Congaree
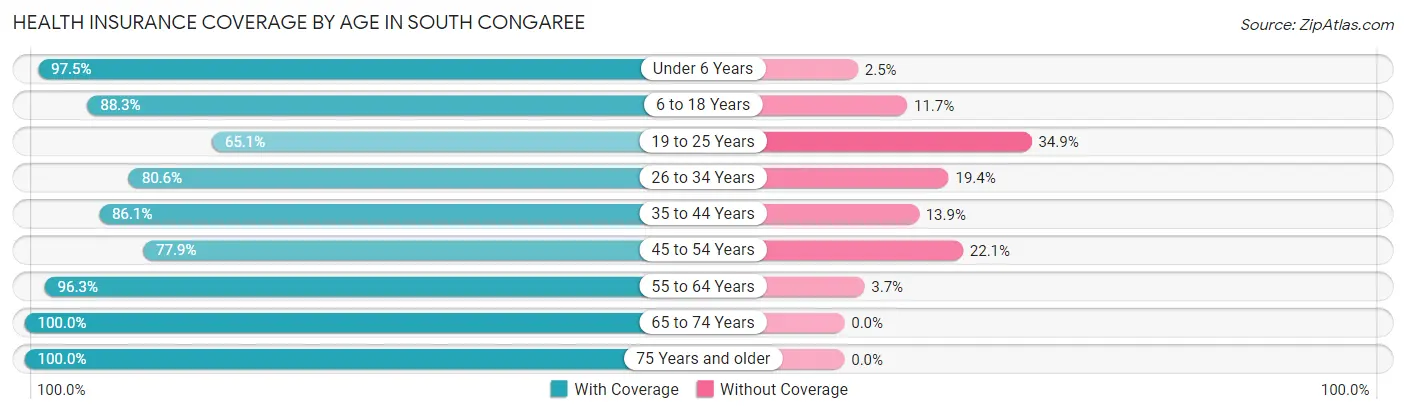
| Age Bracket | With Coverage | Without Coverage |
| Under 6 Years | 154 (97.5%) | 4 (2.5%) |
| 6 to 18 Years | 302 (88.3%) | 40 (11.7%) |
| 19 to 25 Years | 138 (65.1%) | 74 (34.9%) |
| 26 to 34 Years | 257 (80.6%) | 62 (19.4%) |
| 35 to 44 Years | 211 (86.1%) | 34 (13.9%) |
| 45 to 54 Years | 296 (77.9%) | 84 (22.1%) |
| 55 to 64 Years | 283 (96.3%) | 11 (3.7%) |
| 65 to 74 Years | 149 (100.0%) | 0 (0.0%) |
| 75 Years and older | 152 (100.0%) | 0 (0.0%) |
| Total | 1,942 (86.3%) | 309 (13.7%) |
Health Insurance Coverage by Citizenship Status in South Congaree
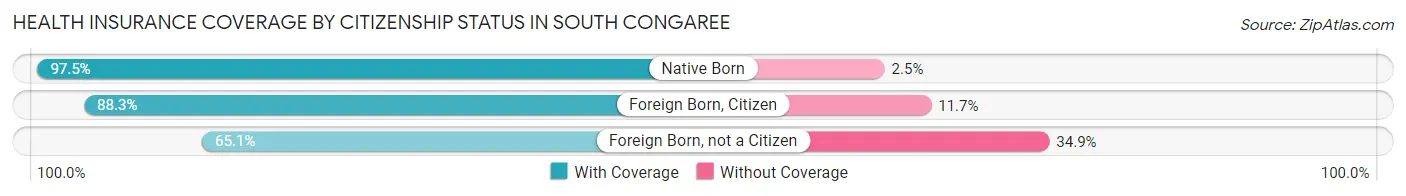
| Citizenship Status | With Coverage | Without Coverage |
| Native Born | 154 (97.5%) | 4 (2.5%) |
| Foreign Born, Citizen | 302 (88.3%) | 40 (11.7%) |
| Foreign Born, not a Citizen | 138 (65.1%) | 74 (34.9%) |
Health Insurance Coverage by Household Income in South Congaree
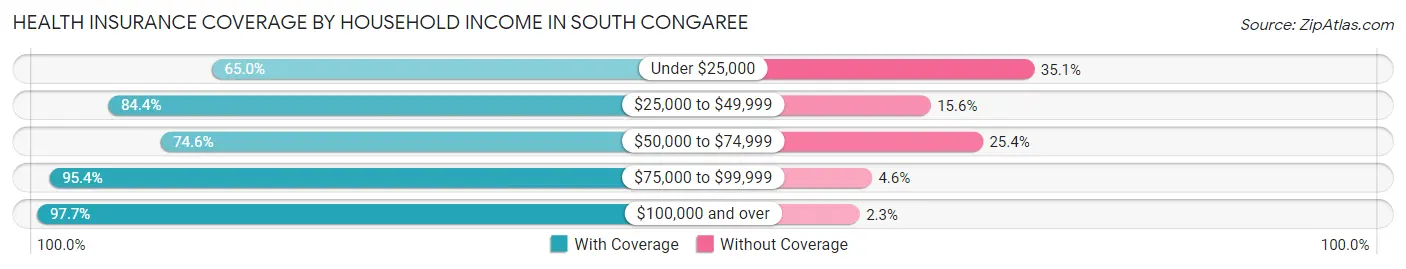
| Household Income | With Coverage | Without Coverage |
| Under $25,000 | 63 (64.9%) | 34 (35.0%) |
| $25,000 to $49,999 | 680 (84.4%) | 126 (15.6%) |
| $50,000 to $74,999 | 352 (74.6%) | 120 (25.4%) |
| $75,000 to $99,999 | 289 (95.4%) | 14 (4.6%) |
| $100,000 and over | 548 (97.7%) | 13 (2.3%) |
Public vs Private Health Insurance Coverage by Age in South Congaree
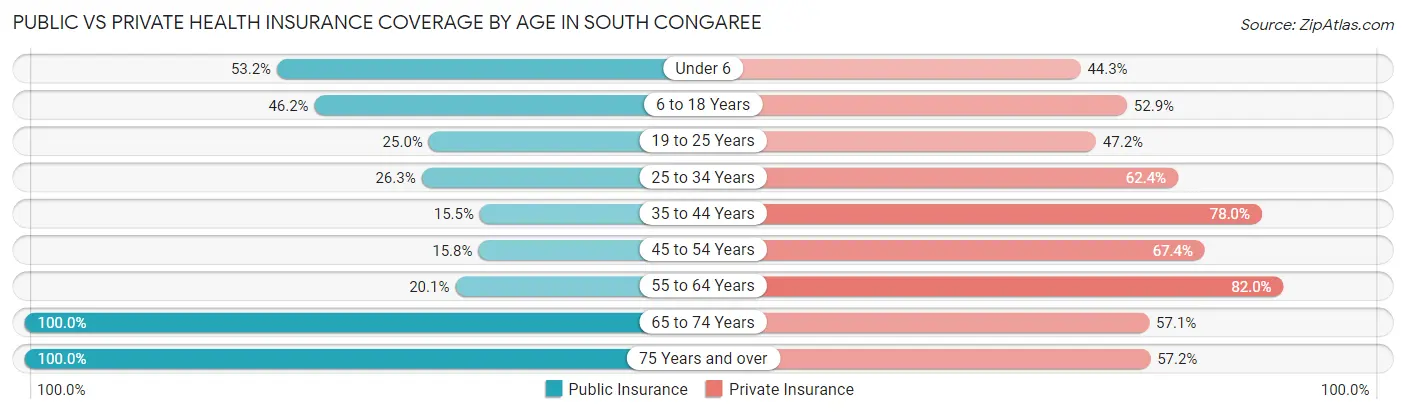
| Age Bracket | Public Insurance | Private Insurance |
| Under 6 | 84 (53.2%) | 70 (44.3%) |
| 6 to 18 Years | 158 (46.2%) | 181 (52.9%) |
| 19 to 25 Years | 53 (25.0%) | 100 (47.2%) |
| 25 to 34 Years | 84 (26.3%) | 199 (62.4%) |
| 35 to 44 Years | 38 (15.5%) | 191 (78.0%) |
| 45 to 54 Years | 60 (15.8%) | 256 (67.4%) |
| 55 to 64 Years | 59 (20.1%) | 241 (82.0%) |
| 65 to 74 Years | 149 (100.0%) | 85 (57.1%) |
| 75 Years and over | 152 (100.0%) | 87 (57.2%) |
| Total | 837 (37.2%) | 1,410 (62.6%) |
Disability Status by Sex by Age in South Congaree
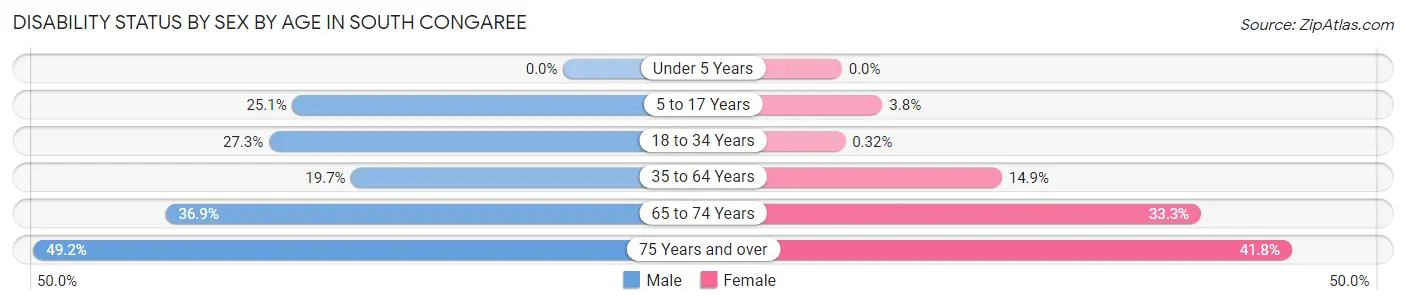
| Age Bracket | Male | Female |
| Under 5 Years | 0 (0.0%) | 0 (0.0%) |
| 5 to 17 Years | 48 (25.1%) | 6 (3.8%) |
| 18 to 34 Years | 59 (27.3%) | 1 (0.3%) |
| 35 to 64 Years | 96 (19.7%) | 64 (14.8%) |
| 65 to 74 Years | 24 (36.9%) | 28 (33.3%) |
| 75 Years and over | 30 (49.2%) | 38 (41.8%) |
Disability Class by Sex by Age in South Congaree
Disability Class: Hearing Difficulty
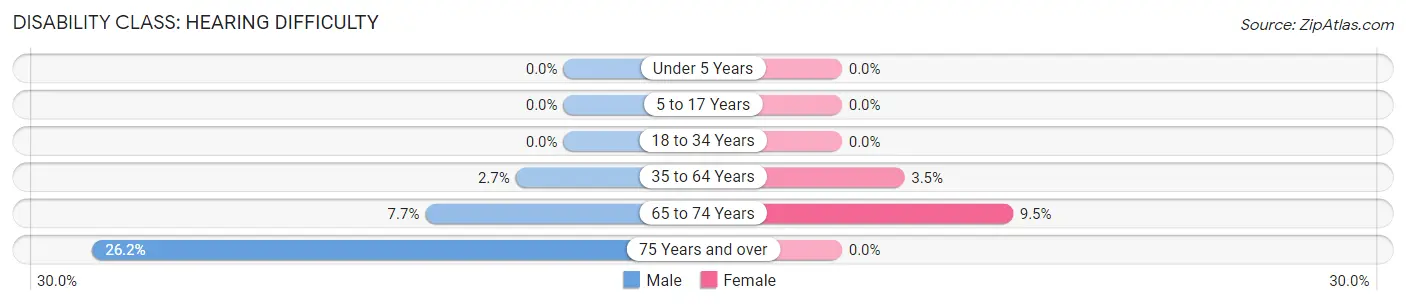
| Age Bracket | Male | Female |
| Under 5 Years | 0 (0.0%) | 0 (0.0%) |
| 5 to 17 Years | 0 (0.0%) | 0 (0.0%) |
| 18 to 34 Years | 0 (0.0%) | 0 (0.0%) |
| 35 to 64 Years | 13 (2.7%) | 15 (3.5%) |
| 65 to 74 Years | 5 (7.7%) | 8 (9.5%) |
| 75 Years and over | 16 (26.2%) | 0 (0.0%) |
Disability Class: Vision Difficulty
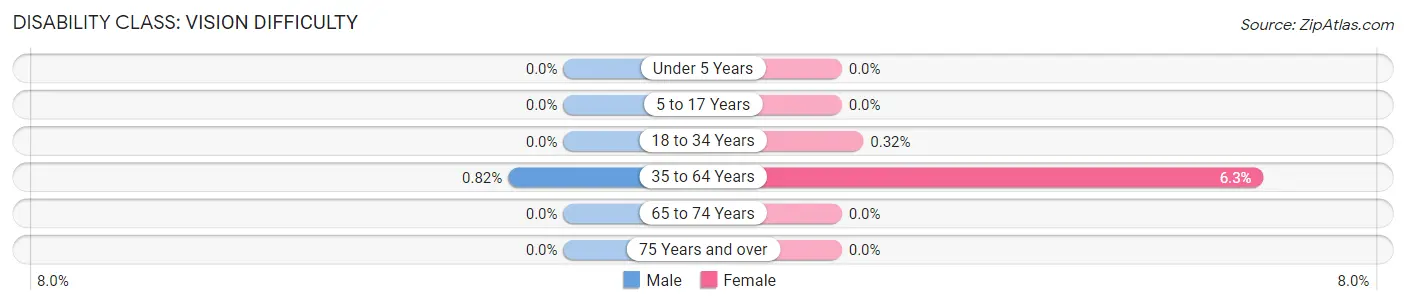
| Age Bracket | Male | Female |
| Under 5 Years | 0 (0.0%) | 0 (0.0%) |
| 5 to 17 Years | 0 (0.0%) | 0 (0.0%) |
| 18 to 34 Years | 0 (0.0%) | 1 (0.3%) |
| 35 to 64 Years | 4 (0.8%) | 27 (6.3%) |
| 65 to 74 Years | 0 (0.0%) | 0 (0.0%) |
| 75 Years and over | 0 (0.0%) | 0 (0.0%) |
Disability Class: Cognitive Difficulty
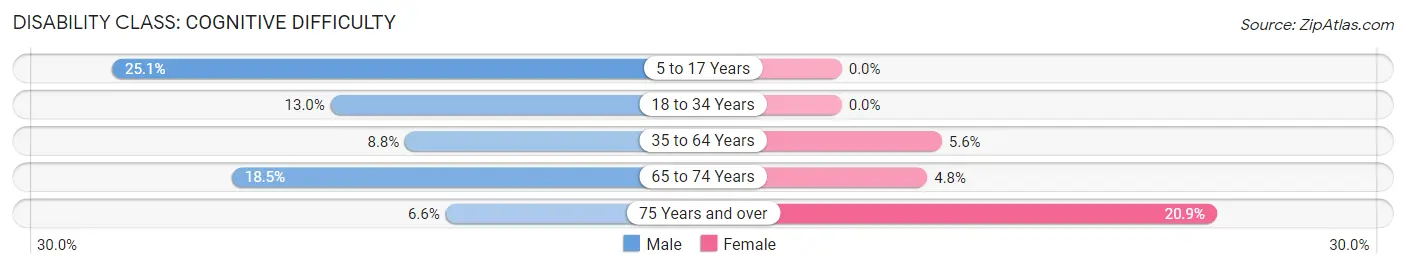
| Age Bracket | Male | Female |
| 5 to 17 Years | 48 (25.1%) | 0 (0.0%) |
| 18 to 34 Years | 28 (13.0%) | 0 (0.0%) |
| 35 to 64 Years | 43 (8.8%) | 24 (5.6%) |
| 65 to 74 Years | 12 (18.5%) | 4 (4.8%) |
| 75 Years and over | 4 (6.6%) | 19 (20.9%) |
Disability Class: Ambulatory Difficulty
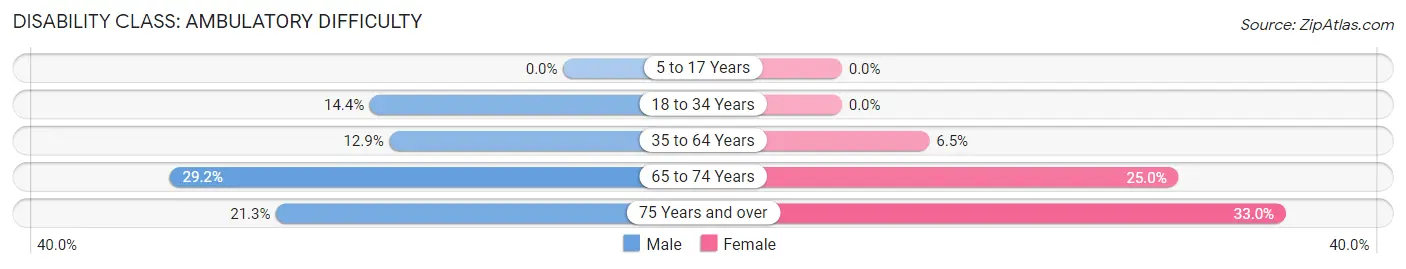
| Age Bracket | Male | Female |
| 5 to 17 Years | 0 (0.0%) | 0 (0.0%) |
| 18 to 34 Years | 31 (14.3%) | 0 (0.0%) |
| 35 to 64 Years | 63 (12.9%) | 28 (6.5%) |
| 65 to 74 Years | 19 (29.2%) | 21 (25.0%) |
| 75 Years and over | 13 (21.3%) | 30 (33.0%) |
Disability Class: Self-Care Difficulty
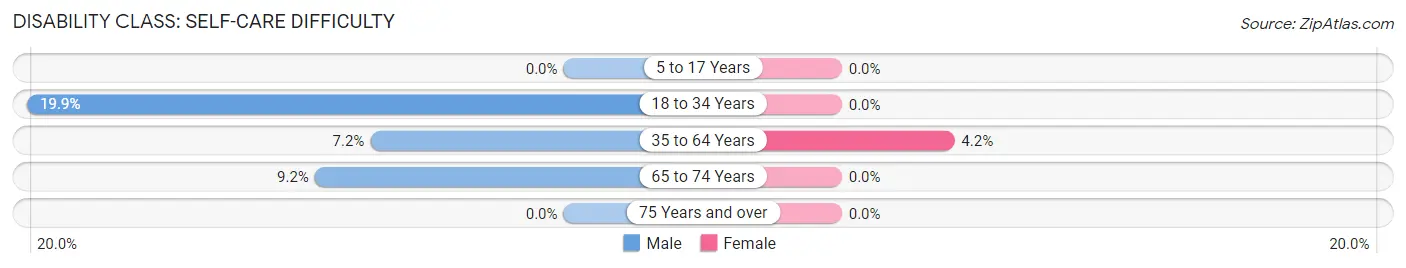
| Age Bracket | Male | Female |
| 5 to 17 Years | 0 (0.0%) | 0 (0.0%) |
| 18 to 34 Years | 43 (19.9%) | 0 (0.0%) |
| 35 to 64 Years | 35 (7.2%) | 18 (4.2%) |
| 65 to 74 Years | 6 (9.2%) | 0 (0.0%) |
| 75 Years and over | 0 (0.0%) | 0 (0.0%) |
Technology Access in South Congaree
Computing Device Access in South Congaree
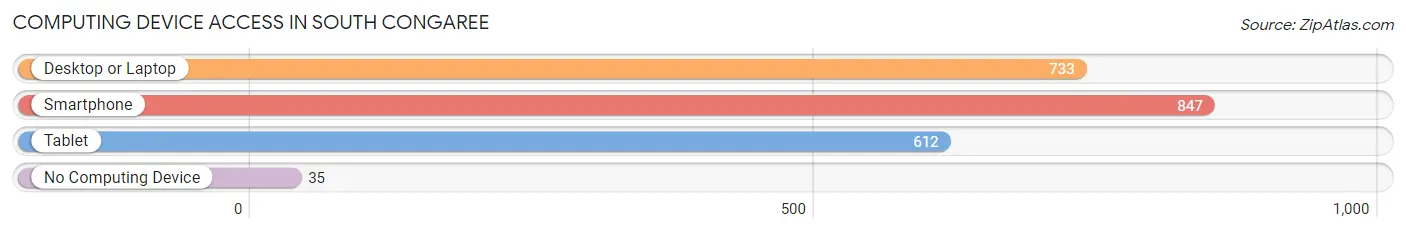
| Device Type | # Households | % Households |
| Desktop or Laptop | 733 | 78.5% |
| Smartphone | 847 | 90.7% |
| Tablet | 612 | 65.5% |
| No Computing Device | 35 | 3.7% |
| Total | 934 | 100.0% |
Internet Access in South Congaree
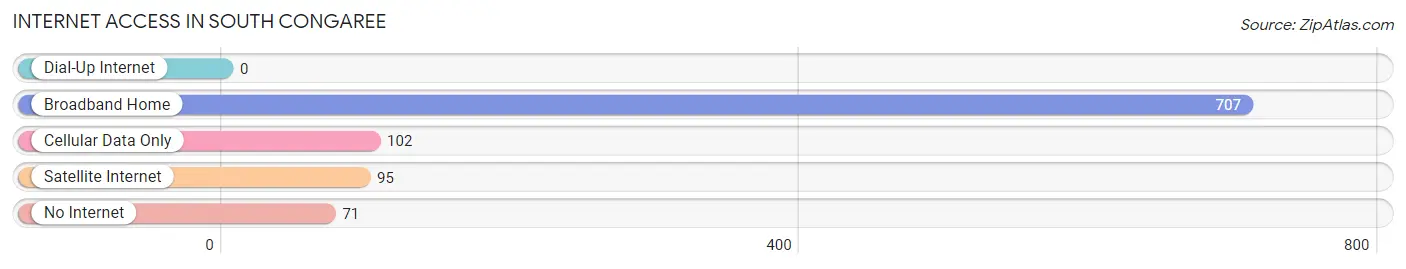
| Internet Type | # Households | % Households |
| Dial-Up Internet | 0 | 0.0% |
| Broadband Home | 707 | 75.7% |
| Cellular Data Only | 102 | 10.9% |
| Satellite Internet | 95 | 10.2% |
| No Internet | 71 | 7.6% |
| Total | 934 | 100.0% |
South Congaree Summary
History
South Congaree is a small town located in Lexington County, South Carolina. It is situated approximately 15 miles south of the state capital, Columbia. The town was founded in 1891 and was originally known as “Congaree”. The name was changed to South Congaree in 1895 to distinguish it from the nearby town of North Congaree.
The town was originally settled by a small group of farmers who were attracted to the area by its fertile soil and abundant natural resources. The town grew slowly over the years, but it was not until the early 20th century that it began to experience significant growth. In the 1920s, the town was incorporated and the population began to increase rapidly. By the 1950s, South Congaree had become a thriving community with a population of over 1,000 people.
Geography
South Congaree is located in the Midlands region of South Carolina. It is situated in the Congaree River Valley, which is part of the larger Savannah River Valley. The town is located approximately 15 miles south of the state capital, Columbia. The town is bordered by the towns of North Congaree, Cayce, and West Columbia.
The town is situated on a flat plain, with the Congaree River running through the center of town. The town is surrounded by forests and wetlands, which provide a variety of habitats for wildlife. The town is also home to several parks, including Congaree National Park, which is located just outside of town.
Economy
The economy of South Congaree is largely based on agriculture and manufacturing. The town is home to several large farms, which produce a variety of crops, including corn, soybeans, and cotton. The town is also home to several manufacturing companies, which produce a variety of products, including furniture, textiles, and automotive parts.
The town is also home to several small businesses, including restaurants, retail stores, and service providers. The town is also home to several educational institutions, including a community college and a technical college.
Demographics
As of the 2010 census, the population of South Congaree was 1,845. The town has a population that is predominantly white (83.3%), with African Americans making up the second largest racial group (14.2%). The town also has a small Hispanic population (2.2%).
The median household income in South Congaree is $41,944, which is slightly lower than the state median of $44,764. The town has a poverty rate of 16.2%, which is slightly higher than the state average of 14.7%. The town also has a higher unemployment rate than the state average, at 8.2% compared to the state average of 6.2%.
Conclusion
South Congaree is a small town located in Lexington County, South Carolina. It was founded in 1891 and has a population of 1,845 as of the 2010 census. The town is largely agricultural and manufacturing based, with a median household income of $41,944 and a poverty rate of 16.2%. The town is also home to several parks, educational institutions, and small businesses.
Common Questions
What is Per Capita Income in South Congaree?
Per Capita income in South Congaree is $28,924.
What is the Median Family Income in South Congaree?
Median Family Income in South Congaree is $60,542.
What is the Median Household income in South Congaree?
Median Household Income in South Congaree is $55,636.
What is Income or Wage Gap in South Congaree?
Income or Wage Gap in South Congaree is 33.0%.
Women in South Congaree earn 67.0 cents for every dollar earned by a man.
What is Inequality or Gini Index in South Congaree?
Inequality or Gini Index in South Congaree is 0.36.
What is the Total Population of South Congaree?
Total Population of South Congaree is 2,256.
What is the Total Male Population of South Congaree?
Total Male Population of South Congaree is 1,076.
What is the Total Female Population of South Congaree?
Total Female Population of South Congaree is 1,180.
What is the Ratio of Males per 100 Females in South Congaree?
There are 91.19 Males per 100 Females in South Congaree.
What is the Ratio of Females per 100 Males in South Congaree?
There are 109.67 Females per 100 Males in South Congaree.
What is the Median Population Age in South Congaree?
Median Population Age in South Congaree is 37.4 Years.
What is the Average Family Size in South Congaree
Average Family Size in South Congaree is 2.7 People.
What is the Average Household Size in South Congaree
Average Household Size in South Congaree is 2.4 People.
How Large is the Labor Force in South Congaree?
There are 1,269 People in the Labor Forcein in South Congaree.
What is the Percentage of People in the Labor Force in South Congaree?
69.4% of People are in the Labor Force in South Congaree.
What is the Unemployment Rate in South Congaree?
Unemployment Rate in South Congaree is 2.6%.