East Sumter, SC Map & Demographics
East Sumter Map
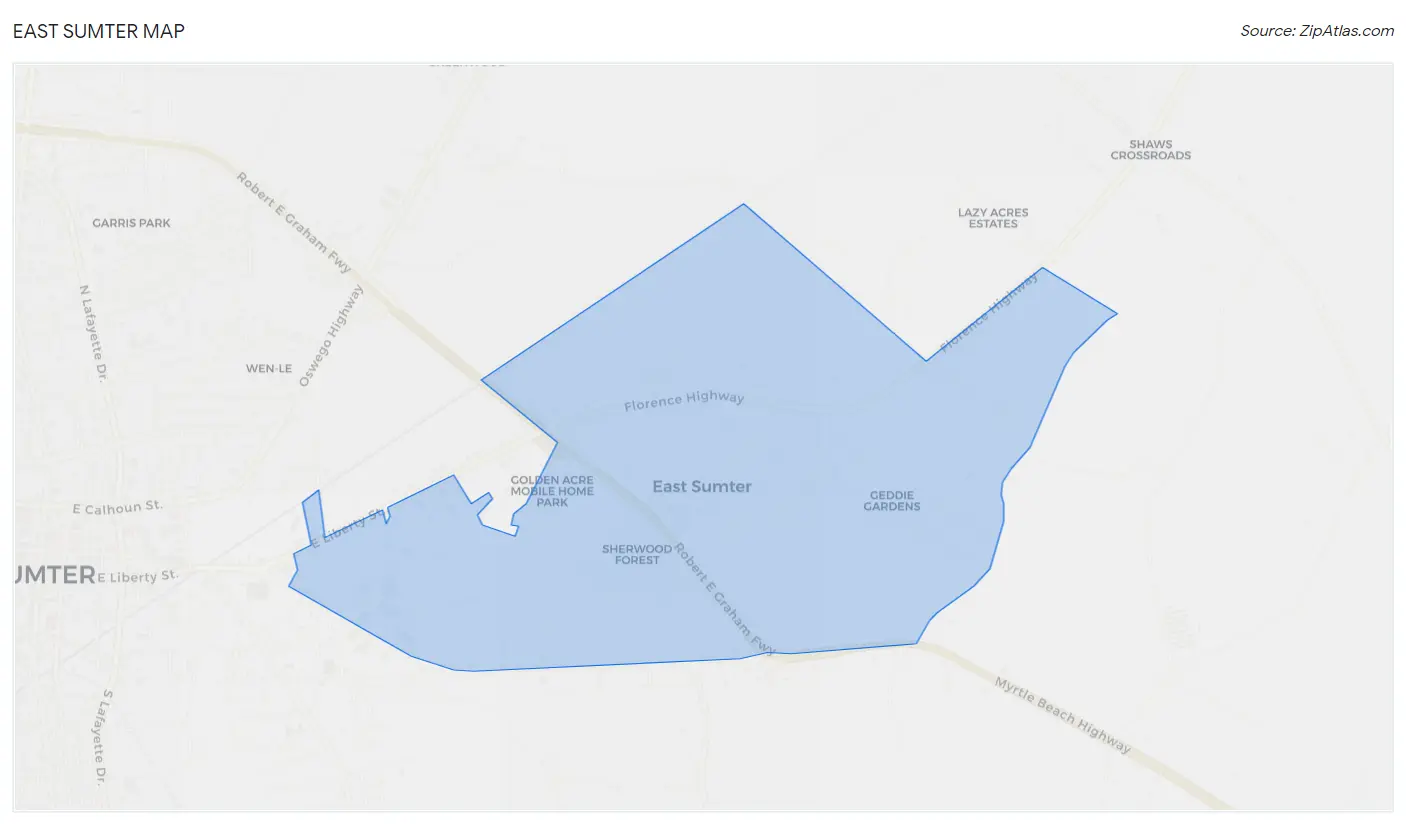
East Sumter Overview
$23,231
PER CAPITA INCOME
$80,909
AVG FAMILY INCOME
5.2%
WAGE / INCOME GAP [ % ]
94.8¢/ $1
WAGE / INCOME GAP [ $ ]
0.51
INEQUALITY / GINI INDEX
789
TOTAL POPULATION
481
MALE POPULATION
308
FEMALE POPULATION
156.17
MALES / 100 FEMALES
64.03
FEMALES / 100 MALES
50.4
MEDIAN AGE
2.4
AVG FAMILY SIZE
1.8
AVG HOUSEHOLD SIZE
360
LABOR FORCE [ PEOPLE ]
52.3%
PERCENT IN LABOR FORCE
Income in East Sumter
Income Overview in East Sumter
| Characteristic | Number | Measure |
| Per Capita Income | 789 | $23,231 |
| Median Family Income | 202 | $80,909 |
| Mean Family Income | 202 | $69,740 |
| Median Household Income | 446 | $0 |
| Mean Household Income | 446 | $42,026 |
| Income Deficit | 202 | $0 |
| Wage / Income Gap (%) | 789 | 5.18% |
| Wage / Income Gap ($) | 789 | 94.82¢ per $1 |
| Gini / Inequality Index | 789 | 0.51 |
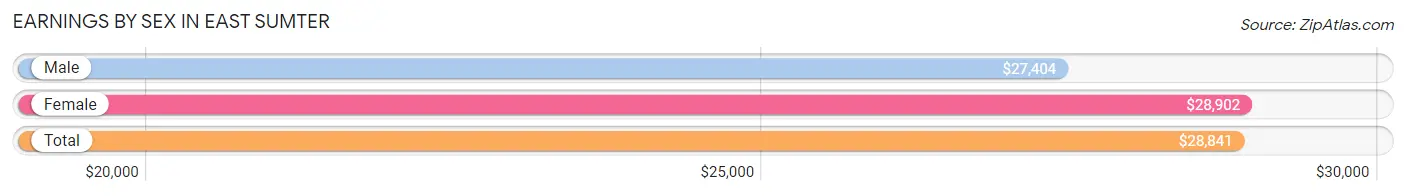
Earnings by Sex in East Sumter
Average Earnings in East Sumter are $28,841, $27,404 for men and $28,902 for women, a difference of 5.2%.
| Sex | Number | Average Earnings |
| Male | 170 (47.2%) | $27,404 |
| Female | 190 (52.8%) | $28,902 |
| Total | 360 (100.0%) | $28,841 |
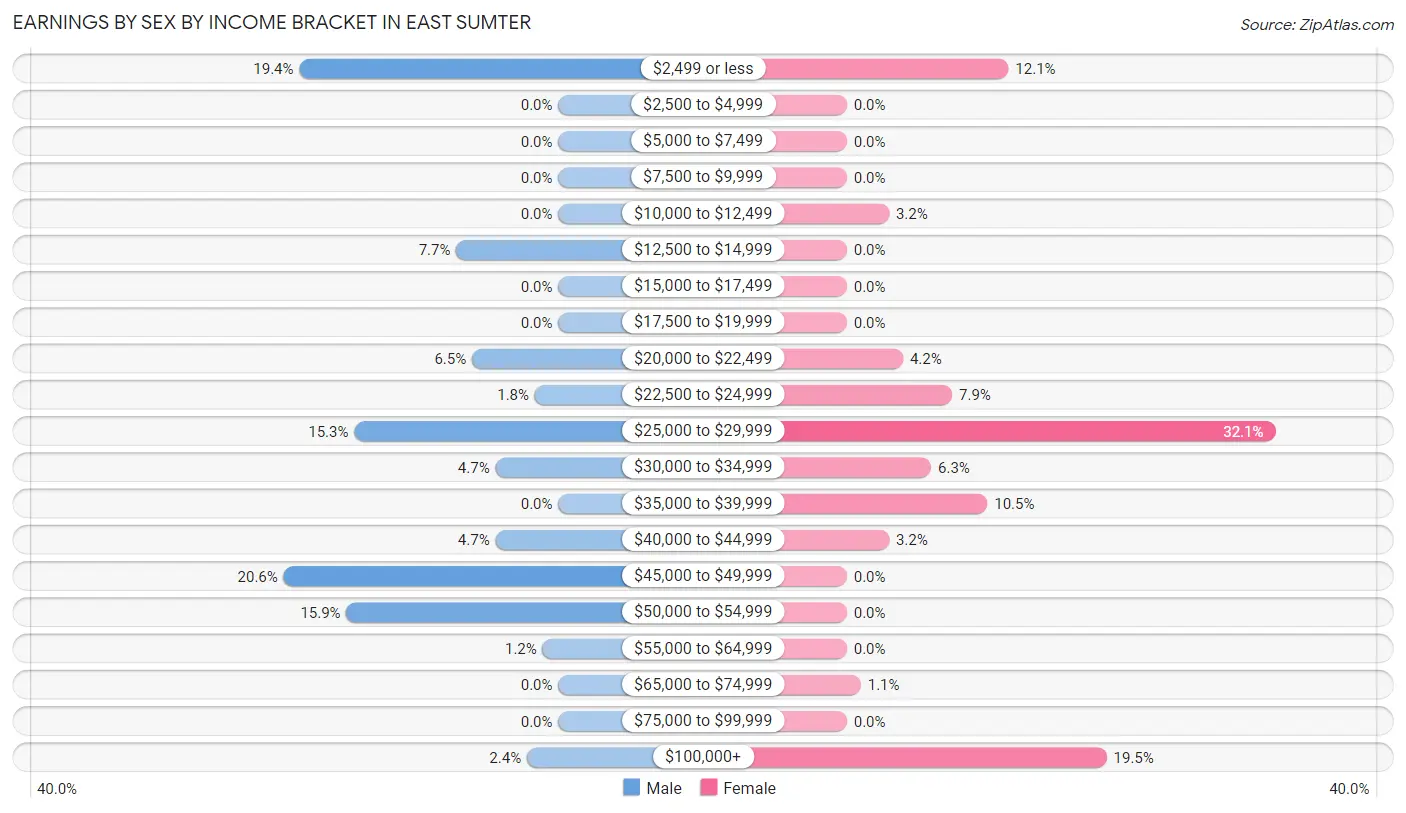
Earnings by Sex by Income Bracket in East Sumter
The most common earnings brackets in East Sumter are $45,000 to $49,999 for men (35 | 20.6%) and $25,000 to $29,999 for women (61 | 32.1%).
| Income | Male | Female |
| $2,499 or less | 33 (19.4%) | 23 (12.1%) |
| $2,500 to $4,999 | 0 (0.0%) | 0 (0.0%) |
| $5,000 to $7,499 | 0 (0.0%) | 0 (0.0%) |
| $7,500 to $9,999 | 0 (0.0%) | 0 (0.0%) |
| $10,000 to $12,499 | 0 (0.0%) | 6 (3.2%) |
| $12,500 to $14,999 | 13 (7.6%) | 0 (0.0%) |
| $15,000 to $17,499 | 0 (0.0%) | 0 (0.0%) |
| $17,500 to $19,999 | 0 (0.0%) | 0 (0.0%) |
| $20,000 to $22,499 | 11 (6.5%) | 8 (4.2%) |
| $22,500 to $24,999 | 3 (1.8%) | 15 (7.9%) |
| $25,000 to $29,999 | 26 (15.3%) | 61 (32.1%) |
| $30,000 to $34,999 | 8 (4.7%) | 12 (6.3%) |
| $35,000 to $39,999 | 0 (0.0%) | 20 (10.5%) |
| $40,000 to $44,999 | 8 (4.7%) | 6 (3.2%) |
| $45,000 to $49,999 | 35 (20.6%) | 0 (0.0%) |
| $50,000 to $54,999 | 27 (15.9%) | 0 (0.0%) |
| $55,000 to $64,999 | 2 (1.2%) | 0 (0.0%) |
| $65,000 to $74,999 | 0 (0.0%) | 2 (1.1%) |
| $75,000 to $99,999 | 0 (0.0%) | 0 (0.0%) |
| $100,000+ | 4 (2.4%) | 37 (19.5%) |
| Total | 170 (100.0%) | 190 (100.0%) |
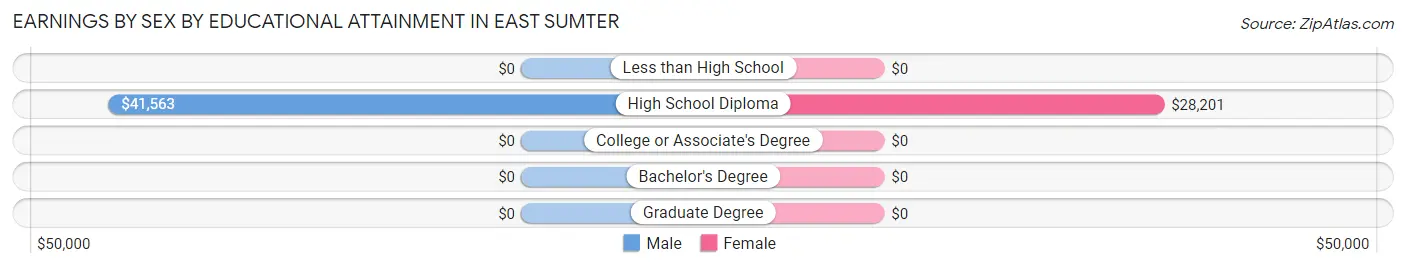
Earnings by Sex by Educational Attainment in East Sumter
Average earnings in East Sumter are $32,656 for men and $28,902 for women, a difference of 11.5%. Men with an educational attainment of high school diploma enjoy the highest average annual earnings of $41,563, while those with high school diploma education earn the least with $41,563. Women with an educational attainment of high school diploma earn the most with the average annual earnings of $28,201, while those with high school diploma education have the smallest earnings of $28,201.
| Educational Attainment | Male Income | Female Income |
| Less than High School | - | - |
| High School Diploma | $41,563 | $28,201 |
| College or Associate's Degree | - | - |
| Bachelor's Degree | - | - |
| Graduate Degree | - | - |
| Total | $32,656 | $28,902 |
Family Income in East Sumter
Family Income Brackets in East Sumter
According to the East Sumter family income data, there are 71 families falling into the $75,000 to $99,999 income range, which is the most common income bracket and makes up 35.1% of all families.
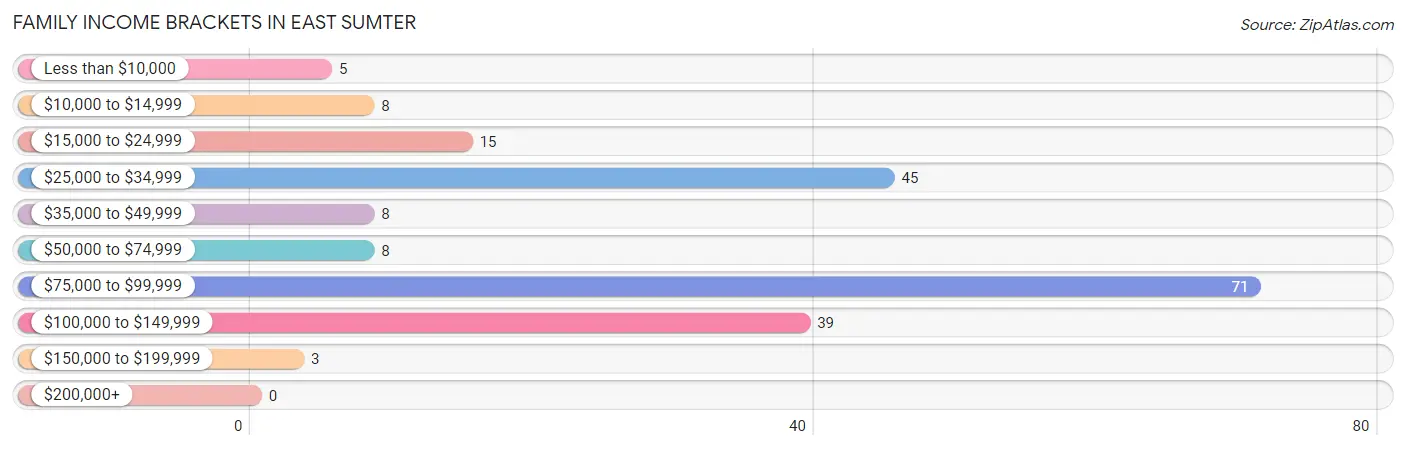
| Income Bracket | # Families | % Families |
| Less than $10,000 | 5 | 2.5% |
| $10,000 to $14,999 | 8 | 4.0% |
| $15,000 to $24,999 | 15 | 7.4% |
| $25,000 to $34,999 | 45 | 22.3% |
| $35,000 to $49,999 | 8 | 4.0% |
| $50,000 to $74,999 | 8 | 4.0% |
| $75,000 to $99,999 | 71 | 35.1% |
| $100,000 to $149,999 | 39 | 19.3% |
| $150,000 to $199,999 | 3 | 1.5% |
| $200,000+ | 0 | 0.0% |
Family Income by Famaliy Size in East Sumter
2-person families (105 | 52.0%) account for the highest median family income in East Sumter with $80,492 per family, while 2-person families (105 | 52.0%) have the highest median income of $40,246 per family member.
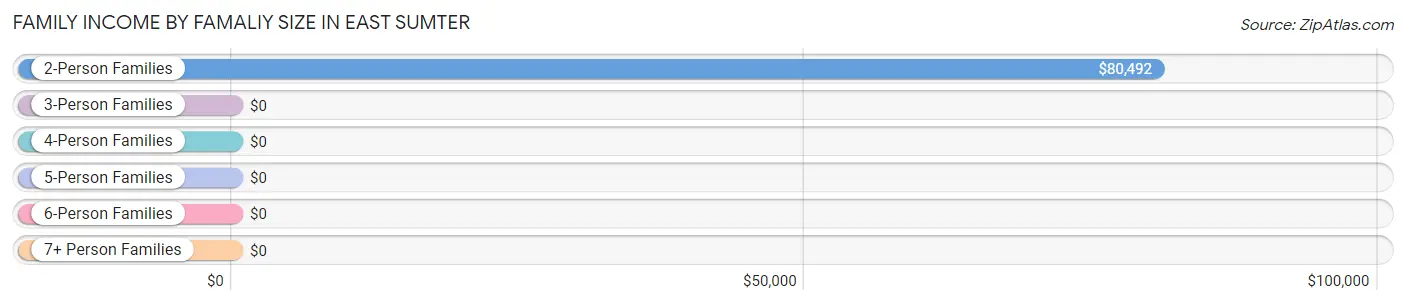
| Income Bracket | # Families | Median Income |
| 2-Person Families | 105 (52.0%) | $80,492 |
| 3-Person Families | 92 (45.5%) | $0 |
| 4-Person Families | 5 (2.5%) | $0 |
| 5-Person Families | 0 (0.0%) | $0 |
| 6-Person Families | 0 (0.0%) | $0 |
| 7+ Person Families | 0 (0.0%) | $0 |
| Total | 202 (100.0%) | $80,909 |
Family Income by Number of Earners in East Sumter
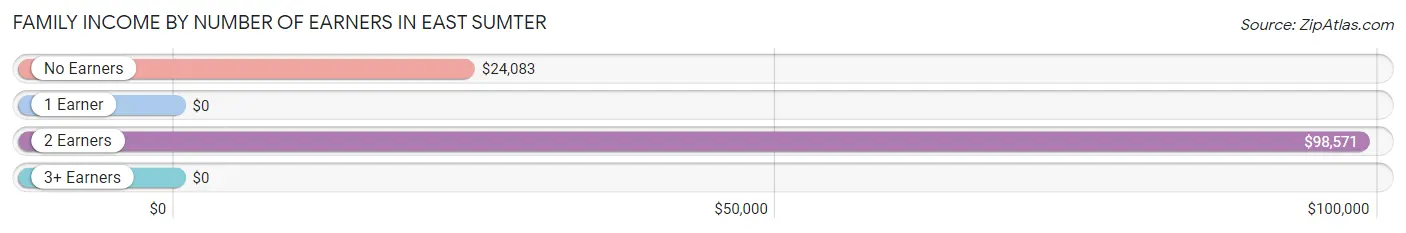
| Number of Earners | # Families | Median Income |
| No Earners | 41 (20.3%) | $24,083 |
| 1 Earner | 67 (33.2%) | $0 |
| 2 Earners | 94 (46.5%) | $98,571 |
| 3+ Earners | 0 (0.0%) | $0 |
| Total | 202 (100.0%) | $80,909 |
Household Income in East Sumter
Household Income Brackets in East Sumter
With 161 households falling in the category, the less than $10,000 income range is the most frequent in East Sumter, accounting for 36.1% of all households.
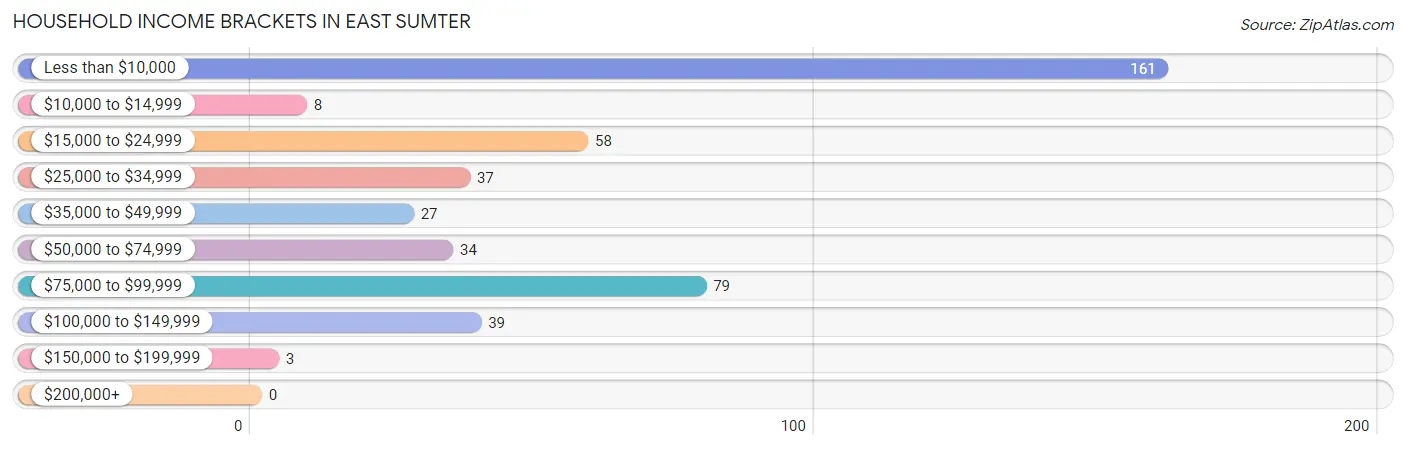
| Income Bracket | # Households | % Households |
| Less than $10,000 | 161 | 36.1% |
| $10,000 to $14,999 | 8 | 1.8% |
| $15,000 to $24,999 | 58 | 13.0% |
| $25,000 to $34,999 | 37 | 8.3% |
| $35,000 to $49,999 | 27 | 6.1% |
| $50,000 to $74,999 | 34 | 7.6% |
| $75,000 to $99,999 | 79 | 17.7% |
| $100,000 to $149,999 | 39 | 8.7% |
| $150,000 to $199,999 | 3 | 0.7% |
| $200,000+ | 0 | 0.0% |
Household Income by Householder Age in East Sumter
The median household income in East Sumter is $0, with the highest median household income of $61,667 found in the 45 to 64 years age bracket for the primary householder. A total of 158 households (35.4%) fall into this category.
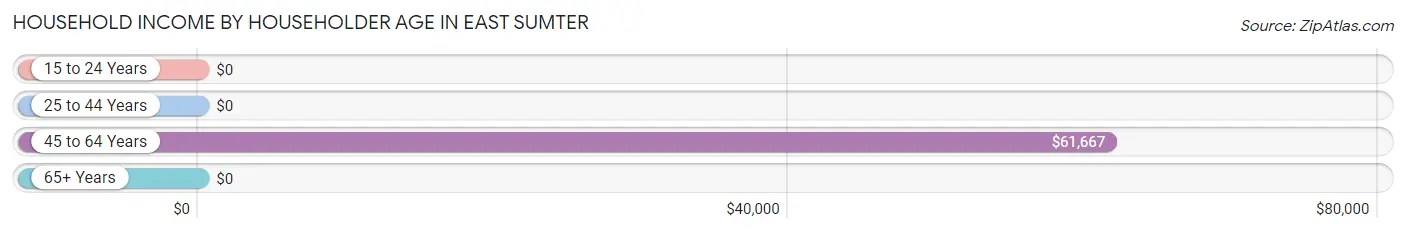
| Income Bracket | # Households | Median Income |
| 15 to 24 Years | 0 (0.0%) | $0 |
| 25 to 44 Years | 105 (23.5%) | $0 |
| 45 to 64 Years | 158 (35.4%) | $61,667 |
| 65+ Years | 183 (41.0%) | $0 |
| Total | 446 (100.0%) | $0 |
Poverty in East Sumter
Income Below Poverty by Sex and Age in East Sumter
With 39.2% poverty level for males and 12.7% for females among the residents of East Sumter, 65 to 74 year old males and 5 year old females are the most vulnerable to poverty, with 108 males (80.0%) and 1 females (100.0%) in their respective age groups living below the poverty level.
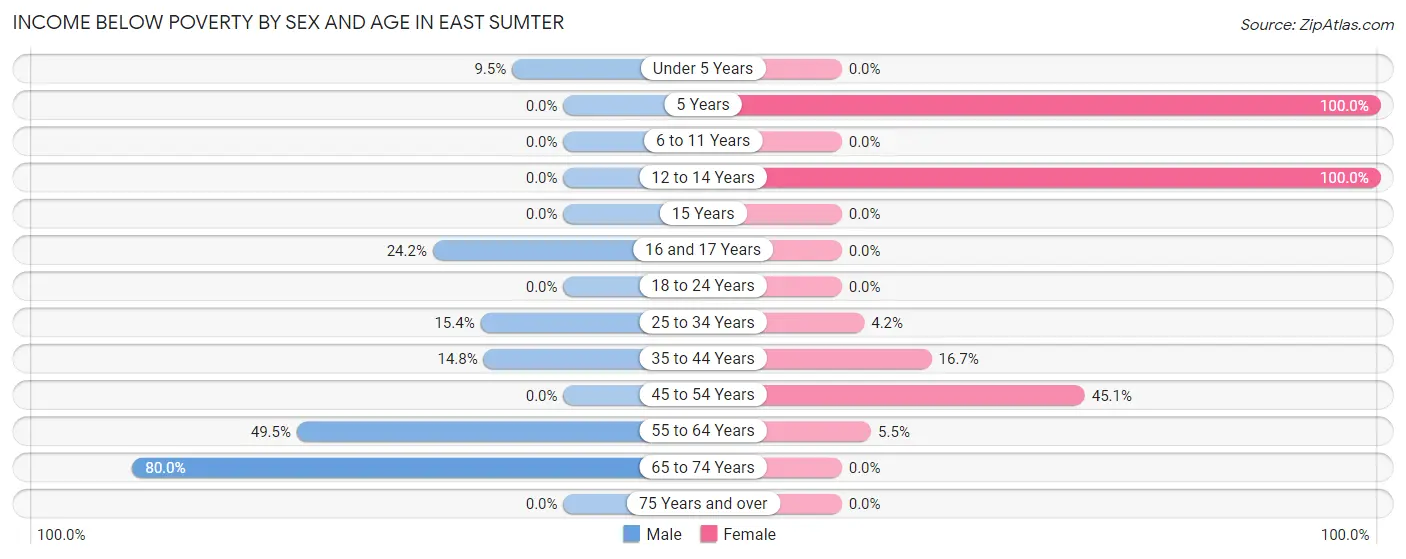
| Age Bracket | Male | Female |
| Under 5 Years | 6 (9.5%) | 0 (0.0%) |
| 5 Years | 0 (0.0%) | 1 (100.0%) |
| 6 to 11 Years | 0 (0.0%) | 0 (0.0%) |
| 12 to 14 Years | 0 (0.0%) | 6 (100.0%) |
| 15 Years | 0 (0.0%) | 0 (0.0%) |
| 16 and 17 Years | 8 (24.2%) | 0 (0.0%) |
| 18 to 24 Years | 0 (0.0%) | 0 (0.0%) |
| 25 to 34 Years | 8 (15.4%) | 3 (4.2%) |
| 35 to 44 Years | 8 (14.8%) | 3 (16.7%) |
| 45 to 54 Years | 0 (0.0%) | 23 (45.1%) |
| 55 to 64 Years | 48 (49.5%) | 3 (5.4%) |
| 65 to 74 Years | 108 (80.0%) | 0 (0.0%) |
| 75 Years and over | 0 (0.0%) | 0 (0.0%) |
| Total | 186 (39.2%) | 39 (12.7%) |
Income Above Poverty by Sex and Age in East Sumter
According to the poverty statistics in East Sumter, males aged 45 to 54 years and females aged under 5 years are the age groups that are most secure financially, with 100.0% of males and 100.0% of females in these age groups living above the poverty line.
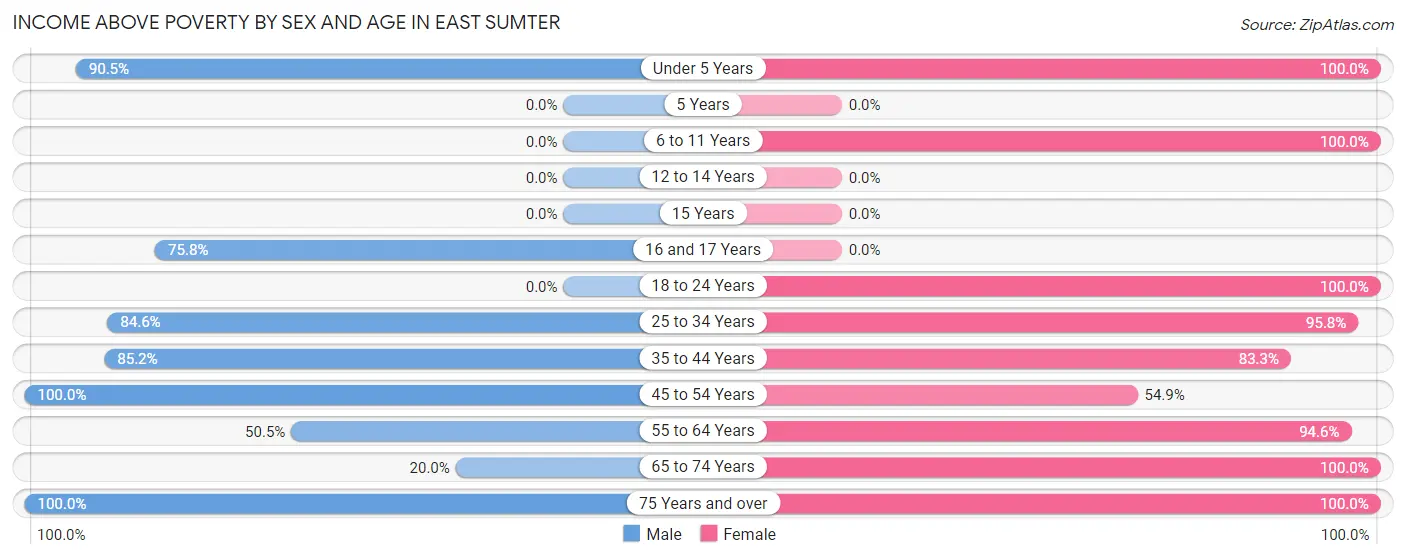
| Age Bracket | Male | Female |
| Under 5 Years | 57 (90.5%) | 22 (100.0%) |
| 5 Years | 0 (0.0%) | 0 (0.0%) |
| 6 to 11 Years | 0 (0.0%) | 3 (100.0%) |
| 12 to 14 Years | 0 (0.0%) | 0 (0.0%) |
| 15 Years | 0 (0.0%) | 0 (0.0%) |
| 16 and 17 Years | 25 (75.8%) | 0 (0.0%) |
| 18 to 24 Years | 0 (0.0%) | 4 (100.0%) |
| 25 to 34 Years | 44 (84.6%) | 69 (95.8%) |
| 35 to 44 Years | 46 (85.2%) | 15 (83.3%) |
| 45 to 54 Years | 22 (100.0%) | 28 (54.9%) |
| 55 to 64 Years | 49 (50.5%) | 52 (94.6%) |
| 65 to 74 Years | 27 (20.0%) | 24 (100.0%) |
| 75 Years and over | 19 (100.0%) | 52 (100.0%) |
| Total | 289 (60.8%) | 269 (87.3%) |
Income Below Poverty Among Married-Couple Families in East Sumter
The poverty statistics for married-couple families in East Sumter show that 1.5% or 2 of the total 132 families live below the poverty line. Families with 1 or 2 children have the highest poverty rate of 5.1%, comprising of 2 families. On the other hand, families with no children have the lowest poverty rate of 0.0%, which includes 0 families.
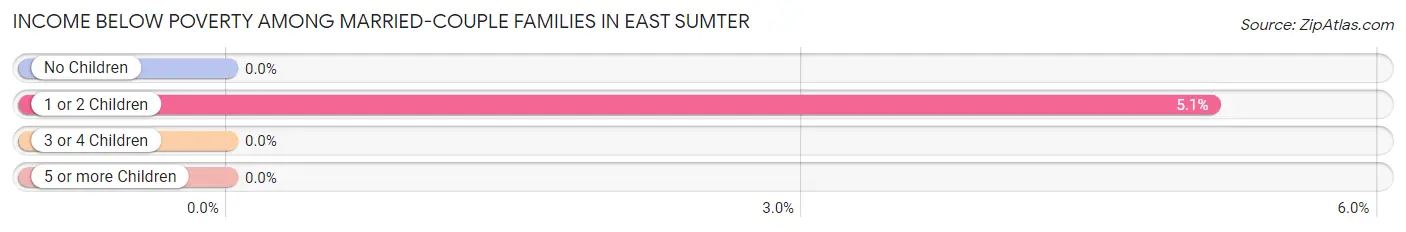
| Children | Above Poverty | Below Poverty |
| No Children | 93 (100.0%) | 0 (0.0%) |
| 1 or 2 Children | 37 (94.9%) | 2 (5.1%) |
| 3 or 4 Children | 0 (0.0%) | 0 (0.0%) |
| 5 or more Children | 0 (0.0%) | 0 (0.0%) |
| Total | 130 (98.5%) | 2 (1.5%) |
Income Below Poverty Among Single-Parent Households in East Sumter
According to the poverty data in East Sumter, 28.6% or 8 single-father households and 7.1% or 3 single-mother households are living below the poverty line. Among single-father households, those with 1 or 2 children have the highest poverty rate, with 8 households (28.6%) experiencing poverty. Likewise, among single-mother households, those with 1 or 2 children have the highest poverty rate, with 3 households (12.5%) falling below the poverty line.
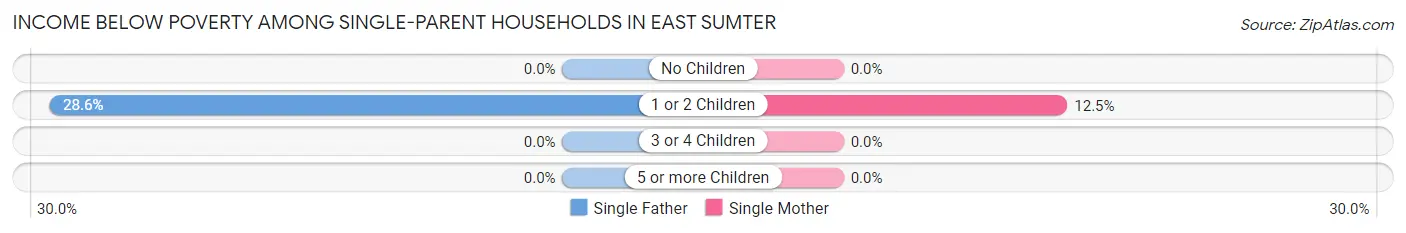
| Children | Single Father | Single Mother |
| No Children | 0 (0.0%) | 0 (0.0%) |
| 1 or 2 Children | 8 (28.6%) | 3 (12.5%) |
| 3 or 4 Children | 0 (0.0%) | 0 (0.0%) |
| 5 or more Children | 0 (0.0%) | 0 (0.0%) |
| Total | 8 (28.6%) | 3 (7.1%) |
Income Below Poverty Among Married-Couple vs Single-Parent Households in East Sumter
The poverty data for East Sumter shows that 2 of the married-couple family households (1.5%) and 11 of the single-parent households (15.7%) are living below the poverty level. Within the married-couple family households, those with 1 or 2 children have the highest poverty rate, with 2 households (5.1%) falling below the poverty line. Among the single-parent households, those with 1 or 2 children have the highest poverty rate, with 11 household (21.1%) living below poverty.
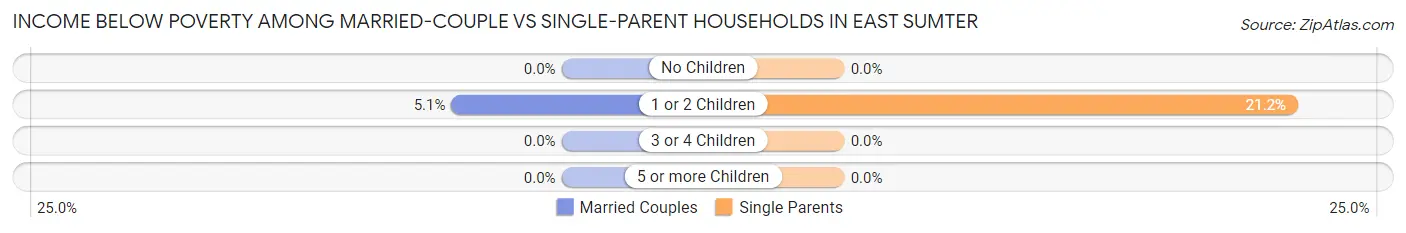
| Children | Married-Couple Families | Single-Parent Households |
| No Children | 0 (0.0%) | 0 (0.0%) |
| 1 or 2 Children | 2 (5.1%) | 11 (21.1%) |
| 3 or 4 Children | 0 (0.0%) | 0 (0.0%) |
| 5 or more Children | 0 (0.0%) | 0 (0.0%) |
| Total | 2 (1.5%) | 11 (15.7%) |
Race in East Sumter
The most populous races in East Sumter are Black / African American (464 | 58.8%), White / Caucasian (301 | 38.2%), and Hispanic or Latino (24 | 3.0%).
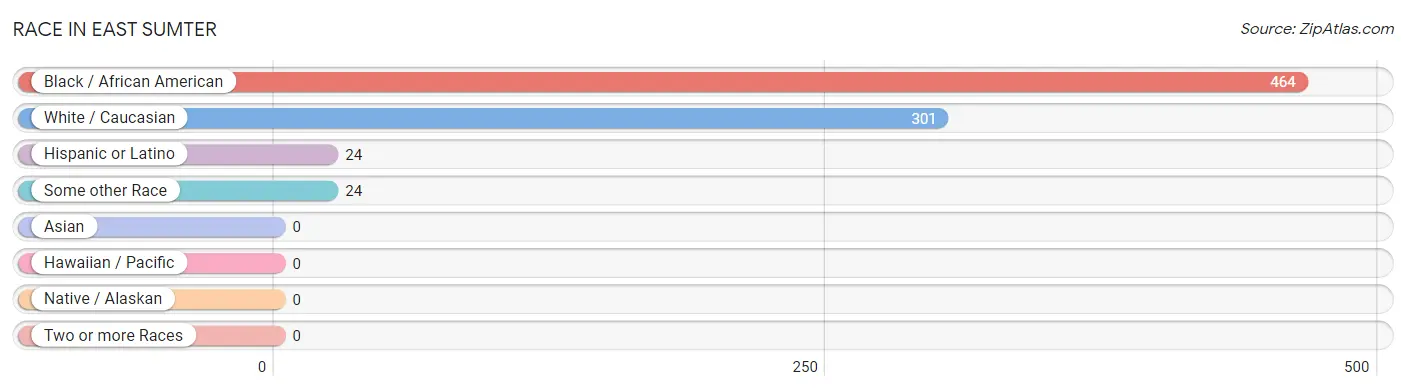
| Race | # Population | % Population |
| Asian | 0 | 0.0% |
| Black / African American | 464 | 58.8% |
| Hawaiian / Pacific | 0 | 0.0% |
| Hispanic or Latino | 24 | 3.0% |
| Native / Alaskan | 0 | 0.0% |
| White / Caucasian | 301 | 38.2% |
| Two or more Races | 0 | 0.0% |
| Some other Race | 24 | 3.0% |
| Total | 789 | 100.0% |
Ancestry in East Sumter
The most populous ancestries reported in East Sumter are Irish (145 | 18.4%), German (50 | 6.3%), African (43 | 5.4%), Subsaharan African (43 | 5.4%), and French (22 | 2.8%), together accounting for 38.4% of all East Sumter residents.
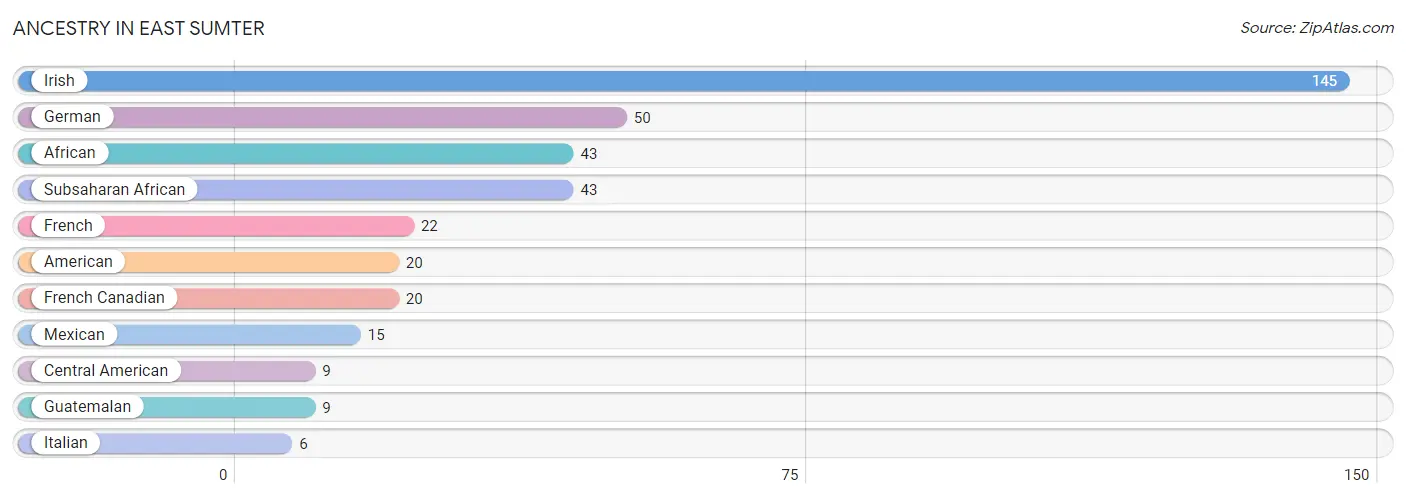
| Ancestry | # Population | % Population |
| African | 43 | 5.4% |
| American | 20 | 2.5% |
| Central American | 9 | 1.1% |
| French | 22 | 2.8% |
| French Canadian | 20 | 2.5% |
| German | 50 | 6.3% |
| Guatemalan | 9 | 1.1% |
| Irish | 145 | 18.4% |
| Italian | 6 | 0.8% |
| Mexican | 15 | 1.9% |
| Subsaharan African | 43 | 5.4% | View All 11 Rows |
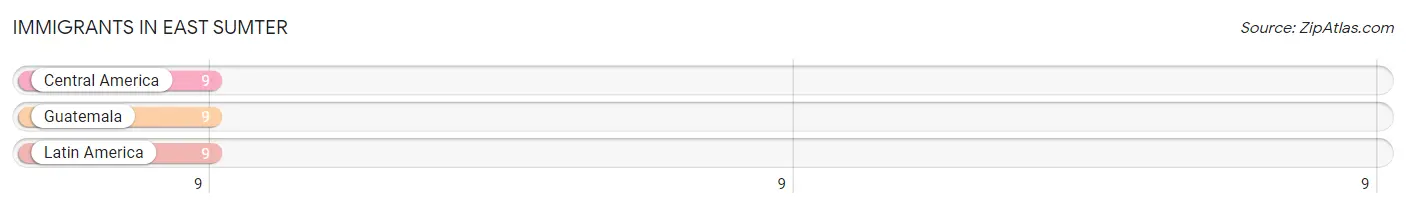
Immigrants in East Sumter
The most numerous immigrant groups reported in East Sumter came from Central America (9 | 1.1%), Guatemala (9 | 1.1%), and Latin America (9 | 1.1%), together accounting for 3.4% of all East Sumter residents.
| Immigration Origin | # Population | % Population |
| Central America | 9 | 1.1% |
| Guatemala | 9 | 1.1% |
| Latin America | 9 | 1.1% | View All 3 Rows |
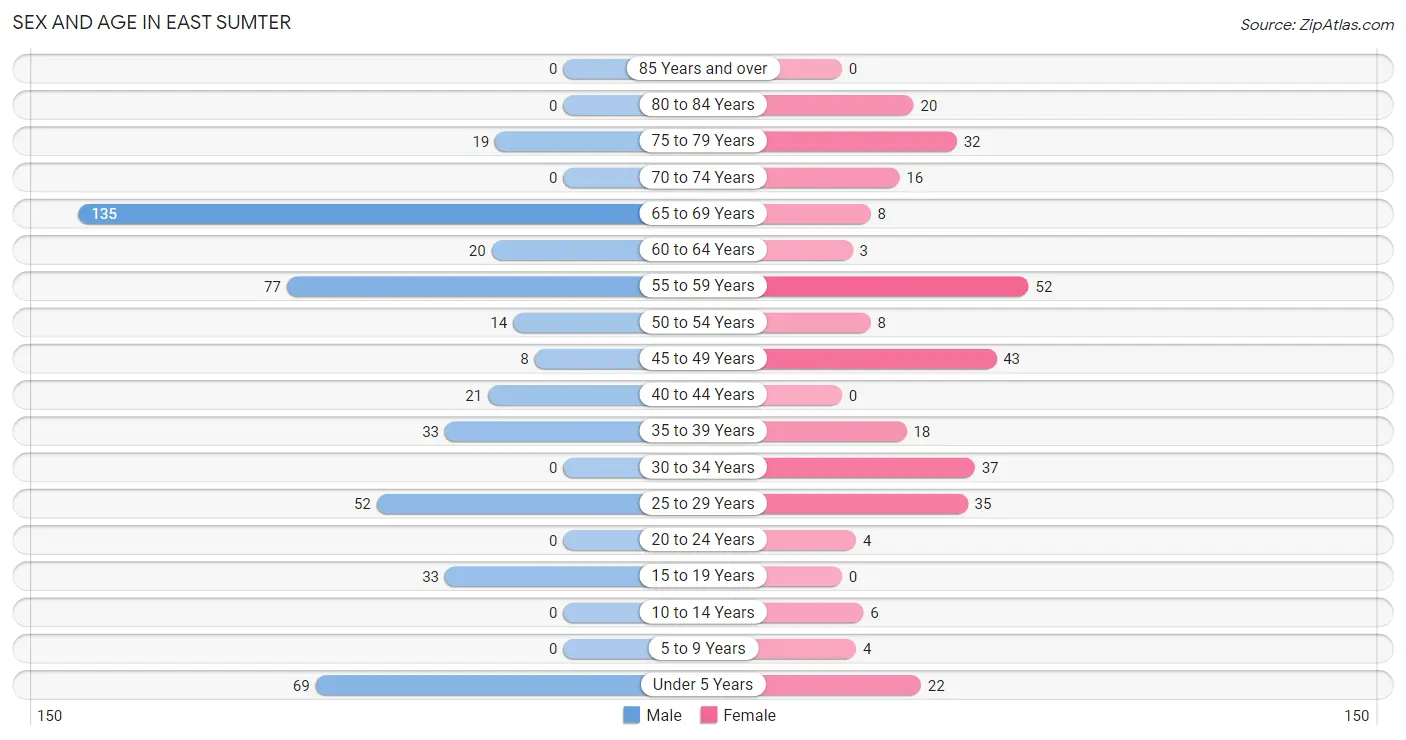
Sex and Age in East Sumter
Sex and Age in East Sumter
The most populous age groups in East Sumter are 65 to 69 Years (135 | 28.1%) for men and 55 to 59 Years (52 | 16.9%) for women.
| Age Bracket | Male | Female |
| Under 5 Years | 69 (14.3%) | 22 (7.1%) |
| 5 to 9 Years | 0 (0.0%) | 4 (1.3%) |
| 10 to 14 Years | 0 (0.0%) | 6 (1.9%) |
| 15 to 19 Years | 33 (6.9%) | 0 (0.0%) |
| 20 to 24 Years | 0 (0.0%) | 4 (1.3%) |
| 25 to 29 Years | 52 (10.8%) | 35 (11.4%) |
| 30 to 34 Years | 0 (0.0%) | 37 (12.0%) |
| 35 to 39 Years | 33 (6.9%) | 18 (5.8%) |
| 40 to 44 Years | 21 (4.4%) | 0 (0.0%) |
| 45 to 49 Years | 8 (1.7%) | 43 (14.0%) |
| 50 to 54 Years | 14 (2.9%) | 8 (2.6%) |
| 55 to 59 Years | 77 (16.0%) | 52 (16.9%) |
| 60 to 64 Years | 20 (4.2%) | 3 (1.0%) |
| 65 to 69 Years | 135 (28.1%) | 8 (2.6%) |
| 70 to 74 Years | 0 (0.0%) | 16 (5.2%) |
| 75 to 79 Years | 19 (4.0%) | 32 (10.4%) |
| 80 to 84 Years | 0 (0.0%) | 20 (6.5%) |
| 85 Years and over | 0 (0.0%) | 0 (0.0%) |
| Total | 481 (100.0%) | 308 (100.0%) |
Families and Households in East Sumter
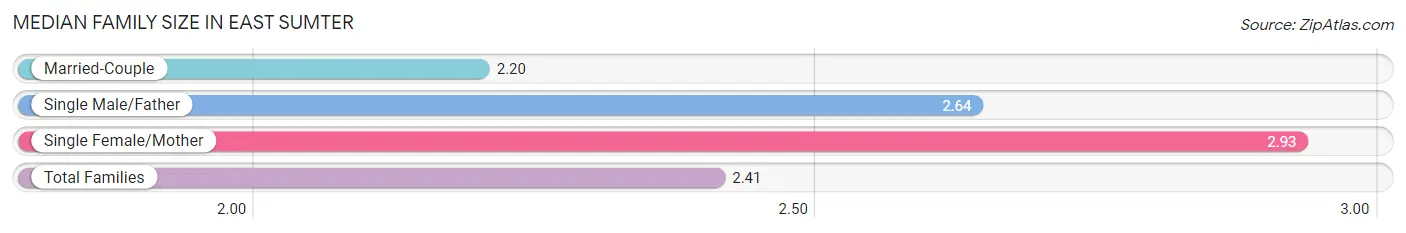
Median Family Size in East Sumter
The median family size in East Sumter is 2.41 persons per family, with single female/mother families (42 | 20.8%) accounting for the largest median family size of 2.93 persons per family. On the other hand, married-couple families (132 | 65.3%) represent the smallest median family size with 2.20 persons per family.
| Family Type | # Families | Family Size |
| Married-Couple | 132 (65.3%) | 2.20 |
| Single Male/Father | 28 (13.9%) | 2.64 |
| Single Female/Mother | 42 (20.8%) | 2.93 |
| Total Families | 202 (100.0%) | 2.41 |
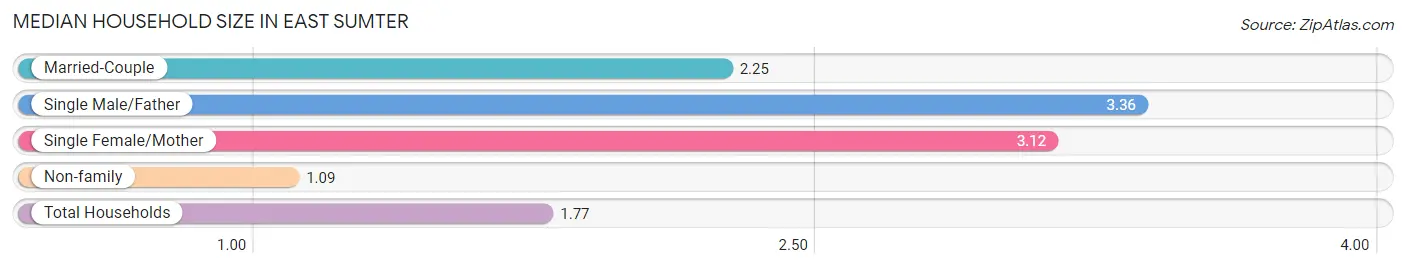
Median Household Size in East Sumter
The median household size in East Sumter is 1.77 persons per household, with single male/father households (28 | 6.3%) accounting for the largest median household size of 3.36 persons per household. non-family households (244 | 54.7%) represent the smallest median household size with 1.09 persons per household.
| Household Type | # Households | Household Size |
| Married-Couple | 132 (29.6%) | 2.25 |
| Single Male/Father | 28 (6.3%) | 3.36 |
| Single Female/Mother | 42 (9.4%) | 3.12 |
| Non-family | 244 (54.7%) | 1.09 |
| Total Households | 446 (100.0%) | 1.77 |
Household Size by Marriage Status in East Sumter
Out of a total of 446 households in East Sumter, 202 (45.3%) are family households, while 244 (54.7%) are nonfamily households. The most numerous type of family households are 2-person households, comprising 97, and the most common type of nonfamily households are 1-person households, comprising 223.
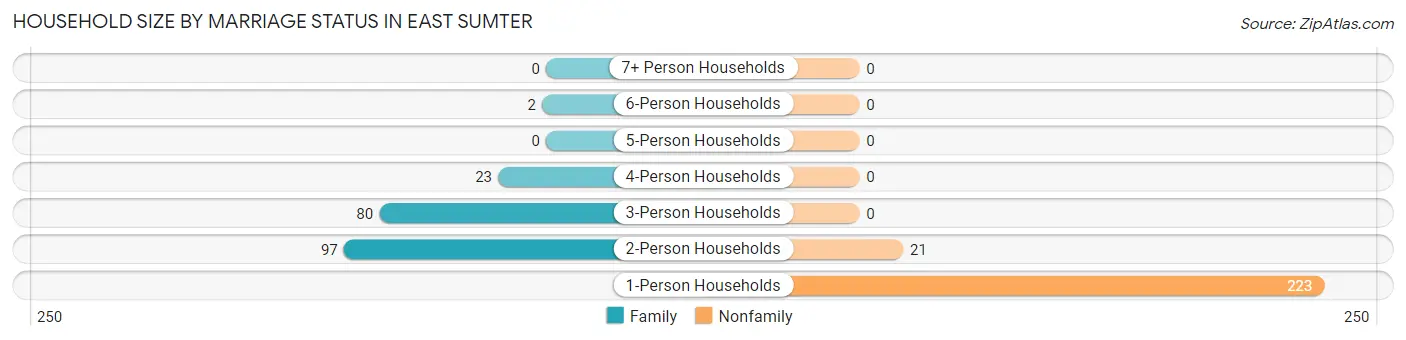
| Household Size | Family Households | Nonfamily Households |
| 1-Person Households | - | 223 (50.0%) |
| 2-Person Households | 97 (21.7%) | 21 (4.7%) |
| 3-Person Households | 80 (17.9%) | 0 (0.0%) |
| 4-Person Households | 23 (5.2%) | 0 (0.0%) |
| 5-Person Households | 0 (0.0%) | 0 (0.0%) |
| 6-Person Households | 2 (0.4%) | 0 (0.0%) |
| 7+ Person Households | 0 (0.0%) | 0 (0.0%) |
| Total | 202 (45.3%) | 244 (54.7%) |
Female Fertility in East Sumter
Fertility by Age in East Sumter
Average fertility rate in East Sumter is 7.0 births per 1,000 women. Women in the age bracket of 20 to 34 years have the highest fertility rate with 13.0 births per 1,000 women. Women in the age bracket of 20 to 34 years acount for 100.0% of all women with births.
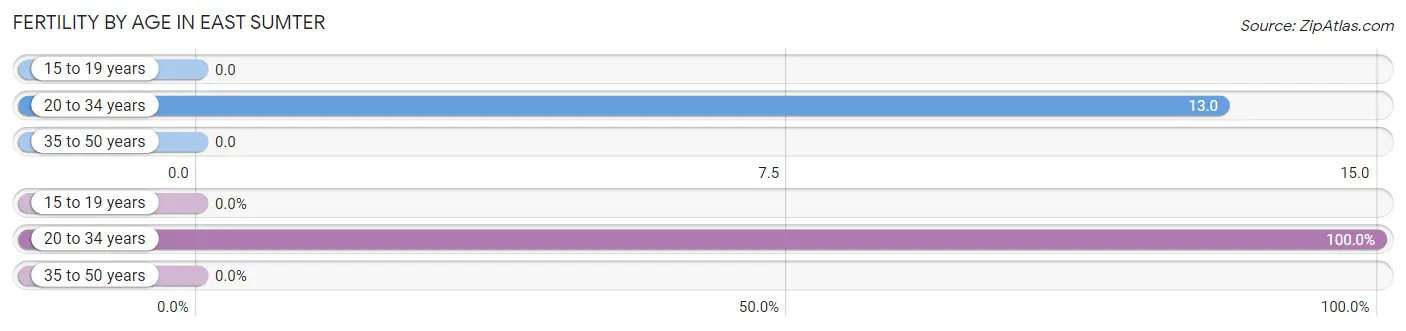
| Age Bracket | Women with Births | Births / 1,000 Women |
| 15 to 19 years | 0 (0.0%) | 0.0 |
| 20 to 34 years | 1 (100.0%) | 13.0 |
| 35 to 50 years | 0 (0.0%) | 0.0 |
| Total | 1 (100.0%) | 7.0 |
Fertility by Age by Marriage Status in East Sumter
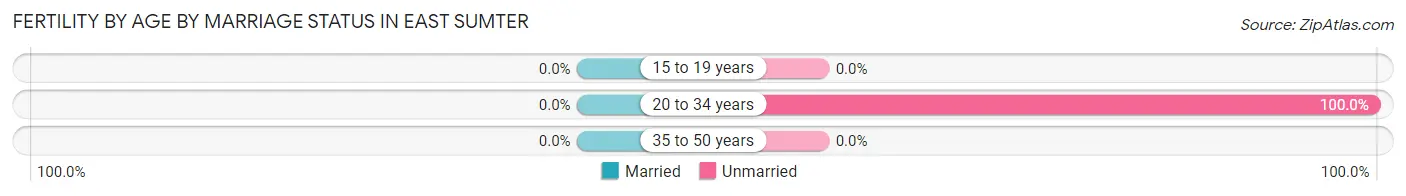
| Age Bracket | Married | Unmarried |
| 15 to 19 years | 0 (0.0%) | 0 (0.0%) |
| 20 to 34 years | 0 (0.0%) | 1 (100.0%) |
| 35 to 50 years | 0 (0.0%) | 0 (0.0%) |
| Total | 0 (0.0%) | 1 (100.0%) |
Fertility by Education in East Sumter
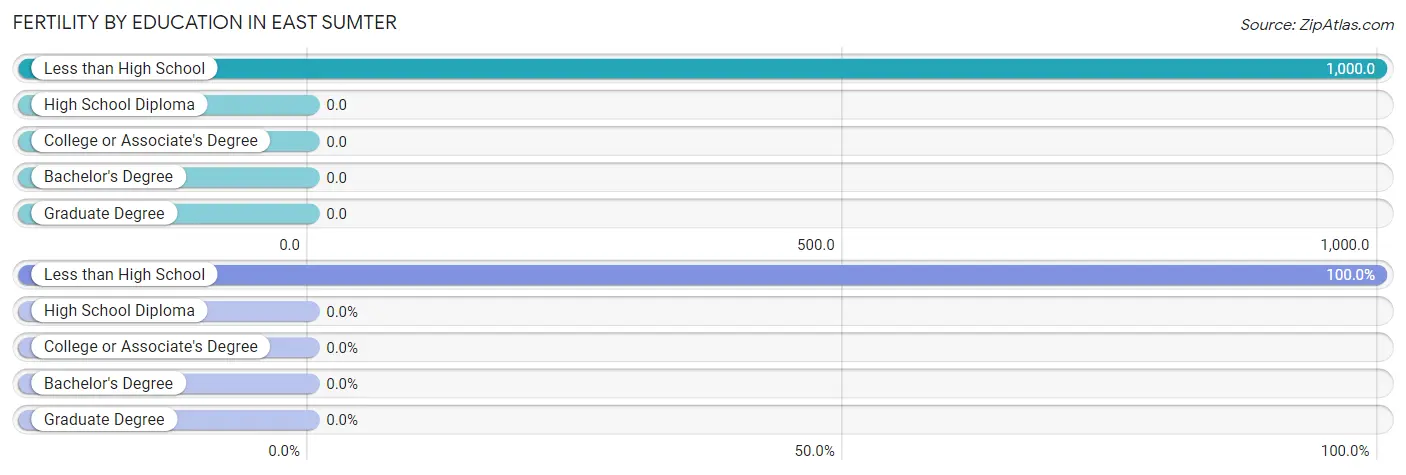
| Educational Attainment | Women with Births | Births / 1,000 Women |
| Less than High School | 1 (100.0%) | 1,000.0 |
| High School Diploma | 0 (0.0%) | 0.0 |
| College or Associate's Degree | 0 (0.0%) | 0.0 |
| Bachelor's Degree | 0 (0.0%) | 0.0 |
| Graduate Degree | 0 (0.0%) | 0.0 |
| Total | 1 (100.0%) | 7.0 |
Fertility by Education by Marriage Status in East Sumter
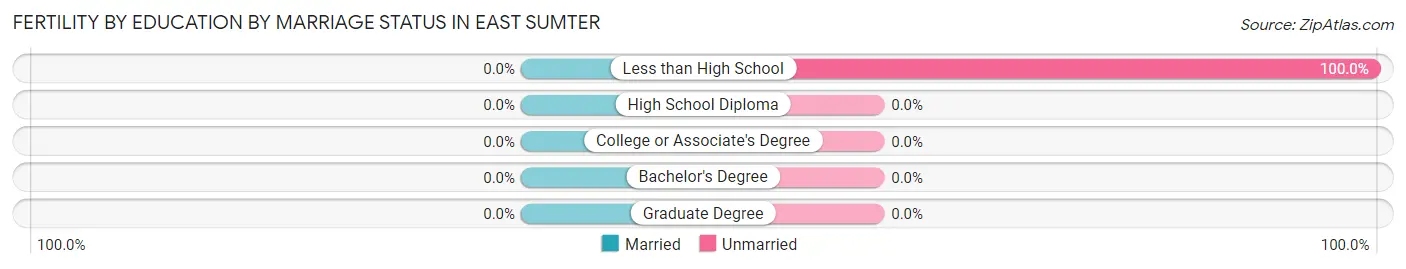
| Educational Attainment | Married | Unmarried |
| Less than High School | 0 (0.0%) | 1 (100.0%) |
| High School Diploma | 0 (0.0%) | 0 (0.0%) |
| College or Associate's Degree | 0 (0.0%) | 0 (0.0%) |
| Bachelor's Degree | 0 (0.0%) | 0 (0.0%) |
| Graduate Degree | 0 (0.0%) | 0 (0.0%) |
| Total | 0 (0.0%) | 1 (100.0%) |
Employment Characteristics in East Sumter
Employment by Class of Employer in East Sumter
Among the 337 employed individuals in East Sumter, private company employees (185 | 54.9%), not-for-profit organizations (62 | 18.4%), and self-employed (not incorporated) (31 | 9.2%) make up the most common classes of employment.
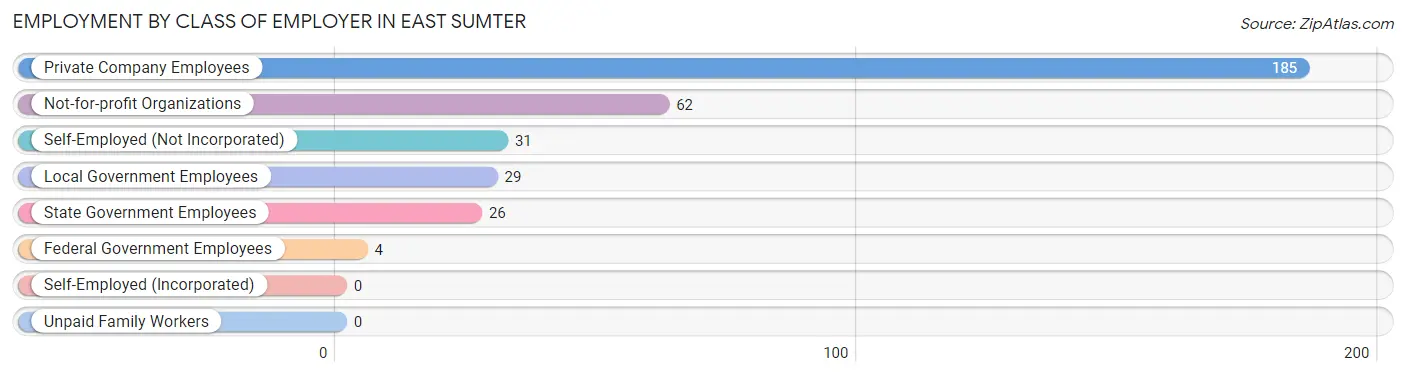
| Employer Class | # Employees | % Employees |
| Private Company Employees | 185 | 54.9% |
| Self-Employed (Incorporated) | 0 | 0.0% |
| Self-Employed (Not Incorporated) | 31 | 9.2% |
| Not-for-profit Organizations | 62 | 18.4% |
| Local Government Employees | 29 | 8.6% |
| State Government Employees | 26 | 7.7% |
| Federal Government Employees | 4 | 1.2% |
| Unpaid Family Workers | 0 | 0.0% |
| Total | 337 | 100.0% |
Employment Status by Age in East Sumter
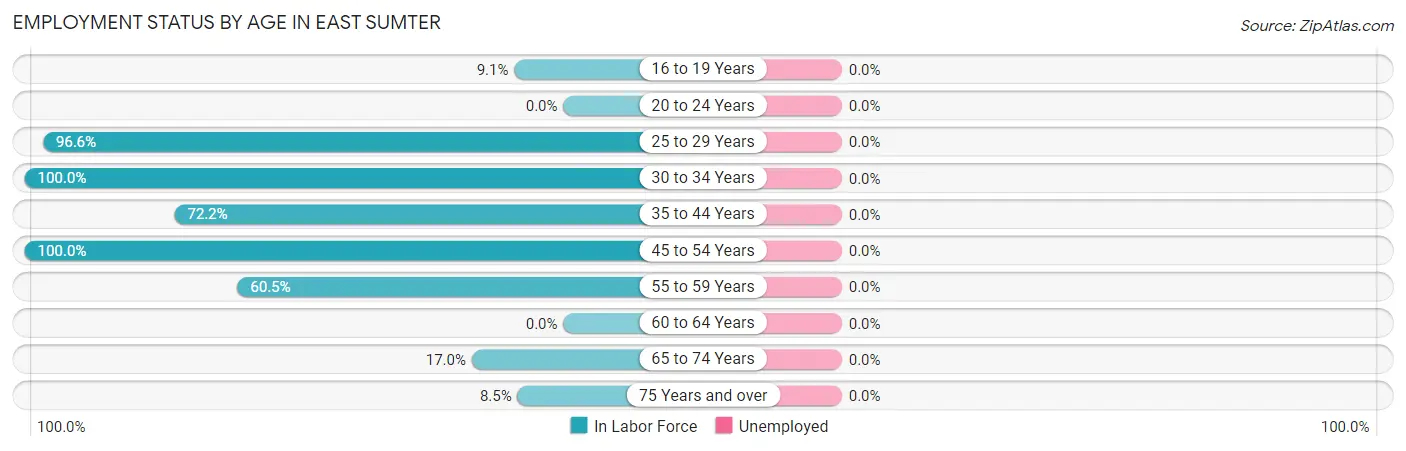
| Age Bracket | In Labor Force | Unemployed |
| 16 to 19 Years | 3 (9.1%) | 0 (0.0%) |
| 20 to 24 Years | 0 (0.0%) | 0 (0.0%) |
| 25 to 29 Years | 84 (96.6%) | 0 (0.0%) |
| 30 to 34 Years | 37 (100.0%) | 0 (0.0%) |
| 35 to 44 Years | 52 (72.2%) | 0 (0.0%) |
| 45 to 54 Years | 73 (100.0%) | 0 (0.0%) |
| 55 to 59 Years | 78 (60.5%) | 0 (0.0%) |
| 60 to 64 Years | 0 (0.0%) | 0 (0.0%) |
| 65 to 74 Years | 27 (17.0%) | 0 (0.0%) |
| 75 Years and over | 6 (8.5%) | 0 (0.0%) |
| Total | 360 (52.3%) | 0 (0.0%) |
Employment Status by Educational Attainment in East Sumter
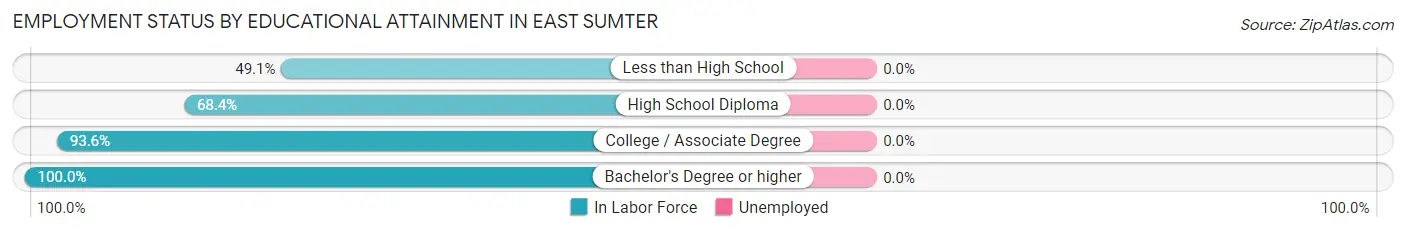
| Educational Attainment | In Labor Force | Unemployed |
| Less than High School | 28 (49.1%) | 0 (0.0%) |
| High School Diploma | 128 (68.4%) | 0 (0.0%) |
| College / Associate Degree | 131 (93.6%) | 0 (0.0%) |
| Bachelor's Degree or higher | 37 (100.0%) | 0 (0.0%) |
| Total | 324 (77.0%) | 0 (0.0%) |
Employment Occupations by Sex in East Sumter
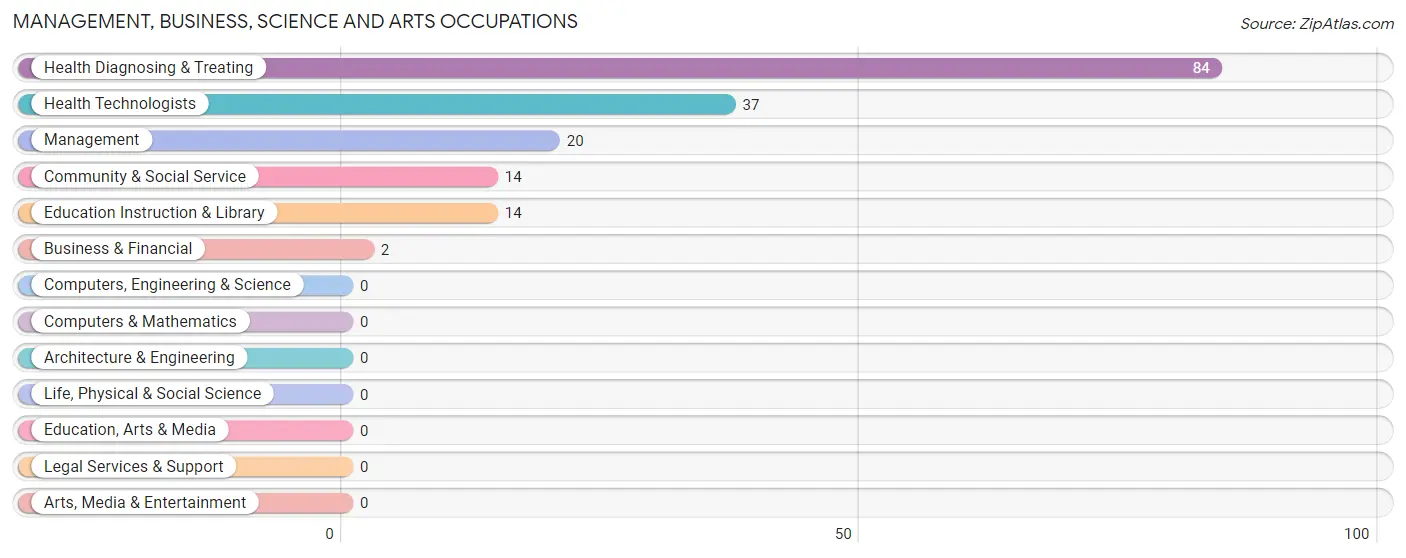
Management, Business, Science and Arts Occupations
The most common Management, Business, Science and Arts occupations in East Sumter are Health Diagnosing & Treating (84 | 23.6%), Health Technologists (37 | 10.4%), Management (20 | 5.6%), Community & Social Service (14 | 3.9%), and Education Instruction & Library (14 | 3.9%).
Management, Business, Science and Arts Occupations by Sex
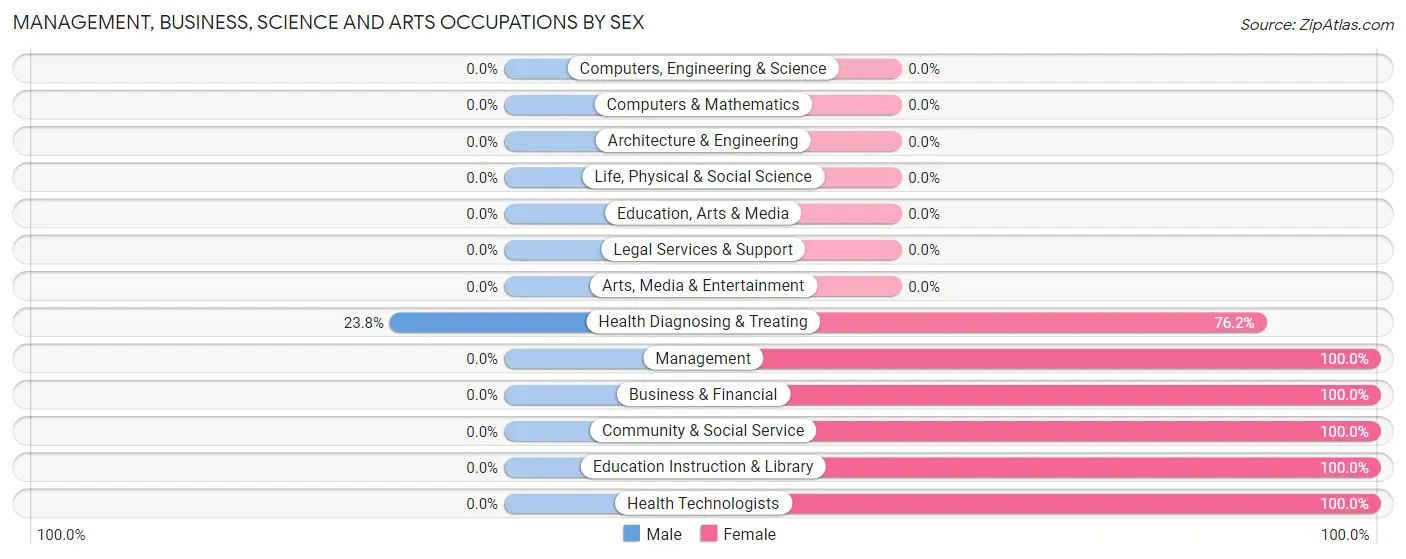
| Occupation | Male | Female |
| Management | 0 (0.0%) | 20 (100.0%) |
| Business & Financial | 0 (0.0%) | 2 (100.0%) |
| Computers, Engineering & Science | 0 (0.0%) | 0 (0.0%) |
| Computers & Mathematics | 0 (0.0%) | 0 (0.0%) |
| Architecture & Engineering | 0 (0.0%) | 0 (0.0%) |
| Life, Physical & Social Science | 0 (0.0%) | 0 (0.0%) |
| Community & Social Service | 0 (0.0%) | 14 (100.0%) |
| Education, Arts & Media | 0 (0.0%) | 0 (0.0%) |
| Legal Services & Support | 0 (0.0%) | 0 (0.0%) |
| Education Instruction & Library | 0 (0.0%) | 14 (100.0%) |
| Arts, Media & Entertainment | 0 (0.0%) | 0 (0.0%) |
| Health Diagnosing & Treating | 20 (23.8%) | 64 (76.2%) |
| Health Technologists | 0 (0.0%) | 37 (100.0%) |
| Total (Category) | 20 (16.7%) | 100 (83.3%) |
| Total (Overall) | 166 (46.6%) | 190 (53.4%) |
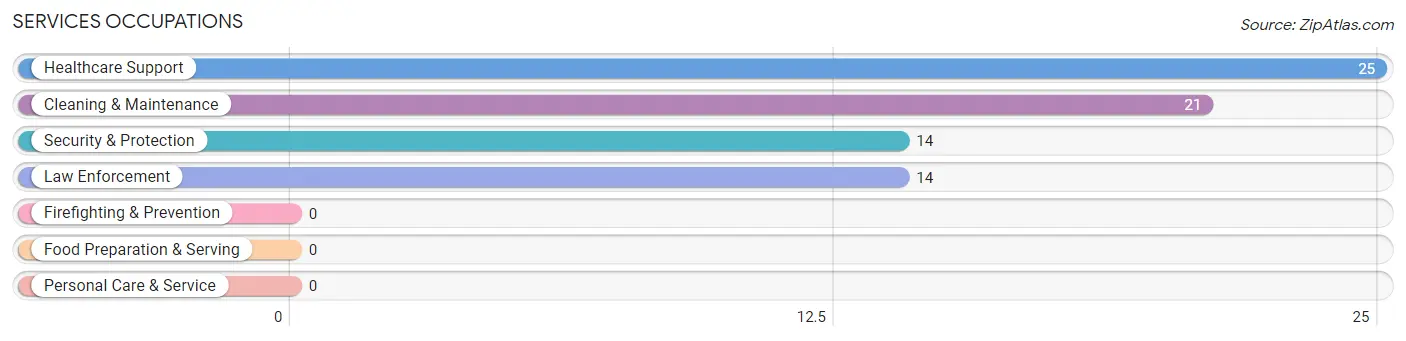
Services Occupations
The most common Services occupations in East Sumter are Healthcare Support (25 | 7.0%), Cleaning & Maintenance (21 | 5.9%), Security & Protection (14 | 3.9%), and Law Enforcement (14 | 3.9%).
Services Occupations by Sex
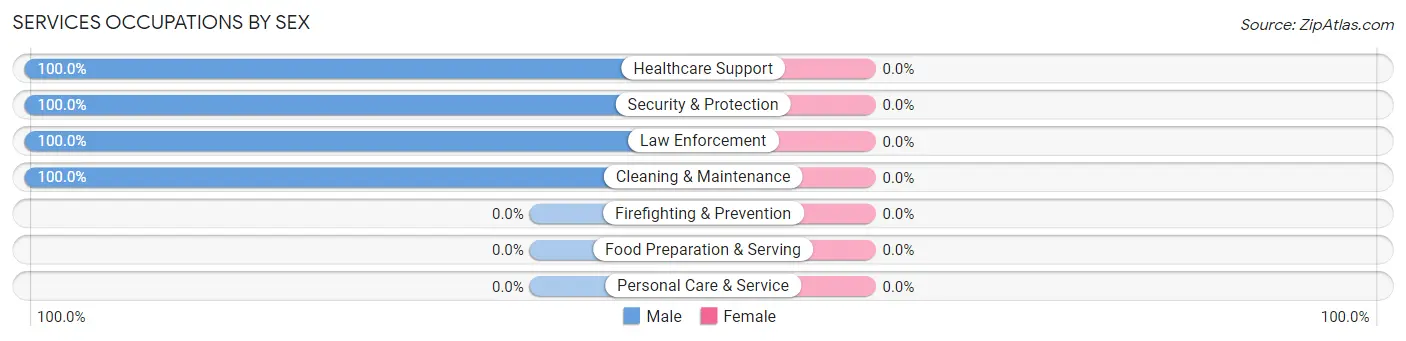
| Occupation | Male | Female |
| Healthcare Support | 25 (100.0%) | 0 (0.0%) |
| Security & Protection | 14 (100.0%) | 0 (0.0%) |
| Firefighting & Prevention | 0 (0.0%) | 0 (0.0%) |
| Law Enforcement | 14 (100.0%) | 0 (0.0%) |
| Food Preparation & Serving | 0 (0.0%) | 0 (0.0%) |
| Cleaning & Maintenance | 21 (100.0%) | 0 (0.0%) |
| Personal Care & Service | 0 (0.0%) | 0 (0.0%) |
| Total (Category) | 60 (100.0%) | 0 (0.0%) |
| Total (Overall) | 166 (46.6%) | 190 (53.4%) |
Sales and Office Occupations
The most common Sales and Office occupations in East Sumter are Office & Administration (48 | 13.5%), and Sales & Related (24 | 6.7%).
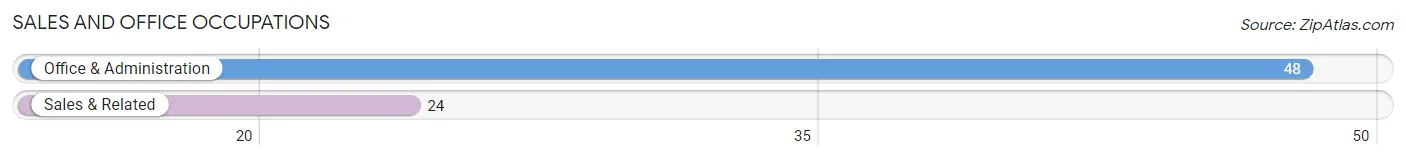
Sales and Office Occupations by Sex
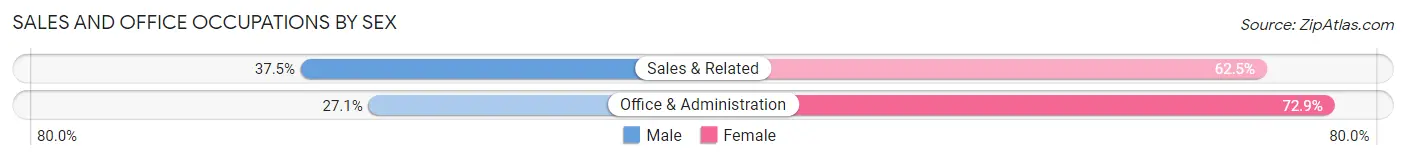
| Occupation | Male | Female |
| Sales & Related | 9 (37.5%) | 15 (62.5%) |
| Office & Administration | 13 (27.1%) | 35 (72.9%) |
| Total (Category) | 22 (30.6%) | 50 (69.4%) |
| Total (Overall) | 166 (46.6%) | 190 (53.4%) |
Natural Resources, Construction and Maintenance Occupations
The most common Natural Resources, Construction and Maintenance occupations in East Sumter are , and Farming, Fishing & Forestry (8 | 2.2%).
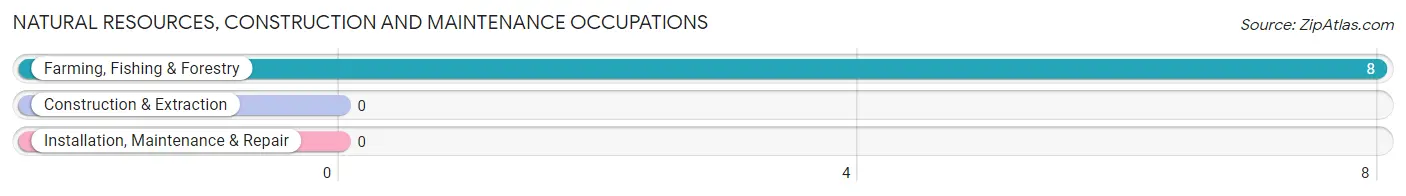
Natural Resources, Construction and Maintenance Occupations by Sex
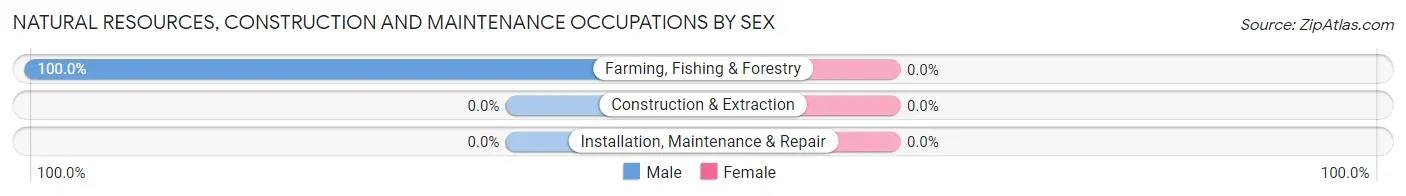
| Occupation | Male | Female |
| Farming, Fishing & Forestry | 8 (100.0%) | 0 (0.0%) |
| Construction & Extraction | 0 (0.0%) | 0 (0.0%) |
| Installation, Maintenance & Repair | 0 (0.0%) | 0 (0.0%) |
| Total (Category) | 8 (100.0%) | 0 (0.0%) |
| Total (Overall) | 166 (46.6%) | 190 (53.4%) |
Production, Transportation and Moving Occupations
The most common Production, Transportation and Moving occupations in East Sumter are Transportation (55 | 15.4%), and Production (41 | 11.5%).
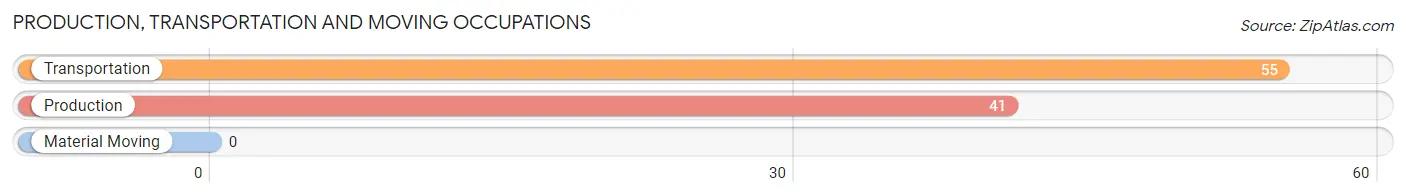
Production, Transportation and Moving Occupations by Sex
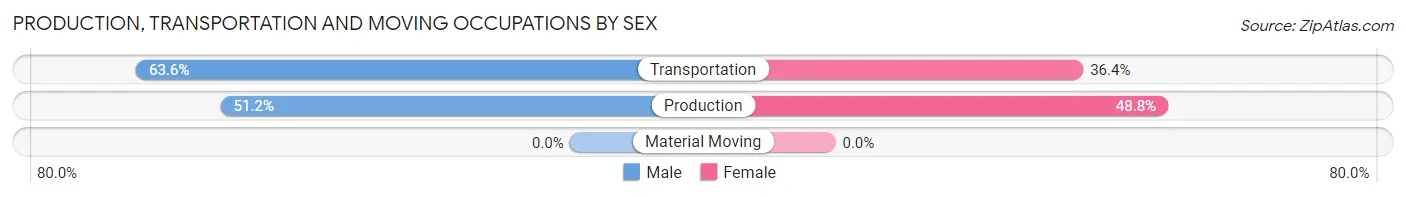
| Occupation | Male | Female |
| Production | 21 (51.2%) | 20 (48.8%) |
| Transportation | 35 (63.6%) | 20 (36.4%) |
| Material Moving | 0 (0.0%) | 0 (0.0%) |
| Total (Category) | 56 (58.3%) | 40 (41.7%) |
| Total (Overall) | 166 (46.6%) | 190 (53.4%) |
Employment Industries by Sex in East Sumter
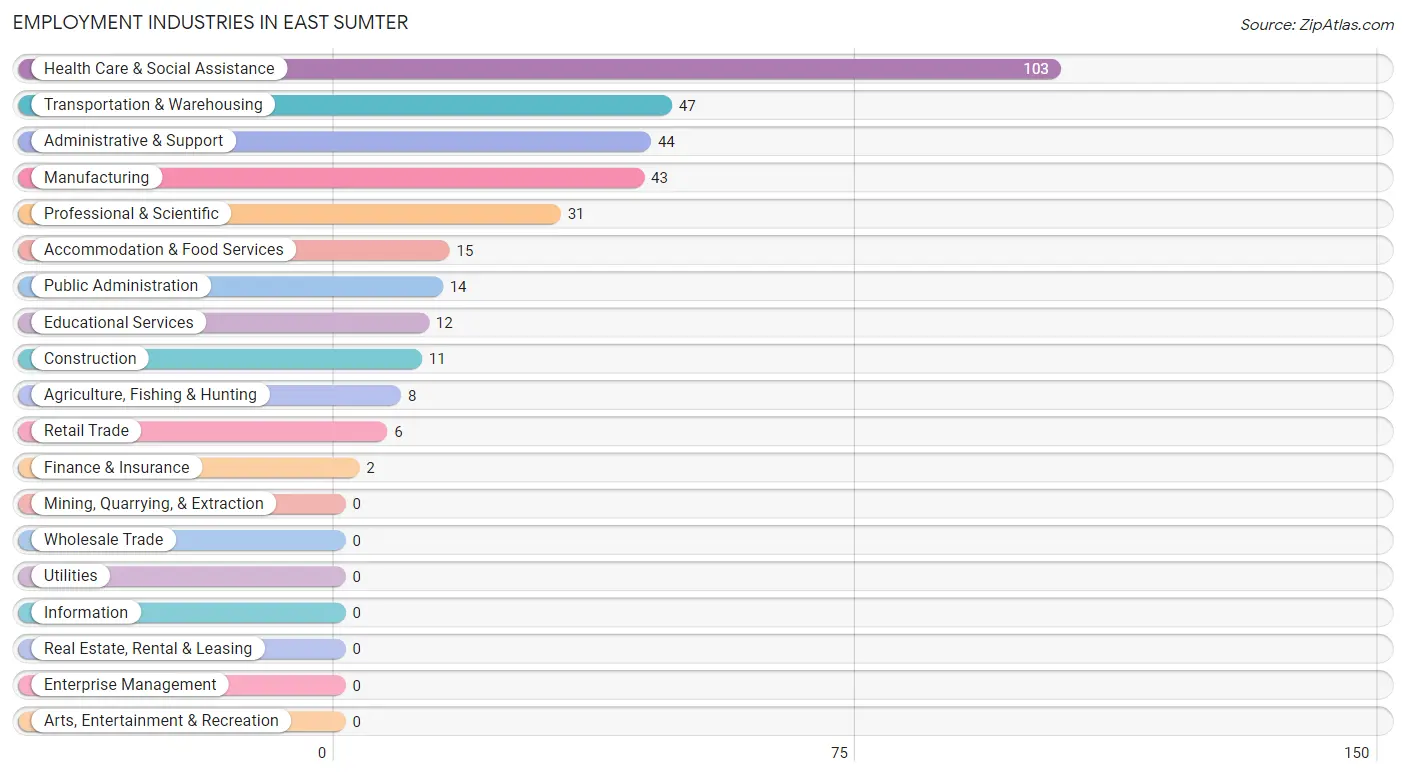
Employment Industries in East Sumter
The major employment industries in East Sumter include Health Care & Social Assistance (103 | 28.9%), Transportation & Warehousing (47 | 13.2%), Administrative & Support (44 | 12.4%), Manufacturing (43 | 12.1%), and Professional & Scientific (31 | 8.7%).
Employment Industries by Sex in East Sumter
The East Sumter industries that see more men than women are Agriculture, Fishing & Hunting (100.0%), Construction (100.0%), and Retail Trade (100.0%), whereas the industries that tend to have a higher number of women are Finance & Insurance (100.0%), Educational Services (100.0%), and Accommodation & Food Services (100.0%).
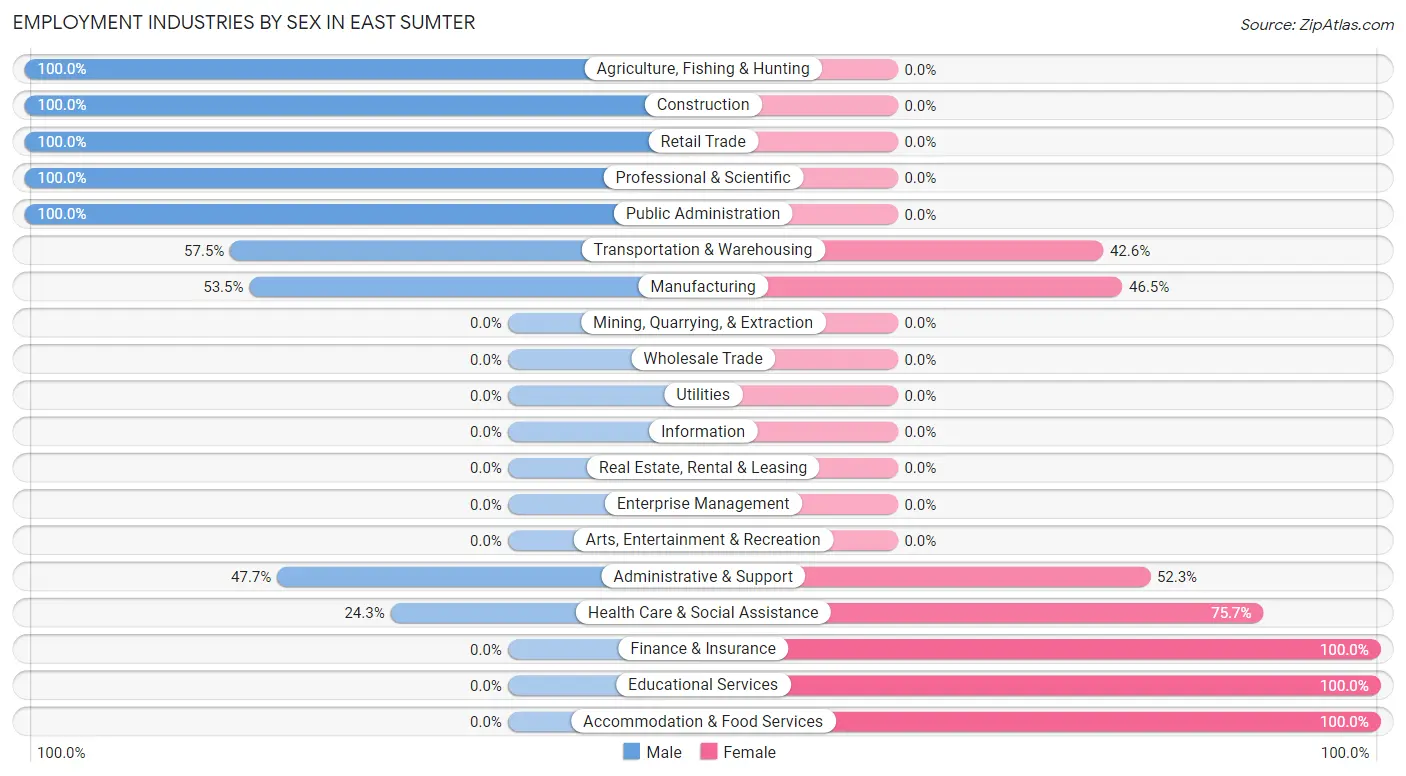
| Industry | Male | Female |
| Agriculture, Fishing & Hunting | 8 (100.0%) | 0 (0.0%) |
| Mining, Quarrying, & Extraction | 0 (0.0%) | 0 (0.0%) |
| Construction | 11 (100.0%) | 0 (0.0%) |
| Manufacturing | 23 (53.5%) | 20 (46.5%) |
| Wholesale Trade | 0 (0.0%) | 0 (0.0%) |
| Retail Trade | 6 (100.0%) | 0 (0.0%) |
| Transportation & Warehousing | 27 (57.5%) | 20 (42.5%) |
| Utilities | 0 (0.0%) | 0 (0.0%) |
| Information | 0 (0.0%) | 0 (0.0%) |
| Finance & Insurance | 0 (0.0%) | 2 (100.0%) |
| Real Estate, Rental & Leasing | 0 (0.0%) | 0 (0.0%) |
| Professional & Scientific | 31 (100.0%) | 0 (0.0%) |
| Enterprise Management | 0 (0.0%) | 0 (0.0%) |
| Administrative & Support | 21 (47.7%) | 23 (52.3%) |
| Educational Services | 0 (0.0%) | 12 (100.0%) |
| Health Care & Social Assistance | 25 (24.3%) | 78 (75.7%) |
| Arts, Entertainment & Recreation | 0 (0.0%) | 0 (0.0%) |
| Accommodation & Food Services | 0 (0.0%) | 15 (100.0%) |
| Public Administration | 14 (100.0%) | 0 (0.0%) |
| Total | 166 (46.6%) | 190 (53.4%) |
Education in East Sumter
School Enrollment in East Sumter
The most common levels of schooling among the 232 students in East Sumter are high school (133 | 57.3%), college / undergraduate (49 | 21.1%), and nursery / preschool (43 | 18.5%).
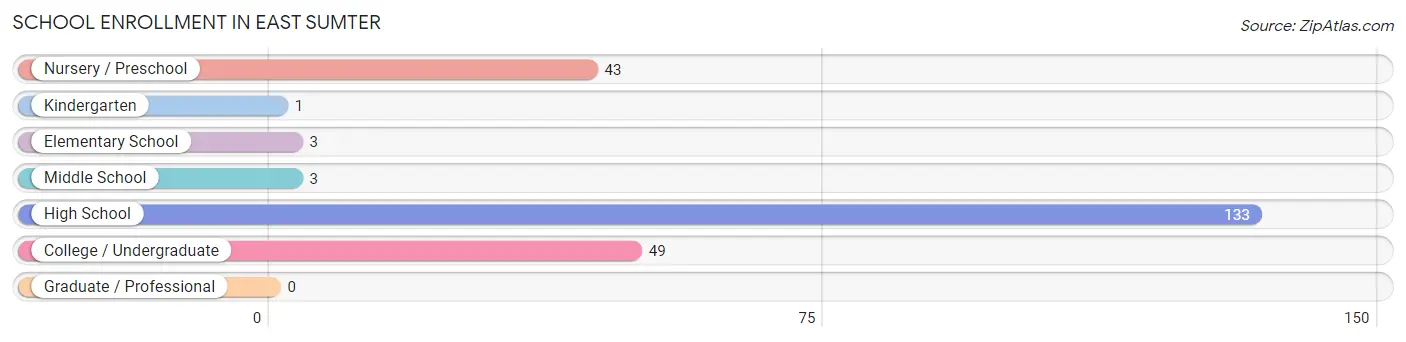
| School Level | # Students | % Students |
| Nursery / Preschool | 43 | 18.5% |
| Kindergarten | 1 | 0.4% |
| Elementary School | 3 | 1.3% |
| Middle School | 3 | 1.3% |
| High School | 133 | 57.3% |
| College / Undergraduate | 49 | 21.1% |
| Graduate / Professional | 0 | 0.0% |
| Total | 232 | 100.0% |
School Enrollment by Age by Funding Source in East Sumter
Out of a total of 232 students who are enrolled in schools in East Sumter, 27 (11.6%) attend a private institution, while the remaining 205 (88.4%) are enrolled in public schools. The age group of 3 to 4 year olds has the highest likelihood of being enrolled in private schools, with 27 (62.8% in the age bracket) enrolled. Conversely, the age group of 5 to 9 year old has the lowest likelihood of being enrolled in a private school, with 4 (100.0% in the age bracket) attending a public institution.
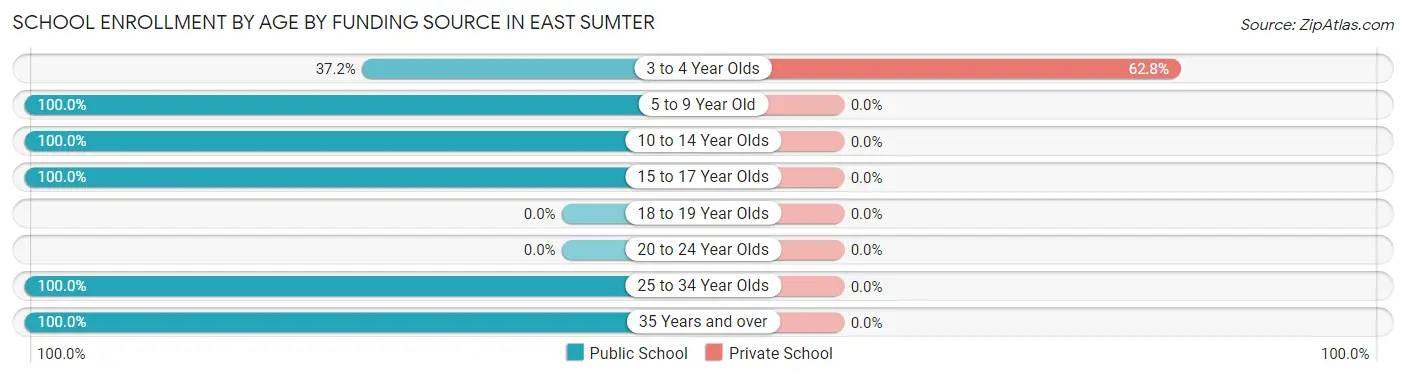
| Age Bracket | Public School | Private School |
| 3 to 4 Year Olds | 16 (37.2%) | 27 (62.8%) |
| 5 to 9 Year Old | 4 (100.0%) | 0 (0.0%) |
| 10 to 14 Year Olds | 6 (100.0%) | 0 (0.0%) |
| 15 to 17 Year Olds | 22 (100.0%) | 0 (0.0%) |
| 18 to 19 Year Olds | 0 (0.0%) | 0 (0.0%) |
| 20 to 24 Year Olds | 0 (0.0%) | 0 (0.0%) |
| 25 to 34 Year Olds | 49 (100.0%) | 0 (0.0%) |
| 35 Years and over | 108 (100.0%) | 0 (0.0%) |
| Total | 205 (88.4%) | 27 (11.6%) |
Educational Attainment by Field of Study in East Sumter
Business (25 | 67.6%), and science & technology (12 | 32.4%) are the most common fields of study among 37 individuals in East Sumter who have obtained a bachelor's degree or higher.
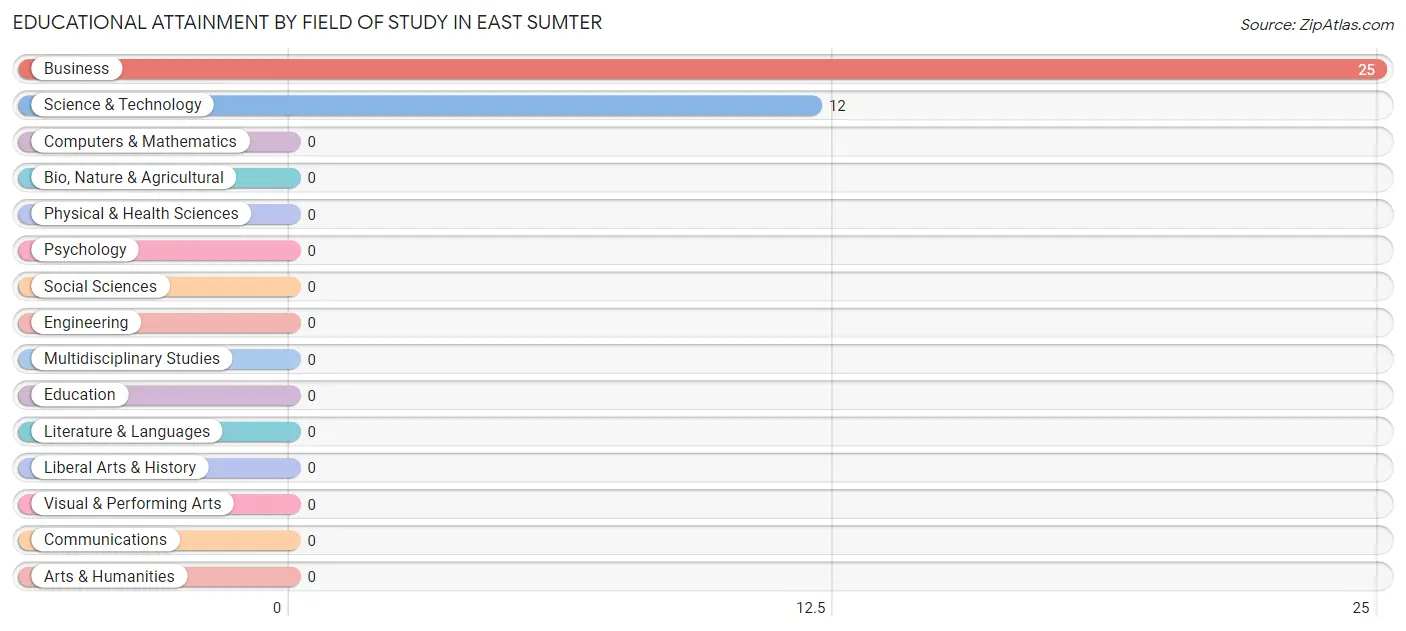
| Field of Study | # Graduates | % Graduates |
| Computers & Mathematics | 0 | 0.0% |
| Bio, Nature & Agricultural | 0 | 0.0% |
| Physical & Health Sciences | 0 | 0.0% |
| Psychology | 0 | 0.0% |
| Social Sciences | 0 | 0.0% |
| Engineering | 0 | 0.0% |
| Multidisciplinary Studies | 0 | 0.0% |
| Science & Technology | 12 | 32.4% |
| Business | 25 | 67.6% |
| Education | 0 | 0.0% |
| Literature & Languages | 0 | 0.0% |
| Liberal Arts & History | 0 | 0.0% |
| Visual & Performing Arts | 0 | 0.0% |
| Communications | 0 | 0.0% |
| Arts & Humanities | 0 | 0.0% |
| Total | 37 | 100.0% |
Transportation & Commute in East Sumter
Vehicle Availability by Sex in East Sumter
The most prevalent vehicle ownership categories in East Sumter are males with 3 vehicles (68, accounting for 40.0%) and females with 3 vehicles (35, making up 40.7%).
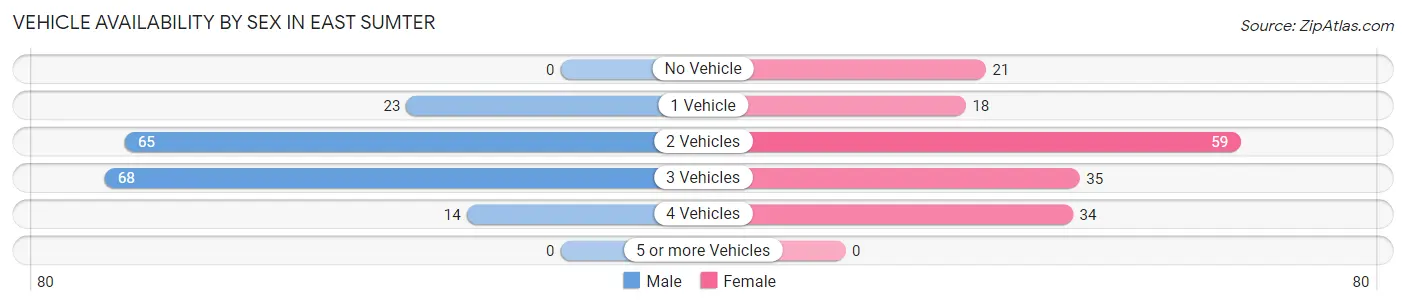
| Vehicles Available | Male | Female |
| No Vehicle | 0 (0.0%) | 21 (12.6%) |
| 1 Vehicle | 23 (13.5%) | 18 (10.8%) |
| 2 Vehicles | 65 (38.2%) | 59 (35.3%) |
| 3 Vehicles | 68 (40.0%) | 35 (21.0%) |
| 4 Vehicles | 14 (8.2%) | 34 (20.4%) |
| 5 or more Vehicles | 0 (0.0%) | 0 (0.0%) |
| Total | 170 (100.0%) | 167 (100.0%) |
Commute Time in East Sumter
The most frequently occuring commute durations in East Sumter are 10 to 14 minutes (109 commuters, 33.1%), 25 to 29 minutes (62 commuters, 18.8%), and 5 to 9 minutes (57 commuters, 17.3%).
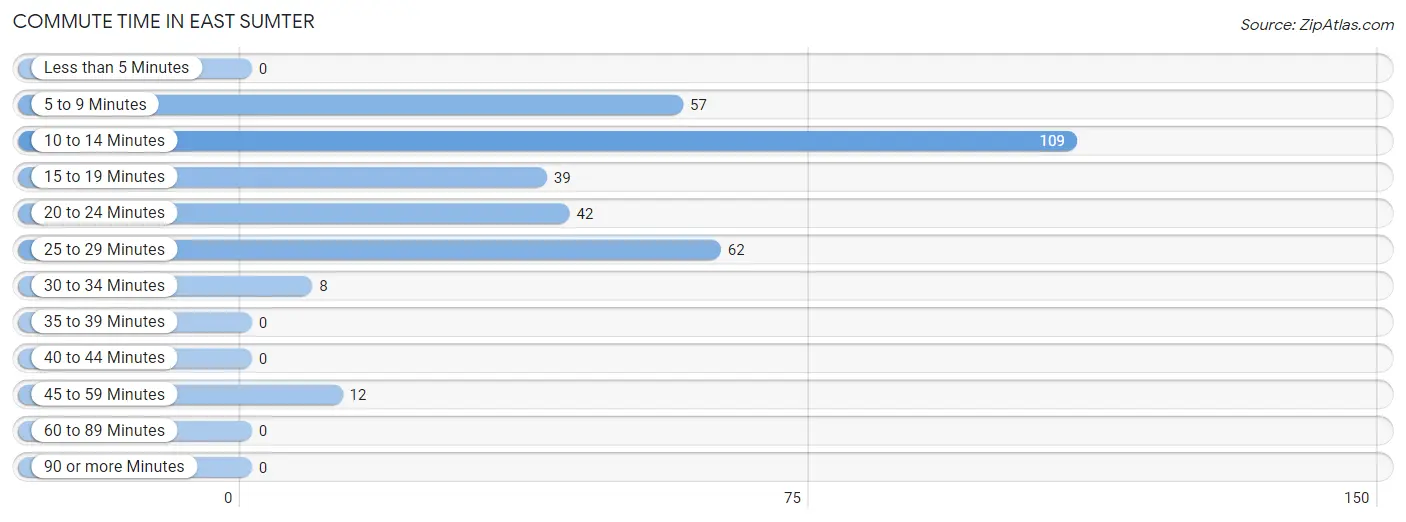
| Commute Time | # Commuters | % Commuters |
| Less than 5 Minutes | 0 | 0.0% |
| 5 to 9 Minutes | 57 | 17.3% |
| 10 to 14 Minutes | 109 | 33.1% |
| 15 to 19 Minutes | 39 | 11.8% |
| 20 to 24 Minutes | 42 | 12.8% |
| 25 to 29 Minutes | 62 | 18.8% |
| 30 to 34 Minutes | 8 | 2.4% |
| 35 to 39 Minutes | 0 | 0.0% |
| 40 to 44 Minutes | 0 | 0.0% |
| 45 to 59 Minutes | 12 | 3.6% |
| 60 to 89 Minutes | 0 | 0.0% |
| 90 or more Minutes | 0 | 0.0% |
Commute Time by Sex in East Sumter
The most common commute times in East Sumter are 5 to 9 minutes (42 commuters, 25.6%) for males and 10 to 14 minutes (84 commuters, 50.9%) for females.
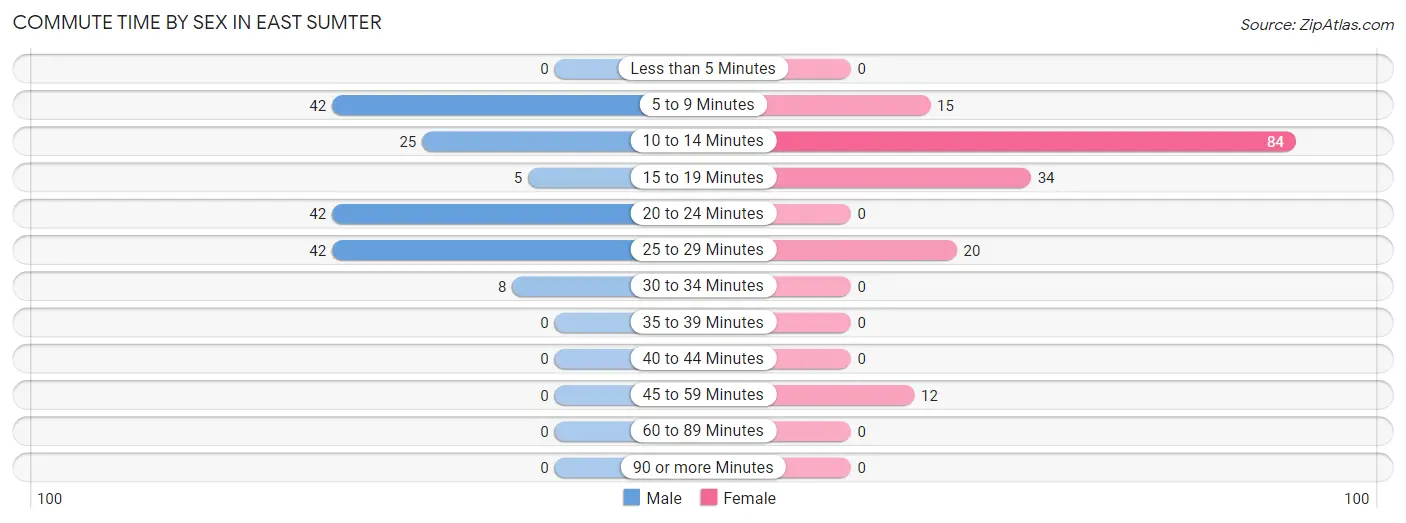
| Commute Time | Male | Female |
| Less than 5 Minutes | 0 (0.0%) | 0 (0.0%) |
| 5 to 9 Minutes | 42 (25.6%) | 15 (9.1%) |
| 10 to 14 Minutes | 25 (15.2%) | 84 (50.9%) |
| 15 to 19 Minutes | 5 (3.0%) | 34 (20.6%) |
| 20 to 24 Minutes | 42 (25.6%) | 0 (0.0%) |
| 25 to 29 Minutes | 42 (25.6%) | 20 (12.1%) |
| 30 to 34 Minutes | 8 (4.9%) | 0 (0.0%) |
| 35 to 39 Minutes | 0 (0.0%) | 0 (0.0%) |
| 40 to 44 Minutes | 0 (0.0%) | 0 (0.0%) |
| 45 to 59 Minutes | 0 (0.0%) | 12 (7.3%) |
| 60 to 89 Minutes | 0 (0.0%) | 0 (0.0%) |
| 90 or more Minutes | 0 (0.0%) | 0 (0.0%) |
Time of Departure to Work by Sex in East Sumter
The most frequent times of departure to work in East Sumter are 4:00 PM to 11:59 PM (52, 31.7%) for males and 4:00 PM to 11:59 PM (37, 22.4%) for females.
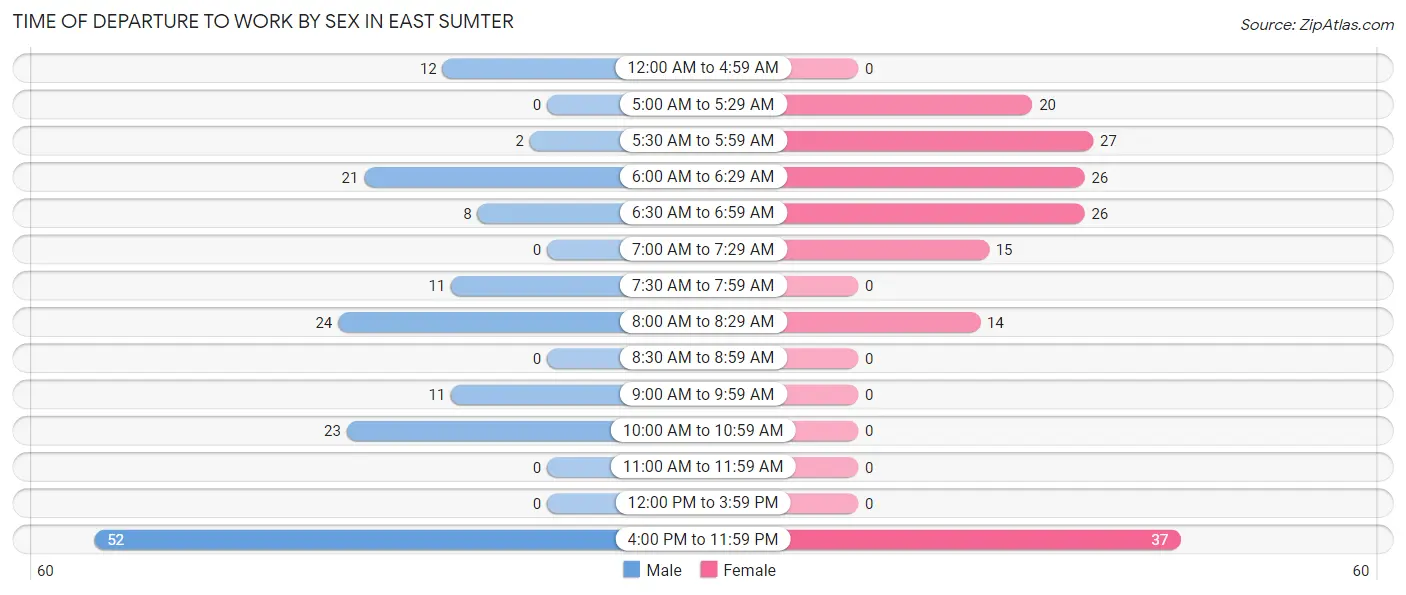
| Time of Departure | Male | Female |
| 12:00 AM to 4:59 AM | 12 (7.3%) | 0 (0.0%) |
| 5:00 AM to 5:29 AM | 0 (0.0%) | 20 (12.1%) |
| 5:30 AM to 5:59 AM | 2 (1.2%) | 27 (16.4%) |
| 6:00 AM to 6:29 AM | 21 (12.8%) | 26 (15.8%) |
| 6:30 AM to 6:59 AM | 8 (4.9%) | 26 (15.8%) |
| 7:00 AM to 7:29 AM | 0 (0.0%) | 15 (9.1%) |
| 7:30 AM to 7:59 AM | 11 (6.7%) | 0 (0.0%) |
| 8:00 AM to 8:29 AM | 24 (14.6%) | 14 (8.5%) |
| 8:30 AM to 8:59 AM | 0 (0.0%) | 0 (0.0%) |
| 9:00 AM to 9:59 AM | 11 (6.7%) | 0 (0.0%) |
| 10:00 AM to 10:59 AM | 23 (14.0%) | 0 (0.0%) |
| 11:00 AM to 11:59 AM | 0 (0.0%) | 0 (0.0%) |
| 12:00 PM to 3:59 PM | 0 (0.0%) | 0 (0.0%) |
| 4:00 PM to 11:59 PM | 52 (31.7%) | 37 (22.4%) |
| Total | 164 (100.0%) | 165 (100.0%) |
Housing Occupancy in East Sumter
Occupancy by Ownership in East Sumter
Of the total 446 dwellings in East Sumter, owner-occupied units account for 381 (85.4%), while renter-occupied units make up 65 (14.6%).
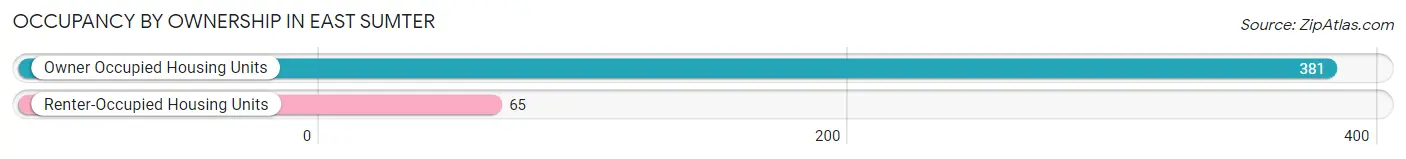
| Occupancy | # Housing Units | % Housing Units |
| Owner Occupied Housing Units | 381 | 85.4% |
| Renter-Occupied Housing Units | 65 | 14.6% |
| Total Occupied Housing Units | 446 | 100.0% |
Occupancy by Household Size in East Sumter
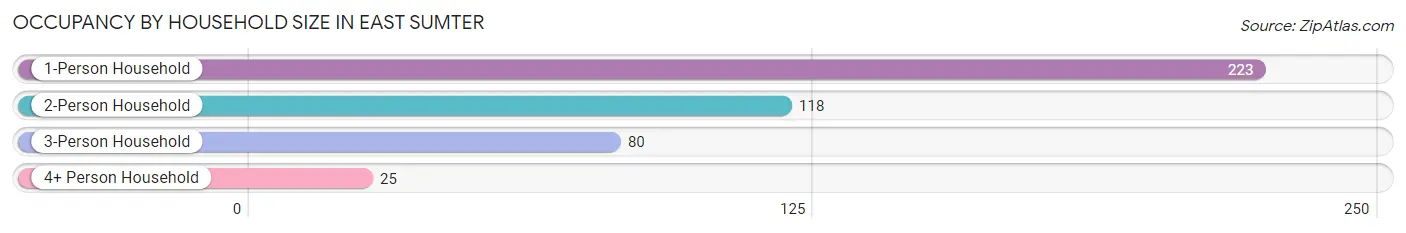
| Household Size | # Housing Units | % Housing Units |
| 1-Person Household | 223 | 50.0% |
| 2-Person Household | 118 | 26.5% |
| 3-Person Household | 80 | 17.9% |
| 4+ Person Household | 25 | 5.6% |
| Total Housing Units | 446 | 100.0% |
Occupancy by Ownership by Household Size in East Sumter
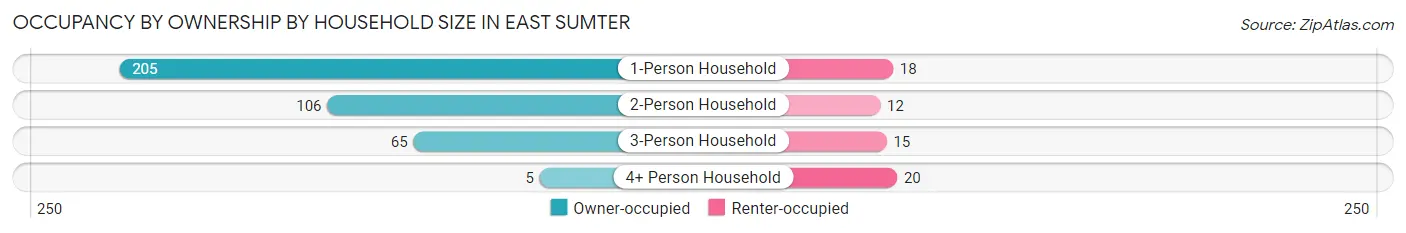
| Household Size | Owner-occupied | Renter-occupied |
| 1-Person Household | 205 (91.9%) | 18 (8.1%) |
| 2-Person Household | 106 (89.8%) | 12 (10.2%) |
| 3-Person Household | 65 (81.2%) | 15 (18.8%) |
| 4+ Person Household | 5 (20.0%) | 20 (80.0%) |
| Total Housing Units | 381 (85.4%) | 65 (14.6%) |
Occupancy by Educational Attainment in East Sumter
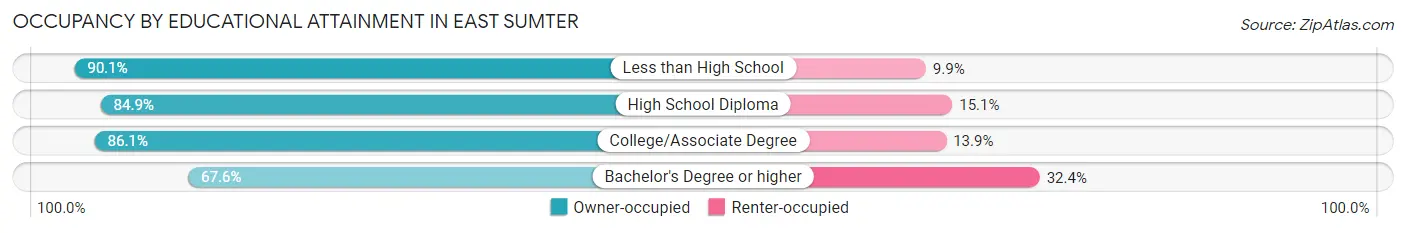
| Household Size | Owner-occupied | Renter-occupied |
| Less than High School | 128 (90.1%) | 14 (9.9%) |
| High School Diploma | 135 (84.9%) | 24 (15.1%) |
| College/Associate Degree | 93 (86.1%) | 15 (13.9%) |
| Bachelor's Degree or higher | 25 (67.6%) | 12 (32.4%) |
Occupancy by Age of Householder in East Sumter
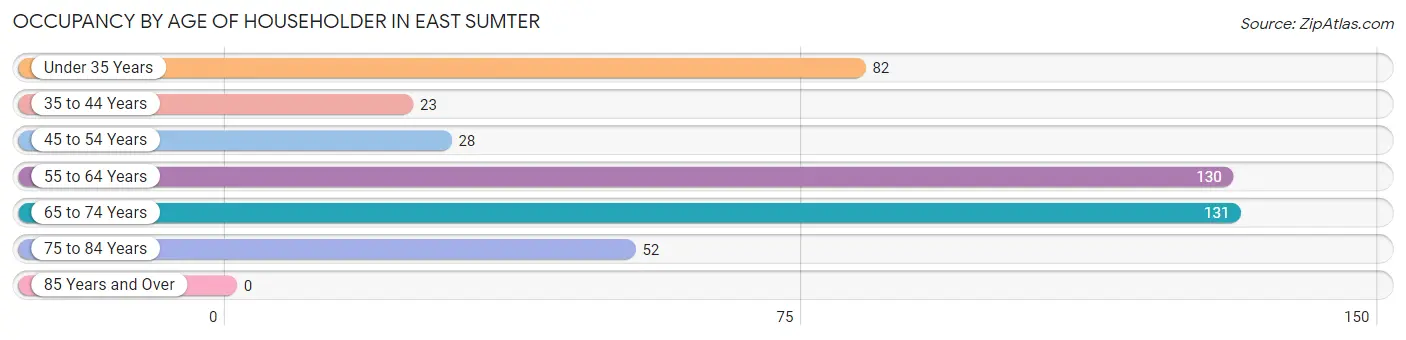
| Age Bracket | # Households | % Households |
| Under 35 Years | 82 | 18.4% |
| 35 to 44 Years | 23 | 5.2% |
| 45 to 54 Years | 28 | 6.3% |
| 55 to 64 Years | 130 | 29.1% |
| 65 to 74 Years | 131 | 29.4% |
| 75 to 84 Years | 52 | 11.7% |
| 85 Years and Over | 0 | 0.0% |
| Total | 446 | 100.0% |
Housing Finances in East Sumter
Median Income by Occupancy in East Sumter
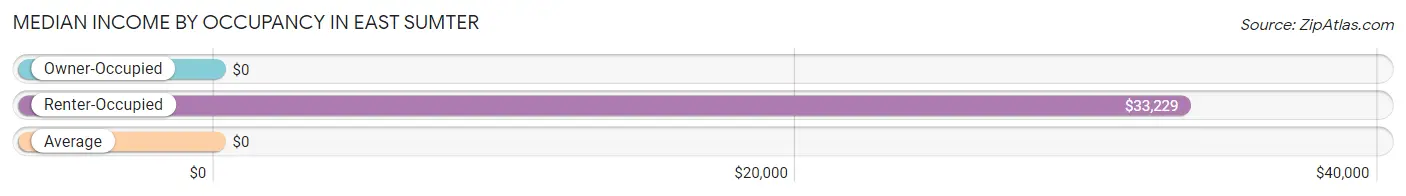
| Occupancy Type | # Households | Median Income |
| Owner-Occupied | 381 (85.4%) | $0 |
| Renter-Occupied | 65 (14.6%) | $33,229 |
| Average | 446 (100.0%) | $0 |
Occupancy by Householder Income Bracket in East Sumter
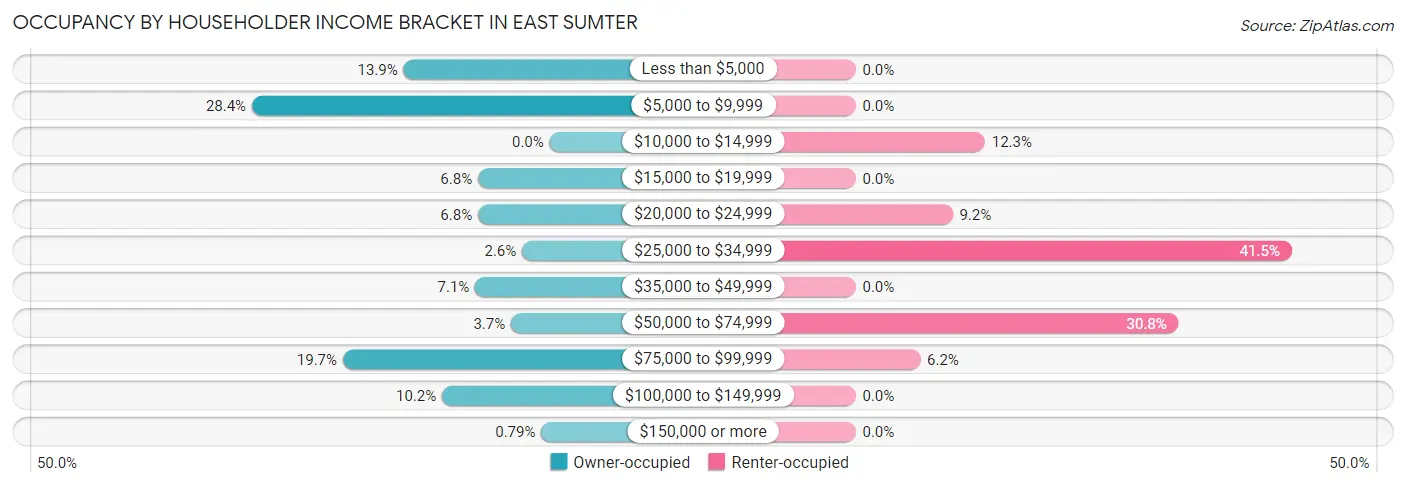
| Income Bracket | Owner-occupied | Renter-occupied |
| Less than $5,000 | 53 (13.9%) | 0 (0.0%) |
| $5,000 to $9,999 | 108 (28.3%) | 0 (0.0%) |
| $10,000 to $14,999 | 0 (0.0%) | 8 (12.3%) |
| $15,000 to $19,999 | 26 (6.8%) | 0 (0.0%) |
| $20,000 to $24,999 | 26 (6.8%) | 6 (9.2%) |
| $25,000 to $34,999 | 10 (2.6%) | 27 (41.5%) |
| $35,000 to $49,999 | 27 (7.1%) | 0 (0.0%) |
| $50,000 to $74,999 | 14 (3.7%) | 20 (30.8%) |
| $75,000 to $99,999 | 75 (19.7%) | 4 (6.1%) |
| $100,000 to $149,999 | 39 (10.2%) | 0 (0.0%) |
| $150,000 or more | 3 (0.8%) | 0 (0.0%) |
| Total | 381 (100.0%) | 65 (100.0%) |
Monthly Housing Cost Tiers in East Sumter
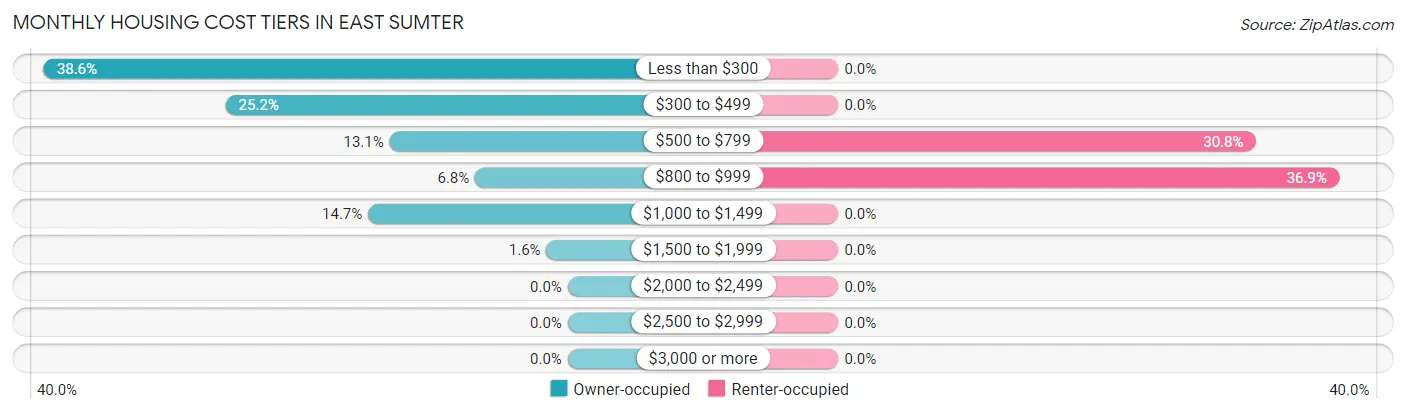
| Monthly Cost | Owner-occupied | Renter-occupied |
| Less than $300 | 147 (38.6%) | 0 (0.0%) |
| $300 to $499 | 96 (25.2%) | 0 (0.0%) |
| $500 to $799 | 50 (13.1%) | 20 (30.8%) |
| $800 to $999 | 26 (6.8%) | 24 (36.9%) |
| $1,000 to $1,499 | 56 (14.7%) | 0 (0.0%) |
| $1,500 to $1,999 | 6 (1.6%) | 0 (0.0%) |
| $2,000 to $2,499 | 0 (0.0%) | 0 (0.0%) |
| $2,500 to $2,999 | 0 (0.0%) | 0 (0.0%) |
| $3,000 or more | 0 (0.0%) | 0 (0.0%) |
| Total | 381 (100.0%) | 65 (100.0%) |
Physical Housing Characteristics in East Sumter
Housing Structures in East Sumter
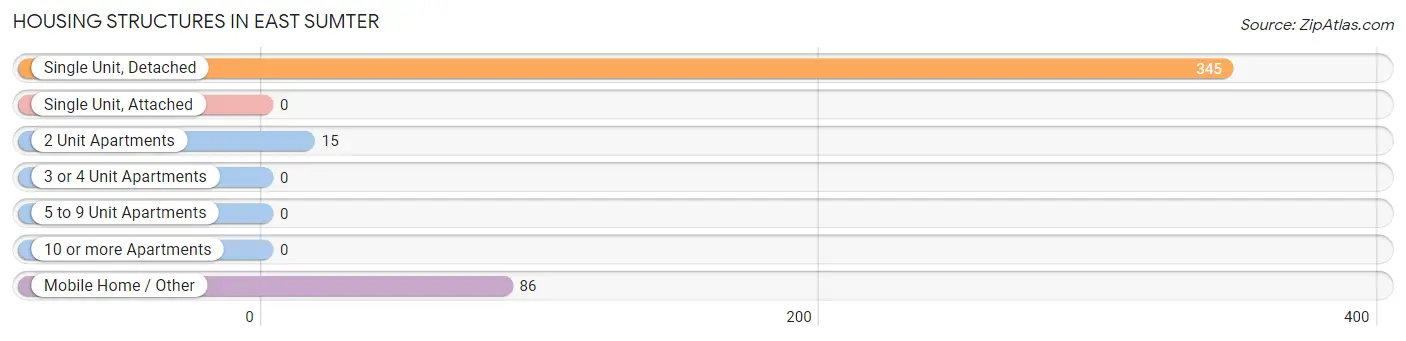
| Structure Type | # Housing Units | % Housing Units |
| Single Unit, Detached | 345 | 77.3% |
| Single Unit, Attached | 0 | 0.0% |
| 2 Unit Apartments | 15 | 3.4% |
| 3 or 4 Unit Apartments | 0 | 0.0% |
| 5 to 9 Unit Apartments | 0 | 0.0% |
| 10 or more Apartments | 0 | 0.0% |
| Mobile Home / Other | 86 | 19.3% |
| Total | 446 | 100.0% |
Housing Structures by Occupancy in East Sumter
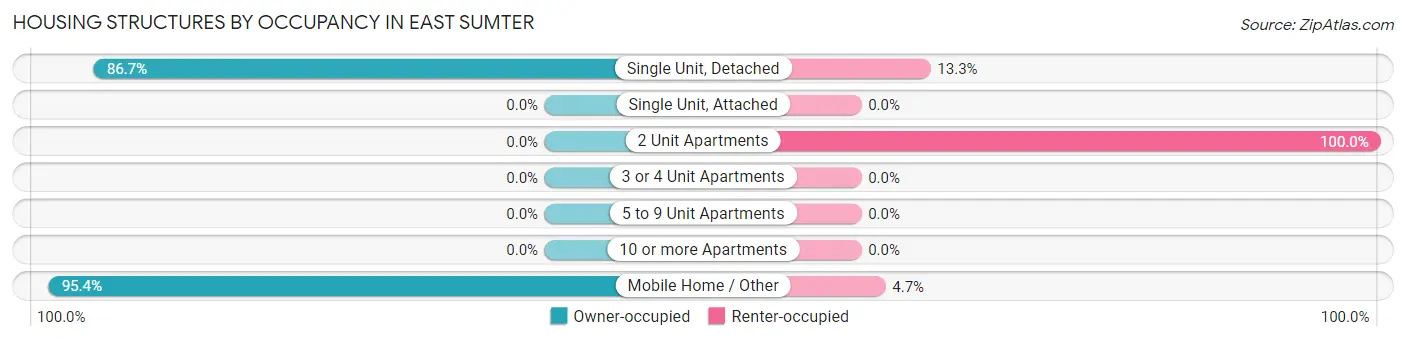
| Structure Type | Owner-occupied | Renter-occupied |
| Single Unit, Detached | 299 (86.7%) | 46 (13.3%) |
| Single Unit, Attached | 0 (0.0%) | 0 (0.0%) |
| 2 Unit Apartments | 0 (0.0%) | 15 (100.0%) |
| 3 or 4 Unit Apartments | 0 (0.0%) | 0 (0.0%) |
| 5 to 9 Unit Apartments | 0 (0.0%) | 0 (0.0%) |
| 10 or more Apartments | 0 (0.0%) | 0 (0.0%) |
| Mobile Home / Other | 82 (95.4%) | 4 (4.6%) |
| Total | 381 (85.4%) | 65 (14.6%) |
Housing Structures by Number of Rooms in East Sumter
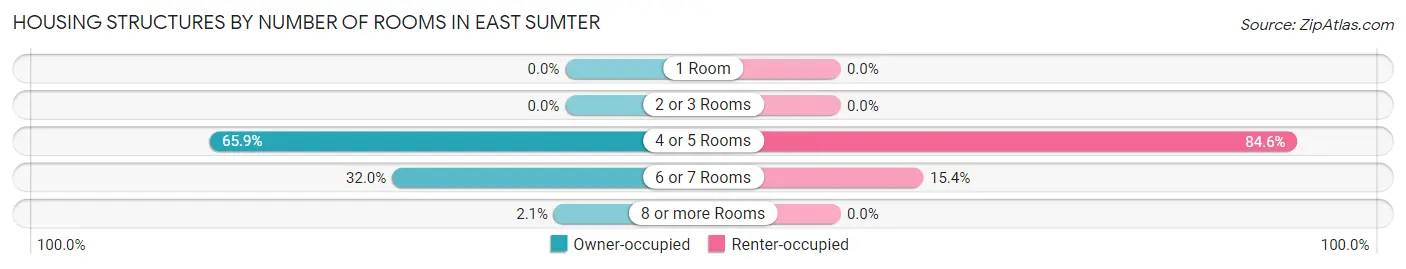
| Number of Rooms | Owner-occupied | Renter-occupied |
| 1 Room | 0 (0.0%) | 0 (0.0%) |
| 2 or 3 Rooms | 0 (0.0%) | 0 (0.0%) |
| 4 or 5 Rooms | 251 (65.9%) | 55 (84.6%) |
| 6 or 7 Rooms | 122 (32.0%) | 10 (15.4%) |
| 8 or more Rooms | 8 (2.1%) | 0 (0.0%) |
| Total | 381 (100.0%) | 65 (100.0%) |
Housing Structure by Heating Type in East Sumter
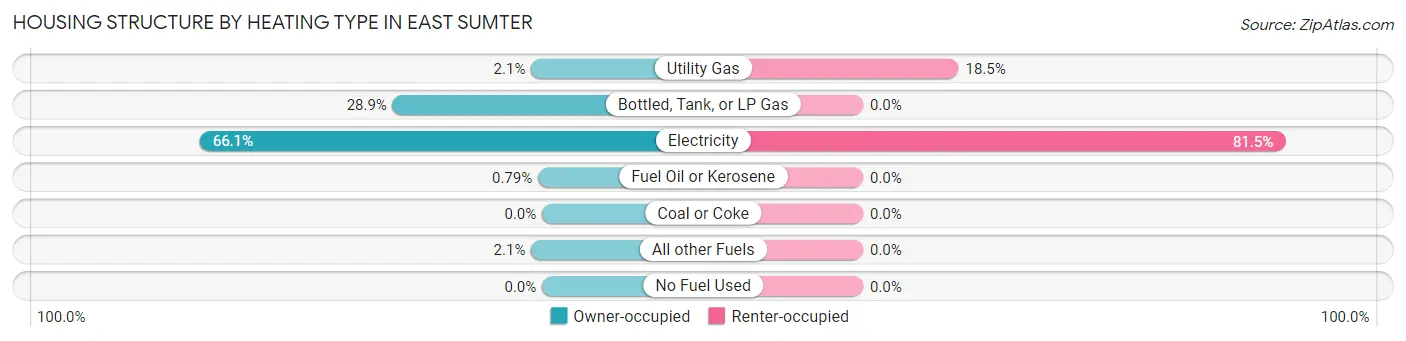
| Heating Type | Owner-occupied | Renter-occupied |
| Utility Gas | 8 (2.1%) | 12 (18.5%) |
| Bottled, Tank, or LP Gas | 110 (28.9%) | 0 (0.0%) |
| Electricity | 252 (66.1%) | 53 (81.5%) |
| Fuel Oil or Kerosene | 3 (0.8%) | 0 (0.0%) |
| Coal or Coke | 0 (0.0%) | 0 (0.0%) |
| All other Fuels | 8 (2.1%) | 0 (0.0%) |
| No Fuel Used | 0 (0.0%) | 0 (0.0%) |
| Total | 381 (100.0%) | 65 (100.0%) |
Household Vehicle Usage in East Sumter
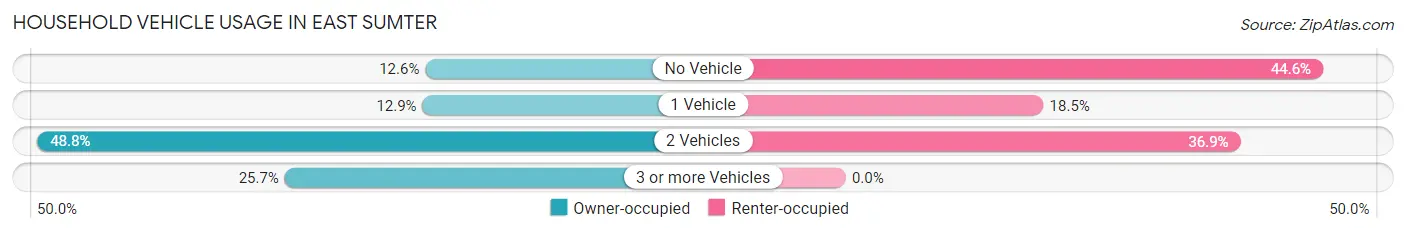
| Vehicles per Household | Owner-occupied | Renter-occupied |
| No Vehicle | 48 (12.6%) | 29 (44.6%) |
| 1 Vehicle | 49 (12.9%) | 12 (18.5%) |
| 2 Vehicles | 186 (48.8%) | 24 (36.9%) |
| 3 or more Vehicles | 98 (25.7%) | 0 (0.0%) |
| Total | 381 (100.0%) | 65 (100.0%) |
Real Estate & Mortgages in East Sumter
Real Estate and Mortgage Overview in East Sumter
| Characteristic | Without Mortgage | With Mortgage |
| Housing Units | 269 | 112 |
| Median Property Value | $27,600 | $97,600 |
| Median Household Income | - | - |
| Monthly Housing Costs | $220 | $0 |
| Real Estate Taxes | $199 | $14 |
Property Value by Mortgage Status in East Sumter
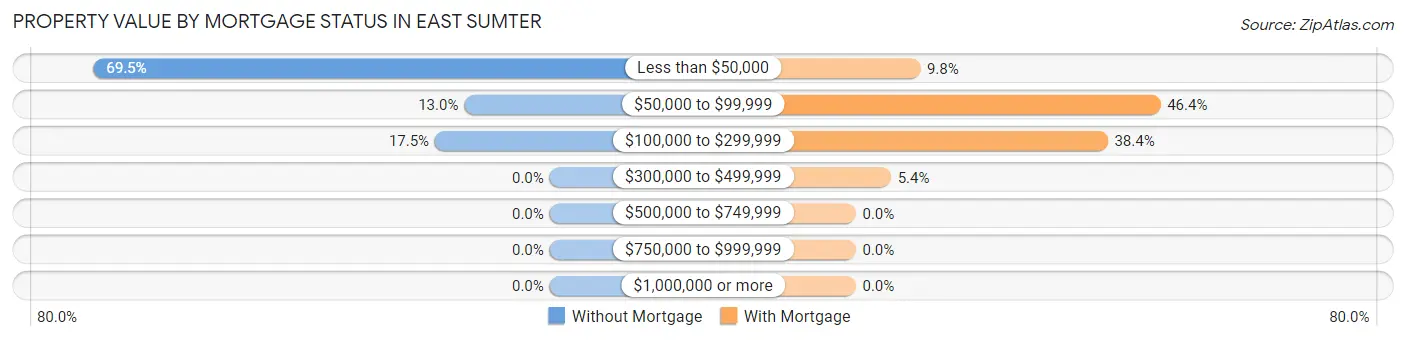
| Property Value | Without Mortgage | With Mortgage |
| Less than $50,000 | 187 (69.5%) | 11 (9.8%) |
| $50,000 to $99,999 | 35 (13.0%) | 52 (46.4%) |
| $100,000 to $299,999 | 47 (17.5%) | 43 (38.4%) |
| $300,000 to $499,999 | 0 (0.0%) | 6 (5.4%) |
| $500,000 to $749,999 | 0 (0.0%) | 0 (0.0%) |
| $750,000 to $999,999 | 0 (0.0%) | 0 (0.0%) |
| $1,000,000 or more | 0 (0.0%) | 0 (0.0%) |
| Total | 269 (100.0%) | 112 (100.0%) |
Household Income by Mortgage Status in East Sumter
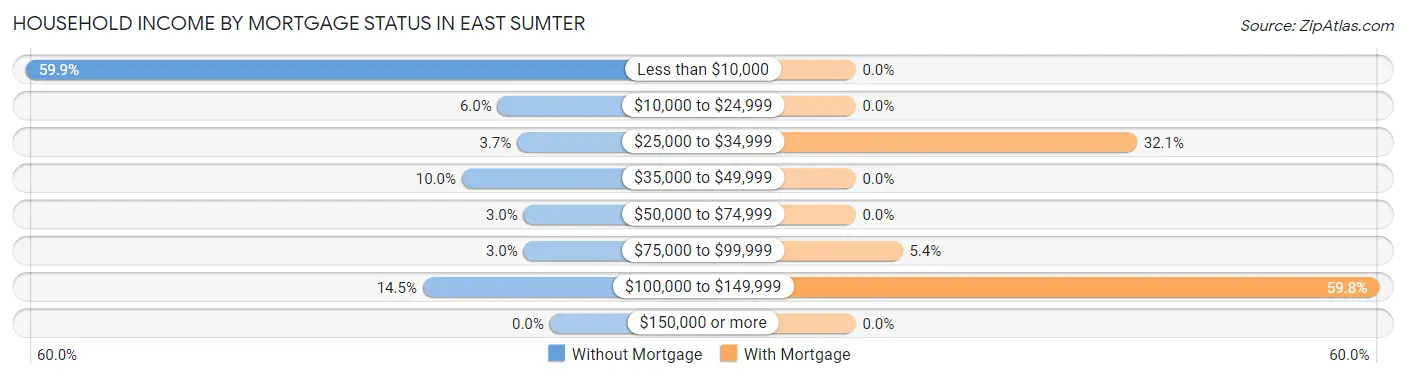
| Household Income | Without Mortgage | With Mortgage |
| Less than $10,000 | 161 (59.9%) | 0 (0.0%) |
| $10,000 to $24,999 | 16 (5.9%) | 0 (0.0%) |
| $25,000 to $34,999 | 10 (3.7%) | 36 (32.1%) |
| $35,000 to $49,999 | 27 (10.0%) | 0 (0.0%) |
| $50,000 to $74,999 | 8 (3.0%) | 0 (0.0%) |
| $75,000 to $99,999 | 8 (3.0%) | 6 (5.4%) |
| $100,000 to $149,999 | 39 (14.5%) | 67 (59.8%) |
| $150,000 or more | 0 (0.0%) | 0 (0.0%) |
| Total | 269 (100.0%) | 112 (100.0%) |
Property Value to Household Income Ratio in East Sumter
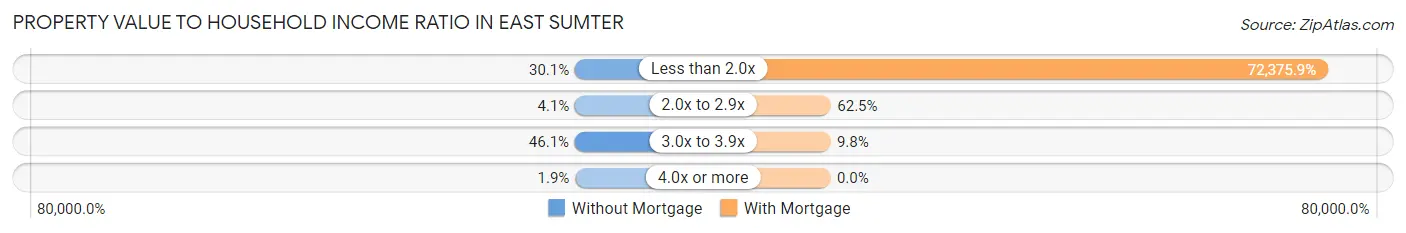
| Value-to-Income Ratio | Without Mortgage | With Mortgage |
| Less than 2.0x | 81 (30.1%) | 81,061 (72,375.9%) |
| 2.0x to 2.9x | 11 (4.1%) | 70 (62.5%) |
| 3.0x to 3.9x | 124 (46.1%) | 11 (9.8%) |
| 4.0x or more | 5 (1.9%) | 0 (0.0%) |
| Total | 269 (100.0%) | 112 (100.0%) |
Real Estate Taxes by Mortgage Status in East Sumter
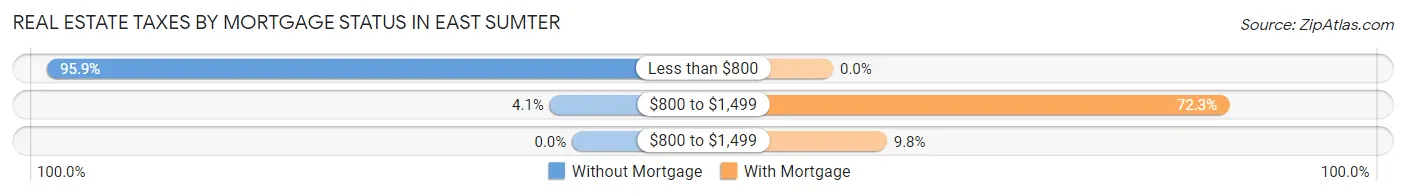
| Property Taxes | Without Mortgage | With Mortgage |
| Less than $800 | 258 (95.9%) | 0 (0.0%) |
| $800 to $1,499 | 11 (4.1%) | 81 (72.3%) |
| $800 to $1,499 | 0 (0.0%) | 11 (9.8%) |
| Total | 269 (100.0%) | 112 (100.0%) |
Health & Disability in East Sumter
Health Insurance Coverage by Age in East Sumter
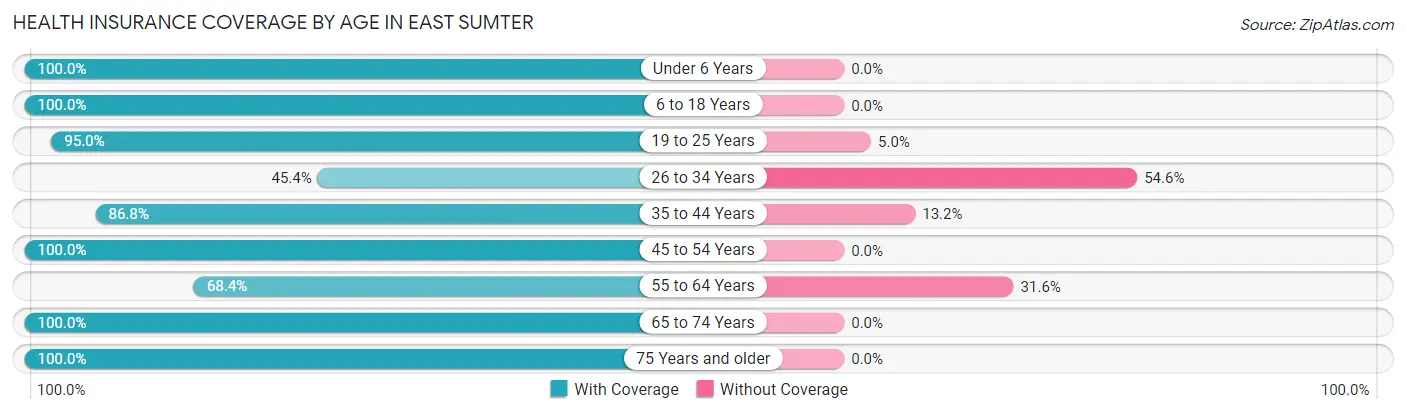
| Age Bracket | With Coverage | Without Coverage |
| Under 6 Years | 92 (100.0%) | 0 (0.0%) |
| 6 to 18 Years | 42 (100.0%) | 0 (0.0%) |
| 19 to 25 Years | 19 (95.0%) | 1 (5.0%) |
| 26 to 34 Years | 49 (45.4%) | 59 (54.6%) |
| 35 to 44 Years | 59 (86.8%) | 9 (13.2%) |
| 45 to 54 Years | 73 (100.0%) | 0 (0.0%) |
| 55 to 64 Years | 104 (68.4%) | 48 (31.6%) |
| 65 to 74 Years | 159 (100.0%) | 0 (0.0%) |
| 75 Years and older | 71 (100.0%) | 0 (0.0%) |
| Total | 668 (85.1%) | 117 (14.9%) |
Health Insurance Coverage by Citizenship Status in East Sumter
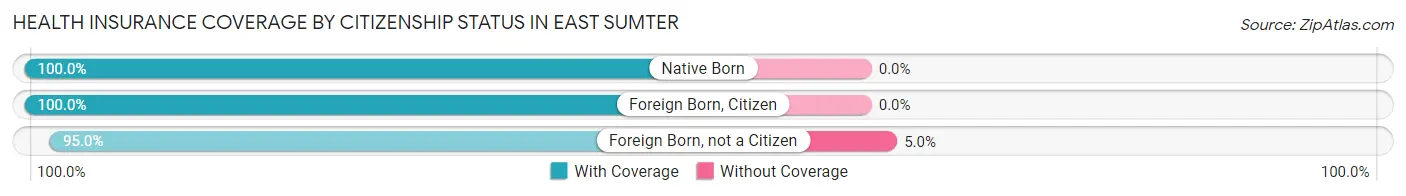
| Citizenship Status | With Coverage | Without Coverage |
| Native Born | 92 (100.0%) | 0 (0.0%) |
| Foreign Born, Citizen | 42 (100.0%) | 0 (0.0%) |
| Foreign Born, not a Citizen | 19 (95.0%) | 1 (5.0%) |
Health Insurance Coverage by Household Income in East Sumter
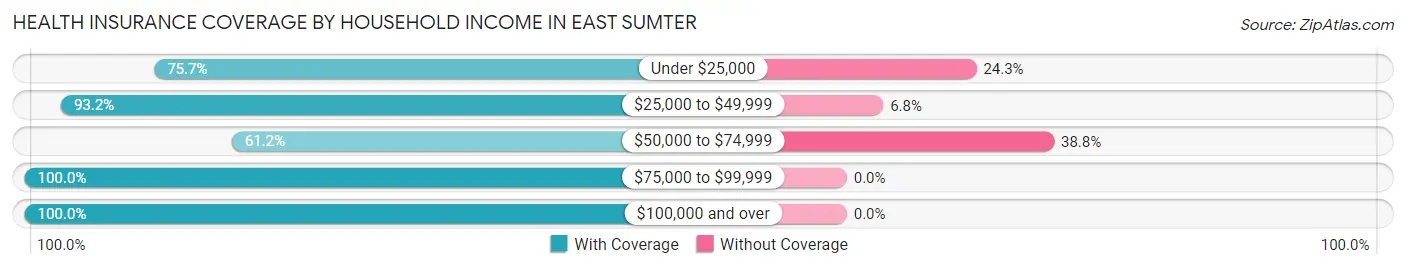
| Household Income | With Coverage | Without Coverage |
| Under $25,000 | 212 (75.7%) | 68 (24.3%) |
| $25,000 to $49,999 | 123 (93.2%) | 9 (6.8%) |
| $50,000 to $74,999 | 63 (61.2%) | 40 (38.8%) |
| $75,000 to $99,999 | 171 (100.0%) | 0 (0.0%) |
| $100,000 and over | 99 (100.0%) | 0 (0.0%) |
Public vs Private Health Insurance Coverage by Age in East Sumter
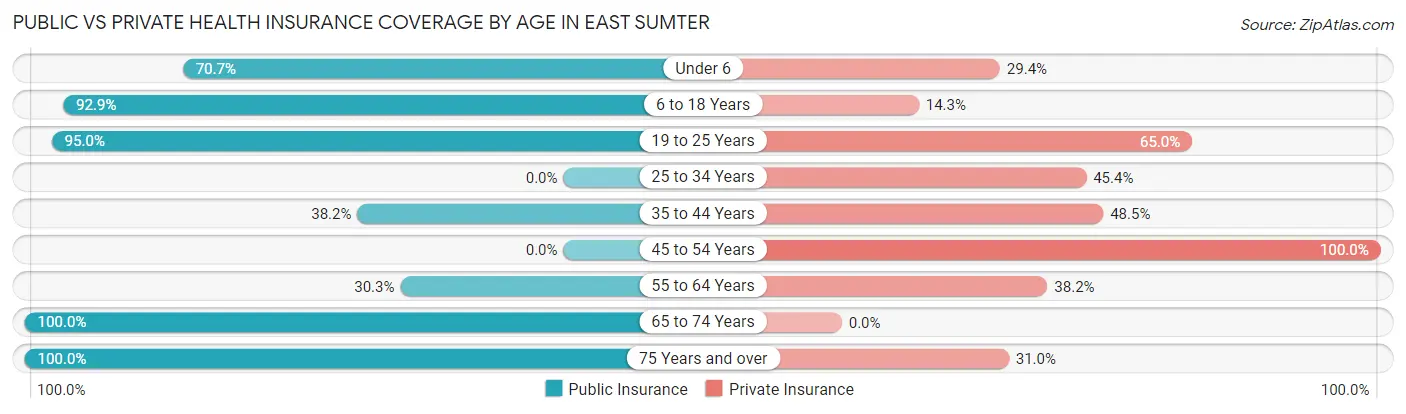
| Age Bracket | Public Insurance | Private Insurance |
| Under 6 | 65 (70.7%) | 27 (29.3%) |
| 6 to 18 Years | 39 (92.9%) | 6 (14.3%) |
| 19 to 25 Years | 19 (95.0%) | 13 (65.0%) |
| 25 to 34 Years | 0 (0.0%) | 49 (45.4%) |
| 35 to 44 Years | 26 (38.2%) | 33 (48.5%) |
| 45 to 54 Years | 0 (0.0%) | 73 (100.0%) |
| 55 to 64 Years | 46 (30.3%) | 58 (38.2%) |
| 65 to 74 Years | 159 (100.0%) | 0 (0.0%) |
| 75 Years and over | 71 (100.0%) | 22 (31.0%) |
| Total | 425 (54.1%) | 281 (35.8%) |
Disability Status by Sex by Age in East Sumter
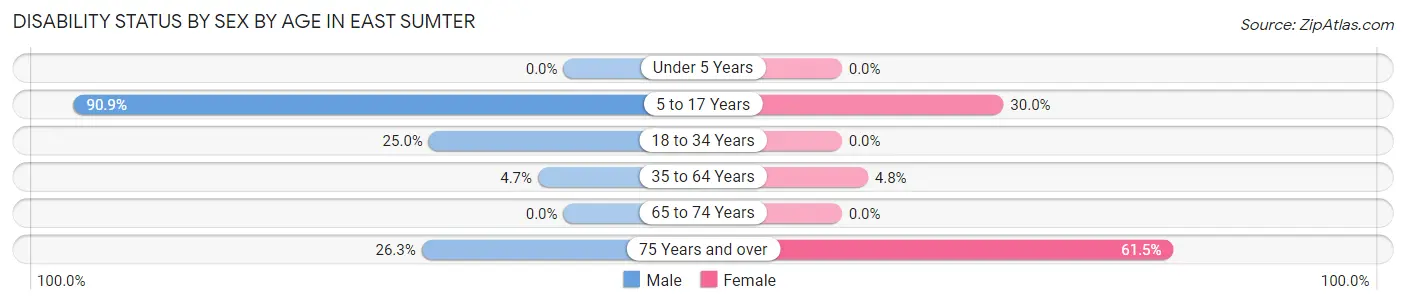
| Age Bracket | Male | Female |
| Under 5 Years | 0 (0.0%) | 0 (0.0%) |
| 5 to 17 Years | 30 (90.9%) | 3 (30.0%) |
| 18 to 34 Years | 13 (25.0%) | 0 (0.0%) |
| 35 to 64 Years | 8 (4.7%) | 6 (4.8%) |
| 65 to 74 Years | 0 (0.0%) | 0 (0.0%) |
| 75 Years and over | 5 (26.3%) | 32 (61.5%) |
Disability Class by Sex by Age in East Sumter
Disability Class: Hearing Difficulty
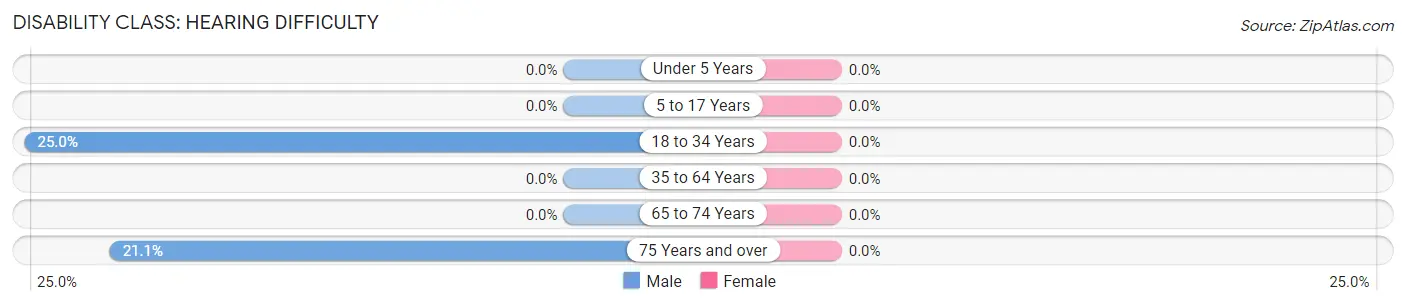
| Age Bracket | Male | Female |
| Under 5 Years | 0 (0.0%) | 0 (0.0%) |
| 5 to 17 Years | 0 (0.0%) | 0 (0.0%) |
| 18 to 34 Years | 13 (25.0%) | 0 (0.0%) |
| 35 to 64 Years | 0 (0.0%) | 0 (0.0%) |
| 65 to 74 Years | 0 (0.0%) | 0 (0.0%) |
| 75 Years and over | 4 (21.0%) | 0 (0.0%) |
Disability Class: Vision Difficulty
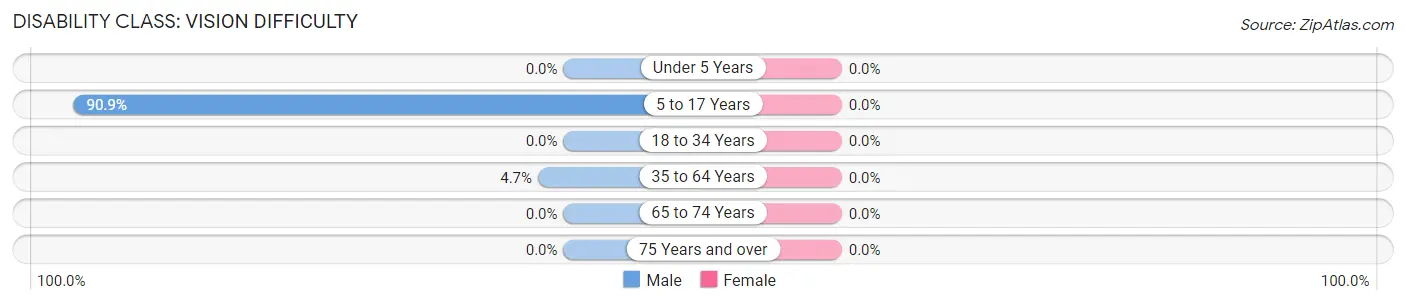
| Age Bracket | Male | Female |
| Under 5 Years | 0 (0.0%) | 0 (0.0%) |
| 5 to 17 Years | 30 (90.9%) | 0 (0.0%) |
| 18 to 34 Years | 0 (0.0%) | 0 (0.0%) |
| 35 to 64 Years | 8 (4.7%) | 0 (0.0%) |
| 65 to 74 Years | 0 (0.0%) | 0 (0.0%) |
| 75 Years and over | 0 (0.0%) | 0 (0.0%) |
Disability Class: Cognitive Difficulty
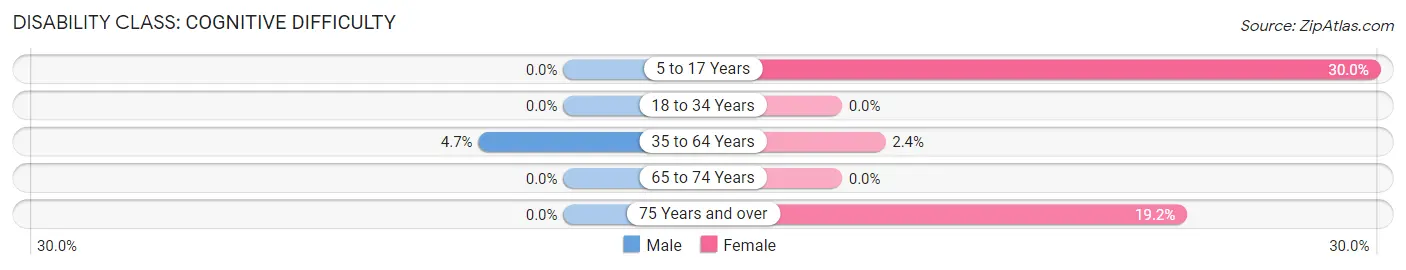
| Age Bracket | Male | Female |
| 5 to 17 Years | 0 (0.0%) | 3 (30.0%) |
| 18 to 34 Years | 0 (0.0%) | 0 (0.0%) |
| 35 to 64 Years | 8 (4.7%) | 3 (2.4%) |
| 65 to 74 Years | 0 (0.0%) | 0 (0.0%) |
| 75 Years and over | 0 (0.0%) | 10 (19.2%) |
Disability Class: Ambulatory Difficulty
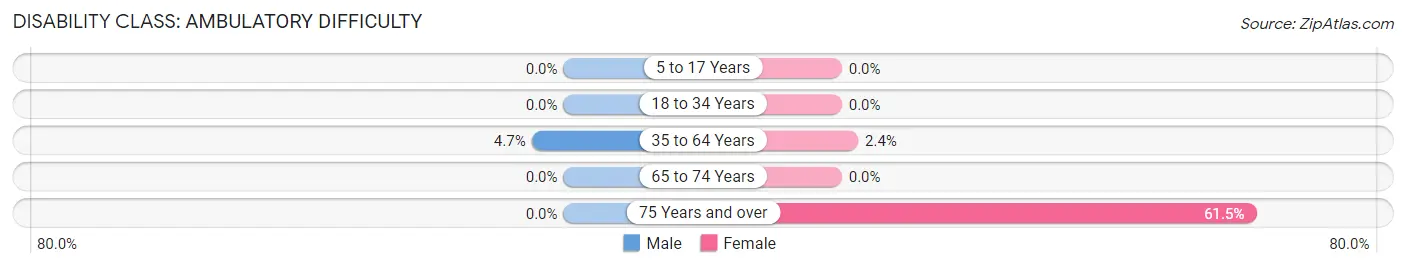
| Age Bracket | Male | Female |
| 5 to 17 Years | 0 (0.0%) | 0 (0.0%) |
| 18 to 34 Years | 0 (0.0%) | 0 (0.0%) |
| 35 to 64 Years | 8 (4.7%) | 3 (2.4%) |
| 65 to 74 Years | 0 (0.0%) | 0 (0.0%) |
| 75 Years and over | 0 (0.0%) | 32 (61.5%) |
Disability Class: Self-Care Difficulty
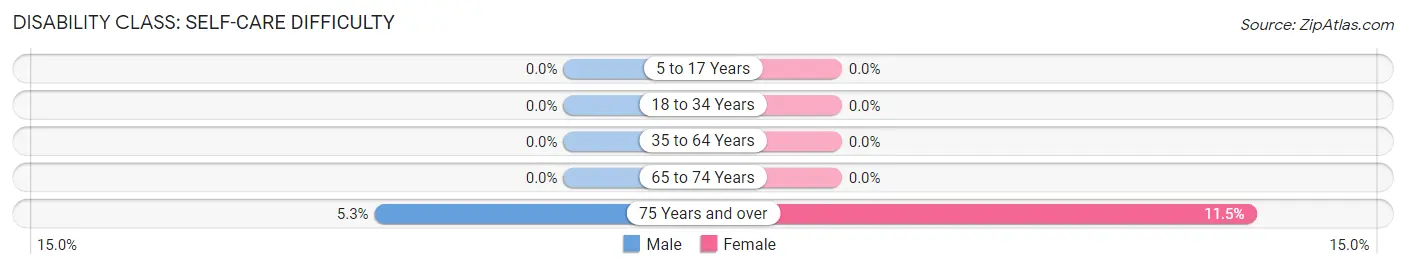
| Age Bracket | Male | Female |
| 5 to 17 Years | 0 (0.0%) | 0 (0.0%) |
| 18 to 34 Years | 0 (0.0%) | 0 (0.0%) |
| 35 to 64 Years | 0 (0.0%) | 0 (0.0%) |
| 65 to 74 Years | 0 (0.0%) | 0 (0.0%) |
| 75 Years and over | 1 (5.3%) | 6 (11.5%) |
Technology Access in East Sumter
Computing Device Access in East Sumter
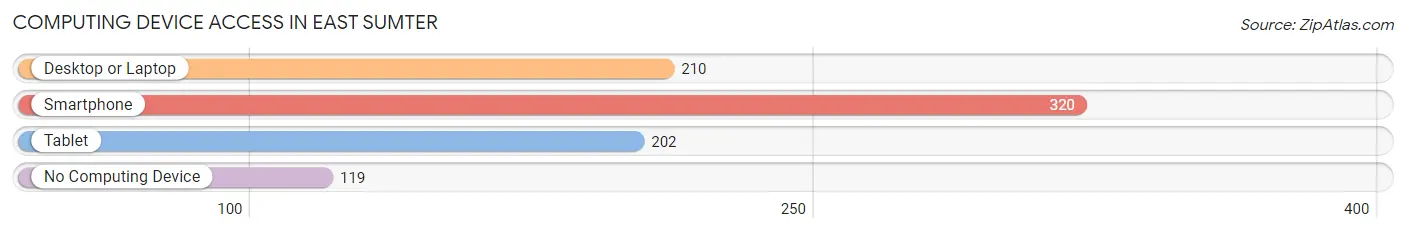
| Device Type | # Households | % Households |
| Desktop or Laptop | 210 | 47.1% |
| Smartphone | 320 | 71.8% |
| Tablet | 202 | 45.3% |
| No Computing Device | 119 | 26.7% |
| Total | 446 | 100.0% |
Internet Access in East Sumter
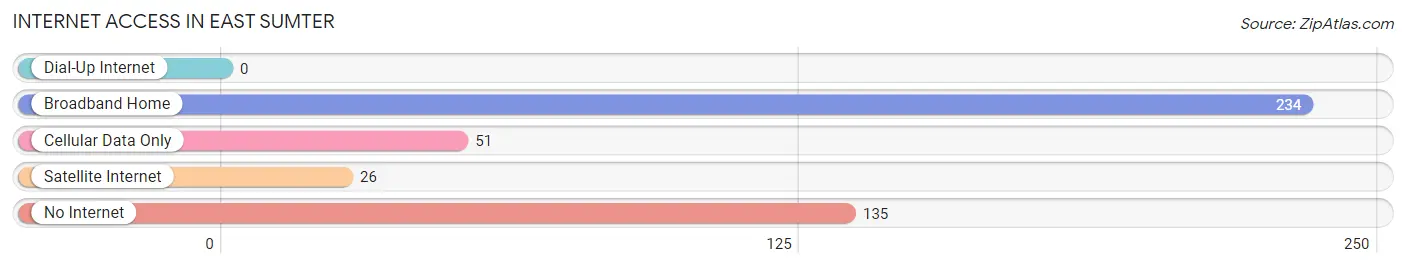
| Internet Type | # Households | % Households |
| Dial-Up Internet | 0 | 0.0% |
| Broadband Home | 234 | 52.5% |
| Cellular Data Only | 51 | 11.4% |
| Satellite Internet | 26 | 5.8% |
| No Internet | 135 | 30.3% |
| Total | 446 | 100.0% |
East Sumter Summary
East Sumter, SC is a small town located in Sumter County, South Carolina. It is situated in the heart of the state, approximately halfway between Columbia and Florence. The town is home to a population of approximately 1,500 people, and is part of the Sumter Metropolitan Statistical Area.
History
East Sumter was founded in 1820 by a group of settlers from the nearby town of Sumter. The town was originally known as “Sumterville”, but was later renamed “East Sumter” to distinguish it from the original settlement. The town was incorporated in 1835, and has remained relatively unchanged since then.
Geography
East Sumter is located in the Piedmont region of South Carolina, and is situated in the heart of the state. The town is located approximately halfway between Columbia and Florence, and is bordered by the Wateree River to the east and the Black River to the west. The town is situated at an elevation of approximately 200 feet above sea level.
Economy
East Sumter’s economy is largely based on agriculture and manufacturing. The town is home to several large farms, as well as several small businesses. The town is also home to a number of manufacturing plants, including a paper mill and a textile mill.
Demographics
As of the 2010 census, East Sumter had a population of 1,500 people. The town is predominantly white, with approximately 75% of the population identifying as such. The remaining 25% of the population is made up of African Americans, Hispanics, and other ethnicities. The median household income in East Sumter is approximately $35,000, and the median home value is approximately $90,000.
East Sumter is a small town with a rich history and a diverse population. The town is home to a number of farms and businesses, and is a great place to live and work. The town is also home to a number of parks and recreational areas, making it a great place to spend time outdoors. East Sumter is a great place to call home, and is sure to provide its residents with a great quality of life.
Common Questions
What is Per Capita Income in East Sumter?
Per Capita income in East Sumter is $23,231.
What is the Median Family Income in East Sumter?
Median Family Income in East Sumter is $80,909.
What is Income or Wage Gap in East Sumter?
Income or Wage Gap in East Sumter is 5.2%.
Women in East Sumter earn 94.8 cents for every dollar earned by a man.
What is Inequality or Gini Index in East Sumter?
Inequality or Gini Index in East Sumter is 0.51.
What is the Total Population of East Sumter?
Total Population of East Sumter is 789.
What is the Total Male Population of East Sumter?
Total Male Population of East Sumter is 481.
What is the Total Female Population of East Sumter?
Total Female Population of East Sumter is 308.
What is the Ratio of Males per 100 Females in East Sumter?
There are 156.17 Males per 100 Females in East Sumter.
What is the Ratio of Females per 100 Males in East Sumter?
There are 64.03 Females per 100 Males in East Sumter.
What is the Median Population Age in East Sumter?
Median Population Age in East Sumter is 50.4 Years.
What is the Average Family Size in East Sumter
Average Family Size in East Sumter is 2.4 People.
What is the Average Household Size in East Sumter
Average Household Size in East Sumter is 1.8 People.
How Large is the Labor Force in East Sumter?
There are 360 People in the Labor Forcein in East Sumter.
What is the Percentage of People in the Labor Force in East Sumter?
52.3% of People are in the Labor Force in East Sumter.