Zip Codes with the Highest Percentage of Population Employed in Security & Protection in Darlington, SC
RELATED REPORTS & OPTIONS
Security & Protection
Darlington
Compare Zip Codes
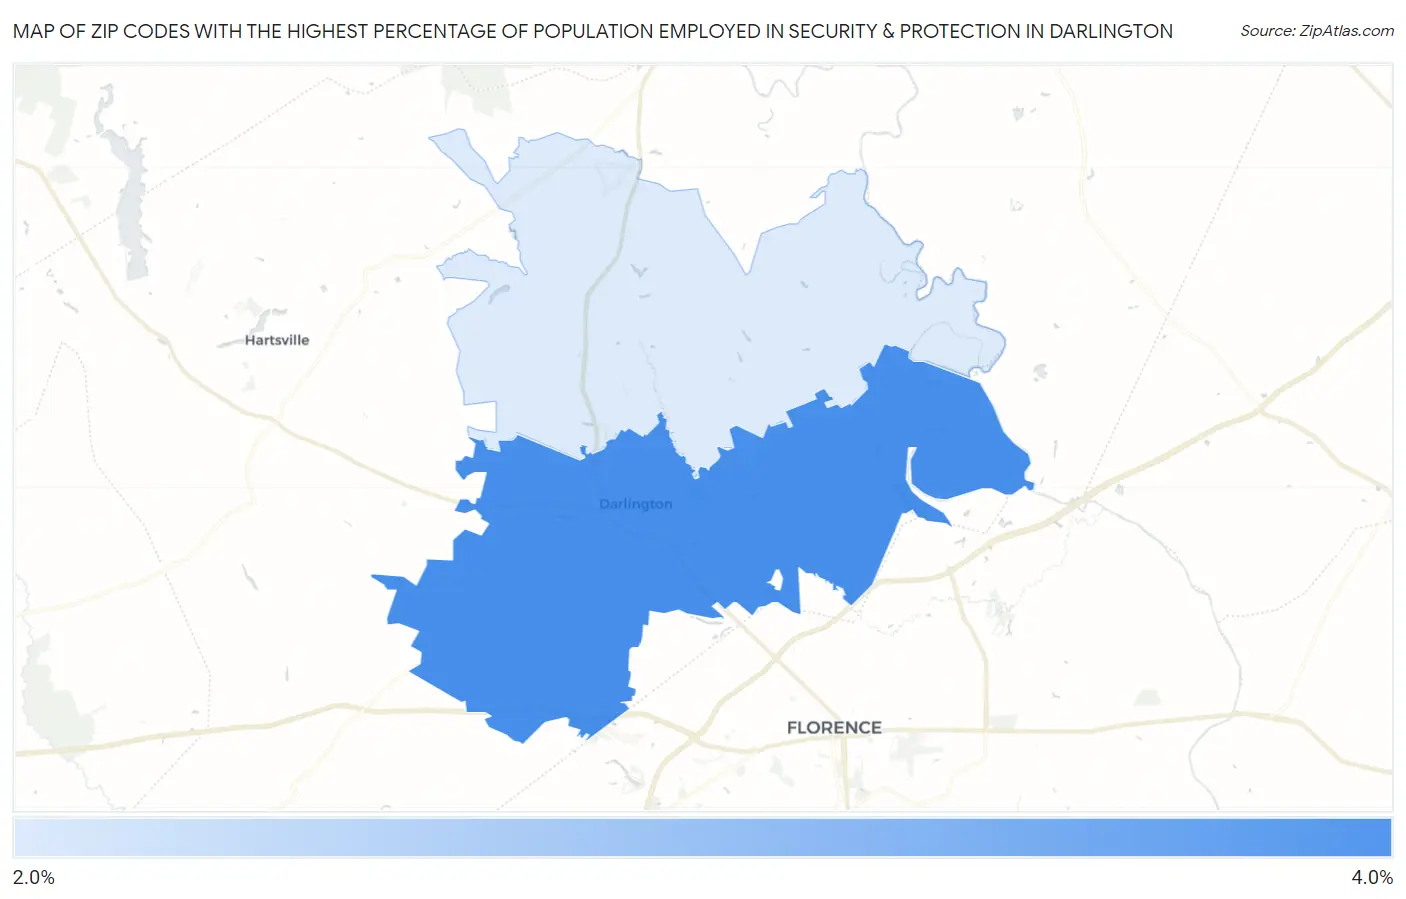
Map of Zip Codes with the Highest Percentage of Population Employed in Security & Protection in Darlington
2.9%
3.1%
Zip Codes with the Highest Percentage of Population Employed in Security & Protection in Darlington, SC
| Zip Code | % Employed | vs State | vs National | |
| 1. | 29532 | 3.1% | 2.1%(+0.995)#97 | 2.1%(+0.946)#6,904 |
| 2. | 29540 | 2.9% | 2.1%(+0.766)#112 | 2.1%(+0.718)#7,793 |
1
Common Questions
What are the Top Zip Codes with the Highest Percentage of Population Employed in Security & Protection in Darlington, SC?
Top Zip Codes with the Highest Percentage of Population Employed in Security & Protection in Darlington, SC are:
What zip code has the Highest Percentage of Population Employed in Security & Protection in Darlington, SC?
29532 has the Highest Percentage of Population Employed in Security & Protection in Darlington, SC with 3.1%.
What is the Percentage of Population Employed in Security & Protection in Darlington, SC?
Percentage of Population Employed in Security & Protection in Darlington is 2.3%.
What is the Percentage of Population Employed in Security & Protection in South Carolina?
Percentage of Population Employed in Security & Protection in South Carolina is 2.1%.
What is the Percentage of Population Employed in Security & Protection in the United States?
Percentage of Population Employed in Security & Protection in the United States is 2.1%.