Zip Codes with the Highest Percentage of Population Employed in Architecture & Engineering in Simpsonville, SC
RELATED REPORTS & OPTIONS
Architecture & Engineering
Simpsonville
Compare Zip Codes
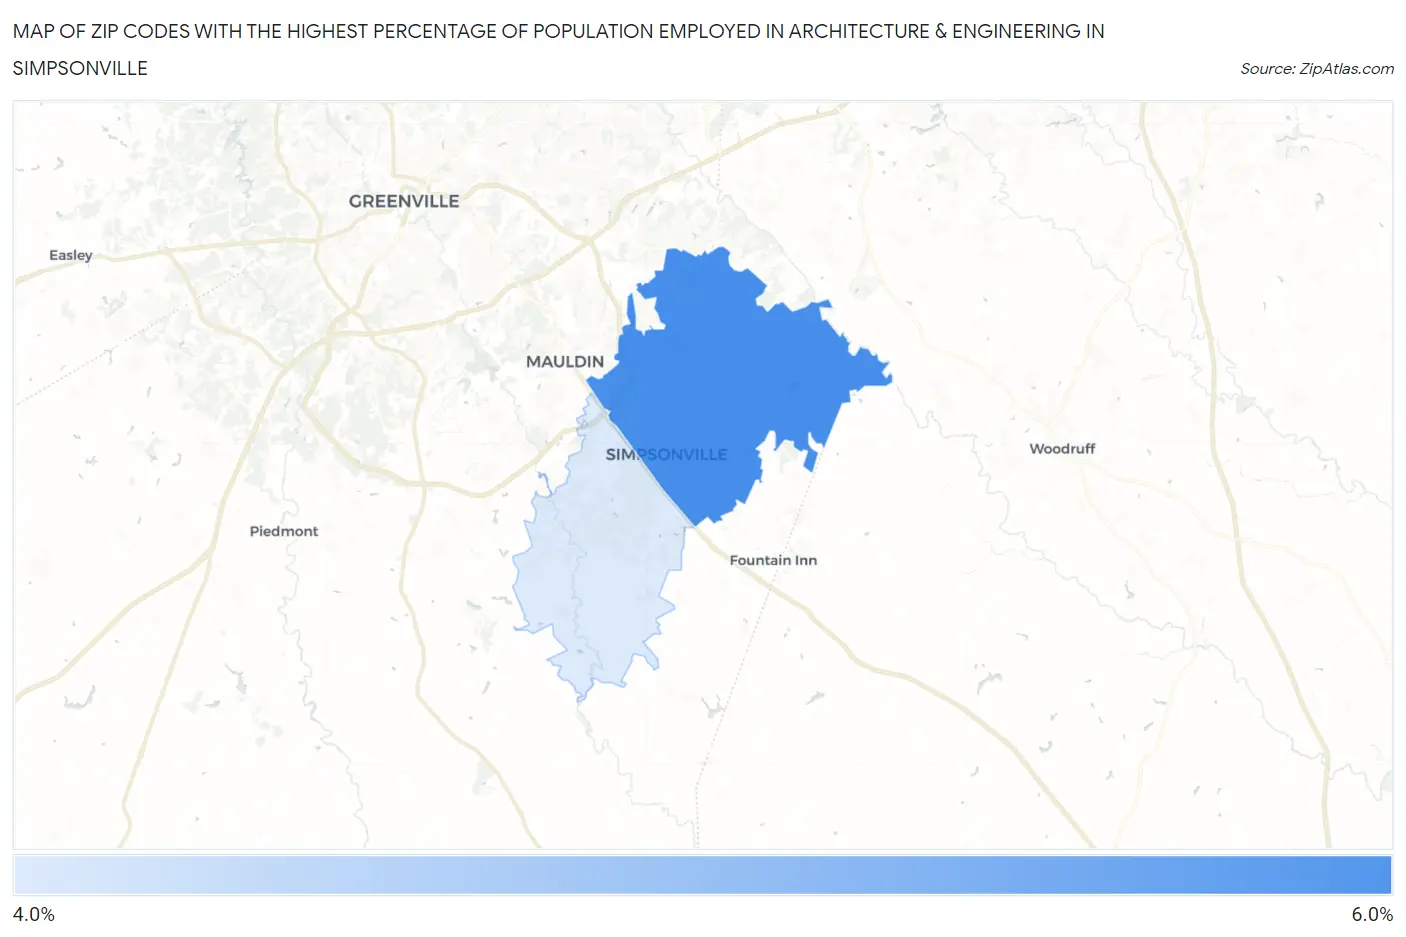
Map of Zip Codes with the Highest Percentage of Population Employed in Architecture & Engineering in Simpsonville
4.2%
5.6%
Zip Codes with the Highest Percentage of Population Employed in Architecture & Engineering in Simpsonville, SC
| Zip Code | % Employed | vs State | vs National | |
| 1. | 29681 | 5.6% | 2.2%(+3.40)#14 | 2.1%(+3.44)#1,284 |
| 2. | 29680 | 4.2% | 2.2%(+1.99)#27 | 2.1%(+2.04)#2,500 |
1
Common Questions
What are the Top Zip Codes with the Highest Percentage of Population Employed in Architecture & Engineering in Simpsonville, SC?
Top Zip Codes with the Highest Percentage of Population Employed in Architecture & Engineering in Simpsonville, SC are:
What zip code has the Highest Percentage of Population Employed in Architecture & Engineering in Simpsonville, SC?
29681 has the Highest Percentage of Population Employed in Architecture & Engineering in Simpsonville, SC with 5.6%.
What is the Percentage of Population Employed in Architecture & Engineering in Simpsonville, SC?
Percentage of Population Employed in Architecture & Engineering in Simpsonville is 3.5%.
What is the Percentage of Population Employed in Architecture & Engineering in South Carolina?
Percentage of Population Employed in Architecture & Engineering in South Carolina is 2.2%.
What is the Percentage of Population Employed in Architecture & Engineering in the United States?
Percentage of Population Employed in Architecture & Engineering in the United States is 2.1%.