Zip Codes with the Highest Percentage of Population Employed in Architecture & Engineering in Charleston, SC
RELATED REPORTS & OPTIONS
Architecture & Engineering
Charleston
Compare Zip Codes
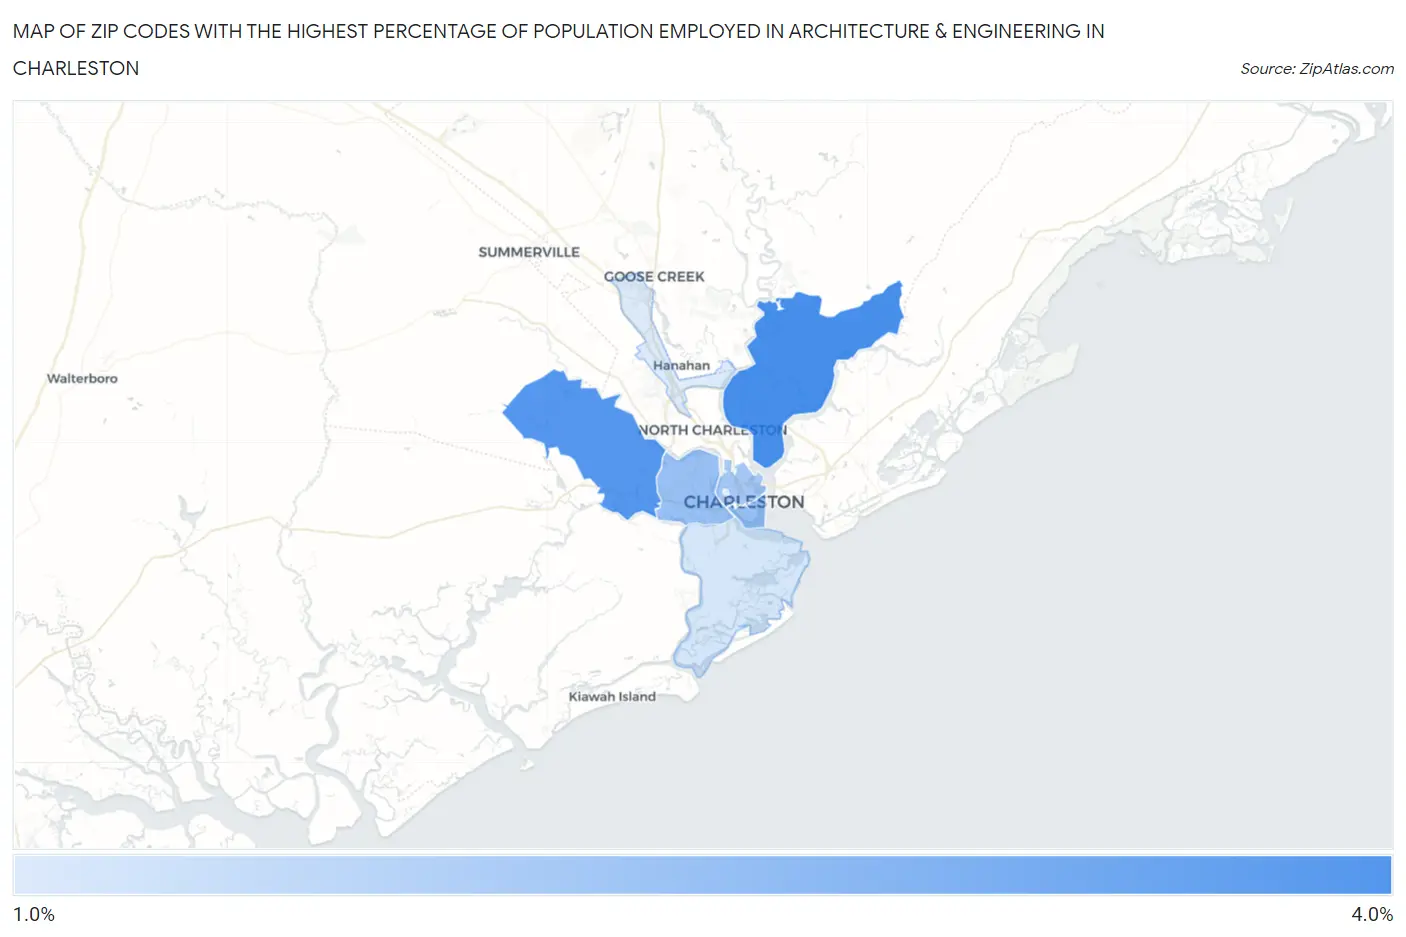
Map of Zip Codes with the Highest Percentage of Population Employed in Architecture & Engineering in Charleston
1.2%
3.4%
Zip Codes with the Highest Percentage of Population Employed in Architecture & Engineering in Charleston, SC
| Zip Code | % Employed | vs State | vs National | |
| 1. | 29492 | 3.4% | 2.2%(+1.25)#55 | 2.1%(+1.30)#3,854 |
| 2. | 29414 | 3.2% | 2.2%(+1.05)#59 | 2.1%(+1.10)#4,332 |
| 3. | 29401 | 2.3% | 2.2%(+0.057)#110 | 2.1%(+0.105)#8,183 |
| 4. | 29407 | 2.2% | 2.2%(+0.028)#112 | 2.1%(+0.076)#8,344 |
| 5. | 29403 | 2.0% | 2.2%(-0.166)#123 | 2.1%(-0.119)#9,419 |
| 6. | 29412 | 1.3% | 2.2%(-0.887)#191 | 2.1%(-0.839)#14,251 |
| 7. | 29406 | 1.2% | 2.2%(-1.00)#201 | 2.1%(-0.953)#15,113 |
1
Common Questions
What are the Top 5 Zip Codes with the Highest Percentage of Population Employed in Architecture & Engineering in Charleston, SC?
Top 5 Zip Codes with the Highest Percentage of Population Employed in Architecture & Engineering in Charleston, SC are:
What zip code has the Highest Percentage of Population Employed in Architecture & Engineering in Charleston, SC?
29492 has the Highest Percentage of Population Employed in Architecture & Engineering in Charleston, SC with 3.4%.
What is the Percentage of Population Employed in Architecture & Engineering in Charleston, SC?
Percentage of Population Employed in Architecture & Engineering in Charleston is 2.6%.
What is the Percentage of Population Employed in Architecture & Engineering in South Carolina?
Percentage of Population Employed in Architecture & Engineering in South Carolina is 2.2%.
What is the Percentage of Population Employed in Architecture & Engineering in the United States?
Percentage of Population Employed in Architecture & Engineering in the United States is 2.1%.