Zip Codes with the Highest Percentage of Population Employed in Architecture & Engineering in Darlington, SC
RELATED REPORTS & OPTIONS
Architecture & Engineering
Darlington
Compare Zip Codes
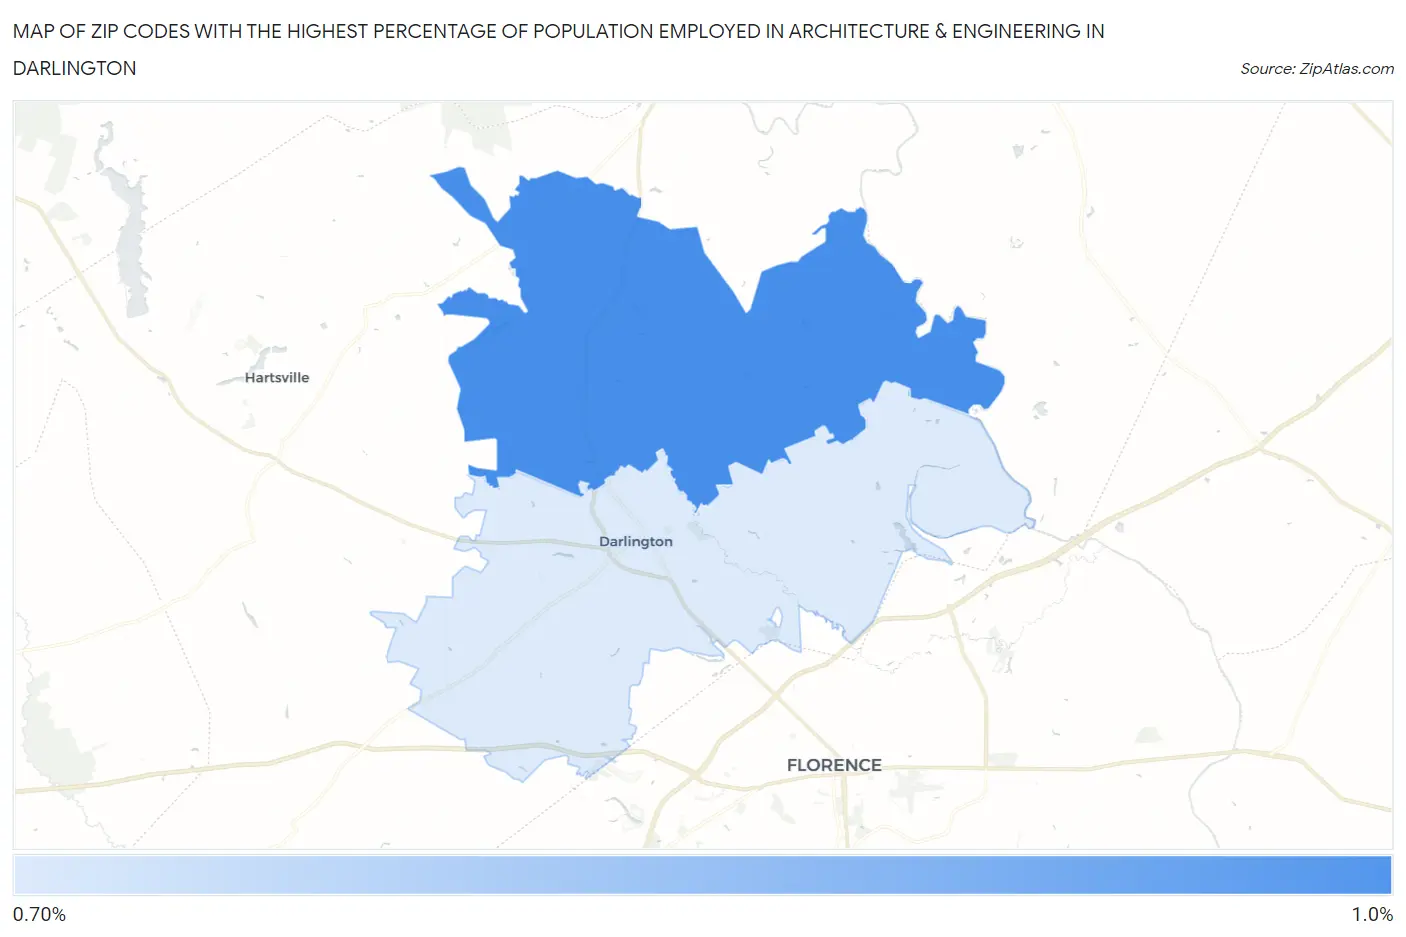
Map of Zip Codes with the Highest Percentage of Population Employed in Architecture & Engineering in Darlington
0.79%
0.81%
Zip Codes with the Highest Percentage of Population Employed in Architecture & Engineering in Darlington, SC
| Zip Code | % Employed | vs State | vs National | |
| 1. | 29540 | 0.81% | 2.2%(-1.39)#243 | 2.1%(-1.34)#18,049 |
| 2. | 29532 | 0.79% | 2.2%(-1.41)#247 | 2.1%(-1.36)#18,236 |
1
Common Questions
What are the Top Zip Codes with the Highest Percentage of Population Employed in Architecture & Engineering in Darlington, SC?
Top Zip Codes with the Highest Percentage of Population Employed in Architecture & Engineering in Darlington, SC are:
What zip code has the Highest Percentage of Population Employed in Architecture & Engineering in Darlington, SC?
29540 has the Highest Percentage of Population Employed in Architecture & Engineering in Darlington, SC with 0.81%.
What is the Percentage of Population Employed in Architecture & Engineering in South Carolina?
Percentage of Population Employed in Architecture & Engineering in South Carolina is 2.2%.
What is the Percentage of Population Employed in Architecture & Engineering in the United States?
Percentage of Population Employed in Architecture & Engineering in the United States is 2.1%.