Zip Codes with the Highest Percentage of Population Employed in Architecture & Engineering in Summerville, SC
RELATED REPORTS & OPTIONS
Architecture & Engineering
Summerville
Compare Zip Codes
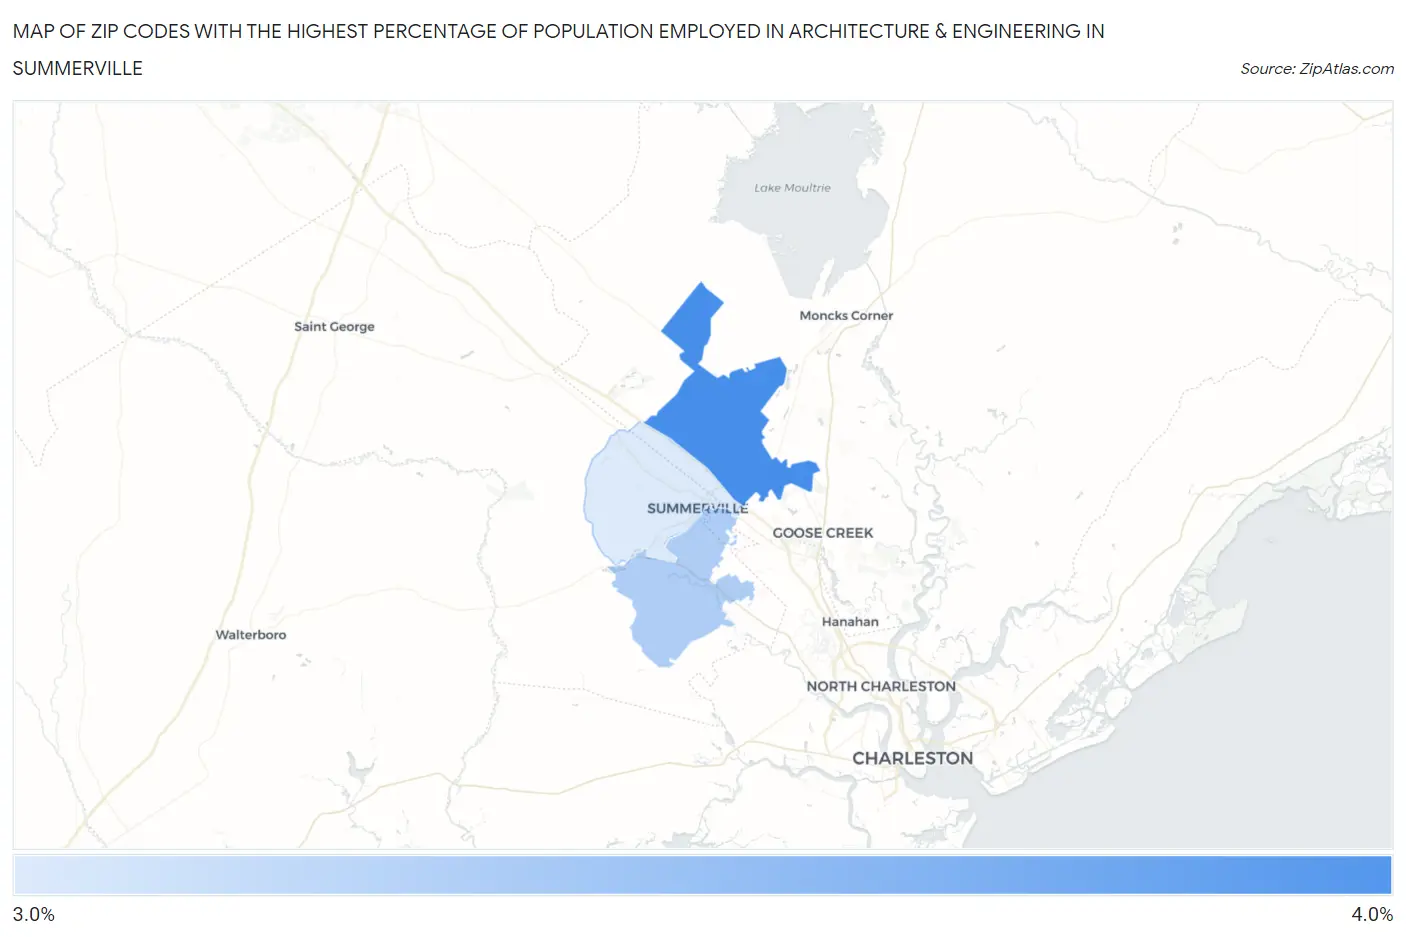
Map of Zip Codes with the Highest Percentage of Population Employed in Architecture & Engineering in Summerville
3.1%
3.5%
Zip Codes with the Highest Percentage of Population Employed in Architecture & Engineering in Summerville, SC
| Zip Code | % Employed | vs State | vs National | |
| 1. | 29486 | 3.5% | 2.2%(+1.34)#49 | 2.1%(+1.39)#3,650 |
| 2. | 29485 | 3.2% | 2.2%(+1.03)#60 | 2.1%(+1.07)#4,405 |
| 3. | 29483 | 3.1% | 2.2%(+0.889)#66 | 2.1%(+0.936)#4,782 |
1
Common Questions
What are the Top Zip Codes with the Highest Percentage of Population Employed in Architecture & Engineering in Summerville, SC?
Top Zip Codes with the Highest Percentage of Population Employed in Architecture & Engineering in Summerville, SC are:
What zip code has the Highest Percentage of Population Employed in Architecture & Engineering in Summerville, SC?
29486 has the Highest Percentage of Population Employed in Architecture & Engineering in Summerville, SC with 3.5%.
What is the Percentage of Population Employed in Architecture & Engineering in Summerville, SC?
Percentage of Population Employed in Architecture & Engineering in Summerville is 2.5%.
What is the Percentage of Population Employed in Architecture & Engineering in South Carolina?
Percentage of Population Employed in Architecture & Engineering in South Carolina is 2.2%.
What is the Percentage of Population Employed in Architecture & Engineering in the United States?
Percentage of Population Employed in Architecture & Engineering in the United States is 2.1%.