Zip Codes with the Highest Percentage of Population Employed in Architecture & Engineering in Fort Mill, SC
RELATED REPORTS & OPTIONS
Architecture & Engineering
Fort Mill
Compare Zip Codes
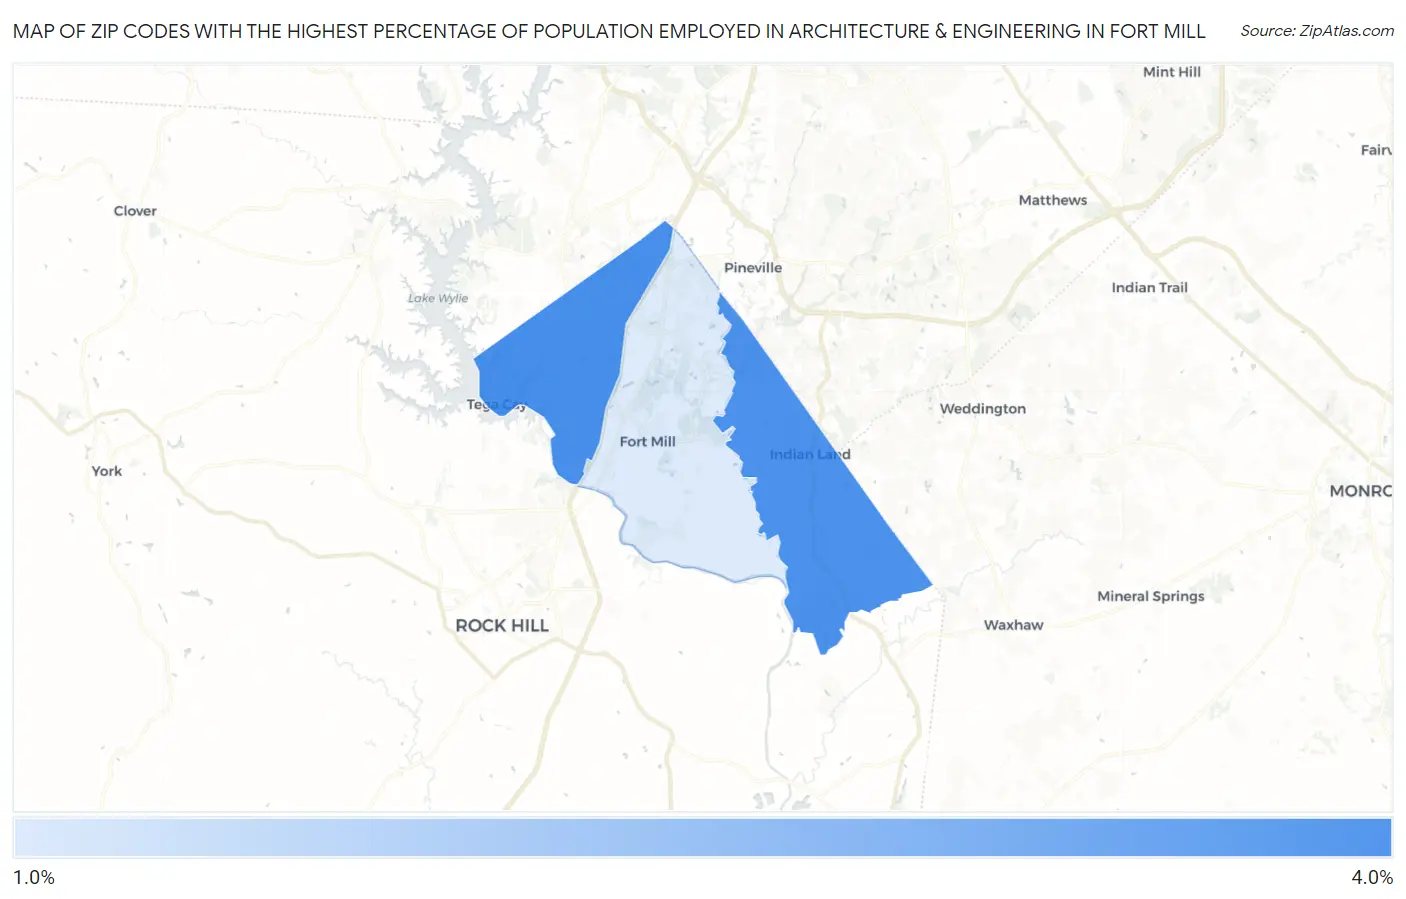
Map of Zip Codes with the Highest Percentage of Population Employed in Architecture & Engineering in Fort Mill
1.7%
3.2%
Zip Codes with the Highest Percentage of Population Employed in Architecture & Engineering in Fort Mill, SC
| Zip Code | % Employed | vs State | vs National | |
| 1. | 29708 | 3.2% | 2.2%(+1.02)#61 | 2.1%(+1.07)#4,419 |
| 2. | 29707 | 3.2% | 2.2%(+0.982)#62 | 2.1%(+1.03)#4,521 |
| 3. | 29715 | 1.7% | 2.2%(-0.455)#156 | 2.1%(-0.408)#11,229 |
1
Common Questions
What are the Top Zip Codes with the Highest Percentage of Population Employed in Architecture & Engineering in Fort Mill, SC?
Top Zip Codes with the Highest Percentage of Population Employed in Architecture & Engineering in Fort Mill, SC are:
What zip code has the Highest Percentage of Population Employed in Architecture & Engineering in Fort Mill, SC?
29708 has the Highest Percentage of Population Employed in Architecture & Engineering in Fort Mill, SC with 3.2%.
What is the Percentage of Population Employed in Architecture & Engineering in Fort Mill, SC?
Percentage of Population Employed in Architecture & Engineering in Fort Mill is 2.5%.
What is the Percentage of Population Employed in Architecture & Engineering in South Carolina?
Percentage of Population Employed in Architecture & Engineering in South Carolina is 2.2%.
What is the Percentage of Population Employed in Architecture & Engineering in the United States?
Percentage of Population Employed in Architecture & Engineering in the United States is 2.1%.