Mayo, SC Map & Demographics
Mayo Map
Mayo Overview
$31,722
PER CAPITA INCOME
$63,359
AVG FAMILY INCOME
$48,750
AVG HOUSEHOLD INCOME
39.2%
WAGE / INCOME GAP [ % ]
60.8¢/ $1
WAGE / INCOME GAP [ $ ]
0.40
INEQUALITY / GINI INDEX
1,925
TOTAL POPULATION
980
MALE POPULATION
945
FEMALE POPULATION
103.70
MALES / 100 FEMALES
96.43
FEMALES / 100 MALES
44.4
MEDIAN AGE
2.9
AVG FAMILY SIZE
2.4
AVG HOUSEHOLD SIZE
1,116
LABOR FORCE [ PEOPLE ]
67.2%
PERCENT IN LABOR FORCE
3.3%
UNEMPLOYMENT RATE
Mayo Zip Codes
Mayo Area Codes
Income in Mayo
Income Overview in Mayo
Per Capita Income in Mayo is $31,722, while median incomes of families and households are $63,359 and $48,750 respectively.
| Characteristic | Number | Measure |
| Per Capita Income | 1,925 | $31,722 |
| Median Family Income | 562 | $63,359 |
| Mean Family Income | 562 | $86,979 |
| Median Household Income | 798 | $48,750 |
| Mean Household Income | 798 | $73,962 |
| Income Deficit | 562 | $0 |
| Wage / Income Gap (%) | 1,925 | 39.18% |
| Wage / Income Gap ($) | 1,925 | 60.82¢ per $1 |
| Gini / Inequality Index | 1,925 | 0.40 |
Earnings by Sex in Mayo
Average Earnings in Mayo are $34,975, $36,886 for men and $22,435 for women, a difference of 39.2%.
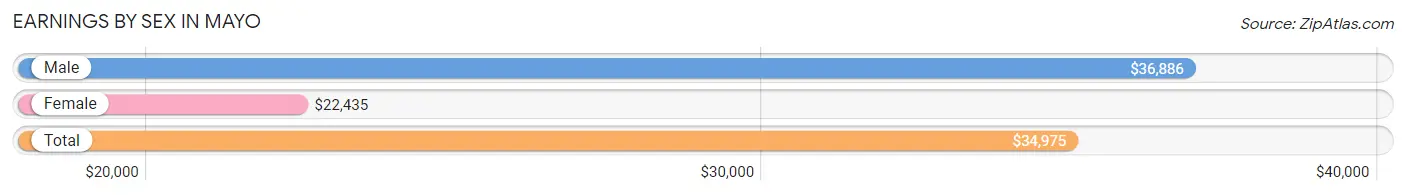
| Sex | Number | Average Earnings |
| Male | 729 (61.2%) | $36,886 |
| Female | 463 (38.8%) | $22,435 |
| Total | 1,192 (100.0%) | $34,975 |
Earnings by Sex by Income Bracket in Mayo
The most common earnings brackets in Mayo are $30,000 to $34,999 for men (192 | 26.3%) and $20,000 to $22,499 for women (96 | 20.7%).
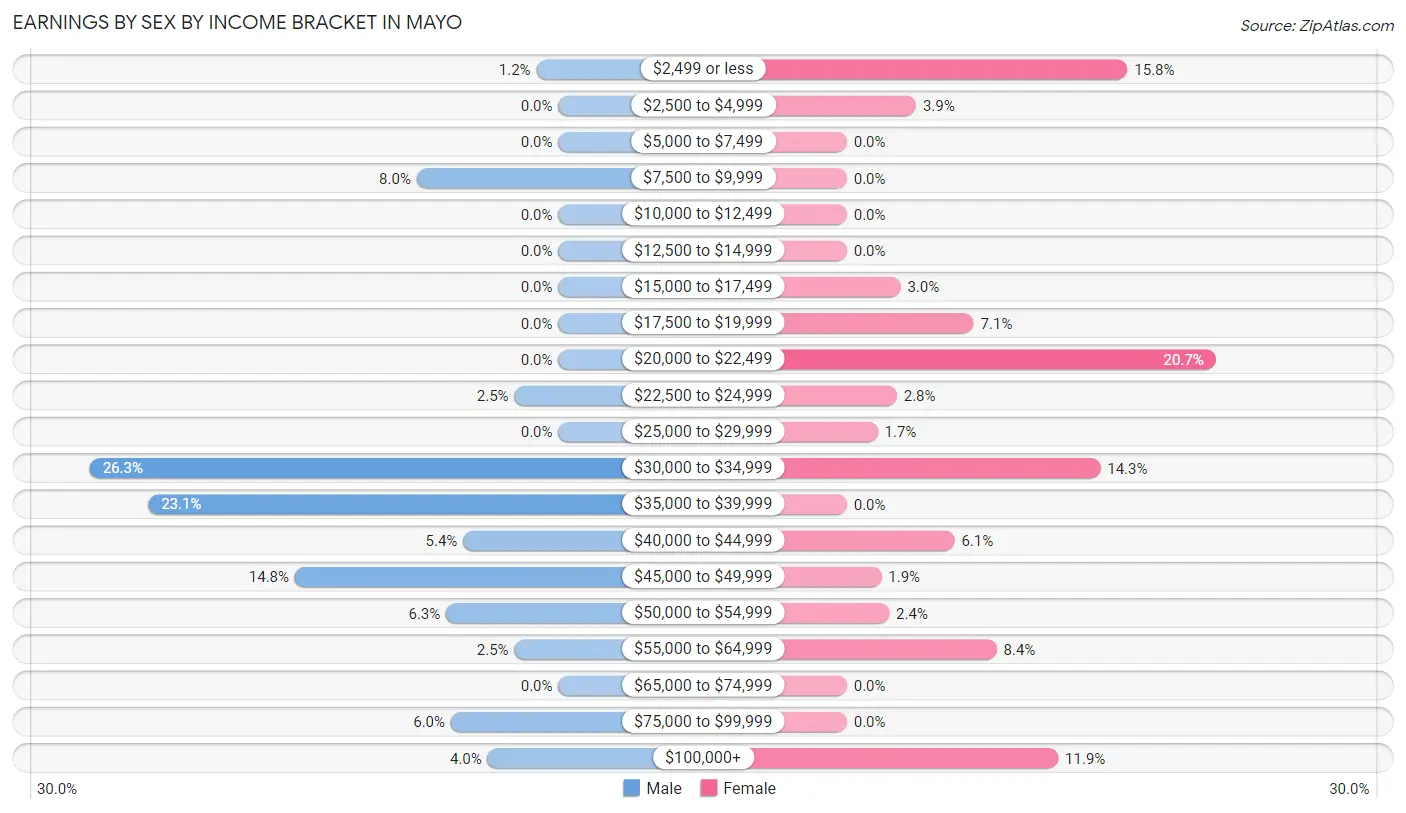
| Income | Male | Female |
| $2,499 or less | 9 (1.2%) | 73 (15.8%) |
| $2,500 to $4,999 | 0 (0.0%) | 18 (3.9%) |
| $5,000 to $7,499 | 0 (0.0%) | 0 (0.0%) |
| $7,500 to $9,999 | 58 (8.0%) | 0 (0.0%) |
| $10,000 to $12,499 | 0 (0.0%) | 0 (0.0%) |
| $12,500 to $14,999 | 0 (0.0%) | 0 (0.0%) |
| $15,000 to $17,499 | 0 (0.0%) | 14 (3.0%) |
| $17,500 to $19,999 | 0 (0.0%) | 33 (7.1%) |
| $20,000 to $22,499 | 0 (0.0%) | 96 (20.7%) |
| $22,500 to $24,999 | 18 (2.5%) | 13 (2.8%) |
| $25,000 to $29,999 | 0 (0.0%) | 8 (1.7%) |
| $30,000 to $34,999 | 192 (26.3%) | 66 (14.2%) |
| $35,000 to $39,999 | 168 (23.1%) | 0 (0.0%) |
| $40,000 to $44,999 | 39 (5.3%) | 28 (6.0%) |
| $45,000 to $49,999 | 108 (14.8%) | 9 (1.9%) |
| $50,000 to $54,999 | 46 (6.3%) | 11 (2.4%) |
| $55,000 to $64,999 | 18 (2.5%) | 39 (8.4%) |
| $65,000 to $74,999 | 0 (0.0%) | 0 (0.0%) |
| $75,000 to $99,999 | 44 (6.0%) | 0 (0.0%) |
| $100,000+ | 29 (4.0%) | 55 (11.9%) |
| Total | 729 (100.0%) | 463 (100.0%) |
Earnings by Sex by Educational Attainment in Mayo
Average earnings in Mayo are $38,173 for men and $28,281 for women, a difference of 25.9%. Men with an educational attainment of college or associate's degree enjoy the highest average annual earnings of $48,634, while those with high school diploma education earn the least with $36,398. Women with an educational attainment of high school diploma earn the most with the average annual earnings of $57,500, while those with college or associate's degree education have the smallest earnings of $21,250.
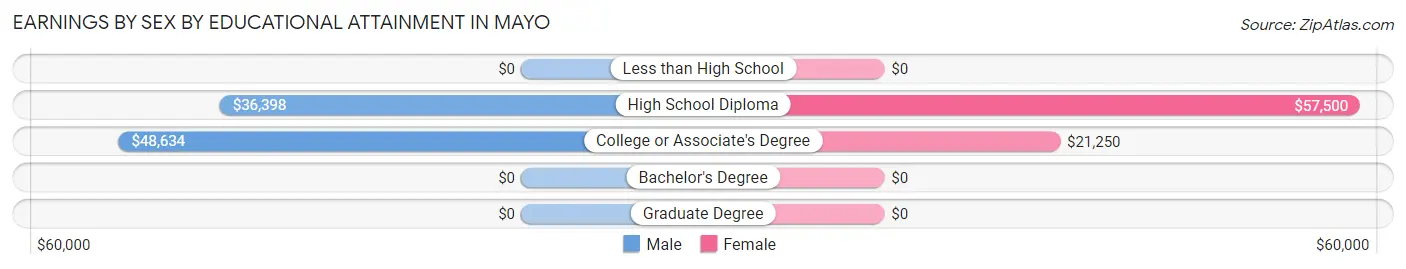
| Educational Attainment | Male Income | Female Income |
| Less than High School | - | - |
| High School Diploma | $36,398 | $57,500 |
| College or Associate's Degree | $48,634 | $21,250 |
| Bachelor's Degree | - | - |
| Graduate Degree | - | - |
| Total | $38,173 | $28,281 |
Family Income in Mayo
Family Income Brackets in Mayo
According to the Mayo family income data, there are 201 families falling into the $35,000 to $49,999 income range, which is the most common income bracket and makes up 35.8% of all families.
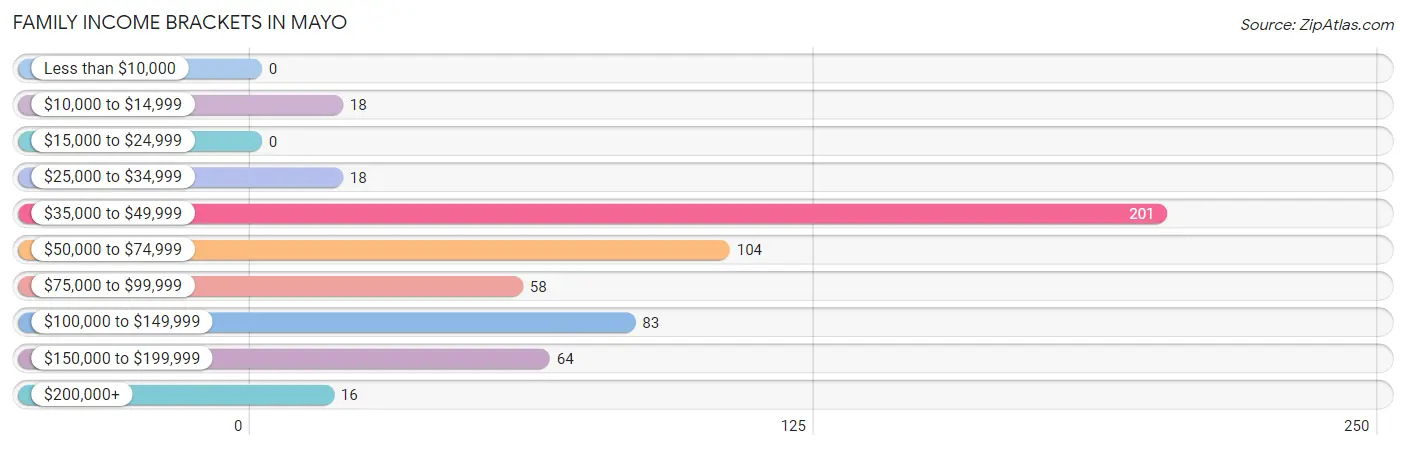
| Income Bracket | # Families | % Families |
| Less than $10,000 | 0 | 0.0% |
| $10,000 to $14,999 | 18 | 3.2% |
| $15,000 to $24,999 | 0 | 0.0% |
| $25,000 to $34,999 | 18 | 3.2% |
| $35,000 to $49,999 | 201 | 35.8% |
| $50,000 to $74,999 | 104 | 18.5% |
| $75,000 to $99,999 | 58 | 10.3% |
| $100,000 to $149,999 | 83 | 14.8% |
| $150,000 to $199,999 | 64 | 11.4% |
| $200,000+ | 16 | 2.8% |
Family Income by Famaliy Size in Mayo
3-person families (145 | 25.8%) account for the highest median family income in Mayo with $36,659 per family, while 3-person families (145 | 25.8%) have the highest median income of $12,220 per family member.
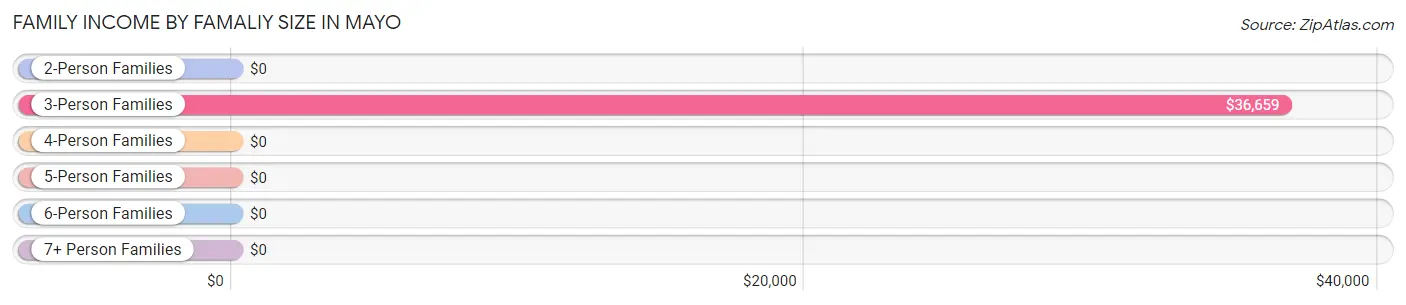
| Income Bracket | # Families | Median Income |
| 2-Person Families | 281 (50.0%) | $0 |
| 3-Person Families | 145 (25.8%) | $36,659 |
| 4-Person Families | 115 (20.5%) | $0 |
| 5-Person Families | 21 (3.7%) | $0 |
| 6-Person Families | 0 (0.0%) | $0 |
| 7+ Person Families | 0 (0.0%) | $0 |
| Total | 562 (100.0%) | $63,359 |
Family Income by Number of Earners in Mayo
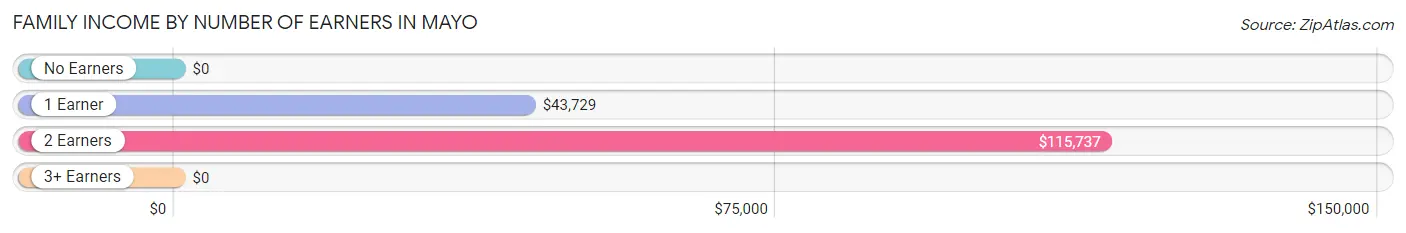
| Number of Earners | # Families | Median Income |
| No Earners | 5 (0.9%) | $0 |
| 1 Earner | 225 (40.0%) | $43,729 |
| 2 Earners | 271 (48.2%) | $115,737 |
| 3+ Earners | 61 (10.8%) | $0 |
| Total | 562 (100.0%) | $63,359 |
Household Income in Mayo
Household Income Brackets in Mayo
With 256 households falling in the category, the $35,000 to $49,999 income range is the most frequent in Mayo, accounting for 32.1% of all households.
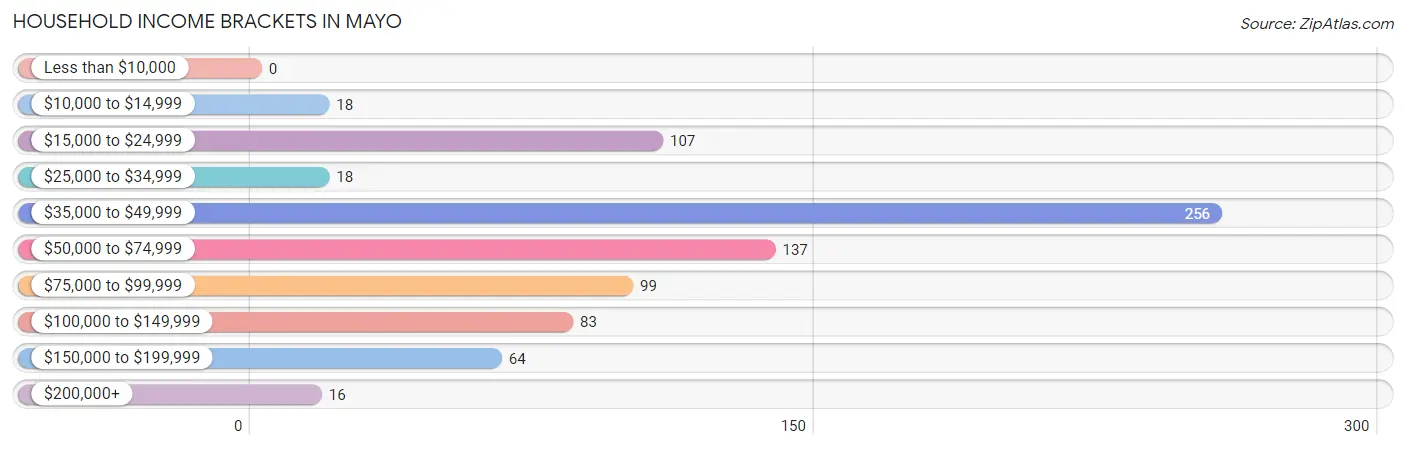
| Income Bracket | # Households | % Households |
| Less than $10,000 | 0 | 0.0% |
| $10,000 to $14,999 | 18 | 2.3% |
| $15,000 to $24,999 | 107 | 13.4% |
| $25,000 to $34,999 | 18 | 2.3% |
| $35,000 to $49,999 | 256 | 32.1% |
| $50,000 to $74,999 | 137 | 17.2% |
| $75,000 to $99,999 | 99 | 12.4% |
| $100,000 to $149,999 | 83 | 10.4% |
| $150,000 to $199,999 | 64 | 8.0% |
| $200,000+ | 16 | 2.0% |
Household Income by Householder Age in Mayo
The median household income in Mayo is $48,750, with the highest median household income of $64,707 found in the 45 to 64 years age bracket for the primary householder. A total of 387 households (48.5%) fall into this category. Meanwhile, the 15 to 24 years age bracket for the primary householder has the lowest median household income of $0, with 94 households (11.8%) in this group.
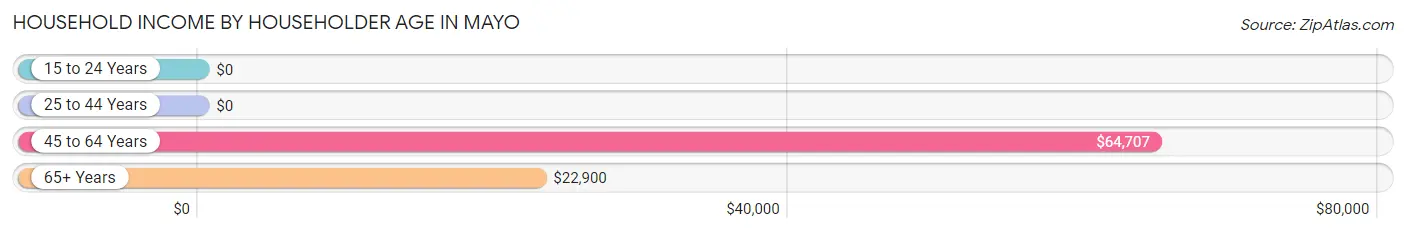
| Income Bracket | # Households | Median Income |
| 15 to 24 Years | 94 (11.8%) | $0 |
| 25 to 44 Years | 187 (23.4%) | $0 |
| 45 to 64 Years | 387 (48.5%) | $64,707 |
| 65+ Years | 130 (16.3%) | $22,900 |
| Total | 798 (100.0%) | $48,750 |
Poverty in Mayo
Income Below Poverty by Sex and Age in Mayo
With 3.6% poverty level for males and 1.9% for females among the residents of Mayo, 6 to 11 year old males and 25 to 34 year old females are the most vulnerable to poverty, with 30 males (50.0%) and 18 females (100.0%) in their respective age groups living below the poverty level.
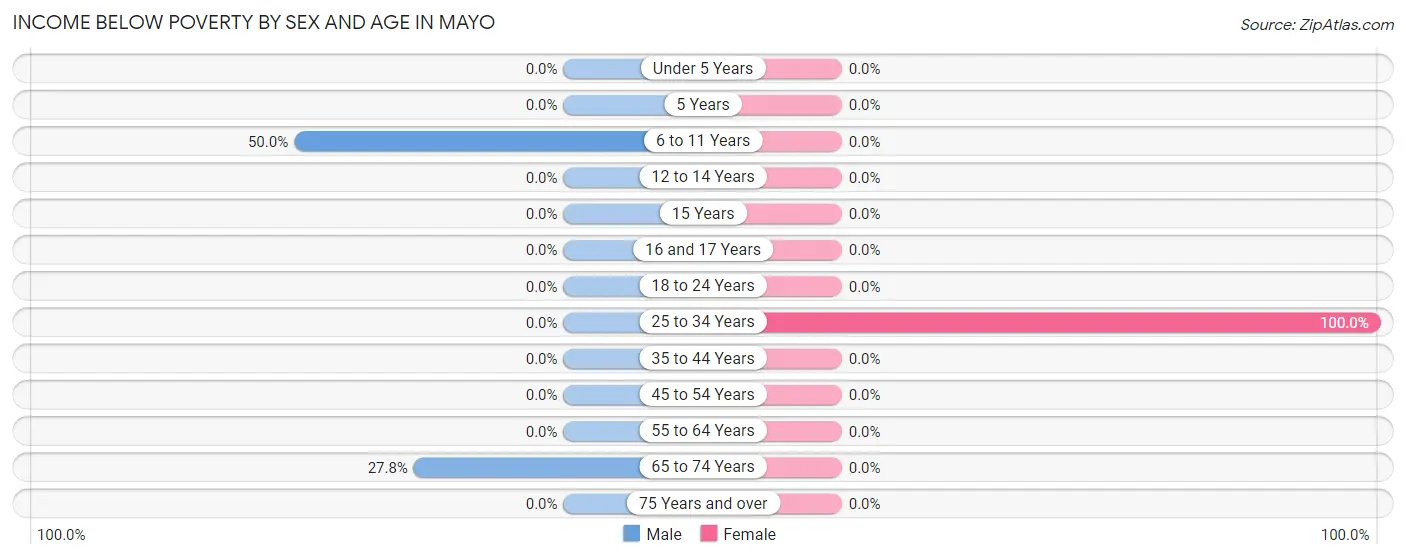
| Age Bracket | Male | Female |
| Under 5 Years | 0 (0.0%) | 0 (0.0%) |
| 5 Years | 0 (0.0%) | 0 (0.0%) |
| 6 to 11 Years | 30 (50.0%) | 0 (0.0%) |
| 12 to 14 Years | 0 (0.0%) | 0 (0.0%) |
| 15 Years | 0 (0.0%) | 0 (0.0%) |
| 16 and 17 Years | 0 (0.0%) | 0 (0.0%) |
| 18 to 24 Years | 0 (0.0%) | 0 (0.0%) |
| 25 to 34 Years | 0 (0.0%) | 18 (100.0%) |
| 35 to 44 Years | 0 (0.0%) | 0 (0.0%) |
| 45 to 54 Years | 0 (0.0%) | 0 (0.0%) |
| 55 to 64 Years | 0 (0.0%) | 0 (0.0%) |
| 65 to 74 Years | 5 (27.8%) | 0 (0.0%) |
| 75 Years and over | 0 (0.0%) | 0 (0.0%) |
| Total | 35 (3.6%) | 18 (1.9%) |
Income Above Poverty by Sex and Age in Mayo
According to the poverty statistics in Mayo, males aged under 5 years and females aged under 5 years are the age groups that are most secure financially, with 100.0% of males and 100.0% of females in these age groups living above the poverty line.
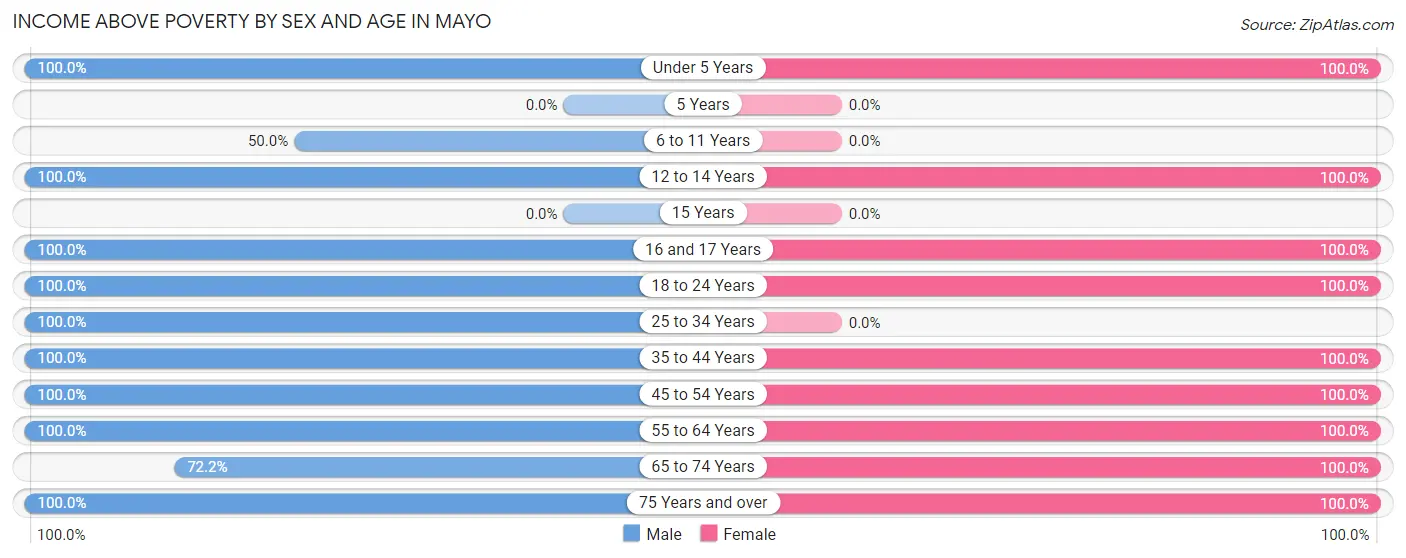
| Age Bracket | Male | Female |
| Under 5 Years | 50 (100.0%) | 40 (100.0%) |
| 5 Years | 0 (0.0%) | 0 (0.0%) |
| 6 to 11 Years | 30 (50.0%) | 0 (0.0%) |
| 12 to 14 Years | 43 (100.0%) | 72 (100.0%) |
| 15 Years | 0 (0.0%) | 0 (0.0%) |
| 16 and 17 Years | 18 (100.0%) | 104 (100.0%) |
| 18 to 24 Years | 163 (100.0%) | 110 (100.0%) |
| 25 to 34 Years | 78 (100.0%) | 0 (0.0%) |
| 35 to 44 Years | 86 (100.0%) | 127 (100.0%) |
| 45 to 54 Years | 278 (100.0%) | 185 (100.0%) |
| 55 to 64 Years | 136 (100.0%) | 74 (100.0%) |
| 65 to 74 Years | 13 (72.2%) | 51 (100.0%) |
| 75 Years and over | 50 (100.0%) | 164 (100.0%) |
| Total | 945 (96.4%) | 927 (98.1%) |
Income Below Poverty Among Married-Couple Families in Mayo
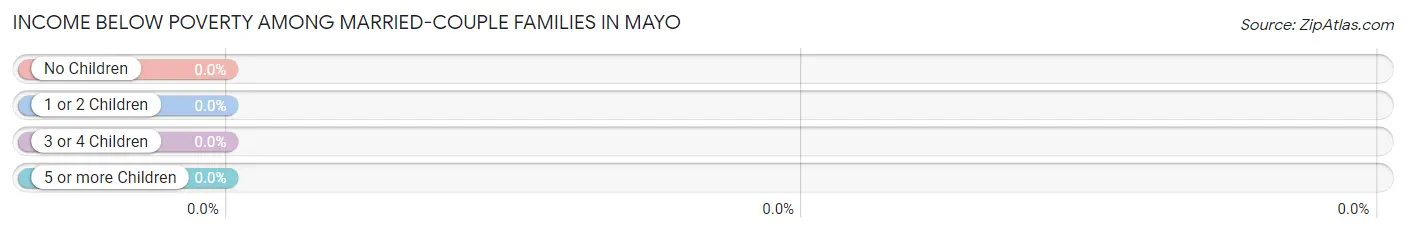
| Children | Above Poverty | Below Poverty |
| No Children | 156 (100.0%) | 0 (0.0%) |
| 1 or 2 Children | 218 (100.0%) | 0 (0.0%) |
| 3 or 4 Children | 0 (0.0%) | 0 (0.0%) |
| 5 or more Children | 0 (0.0%) | 0 (0.0%) |
| Total | 374 (100.0%) | 0 (0.0%) |
Income Below Poverty Among Single-Parent Households in Mayo
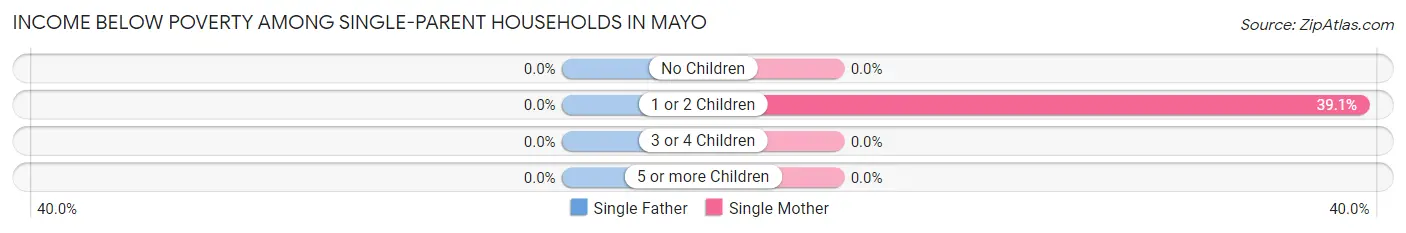
| Children | Single Father | Single Mother |
| No Children | 0 (0.0%) | 0 (0.0%) |
| 1 or 2 Children | 0 (0.0%) | 18 (39.1%) |
| 3 or 4 Children | 0 (0.0%) | 0 (0.0%) |
| 5 or more Children | 0 (0.0%) | 0 (0.0%) |
| Total | 0 (0.0%) | 18 (26.1%) |
Income Below Poverty Among Married-Couple vs Single-Parent Households in Mayo
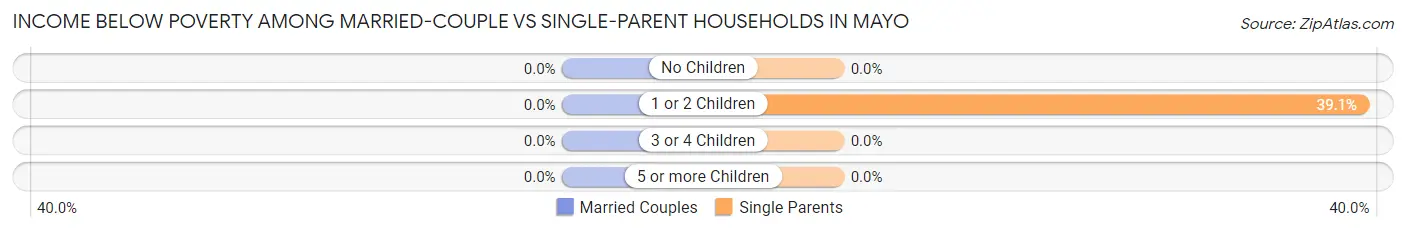
| Children | Married-Couple Families | Single-Parent Households |
| No Children | 0 (0.0%) | 0 (0.0%) |
| 1 or 2 Children | 0 (0.0%) | 18 (39.1%) |
| 3 or 4 Children | 0 (0.0%) | 0 (0.0%) |
| 5 or more Children | 0 (0.0%) | 0 (0.0%) |
| Total | 0 (0.0%) | 18 (9.6%) |
Race in Mayo
The most populous races in Mayo are White / Caucasian (1,858 | 96.5%), Two or more Races (51 | 2.6%), and Hispanic or Latino (34 | 1.8%).
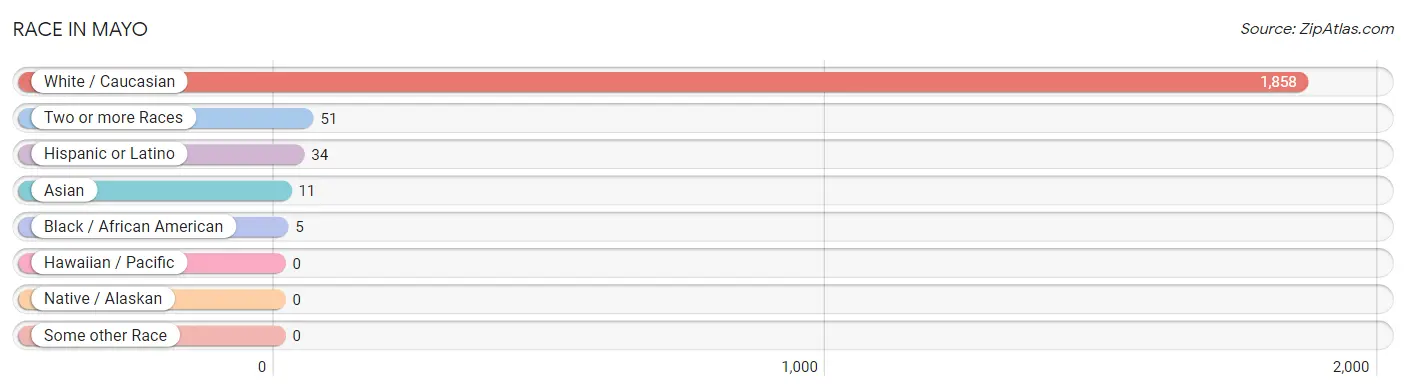
| Race | # Population | % Population |
| Asian | 11 | 0.6% |
| Black / African American | 5 | 0.3% |
| Hawaiian / Pacific | 0 | 0.0% |
| Hispanic or Latino | 34 | 1.8% |
| Native / Alaskan | 0 | 0.0% |
| White / Caucasian | 1,858 | 96.5% |
| Two or more Races | 51 | 2.6% |
| Some other Race | 0 | 0.0% |
| Total | 1,925 | 100.0% |
Ancestry in Mayo
The most populous ancestries reported in Mayo are American (400 | 20.8%), German (215 | 11.2%), Irish (175 | 9.1%), English (127 | 6.6%), and Scotch-Irish (84 | 4.4%), together accounting for 52.0% of all Mayo residents.
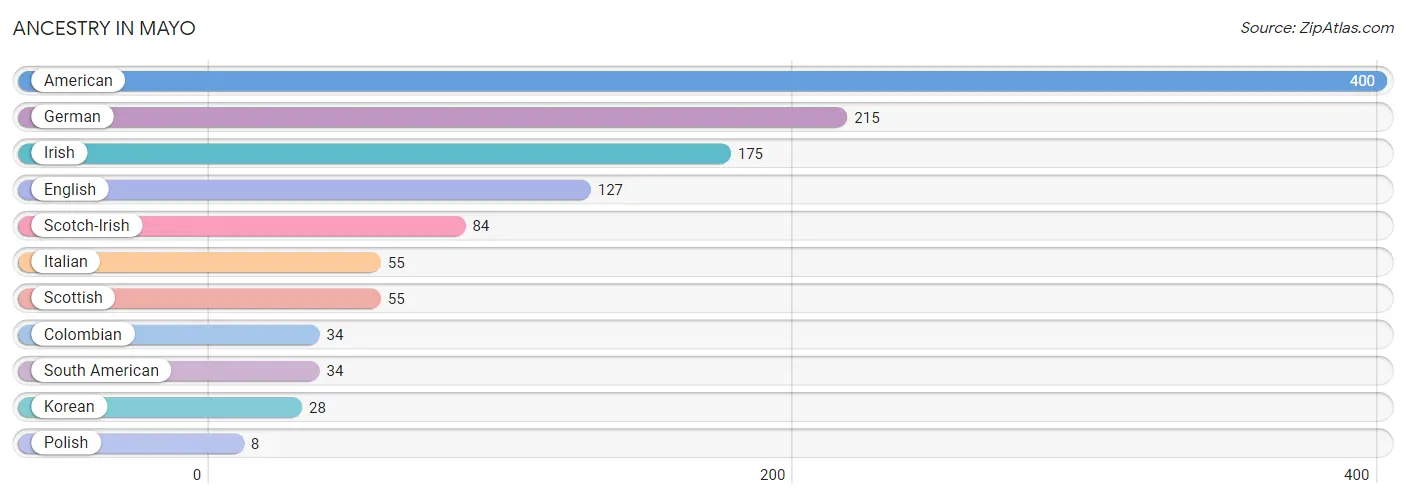
| Ancestry | # Population | % Population |
| American | 400 | 20.8% |
| Colombian | 34 | 1.8% |
| English | 127 | 6.6% |
| German | 215 | 11.2% |
| Irish | 175 | 9.1% |
| Italian | 55 | 2.9% |
| Korean | 28 | 1.5% |
| Polish | 8 | 0.4% |
| Scotch-Irish | 84 | 4.4% |
| Scottish | 55 | 2.9% |
| South American | 34 | 1.8% | View All 11 Rows |
Immigrants in Mayo
The most numerous immigrant groups reported in Mayo came from Colombia (34 | 1.8%), Latin America (34 | 1.8%), South America (34 | 1.8%), Asia (11 | 0.6%), and Philippines (11 | 0.6%), together accounting for 6.5% of all Mayo residents.
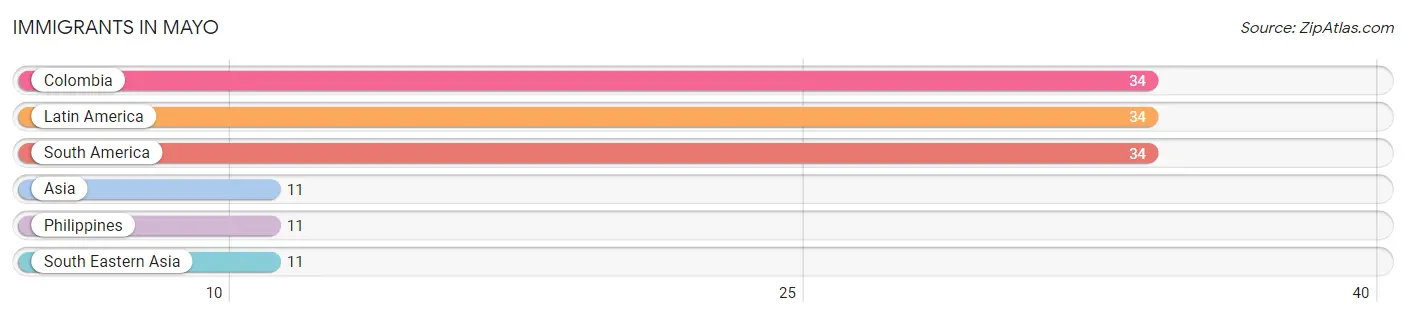
| Immigration Origin | # Population | % Population |
| Asia | 11 | 0.6% |
| Colombia | 34 | 1.8% |
| Latin America | 34 | 1.8% |
| Philippines | 11 | 0.6% |
| South America | 34 | 1.8% |
| South Eastern Asia | 11 | 0.6% | View All 6 Rows |
Sex and Age in Mayo
Sex and Age in Mayo
The most populous age groups in Mayo are 50 to 54 Years (226 | 23.1%) for men and 85 Years and over (136 | 14.4%) for women.
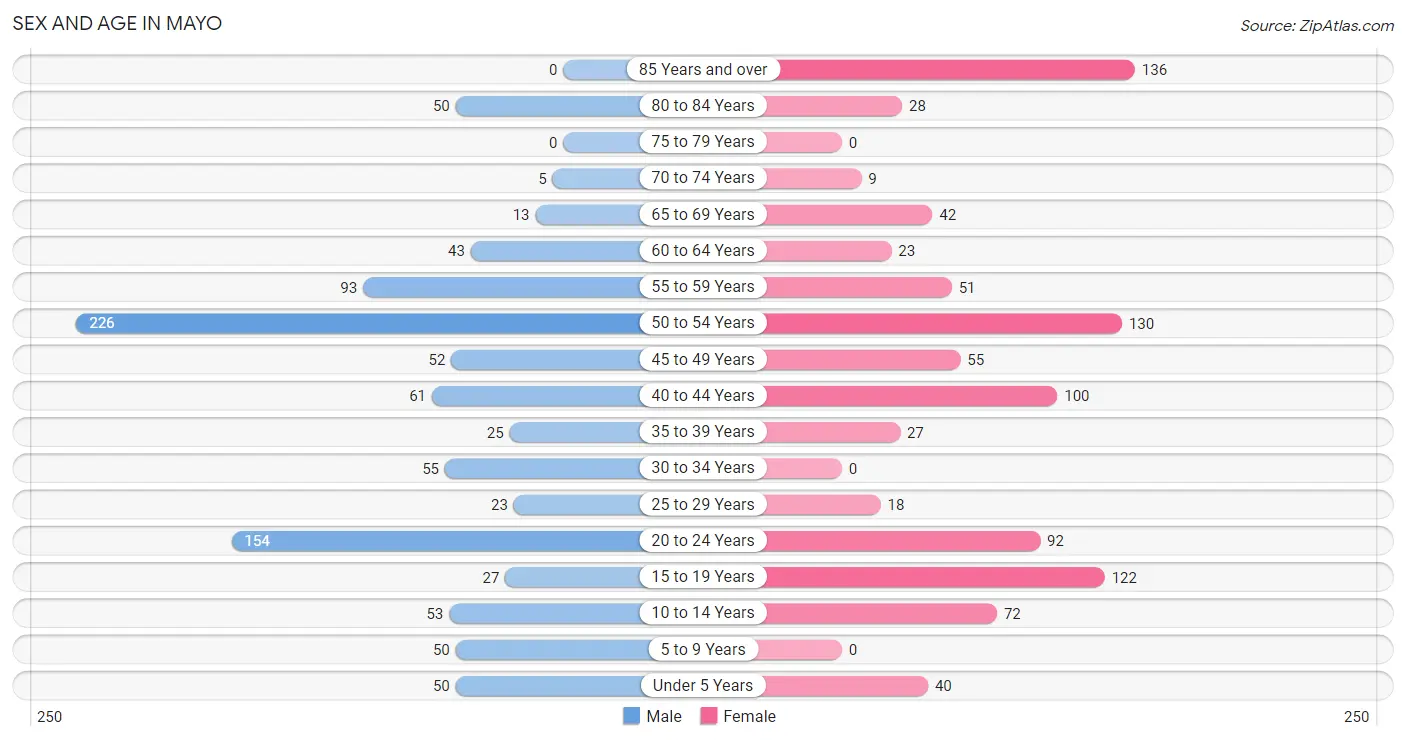
| Age Bracket | Male | Female |
| Under 5 Years | 50 (5.1%) | 40 (4.2%) |
| 5 to 9 Years | 50 (5.1%) | 0 (0.0%) |
| 10 to 14 Years | 53 (5.4%) | 72 (7.6%) |
| 15 to 19 Years | 27 (2.8%) | 122 (12.9%) |
| 20 to 24 Years | 154 (15.7%) | 92 (9.7%) |
| 25 to 29 Years | 23 (2.4%) | 18 (1.9%) |
| 30 to 34 Years | 55 (5.6%) | 0 (0.0%) |
| 35 to 39 Years | 25 (2.5%) | 27 (2.9%) |
| 40 to 44 Years | 61 (6.2%) | 100 (10.6%) |
| 45 to 49 Years | 52 (5.3%) | 55 (5.8%) |
| 50 to 54 Years | 226 (23.1%) | 130 (13.8%) |
| 55 to 59 Years | 93 (9.5%) | 51 (5.4%) |
| 60 to 64 Years | 43 (4.4%) | 23 (2.4%) |
| 65 to 69 Years | 13 (1.3%) | 42 (4.4%) |
| 70 to 74 Years | 5 (0.5%) | 9 (0.9%) |
| 75 to 79 Years | 0 (0.0%) | 0 (0.0%) |
| 80 to 84 Years | 50 (5.1%) | 28 (3.0%) |
| 85 Years and over | 0 (0.0%) | 136 (14.4%) |
| Total | 980 (100.0%) | 945 (100.0%) |
Families and Households in Mayo
Median Family Size in Mayo
The median family size in Mayo is 2.85 persons per family, with single female/mother families (69 | 12.3%) accounting for the largest median family size of 3.29 persons per family. On the other hand, single male/father families (119 | 21.2%) represent the smallest median family size with 2.06 persons per family.
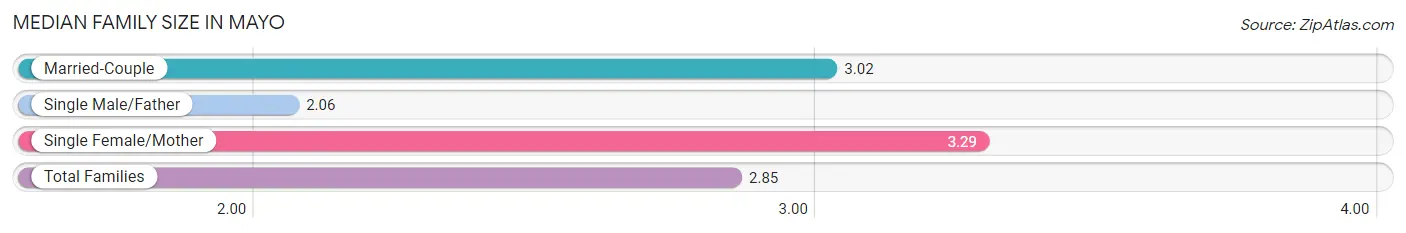
| Family Type | # Families | Family Size |
| Married-Couple | 374 (66.5%) | 3.02 |
| Single Male/Father | 119 (21.2%) | 2.06 |
| Single Female/Mother | 69 (12.3%) | 3.29 |
| Total Families | 562 (100.0%) | 2.85 |
Median Household Size in Mayo
The median household size in Mayo is 2.41 persons per household, with single female/mother households (69 | 8.6%) accounting for the largest median household size of 3.29 persons per household. non-family households (236 | 29.6%) represent the smallest median household size with 1.35 persons per household.
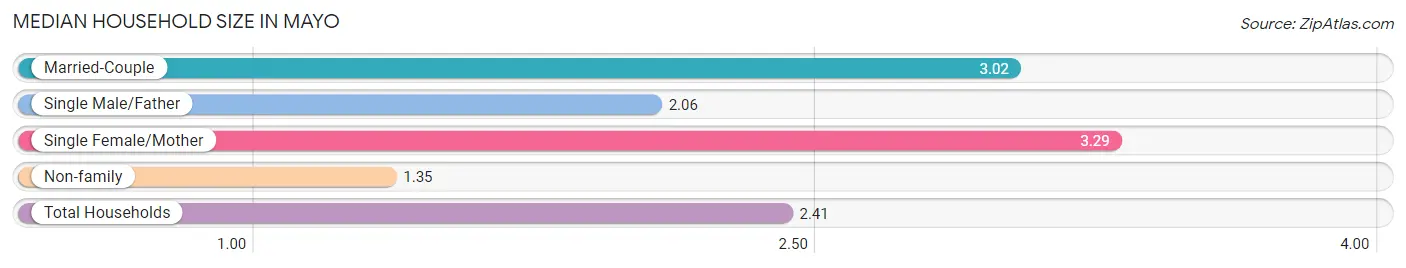
| Household Type | # Households | Household Size |
| Married-Couple | 374 (46.9%) | 3.02 |
| Single Male/Father | 119 (14.9%) | 2.06 |
| Single Female/Mother | 69 (8.6%) | 3.29 |
| Non-family | 236 (29.6%) | 1.35 |
| Total Households | 798 (100.0%) | 2.41 |
Household Size by Marriage Status in Mayo
Out of a total of 798 households in Mayo, 562 (70.4%) are family households, while 236 (29.6%) are nonfamily households. The most numerous type of family households are 2-person households, comprising 281, and the most common type of nonfamily households are 1-person households, comprising 162.
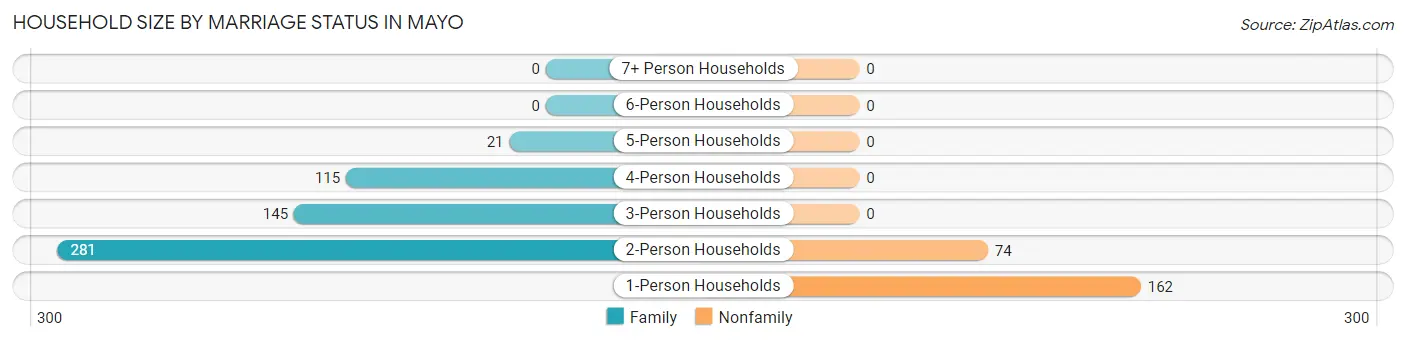
| Household Size | Family Households | Nonfamily Households |
| 1-Person Households | - | 162 (20.3%) |
| 2-Person Households | 281 (35.2%) | 74 (9.3%) |
| 3-Person Households | 145 (18.2%) | 0 (0.0%) |
| 4-Person Households | 115 (14.4%) | 0 (0.0%) |
| 5-Person Households | 21 (2.6%) | 0 (0.0%) |
| 6-Person Households | 0 (0.0%) | 0 (0.0%) |
| 7+ Person Households | 0 (0.0%) | 0 (0.0%) |
| Total | 562 (70.4%) | 236 (29.6%) |
Female Fertility in Mayo
Fertility by Age in Mayo
Average fertility rate in Mayo is 117.0 births per 1,000 women. Women in the age bracket of 20 to 34 years have the highest fertility rate with 500.0 births per 1,000 women. Women in the age bracket of 20 to 34 years acount for 100.0% of all women with births.
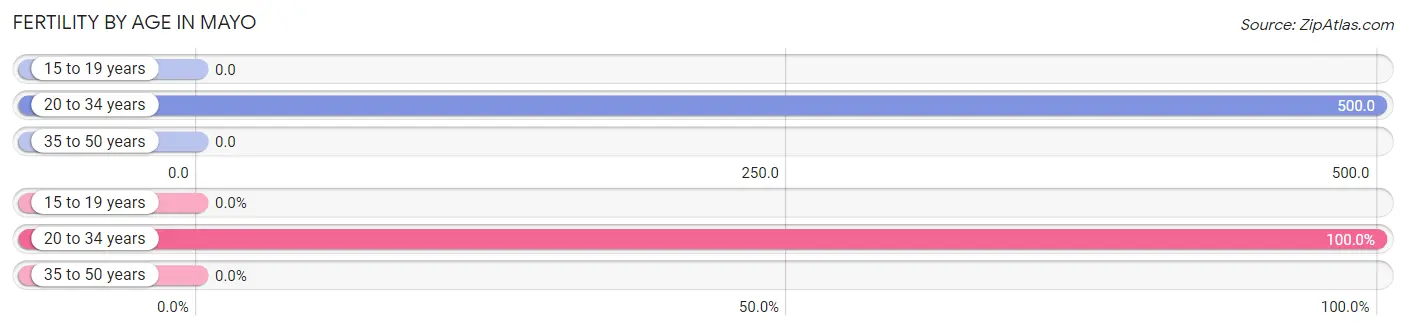
| Age Bracket | Women with Births | Births / 1,000 Women |
| 15 to 19 years | 0 (0.0%) | 0.0 |
| 20 to 34 years | 55 (100.0%) | 500.0 |
| 35 to 50 years | 0 (0.0%) | 0.0 |
| Total | 55 (100.0%) | 117.0 |
Fertility by Age by Marriage Status in Mayo
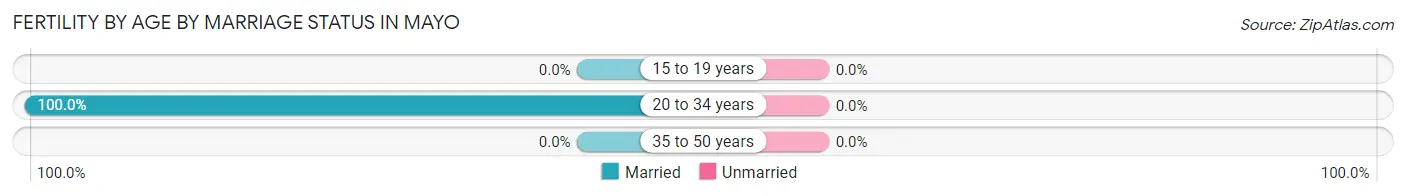
| Age Bracket | Married | Unmarried |
| 15 to 19 years | 0 (0.0%) | 0 (0.0%) |
| 20 to 34 years | 55 (100.0%) | 0 (0.0%) |
| 35 to 50 years | 0 (0.0%) | 0 (0.0%) |
| Total | 55 (100.0%) | 0 (0.0%) |
Fertility by Education in Mayo
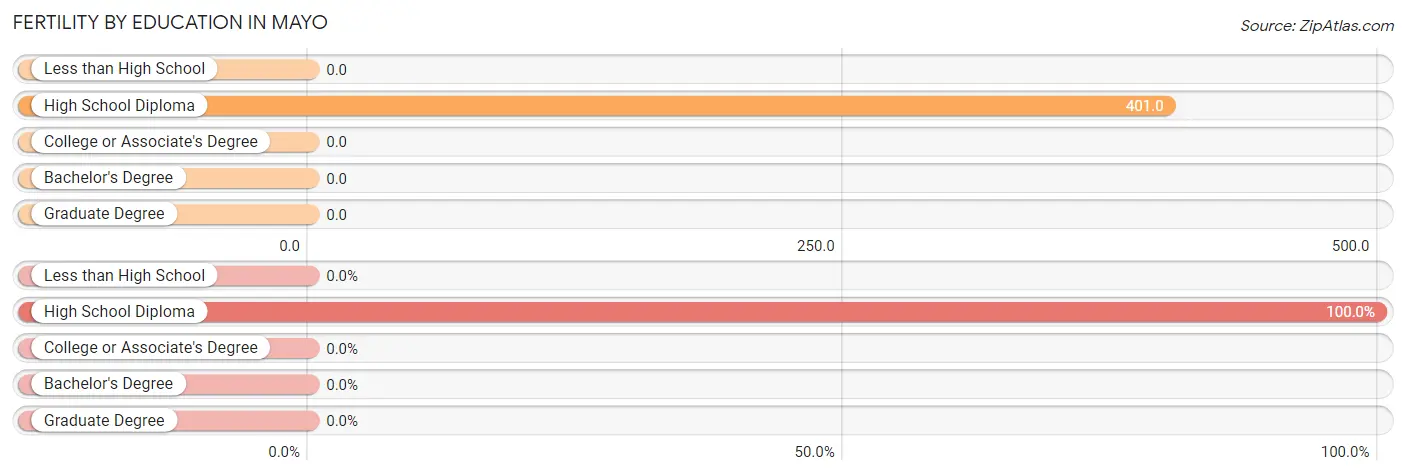
| Educational Attainment | Women with Births | Births / 1,000 Women |
| Less than High School | 0 (0.0%) | 0.0 |
| High School Diploma | 55 (100.0%) | 401.0 |
| College or Associate's Degree | 0 (0.0%) | 0.0 |
| Bachelor's Degree | 0 (0.0%) | 0.0 |
| Graduate Degree | 0 (0.0%) | 0.0 |
| Total | 55 (100.0%) | 117.0 |
Fertility by Education by Marriage Status in Mayo
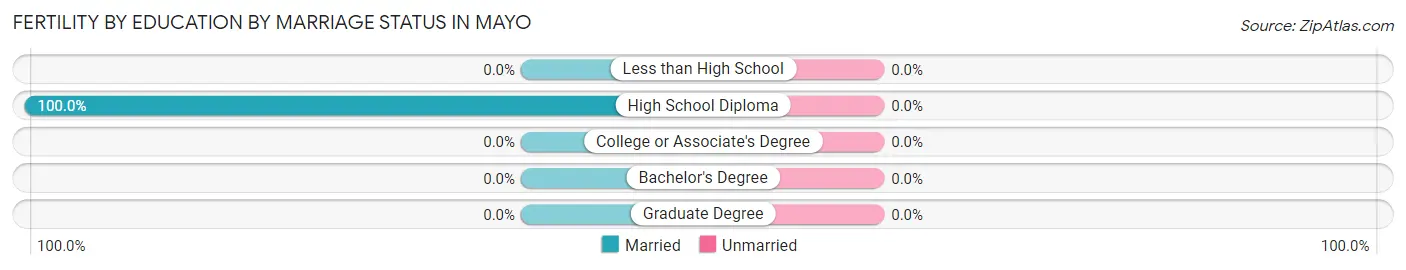
| Educational Attainment | Married | Unmarried |
| Less than High School | 0 (0.0%) | 0 (0.0%) |
| High School Diploma | 55 (100.0%) | 0 (0.0%) |
| College or Associate's Degree | 0 (0.0%) | 0 (0.0%) |
| Bachelor's Degree | 0 (0.0%) | 0 (0.0%) |
| Graduate Degree | 0 (0.0%) | 0 (0.0%) |
| Total | 55 (100.0%) | 0 (0.0%) |
Employment Characteristics in Mayo
Employment by Class of Employer in Mayo
Among the 1,079 employed individuals in Mayo, private company employees (773 | 71.6%), self-employed (incorporated) (102 | 9.5%), and state government employees (94 | 8.7%) make up the most common classes of employment.
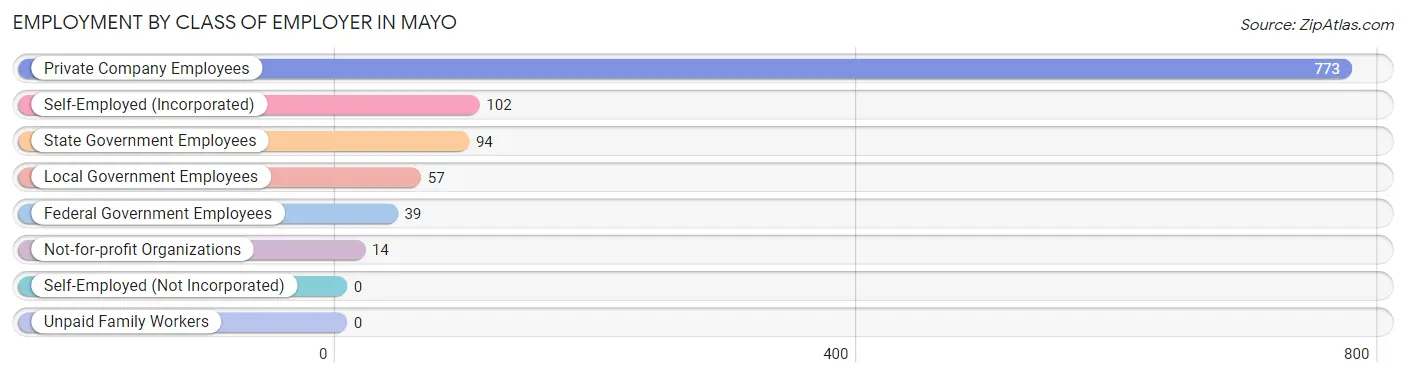
| Employer Class | # Employees | % Employees |
| Private Company Employees | 773 | 71.6% |
| Self-Employed (Incorporated) | 102 | 9.5% |
| Self-Employed (Not Incorporated) | 0 | 0.0% |
| Not-for-profit Organizations | 14 | 1.3% |
| Local Government Employees | 57 | 5.3% |
| State Government Employees | 94 | 8.7% |
| Federal Government Employees | 39 | 3.6% |
| Unpaid Family Workers | 0 | 0.0% |
| Total | 1,079 | 100.0% |
Employment Status by Age in Mayo
According to the labor force statistics for Mayo, out of the total population over 16 years of age (1,660), 67.2% or 1,116 individuals are in the labor force, with 3.3% or 37 of them unemployed. The age group with the highest labor force participation rate is 25 to 29 years, with 100.0% or 41 individuals in the labor force. Within the labor force, the 25 to 29 years age range has the highest percentage of unemployed individuals, with 43.9% or 18 of them being unemployed.
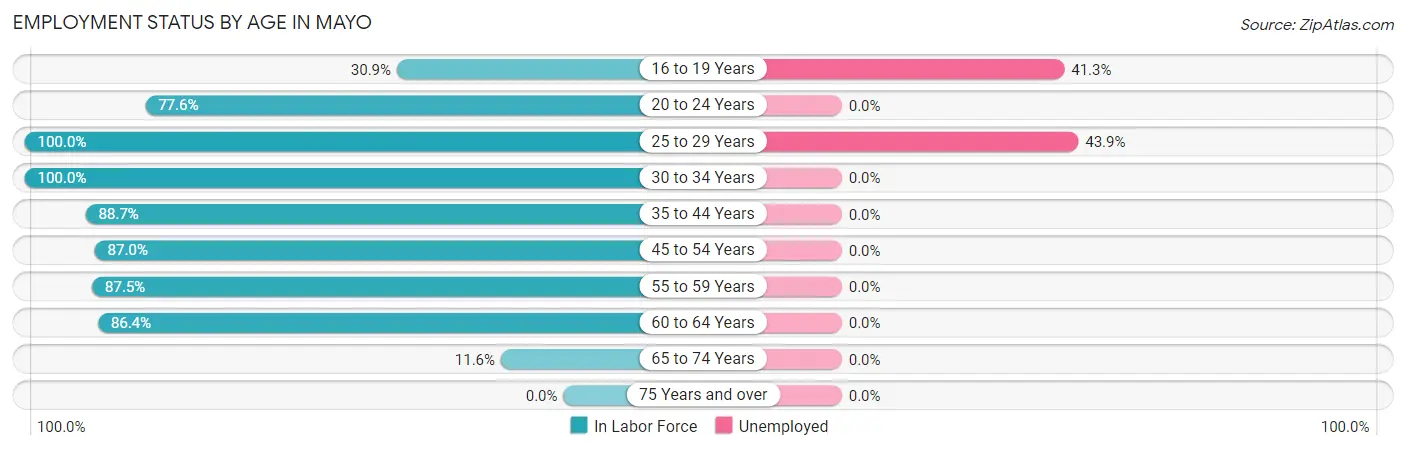
| Age Bracket | In Labor Force | Unemployed |
| 16 to 19 Years | 46 (30.9%) | 19 (41.3%) |
| 20 to 24 Years | 191 (77.6%) | 0 (0.0%) |
| 25 to 29 Years | 41 (100.0%) | 18 (43.9%) |
| 30 to 34 Years | 55 (100.0%) | 0 (0.0%) |
| 35 to 44 Years | 189 (88.7%) | 0 (0.0%) |
| 45 to 54 Years | 403 (87.0%) | 0 (0.0%) |
| 55 to 59 Years | 126 (87.5%) | 0 (0.0%) |
| 60 to 64 Years | 57 (86.4%) | 0 (0.0%) |
| 65 to 74 Years | 8 (11.6%) | 0 (0.0%) |
| 75 Years and over | 0 (0.0%) | 0 (0.0%) |
| Total | 1,116 (67.2%) | 37 (3.3%) |
Employment Status by Educational Attainment in Mayo
According to labor force statistics for Mayo, 88.7% of individuals (871) out of the total population between 25 and 64 years of age (982) are in the labor force, with 2.1% or 18 of them being unemployed. The group with the highest labor force participation rate are those with the educational attainment of college / associate degree, with 100.0% or 347 individuals in the labor force. Within the labor force, individuals with college / associate degree education have the highest percentage of unemployment, with 5.2% or 18 of them being unemployed.
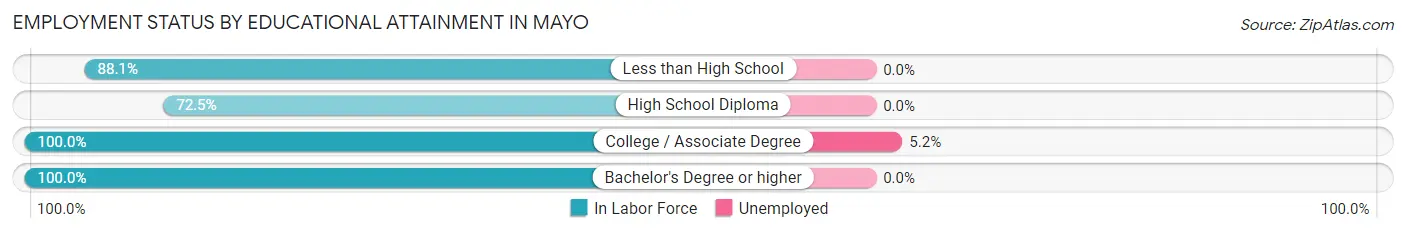
| Educational Attainment | In Labor Force | Unemployed |
| Less than High School | 119 (88.1%) | 0 (0.0%) |
| High School Diploma | 250 (72.5%) | 0 (0.0%) |
| College / Associate Degree | 347 (100.0%) | 18 (5.2%) |
| Bachelor's Degree or higher | 155 (100.0%) | 0 (0.0%) |
| Total | 871 (88.7%) | 21 (2.1%) |
Employment Occupations by Sex in Mayo
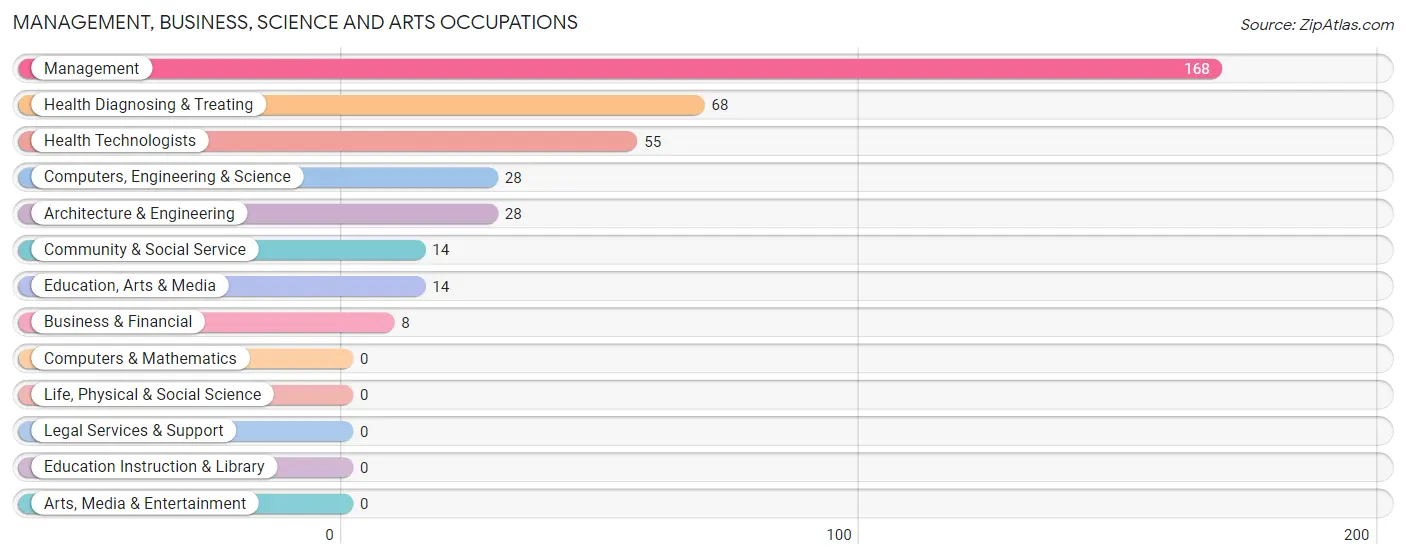
Management, Business, Science and Arts Occupations
The most common Management, Business, Science and Arts occupations in Mayo are Management (168 | 15.6%), Health Diagnosing & Treating (68 | 6.3%), Health Technologists (55 | 5.1%), Computers, Engineering & Science (28 | 2.6%), and Architecture & Engineering (28 | 2.6%).
Management, Business, Science and Arts Occupations by Sex
Within the Management, Business, Science and Arts occupations in Mayo, the most male-oriented occupations are Computers, Engineering & Science (100.0%), Architecture & Engineering (100.0%), and Management (89.3%), while the most female-oriented occupations are Business & Financial (100.0%), Community & Social Service (100.0%), and Education, Arts & Media (100.0%).
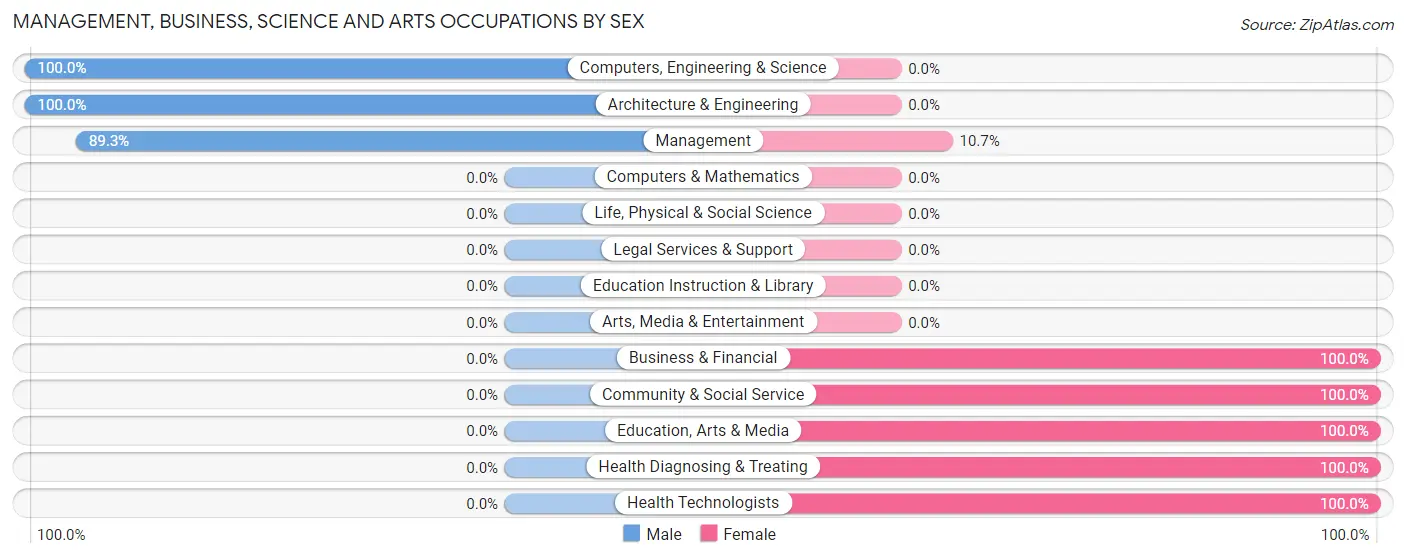
| Occupation | Male | Female |
| Management | 150 (89.3%) | 18 (10.7%) |
| Business & Financial | 0 (0.0%) | 8 (100.0%) |
| Computers, Engineering & Science | 28 (100.0%) | 0 (0.0%) |
| Computers & Mathematics | 0 (0.0%) | 0 (0.0%) |
| Architecture & Engineering | 28 (100.0%) | 0 (0.0%) |
| Life, Physical & Social Science | 0 (0.0%) | 0 (0.0%) |
| Community & Social Service | 0 (0.0%) | 14 (100.0%) |
| Education, Arts & Media | 0 (0.0%) | 14 (100.0%) |
| Legal Services & Support | 0 (0.0%) | 0 (0.0%) |
| Education Instruction & Library | 0 (0.0%) | 0 (0.0%) |
| Arts, Media & Entertainment | 0 (0.0%) | 0 (0.0%) |
| Health Diagnosing & Treating | 0 (0.0%) | 68 (100.0%) |
| Health Technologists | 0 (0.0%) | 55 (100.0%) |
| Total (Category) | 178 (62.2%) | 108 (37.8%) |
| Total (Overall) | 689 (63.9%) | 390 (36.1%) |
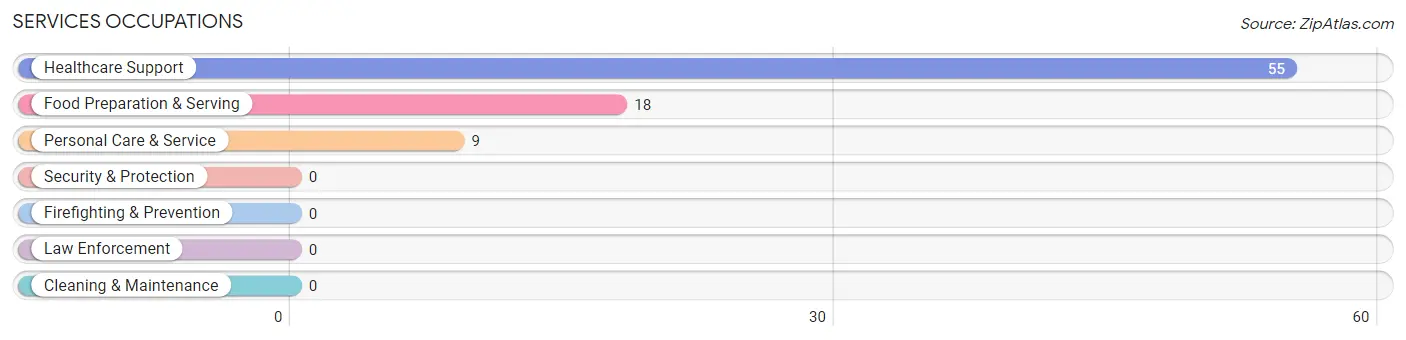
Services Occupations
The most common Services occupations in Mayo are Healthcare Support (55 | 5.1%), Food Preparation & Serving (18 | 1.7%), and Personal Care & Service (9 | 0.8%).
Services Occupations by Sex
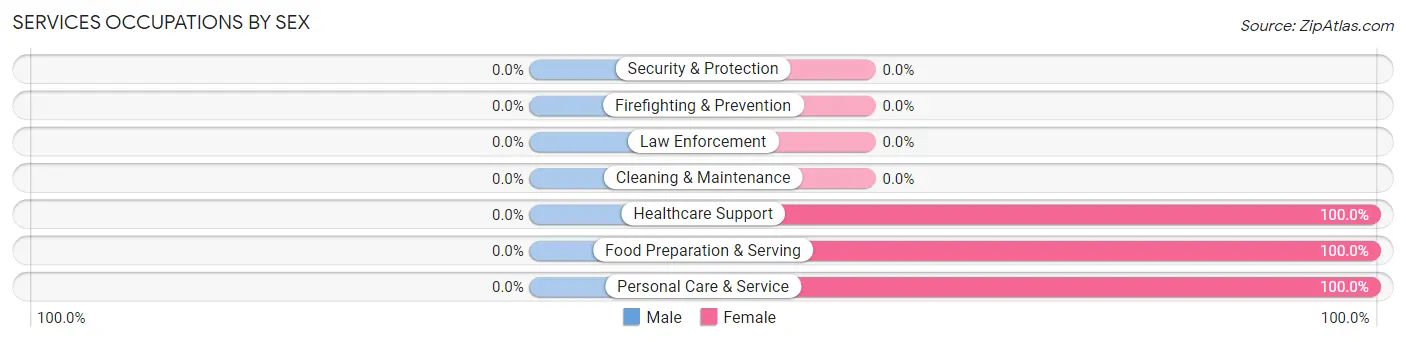
| Occupation | Male | Female |
| Healthcare Support | 0 (0.0%) | 55 (100.0%) |
| Security & Protection | 0 (0.0%) | 0 (0.0%) |
| Firefighting & Prevention | 0 (0.0%) | 0 (0.0%) |
| Law Enforcement | 0 (0.0%) | 0 (0.0%) |
| Food Preparation & Serving | 0 (0.0%) | 18 (100.0%) |
| Cleaning & Maintenance | 0 (0.0%) | 0 (0.0%) |
| Personal Care & Service | 0 (0.0%) | 9 (100.0%) |
| Total (Category) | 0 (0.0%) | 82 (100.0%) |
| Total (Overall) | 689 (63.9%) | 390 (36.1%) |
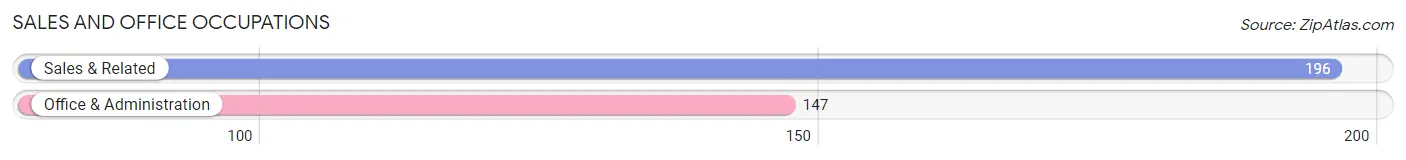
Sales and Office Occupations
The most common Sales and Office occupations in Mayo are Sales & Related (196 | 18.2%), and Office & Administration (147 | 13.6%).
Sales and Office Occupations by Sex
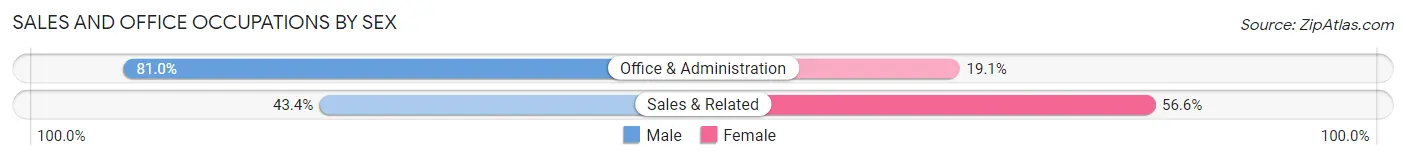
| Occupation | Male | Female |
| Sales & Related | 85 (43.4%) | 111 (56.6%) |
| Office & Administration | 119 (80.9%) | 28 (19.1%) |
| Total (Category) | 204 (59.5%) | 139 (40.5%) |
| Total (Overall) | 689 (63.9%) | 390 (36.1%) |
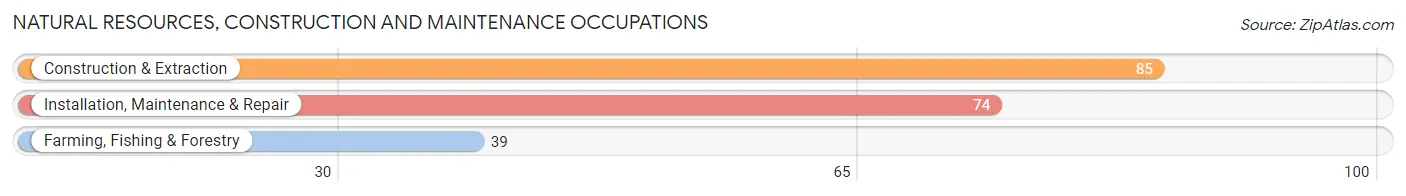
Natural Resources, Construction and Maintenance Occupations
The most common Natural Resources, Construction and Maintenance occupations in Mayo are Construction & Extraction (85 | 7.9%), Installation, Maintenance & Repair (74 | 6.9%), and Farming, Fishing & Forestry (39 | 3.6%).
Natural Resources, Construction and Maintenance Occupations by Sex
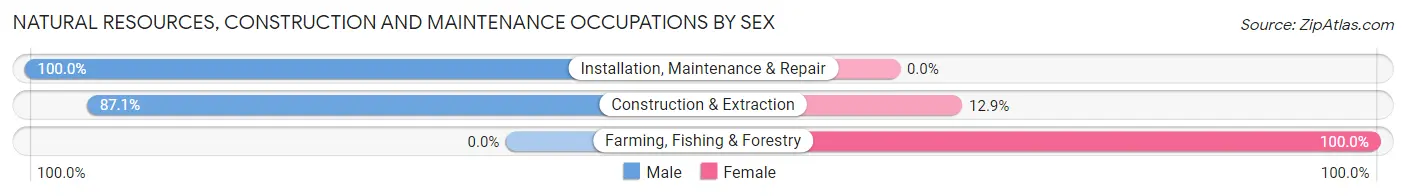
| Occupation | Male | Female |
| Farming, Fishing & Forestry | 0 (0.0%) | 39 (100.0%) |
| Construction & Extraction | 74 (87.1%) | 11 (12.9%) |
| Installation, Maintenance & Repair | 74 (100.0%) | 0 (0.0%) |
| Total (Category) | 148 (74.8%) | 50 (25.3%) |
| Total (Overall) | 689 (63.9%) | 390 (36.1%) |
Production, Transportation and Moving Occupations
The most common Production, Transportation and Moving occupations in Mayo are Production (103 | 9.6%), Material Moving (58 | 5.4%), and Transportation (9 | 0.8%).
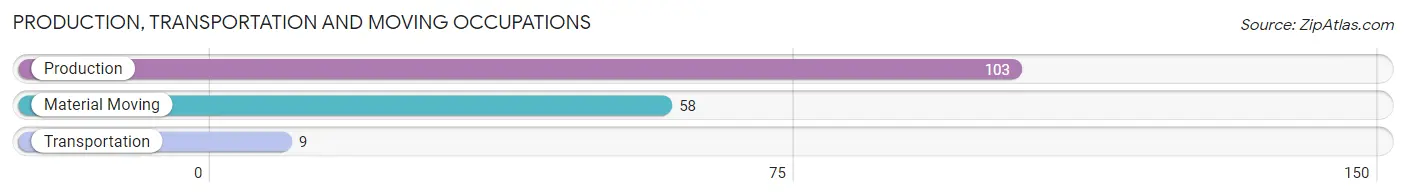
Production, Transportation and Moving Occupations by Sex
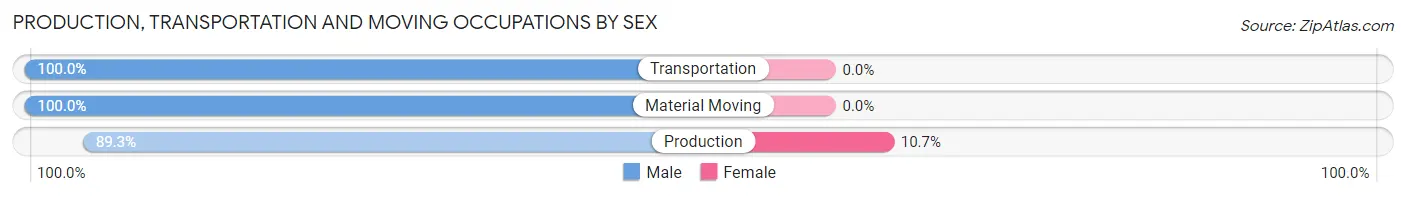
| Occupation | Male | Female |
| Production | 92 (89.3%) | 11 (10.7%) |
| Transportation | 9 (100.0%) | 0 (0.0%) |
| Material Moving | 58 (100.0%) | 0 (0.0%) |
| Total (Category) | 159 (93.5%) | 11 (6.5%) |
| Total (Overall) | 689 (63.9%) | 390 (36.1%) |
Employment Industries by Sex in Mayo
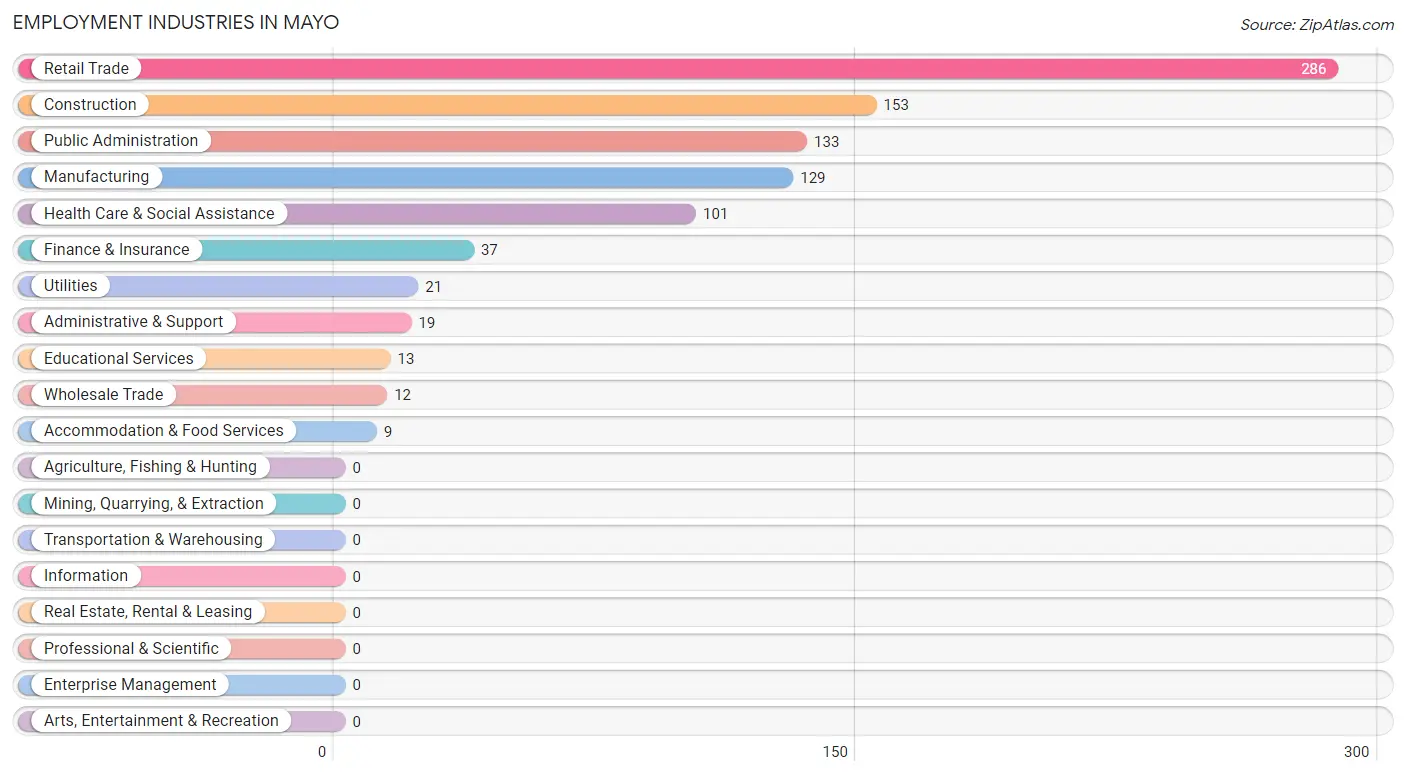
Employment Industries in Mayo
The major employment industries in Mayo include Retail Trade (286 | 26.5%), Construction (153 | 14.2%), Public Administration (133 | 12.3%), Manufacturing (129 | 12.0%), and Health Care & Social Assistance (101 | 9.4%).
Employment Industries by Sex in Mayo
The Mayo industries that see more men than women are Construction (100.0%), Wholesale Trade (100.0%), and Administrative & Support (100.0%), whereas the industries that tend to have a higher number of women are Finance & Insurance (100.0%), Educational Services (100.0%), and Health Care & Social Assistance (100.0%).
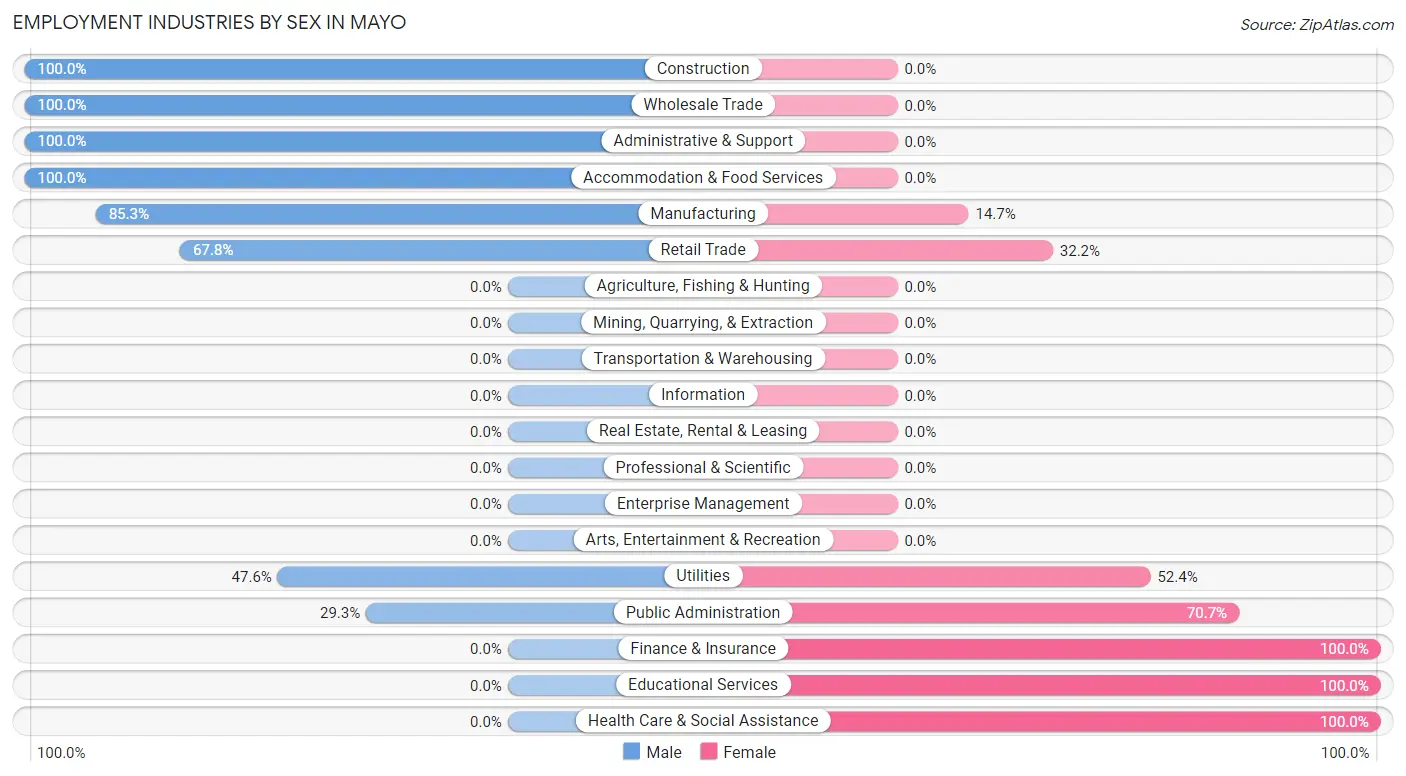
| Industry | Male | Female |
| Agriculture, Fishing & Hunting | 0 (0.0%) | 0 (0.0%) |
| Mining, Quarrying, & Extraction | 0 (0.0%) | 0 (0.0%) |
| Construction | 153 (100.0%) | 0 (0.0%) |
| Manufacturing | 110 (85.3%) | 19 (14.7%) |
| Wholesale Trade | 12 (100.0%) | 0 (0.0%) |
| Retail Trade | 194 (67.8%) | 92 (32.2%) |
| Transportation & Warehousing | 0 (0.0%) | 0 (0.0%) |
| Utilities | 10 (47.6%) | 11 (52.4%) |
| Information | 0 (0.0%) | 0 (0.0%) |
| Finance & Insurance | 0 (0.0%) | 37 (100.0%) |
| Real Estate, Rental & Leasing | 0 (0.0%) | 0 (0.0%) |
| Professional & Scientific | 0 (0.0%) | 0 (0.0%) |
| Enterprise Management | 0 (0.0%) | 0 (0.0%) |
| Administrative & Support | 19 (100.0%) | 0 (0.0%) |
| Educational Services | 0 (0.0%) | 13 (100.0%) |
| Health Care & Social Assistance | 0 (0.0%) | 101 (100.0%) |
| Arts, Entertainment & Recreation | 0 (0.0%) | 0 (0.0%) |
| Accommodation & Food Services | 9 (100.0%) | 0 (0.0%) |
| Public Administration | 39 (29.3%) | 94 (70.7%) |
| Total | 689 (63.9%) | 390 (36.1%) |
Education in Mayo
School Enrollment in Mayo
The most common levels of schooling among the 397 students in Mayo are high school (122 | 30.7%), middle school (115 | 29.0%), and college / undergraduate (100 | 25.2%).
| School Level | # Students | % Students |
| Nursery / Preschool | 0 | 0.0% |
| Kindergarten | 0 | 0.0% |
| Elementary School | 60 | 15.1% |
| Middle School | 115 | 29.0% |
| High School | 122 | 30.7% |
| College / Undergraduate | 100 | 25.2% |
| Graduate / Professional | 0 | 0.0% |
| Total | 397 | 100.0% |
School Enrollment by Age by Funding Source in Mayo
Out of a total of 397 students who are enrolled in schools in Mayo, 77 (19.4%) attend a private institution, while the remaining 320 (80.6%) are enrolled in public schools. The age group of 35 years and over has the highest likelihood of being enrolled in private schools, with 33 (100.0% in the age bracket) enrolled. Conversely, the age group of 18 to 19 year olds has the lowest likelihood of being enrolled in a private school, with 9 (100.0% in the age bracket) attending a public institution.
| Age Bracket | Public School | Private School |
| 3 to 4 Year Olds | 0 (0.0%) | 0 (0.0%) |
| 5 to 9 Year Old | 37 (74.0%) | 13 (26.0%) |
| 10 to 14 Year Olds | 112 (89.6%) | 13 (10.4%) |
| 15 to 17 Year Olds | 104 (85.3%) | 18 (14.7%) |
| 18 to 19 Year Olds | 9 (100.0%) | 0 (0.0%) |
| 20 to 24 Year Olds | 58 (100.0%) | 0 (0.0%) |
| 25 to 34 Year Olds | 0 (0.0%) | 0 (0.0%) |
| 35 Years and over | 0 (0.0%) | 33 (100.0%) |
| Total | 320 (80.6%) | 77 (19.4%) |
Educational Attainment by Field of Study in Mayo
Education (55 | 33.7%), physical & health sciences (52 | 31.9%), engineering (18 | 11.0%), science & technology (16 | 9.8%), and liberal arts & history (14 | 8.6%) are the most common fields of study among 163 individuals in Mayo who have obtained a bachelor's degree or higher.
| Field of Study | # Graduates | % Graduates |
| Computers & Mathematics | 0 | 0.0% |
| Bio, Nature & Agricultural | 0 | 0.0% |
| Physical & Health Sciences | 52 | 31.9% |
| Psychology | 0 | 0.0% |
| Social Sciences | 0 | 0.0% |
| Engineering | 18 | 11.0% |
| Multidisciplinary Studies | 0 | 0.0% |
| Science & Technology | 16 | 9.8% |
| Business | 8 | 4.9% |
| Education | 55 | 33.7% |
| Literature & Languages | 0 | 0.0% |
| Liberal Arts & History | 14 | 8.6% |
| Visual & Performing Arts | 0 | 0.0% |
| Communications | 0 | 0.0% |
| Arts & Humanities | 0 | 0.0% |
| Total | 163 | 100.0% |
Transportation & Commute in Mayo
Vehicle Availability by Sex in Mayo
The most prevalent vehicle ownership categories in Mayo are males with 2 vehicles (307, accounting for 44.6%) and females with 2 vehicles (163, making up 78.7%).
| Vehicles Available | Male | Female |
| No Vehicle | 0 (0.0%) | 0 (0.0%) |
| 1 Vehicle | 103 (14.9%) | 37 (9.5%) |
| 2 Vehicles | 307 (44.6%) | 163 (41.8%) |
| 3 Vehicles | 29 (4.2%) | 0 (0.0%) |
| 4 Vehicles | 231 (33.5%) | 179 (45.9%) |
| 5 or more Vehicles | 19 (2.8%) | 11 (2.8%) |
| Total | 689 (100.0%) | 390 (100.0%) |
Commute Time in Mayo
The most frequently occuring commute durations in Mayo are 20 to 24 minutes (408 commuters, 39.2%), 30 to 34 minutes (207 commuters, 19.9%), and 25 to 29 minutes (158 commuters, 15.2%).
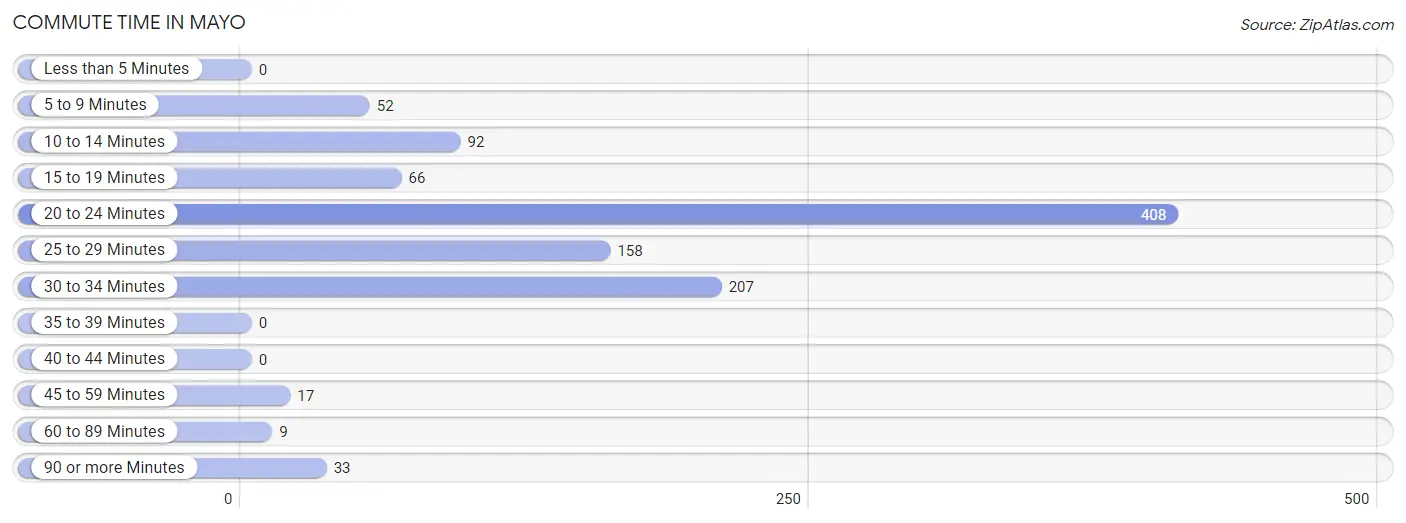
| Commute Time | # Commuters | % Commuters |
| Less than 5 Minutes | 0 | 0.0% |
| 5 to 9 Minutes | 52 | 5.0% |
| 10 to 14 Minutes | 92 | 8.8% |
| 15 to 19 Minutes | 66 | 6.3% |
| 20 to 24 Minutes | 408 | 39.2% |
| 25 to 29 Minutes | 158 | 15.2% |
| 30 to 34 Minutes | 207 | 19.9% |
| 35 to 39 Minutes | 0 | 0.0% |
| 40 to 44 Minutes | 0 | 0.0% |
| 45 to 59 Minutes | 17 | 1.6% |
| 60 to 89 Minutes | 9 | 0.9% |
| 90 or more Minutes | 33 | 3.2% |
Commute Time by Sex in Mayo
The most common commute times in Mayo are 20 to 24 minutes (248 commuters, 36.0%) for males and 20 to 24 minutes (160 commuters, 45.3%) for females.
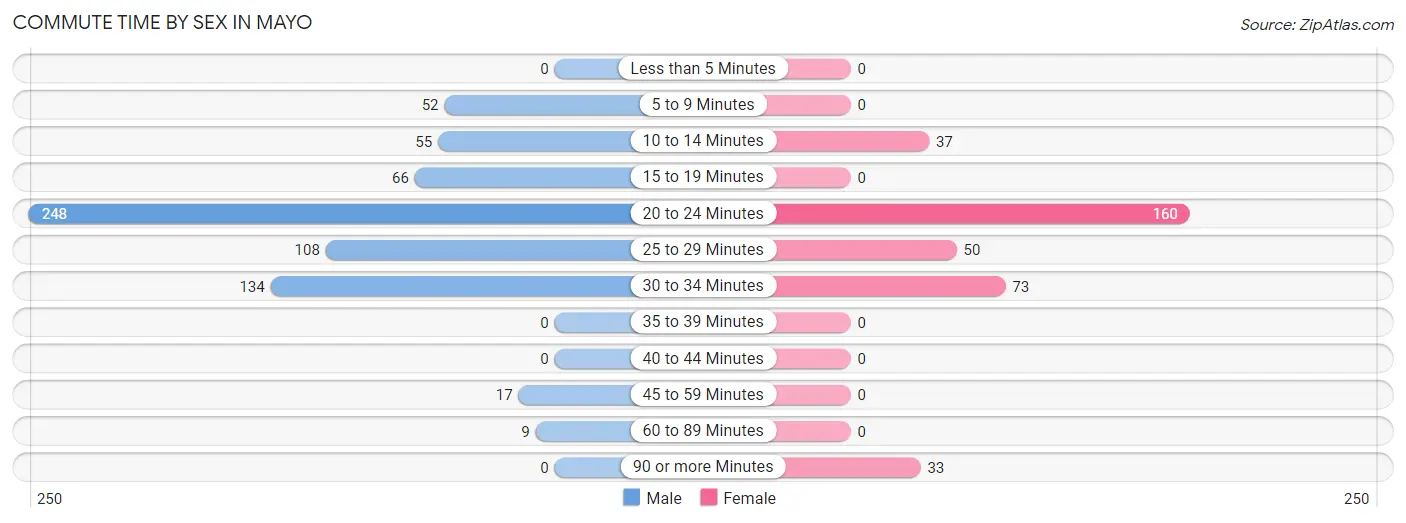
| Commute Time | Male | Female |
| Less than 5 Minutes | 0 (0.0%) | 0 (0.0%) |
| 5 to 9 Minutes | 52 (7.5%) | 0 (0.0%) |
| 10 to 14 Minutes | 55 (8.0%) | 37 (10.5%) |
| 15 to 19 Minutes | 66 (9.6%) | 0 (0.0%) |
| 20 to 24 Minutes | 248 (36.0%) | 160 (45.3%) |
| 25 to 29 Minutes | 108 (15.7%) | 50 (14.2%) |
| 30 to 34 Minutes | 134 (19.5%) | 73 (20.7%) |
| 35 to 39 Minutes | 0 (0.0%) | 0 (0.0%) |
| 40 to 44 Minutes | 0 (0.0%) | 0 (0.0%) |
| 45 to 59 Minutes | 17 (2.5%) | 0 (0.0%) |
| 60 to 89 Minutes | 9 (1.3%) | 0 (0.0%) |
| 90 or more Minutes | 0 (0.0%) | 33 (9.3%) |
Time of Departure to Work by Sex in Mayo
The most frequent times of departure to work in Mayo are 12:00 AM to 4:59 AM (204, 29.6%) for males and 7:30 AM to 7:59 AM (86, 24.4%) for females.
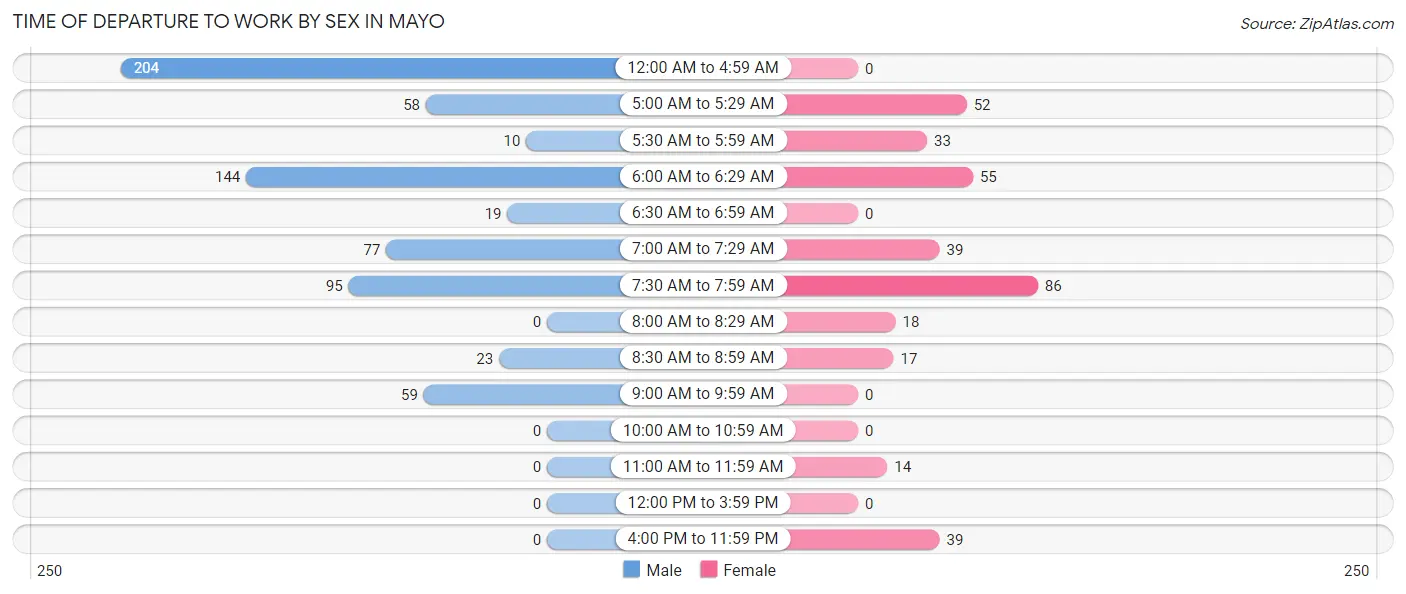
| Time of Departure | Male | Female |
| 12:00 AM to 4:59 AM | 204 (29.6%) | 0 (0.0%) |
| 5:00 AM to 5:29 AM | 58 (8.4%) | 52 (14.7%) |
| 5:30 AM to 5:59 AM | 10 (1.5%) | 33 (9.3%) |
| 6:00 AM to 6:29 AM | 144 (20.9%) | 55 (15.6%) |
| 6:30 AM to 6:59 AM | 19 (2.8%) | 0 (0.0%) |
| 7:00 AM to 7:29 AM | 77 (11.2%) | 39 (11.1%) |
| 7:30 AM to 7:59 AM | 95 (13.8%) | 86 (24.4%) |
| 8:00 AM to 8:29 AM | 0 (0.0%) | 18 (5.1%) |
| 8:30 AM to 8:59 AM | 23 (3.3%) | 17 (4.8%) |
| 9:00 AM to 9:59 AM | 59 (8.6%) | 0 (0.0%) |
| 10:00 AM to 10:59 AM | 0 (0.0%) | 0 (0.0%) |
| 11:00 AM to 11:59 AM | 0 (0.0%) | 14 (4.0%) |
| 12:00 PM to 3:59 PM | 0 (0.0%) | 0 (0.0%) |
| 4:00 PM to 11:59 PM | 0 (0.0%) | 39 (11.1%) |
| Total | 689 (100.0%) | 353 (100.0%) |
Housing Occupancy in Mayo
Occupancy by Ownership in Mayo
Of the total 798 dwellings in Mayo, owner-occupied units account for 730 (91.5%), while renter-occupied units make up 68 (8.5%).
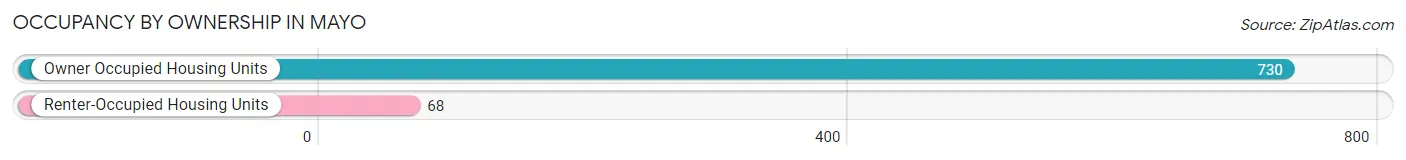
| Occupancy | # Housing Units | % Housing Units |
| Owner Occupied Housing Units | 730 | 91.5% |
| Renter-Occupied Housing Units | 68 | 8.5% |
| Total Occupied Housing Units | 798 | 100.0% |
Occupancy by Household Size in Mayo
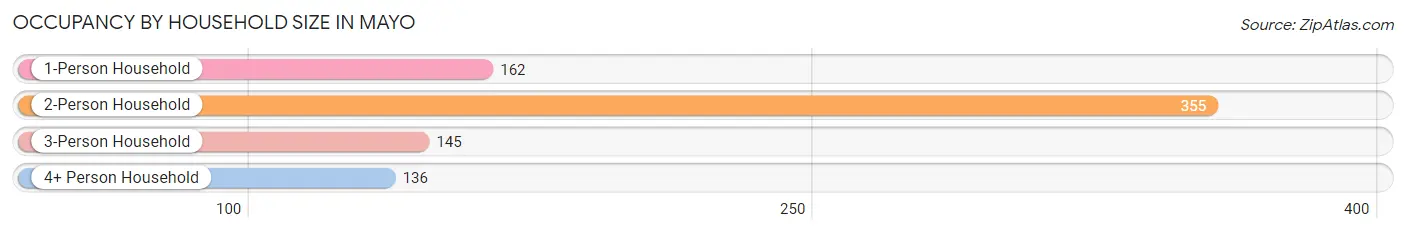
| Household Size | # Housing Units | % Housing Units |
| 1-Person Household | 162 | 20.3% |
| 2-Person Household | 355 | 44.5% |
| 3-Person Household | 145 | 18.2% |
| 4+ Person Household | 136 | 17.0% |
| Total Housing Units | 798 | 100.0% |
Occupancy by Ownership by Household Size in Mayo
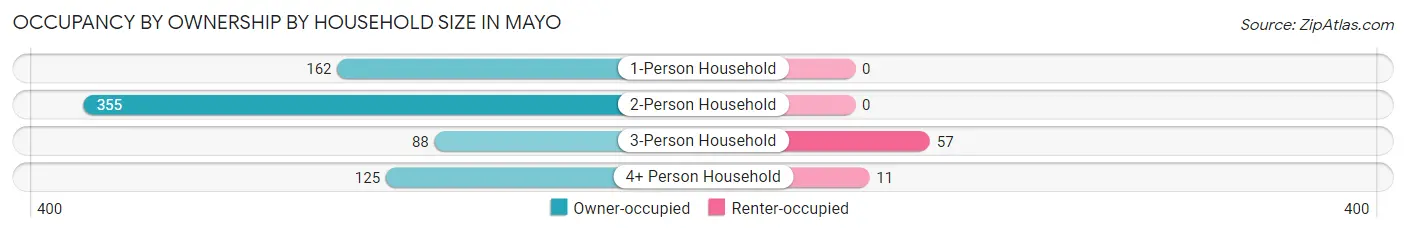
| Household Size | Owner-occupied | Renter-occupied |
| 1-Person Household | 162 (100.0%) | 0 (0.0%) |
| 2-Person Household | 355 (100.0%) | 0 (0.0%) |
| 3-Person Household | 88 (60.7%) | 57 (39.3%) |
| 4+ Person Household | 125 (91.9%) | 11 (8.1%) |
| Total Housing Units | 730 (91.5%) | 68 (8.5%) |
Occupancy by Educational Attainment in Mayo
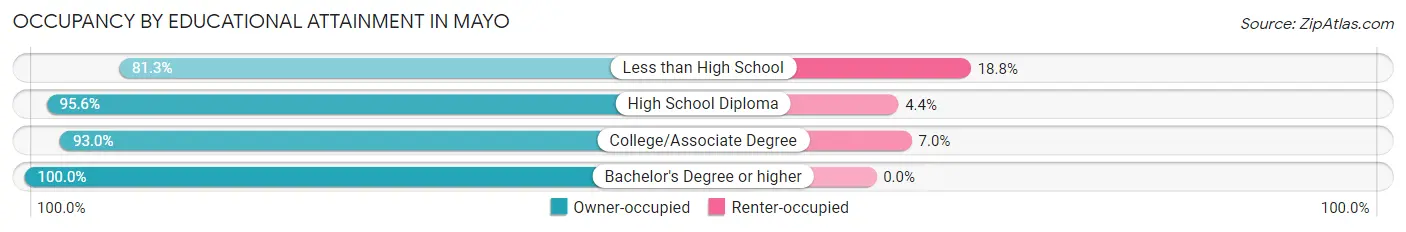
| Household Size | Owner-occupied | Renter-occupied |
| Less than High School | 169 (81.2%) | 39 (18.8%) |
| High School Diploma | 241 (95.6%) | 11 (4.4%) |
| College/Associate Degree | 238 (93.0%) | 18 (7.0%) |
| Bachelor's Degree or higher | 82 (100.0%) | 0 (0.0%) |
Occupancy by Age of Householder in Mayo
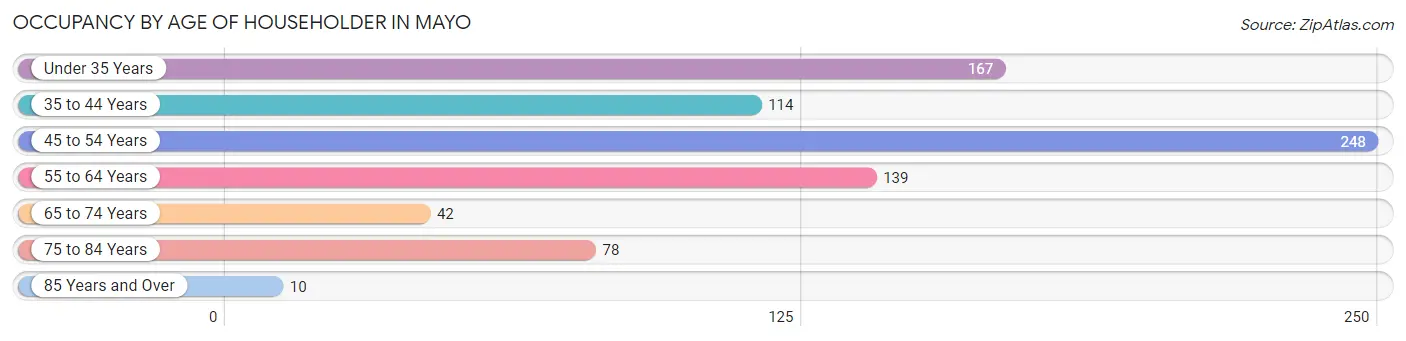
| Age Bracket | # Households | % Households |
| Under 35 Years | 167 | 20.9% |
| 35 to 44 Years | 114 | 14.3% |
| 45 to 54 Years | 248 | 31.1% |
| 55 to 64 Years | 139 | 17.4% |
| 65 to 74 Years | 42 | 5.3% |
| 75 to 84 Years | 78 | 9.8% |
| 85 Years and Over | 10 | 1.3% |
| Total | 798 | 100.0% |
Housing Finances in Mayo
Median Income by Occupancy in Mayo
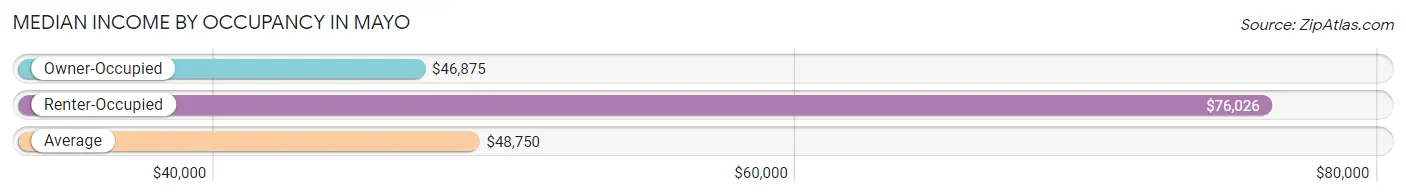
| Occupancy Type | # Households | Median Income |
| Owner-Occupied | 730 (91.5%) | $46,875 |
| Renter-Occupied | 68 (8.5%) | $76,026 |
| Average | 798 (100.0%) | $48,750 |
Occupancy by Householder Income Bracket in Mayo
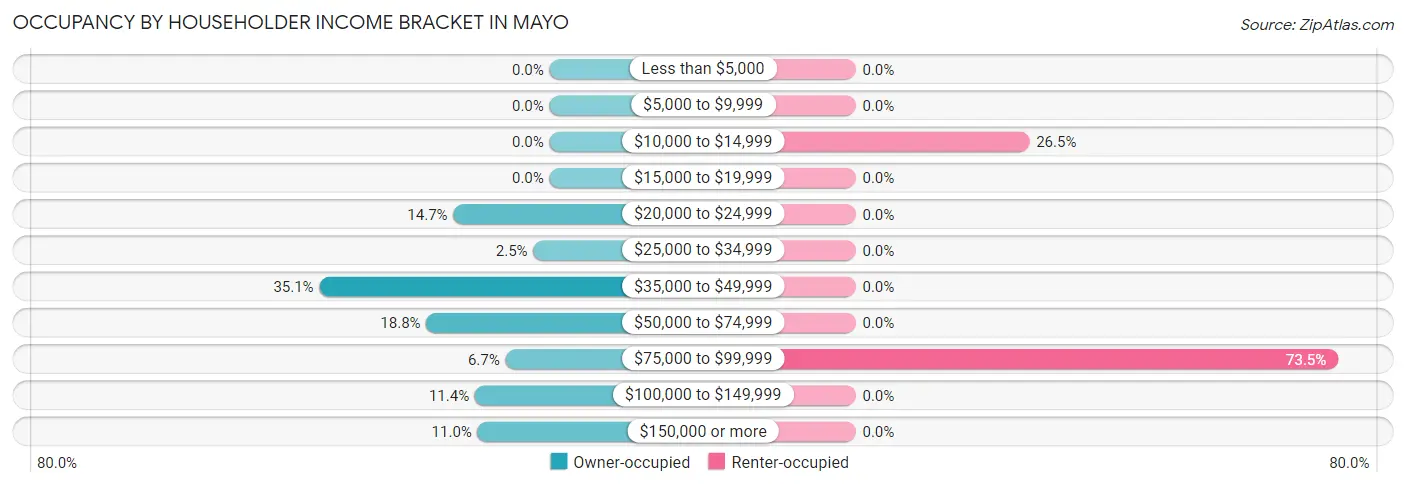
| Income Bracket | Owner-occupied | Renter-occupied |
| Less than $5,000 | 0 (0.0%) | 0 (0.0%) |
| $5,000 to $9,999 | 0 (0.0%) | 0 (0.0%) |
| $10,000 to $14,999 | 0 (0.0%) | 18 (26.5%) |
| $15,000 to $19,999 | 0 (0.0%) | 0 (0.0%) |
| $20,000 to $24,999 | 107 (14.7%) | 0 (0.0%) |
| $25,000 to $34,999 | 18 (2.5%) | 0 (0.0%) |
| $35,000 to $49,999 | 256 (35.1%) | 0 (0.0%) |
| $50,000 to $74,999 | 137 (18.8%) | 0 (0.0%) |
| $75,000 to $99,999 | 49 (6.7%) | 50 (73.5%) |
| $100,000 to $149,999 | 83 (11.4%) | 0 (0.0%) |
| $150,000 or more | 80 (11.0%) | 0 (0.0%) |
| Total | 730 (100.0%) | 68 (100.0%) |
Monthly Housing Cost Tiers in Mayo
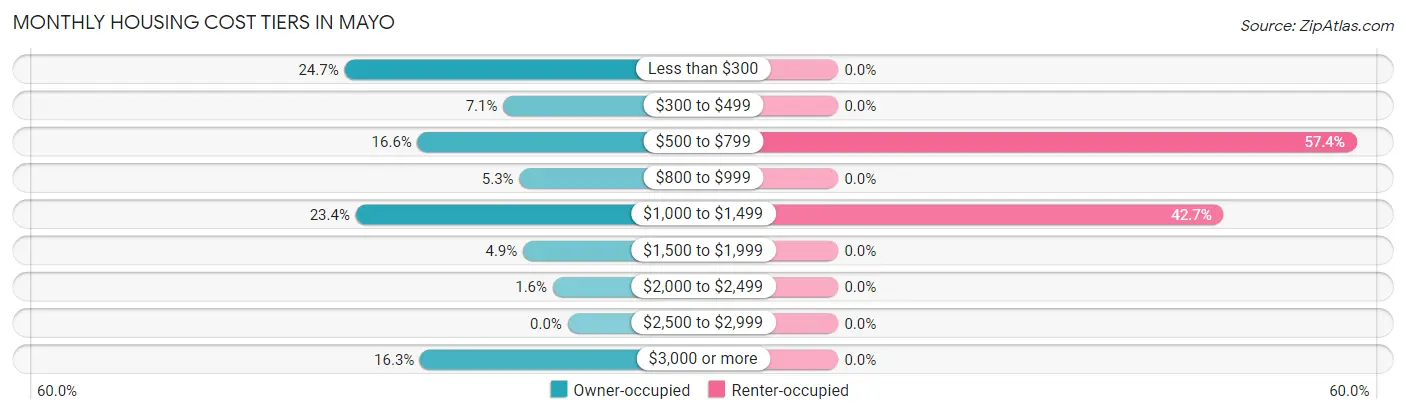
| Monthly Cost | Owner-occupied | Renter-occupied |
| Less than $300 | 180 (24.7%) | 0 (0.0%) |
| $300 to $499 | 52 (7.1%) | 0 (0.0%) |
| $500 to $799 | 121 (16.6%) | 39 (57.4%) |
| $800 to $999 | 39 (5.3%) | 0 (0.0%) |
| $1,000 to $1,499 | 171 (23.4%) | 29 (42.6%) |
| $1,500 to $1,999 | 36 (4.9%) | 0 (0.0%) |
| $2,000 to $2,499 | 12 (1.6%) | 0 (0.0%) |
| $2,500 to $2,999 | 0 (0.0%) | 0 (0.0%) |
| $3,000 or more | 119 (16.3%) | 0 (0.0%) |
| Total | 730 (100.0%) | 68 (100.0%) |
Physical Housing Characteristics in Mayo
Housing Structures in Mayo
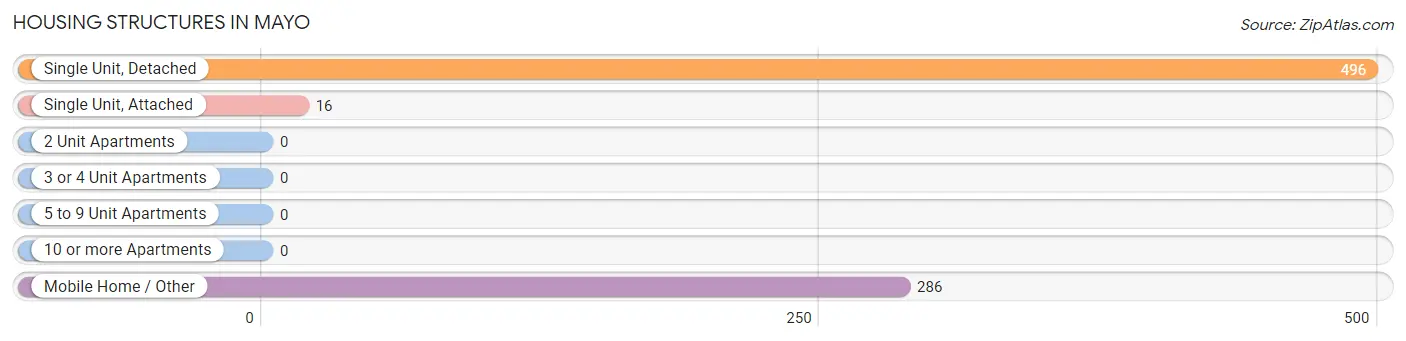
| Structure Type | # Housing Units | % Housing Units |
| Single Unit, Detached | 496 | 62.2% |
| Single Unit, Attached | 16 | 2.0% |
| 2 Unit Apartments | 0 | 0.0% |
| 3 or 4 Unit Apartments | 0 | 0.0% |
| 5 to 9 Unit Apartments | 0 | 0.0% |
| 10 or more Apartments | 0 | 0.0% |
| Mobile Home / Other | 286 | 35.8% |
| Total | 798 | 100.0% |
Housing Structures by Occupancy in Mayo
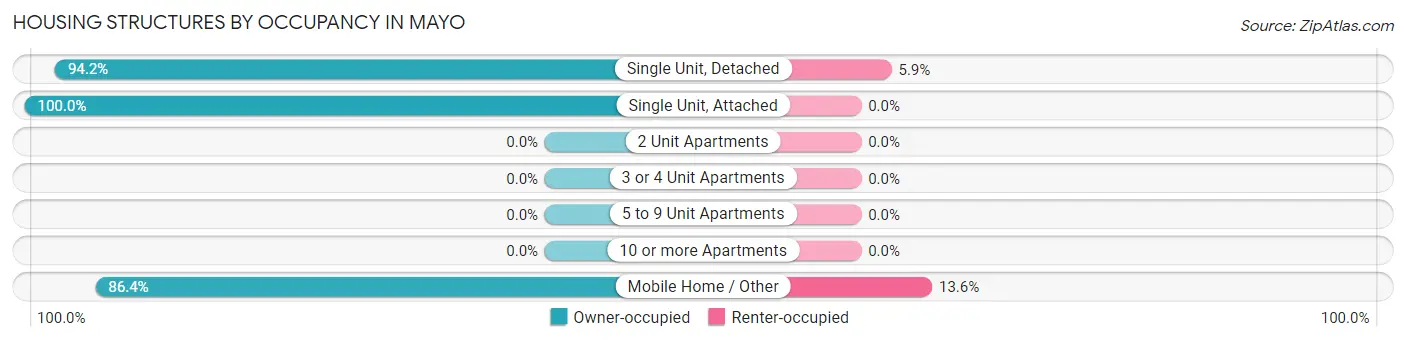
| Structure Type | Owner-occupied | Renter-occupied |
| Single Unit, Detached | 467 (94.2%) | 29 (5.9%) |
| Single Unit, Attached | 16 (100.0%) | 0 (0.0%) |
| 2 Unit Apartments | 0 (0.0%) | 0 (0.0%) |
| 3 or 4 Unit Apartments | 0 (0.0%) | 0 (0.0%) |
| 5 to 9 Unit Apartments | 0 (0.0%) | 0 (0.0%) |
| 10 or more Apartments | 0 (0.0%) | 0 (0.0%) |
| Mobile Home / Other | 247 (86.4%) | 39 (13.6%) |
| Total | 730 (91.5%) | 68 (8.5%) |
Housing Structures by Number of Rooms in Mayo
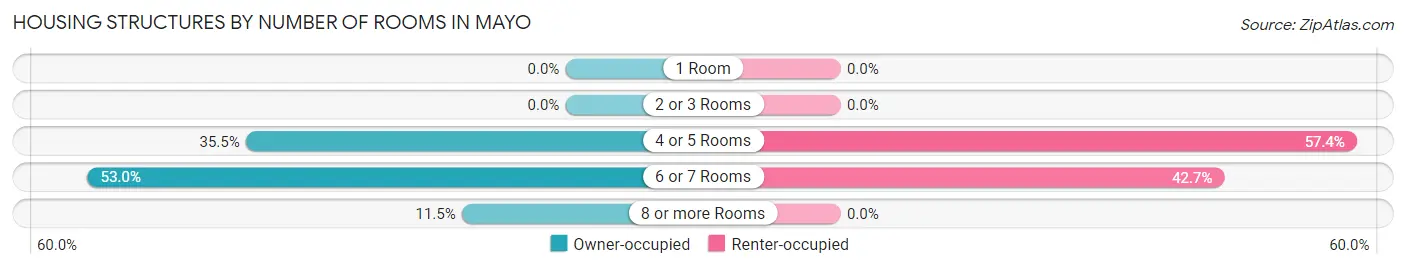
| Number of Rooms | Owner-occupied | Renter-occupied |
| 1 Room | 0 (0.0%) | 0 (0.0%) |
| 2 or 3 Rooms | 0 (0.0%) | 0 (0.0%) |
| 4 or 5 Rooms | 259 (35.5%) | 39 (57.4%) |
| 6 or 7 Rooms | 387 (53.0%) | 29 (42.6%) |
| 8 or more Rooms | 84 (11.5%) | 0 (0.0%) |
| Total | 730 (100.0%) | 68 (100.0%) |
Housing Structure by Heating Type in Mayo
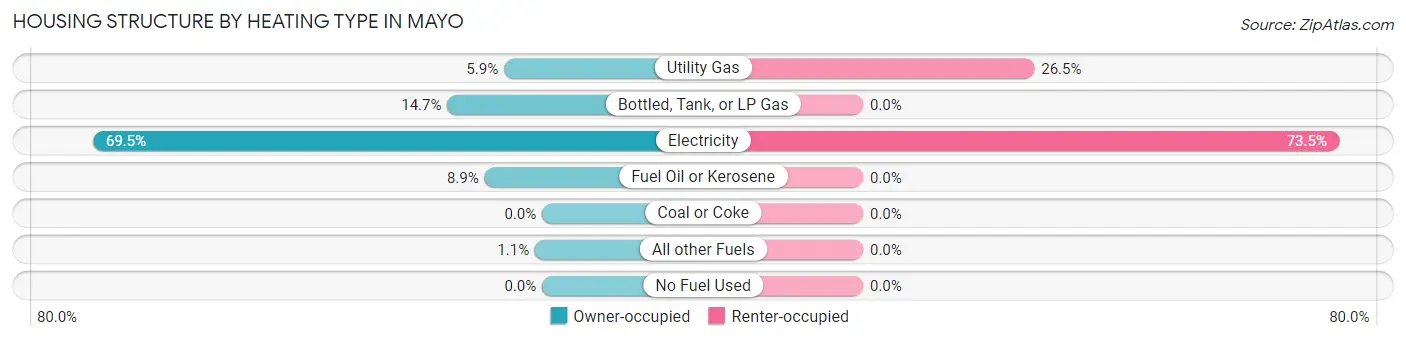
| Heating Type | Owner-occupied | Renter-occupied |
| Utility Gas | 43 (5.9%) | 18 (26.5%) |
| Bottled, Tank, or LP Gas | 107 (14.7%) | 0 (0.0%) |
| Electricity | 507 (69.5%) | 50 (73.5%) |
| Fuel Oil or Kerosene | 65 (8.9%) | 0 (0.0%) |
| Coal or Coke | 0 (0.0%) | 0 (0.0%) |
| All other Fuels | 8 (1.1%) | 0 (0.0%) |
| No Fuel Used | 0 (0.0%) | 0 (0.0%) |
| Total | 730 (100.0%) | 68 (100.0%) |
Household Vehicle Usage in Mayo
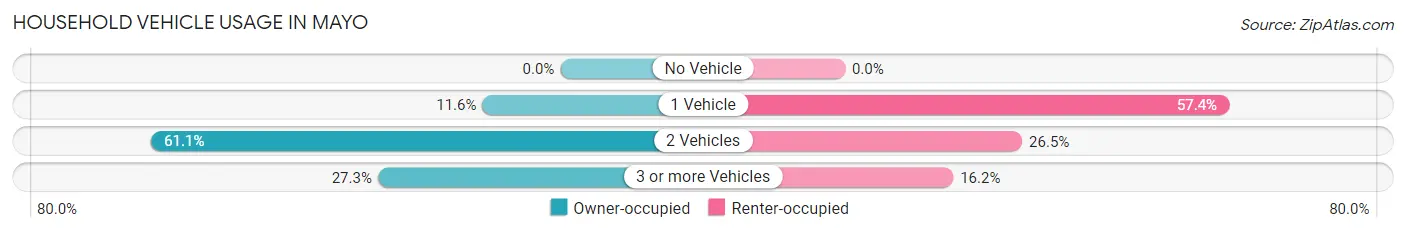
| Vehicles per Household | Owner-occupied | Renter-occupied |
| No Vehicle | 0 (0.0%) | 0 (0.0%) |
| 1 Vehicle | 85 (11.6%) | 39 (57.4%) |
| 2 Vehicles | 446 (61.1%) | 18 (26.5%) |
| 3 or more Vehicles | 199 (27.3%) | 11 (16.2%) |
| Total | 730 (100.0%) | 68 (100.0%) |
Real Estate & Mortgages in Mayo
Real Estate and Mortgage Overview in Mayo
| Characteristic | Without Mortgage | With Mortgage |
| Housing Units | 500 | 230 |
| Median Property Value | $132,200 | $167,400 |
| Median Household Income | $44,349 | $12 |
| Monthly Housing Costs | $521 | $0 |
| Real Estate Taxes | - | - |
Property Value by Mortgage Status in Mayo
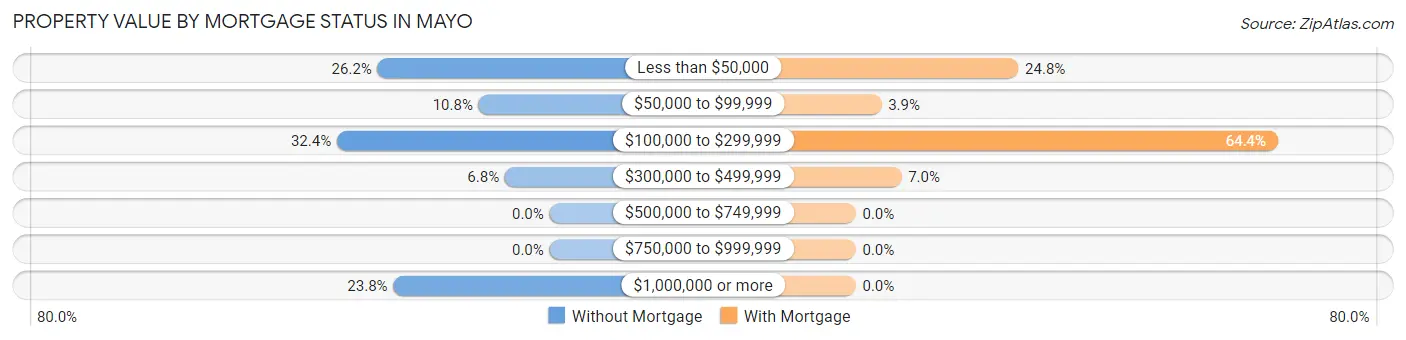
| Property Value | Without Mortgage | With Mortgage |
| Less than $50,000 | 131 (26.2%) | 57 (24.8%) |
| $50,000 to $99,999 | 54 (10.8%) | 9 (3.9%) |
| $100,000 to $299,999 | 162 (32.4%) | 148 (64.3%) |
| $300,000 to $499,999 | 34 (6.8%) | 16 (7.0%) |
| $500,000 to $749,999 | 0 (0.0%) | 0 (0.0%) |
| $750,000 to $999,999 | 0 (0.0%) | 0 (0.0%) |
| $1,000,000 or more | 119 (23.8%) | 0 (0.0%) |
| Total | 500 (100.0%) | 230 (100.0%) |
Household Income by Mortgage Status in Mayo
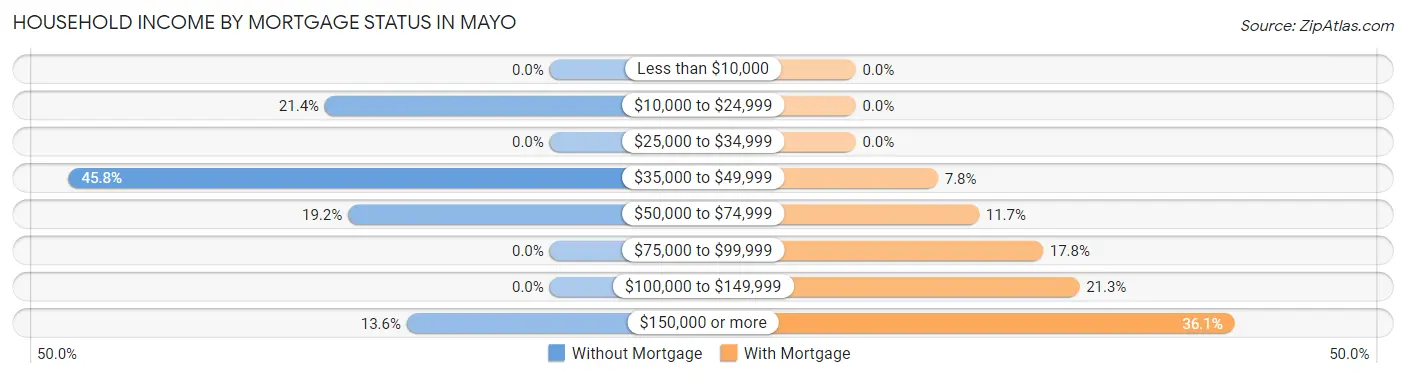
| Household Income | Without Mortgage | With Mortgage |
| Less than $10,000 | 0 (0.0%) | 0 (0.0%) |
| $10,000 to $24,999 | 107 (21.4%) | 0 (0.0%) |
| $25,000 to $34,999 | 0 (0.0%) | 0 (0.0%) |
| $35,000 to $49,999 | 229 (45.8%) | 18 (7.8%) |
| $50,000 to $74,999 | 96 (19.2%) | 27 (11.7%) |
| $75,000 to $99,999 | 0 (0.0%) | 41 (17.8%) |
| $100,000 to $149,999 | 0 (0.0%) | 49 (21.3%) |
| $150,000 or more | 68 (13.6%) | 83 (36.1%) |
| Total | 500 (100.0%) | 230 (100.0%) |
Property Value to Household Income Ratio in Mayo
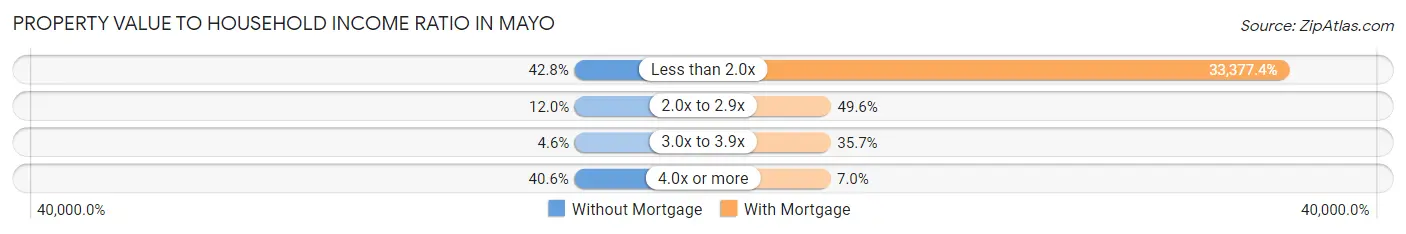
| Value-to-Income Ratio | Without Mortgage | With Mortgage |
| Less than 2.0x | 214 (42.8%) | 76,768 (33,377.4%) |
| 2.0x to 2.9x | 60 (12.0%) | 114 (49.6%) |
| 3.0x to 3.9x | 23 (4.6%) | 82 (35.6%) |
| 4.0x or more | 203 (40.6%) | 16 (7.0%) |
| Total | 500 (100.0%) | 230 (100.0%) |
Real Estate Taxes by Mortgage Status in Mayo
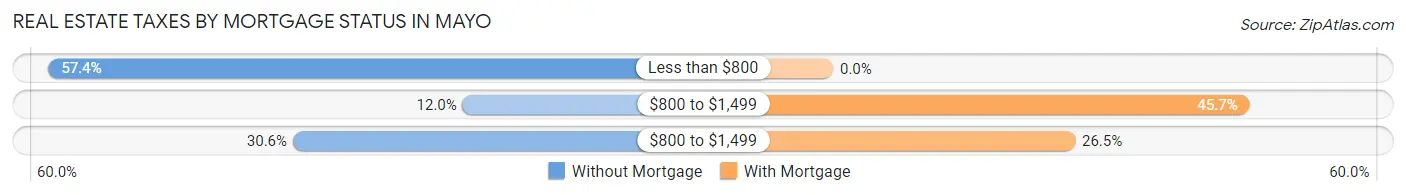
| Property Taxes | Without Mortgage | With Mortgage |
| Less than $800 | 287 (57.4%) | 0 (0.0%) |
| $800 to $1,499 | 60 (12.0%) | 105 (45.7%) |
| $800 to $1,499 | 153 (30.6%) | 61 (26.5%) |
| Total | 500 (100.0%) | 230 (100.0%) |
Health & Disability in Mayo
Health Insurance Coverage by Age in Mayo
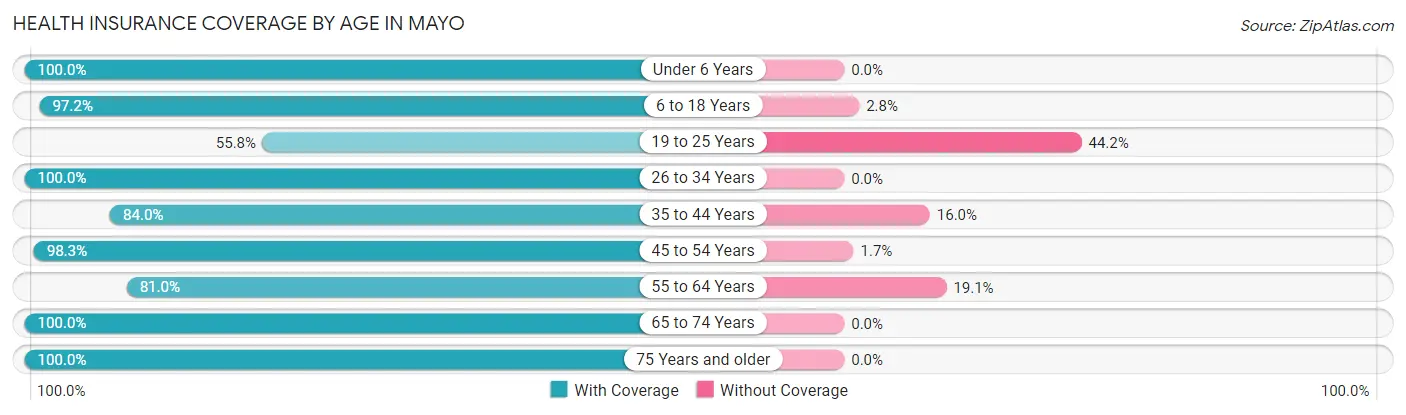
| Age Bracket | With Coverage | Without Coverage |
| Under 6 Years | 90 (100.0%) | 0 (0.0%) |
| 6 to 18 Years | 315 (97.2%) | 9 (2.8%) |
| 19 to 25 Years | 150 (55.8%) | 119 (44.2%) |
| 26 to 34 Years | 73 (100.0%) | 0 (0.0%) |
| 35 to 44 Years | 179 (84.0%) | 34 (16.0%) |
| 45 to 54 Years | 455 (98.3%) | 8 (1.7%) |
| 55 to 64 Years | 170 (80.9%) | 40 (19.1%) |
| 65 to 74 Years | 69 (100.0%) | 0 (0.0%) |
| 75 Years and older | 214 (100.0%) | 0 (0.0%) |
| Total | 1,715 (89.1%) | 210 (10.9%) |
Health Insurance Coverage by Citizenship Status in Mayo
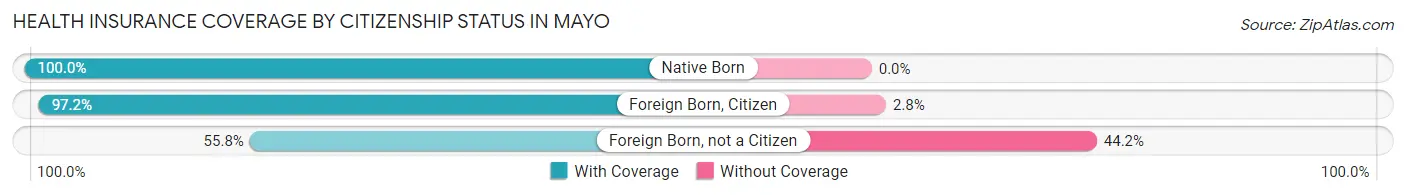
| Citizenship Status | With Coverage | Without Coverage |
| Native Born | 90 (100.0%) | 0 (0.0%) |
| Foreign Born, Citizen | 315 (97.2%) | 9 (2.8%) |
| Foreign Born, not a Citizen | 150 (55.8%) | 119 (44.2%) |
Health Insurance Coverage by Household Income in Mayo
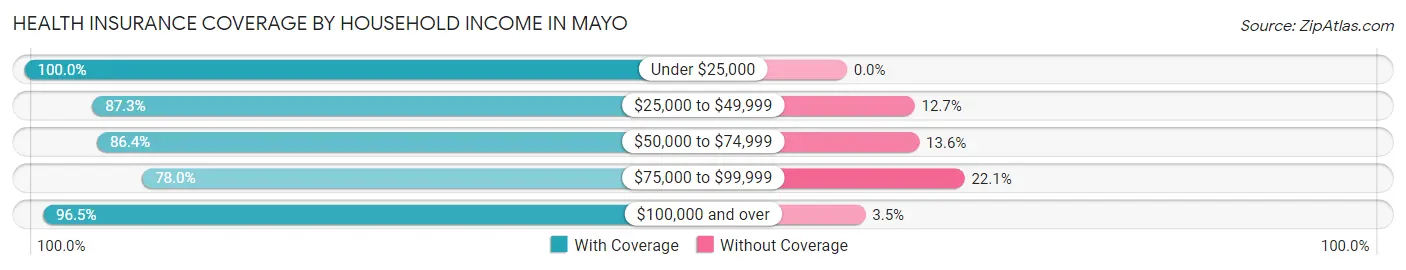
| Household Income | With Coverage | Without Coverage |
| Under $25,000 | 155 (100.0%) | 0 (0.0%) |
| $25,000 to $49,999 | 516 (87.3%) | 75 (12.7%) |
| $50,000 to $74,999 | 389 (86.4%) | 61 (13.6%) |
| $75,000 to $99,999 | 205 (77.9%) | 58 (22.1%) |
| $100,000 and over | 445 (96.5%) | 16 (3.5%) |
Public vs Private Health Insurance Coverage by Age in Mayo
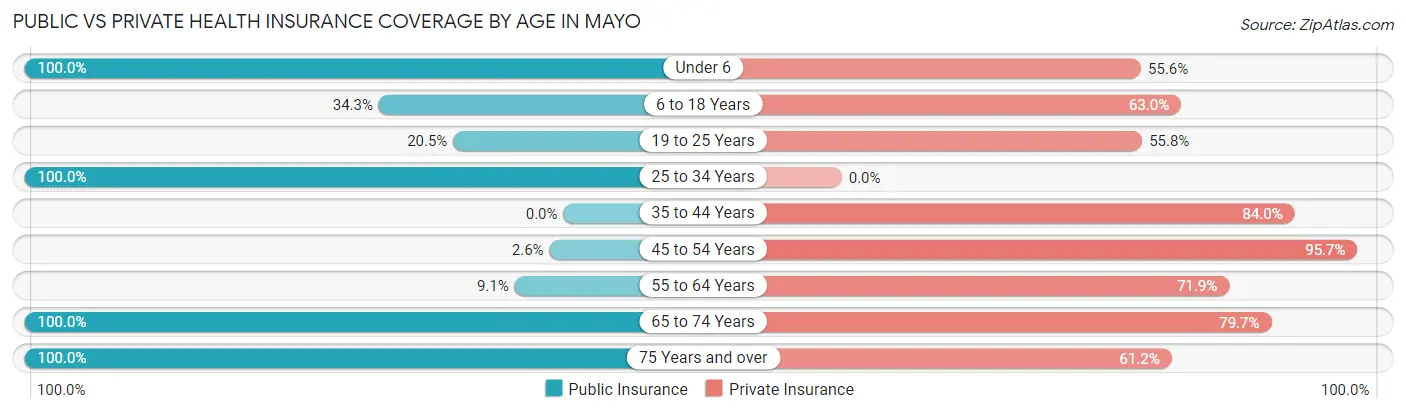
| Age Bracket | Public Insurance | Private Insurance |
| Under 6 | 90 (100.0%) | 50 (55.6%) |
| 6 to 18 Years | 111 (34.3%) | 204 (63.0%) |
| 19 to 25 Years | 55 (20.4%) | 150 (55.8%) |
| 25 to 34 Years | 73 (100.0%) | 0 (0.0%) |
| 35 to 44 Years | 0 (0.0%) | 179 (84.0%) |
| 45 to 54 Years | 12 (2.6%) | 443 (95.7%) |
| 55 to 64 Years | 19 (9.0%) | 151 (71.9%) |
| 65 to 74 Years | 69 (100.0%) | 55 (79.7%) |
| 75 Years and over | 214 (100.0%) | 131 (61.2%) |
| Total | 643 (33.4%) | 1,363 (70.8%) |
Disability Status by Sex by Age in Mayo
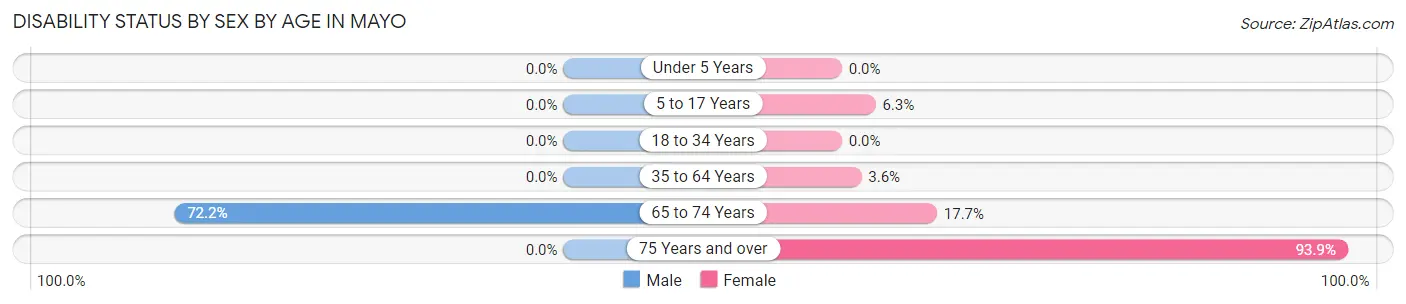
| Age Bracket | Male | Female |
| Under 5 Years | 0 (0.0%) | 0 (0.0%) |
| 5 to 17 Years | 0 (0.0%) | 11 (6.2%) |
| 18 to 34 Years | 0 (0.0%) | 0 (0.0%) |
| 35 to 64 Years | 0 (0.0%) | 14 (3.6%) |
| 65 to 74 Years | 13 (72.2%) | 9 (17.6%) |
| 75 Years and over | 0 (0.0%) | 154 (93.9%) |
Disability Class by Sex by Age in Mayo
Disability Class: Hearing Difficulty
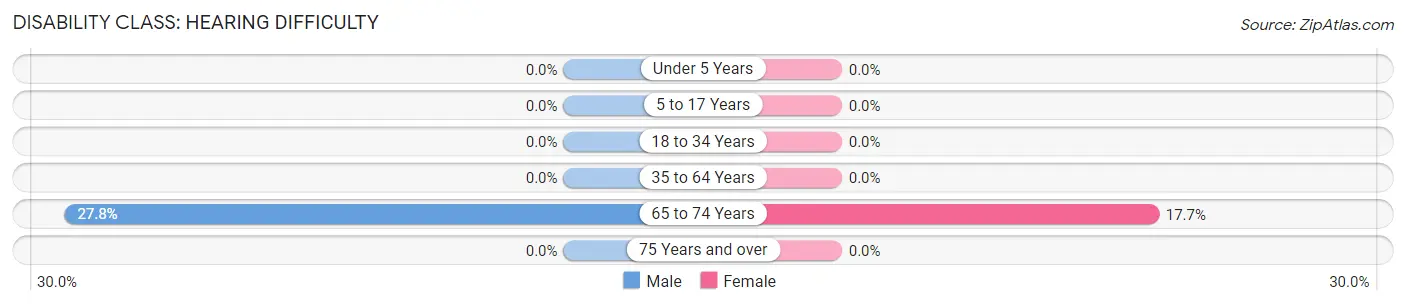
| Age Bracket | Male | Female |
| Under 5 Years | 0 (0.0%) | 0 (0.0%) |
| 5 to 17 Years | 0 (0.0%) | 0 (0.0%) |
| 18 to 34 Years | 0 (0.0%) | 0 (0.0%) |
| 35 to 64 Years | 0 (0.0%) | 0 (0.0%) |
| 65 to 74 Years | 5 (27.8%) | 9 (17.6%) |
| 75 Years and over | 0 (0.0%) | 0 (0.0%) |
Disability Class: Vision Difficulty
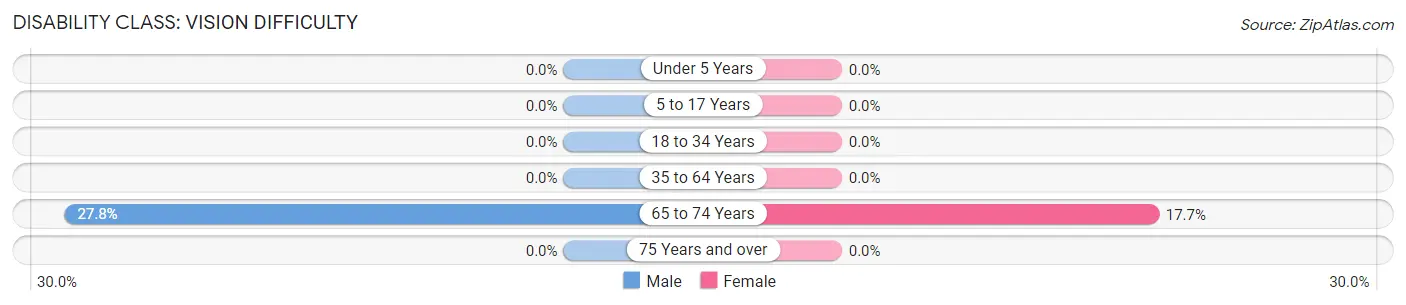
| Age Bracket | Male | Female |
| Under 5 Years | 0 (0.0%) | 0 (0.0%) |
| 5 to 17 Years | 0 (0.0%) | 0 (0.0%) |
| 18 to 34 Years | 0 (0.0%) | 0 (0.0%) |
| 35 to 64 Years | 0 (0.0%) | 0 (0.0%) |
| 65 to 74 Years | 5 (27.8%) | 9 (17.6%) |
| 75 Years and over | 0 (0.0%) | 0 (0.0%) |
Disability Class: Cognitive Difficulty
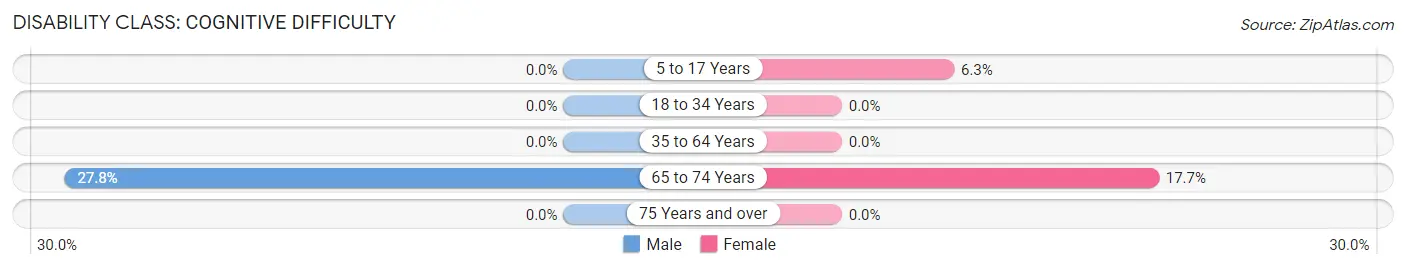
| Age Bracket | Male | Female |
| 5 to 17 Years | 0 (0.0%) | 11 (6.2%) |
| 18 to 34 Years | 0 (0.0%) | 0 (0.0%) |
| 35 to 64 Years | 0 (0.0%) | 0 (0.0%) |
| 65 to 74 Years | 5 (27.8%) | 9 (17.6%) |
| 75 Years and over | 0 (0.0%) | 0 (0.0%) |
Disability Class: Ambulatory Difficulty
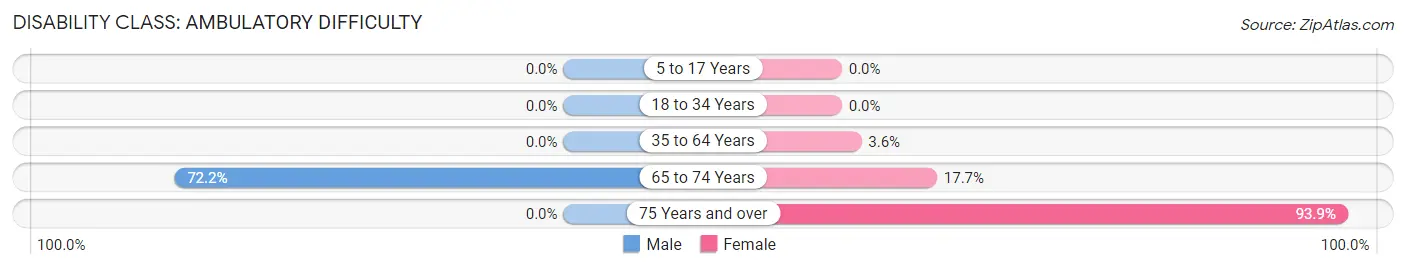
| Age Bracket | Male | Female |
| 5 to 17 Years | 0 (0.0%) | 0 (0.0%) |
| 18 to 34 Years | 0 (0.0%) | 0 (0.0%) |
| 35 to 64 Years | 0 (0.0%) | 14 (3.6%) |
| 65 to 74 Years | 13 (72.2%) | 9 (17.6%) |
| 75 Years and over | 0 (0.0%) | 154 (93.9%) |
Disability Class: Self-Care Difficulty
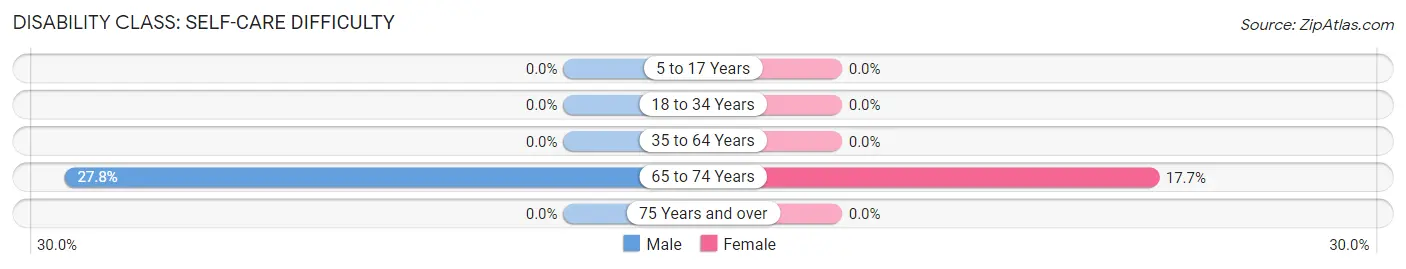
| Age Bracket | Male | Female |
| 5 to 17 Years | 0 (0.0%) | 0 (0.0%) |
| 18 to 34 Years | 0 (0.0%) | 0 (0.0%) |
| 35 to 64 Years | 0 (0.0%) | 0 (0.0%) |
| 65 to 74 Years | 5 (27.8%) | 9 (17.6%) |
| 75 Years and over | 0 (0.0%) | 0 (0.0%) |
Technology Access in Mayo
Computing Device Access in Mayo
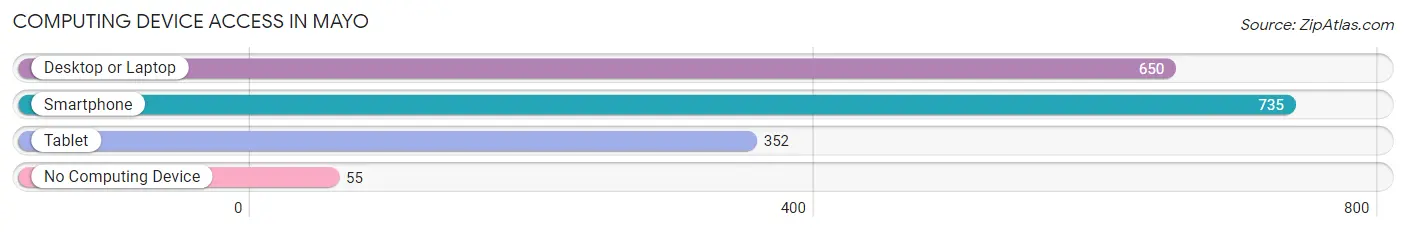
| Device Type | # Households | % Households |
| Desktop or Laptop | 650 | 81.5% |
| Smartphone | 735 | 92.1% |
| Tablet | 352 | 44.1% |
| No Computing Device | 55 | 6.9% |
| Total | 798 | 100.0% |
Internet Access in Mayo
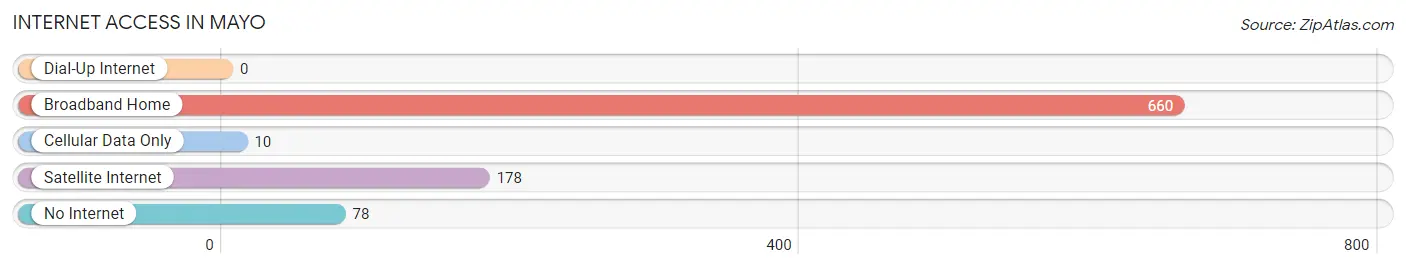
| Internet Type | # Households | % Households |
| Dial-Up Internet | 0 | 0.0% |
| Broadband Home | 660 | 82.7% |
| Cellular Data Only | 10 | 1.3% |
| Satellite Internet | 178 | 22.3% |
| No Internet | 78 | 9.8% |
| Total | 798 | 100.0% |
Mayo Summary
Mayo is a small town located in the state of South Carolina, United States. It is situated in the northeastern corner of the state, near the border with North Carolina. The town is part of the Florence Metropolitan Statistical Area and has a population of approximately 1,000 people.
Geography
Mayo is located in the northeastern corner of South Carolina, near the border with North Carolina. The town is situated in the Pee Dee region of the state, which is characterized by rolling hills and flat plains. The town is located on the banks of the Great Pee Dee River, which is a major tributary of the Atlantic Ocean. The town is surrounded by the towns of Florence, Darlington, and Hartsville.
The climate in Mayo is humid subtropical, with hot, humid summers and mild winters. The average annual temperature is around 70 degrees Fahrenheit, with an average high of around 90 degrees in the summer and an average low of around 50 degrees in the winter. The town receives an average of around 50 inches of precipitation per year, with most of it falling in the summer months.
Economy
The economy of Mayo is largely based on agriculture and manufacturing. The town is home to several large farms, which produce a variety of crops, including corn, soybeans, cotton, and peanuts. The town is also home to several manufacturing companies, which produce a variety of products, including furniture, textiles, and automotive parts.
The town is also home to several small businesses, including restaurants, retail stores, and service providers. The town is also home to a number of tourist attractions, including the Mayo Museum and the Mayo Historic District.
Demographics
As of the 2010 census, the population of Mayo was 1,000 people. The racial makeup of the town was 79.2% White, 17.2% African American, 0.7% Native American, 0.3% Asian, 0.1% Pacific Islander, and 2.5% from other races. The median household income in the town was $30,000, and the median family income was $35,000.
The town is served by the Florence County School District, which includes two elementary schools, one middle school, and one high school. The town is also home to several churches, including the Mayo Baptist Church, the Mayo Methodist Church, and the Mayo Presbyterian Church.
Conclusion
Mayo is a small town located in the northeastern corner of South Carolina, near the border with North Carolina. The town is part of the Florence Metropolitan Statistical Area and has a population of approximately 1,000 people. The economy of Mayo is largely based on agriculture and manufacturing, and the town is home to several small businesses, churches, and tourist attractions. The town is served by the Florence County School District, and the racial makeup of the town is 79.2% White, 17.2% African American, 0.7% Native American, 0.3% Asian, 0.1% Pacific Islander, and 2.5% from other races.
Common Questions
What is Per Capita Income in Mayo?
Per Capita income in Mayo is $31,722.
What is the Median Family Income in Mayo?
Median Family Income in Mayo is $63,359.
What is the Median Household income in Mayo?
Median Household Income in Mayo is $48,750.
What is Income or Wage Gap in Mayo?
Income or Wage Gap in Mayo is 39.2%.
Women in Mayo earn 60.8 cents for every dollar earned by a man.
What is Inequality or Gini Index in Mayo?
Inequality or Gini Index in Mayo is 0.40.
What is the Total Population of Mayo?
Total Population of Mayo is 1,925.
What is the Total Male Population of Mayo?
Total Male Population of Mayo is 980.
What is the Total Female Population of Mayo?
Total Female Population of Mayo is 945.
What is the Ratio of Males per 100 Females in Mayo?
There are 103.70 Males per 100 Females in Mayo.
What is the Ratio of Females per 100 Males in Mayo?
There are 96.43 Females per 100 Males in Mayo.
What is the Median Population Age in Mayo?
Median Population Age in Mayo is 44.4 Years.
What is the Average Family Size in Mayo
Average Family Size in Mayo is 2.9 People.
What is the Average Household Size in Mayo
Average Household Size in Mayo is 2.4 People.
How Large is the Labor Force in Mayo?
There are 1,116 People in the Labor Forcein in Mayo.
What is the Percentage of People in the Labor Force in Mayo?
67.2% of People are in the Labor Force in Mayo.
What is the Unemployment Rate in Mayo?
Unemployment Rate in Mayo is 3.3%.