Great Falls, SC Map & Demographics
Great Falls Map
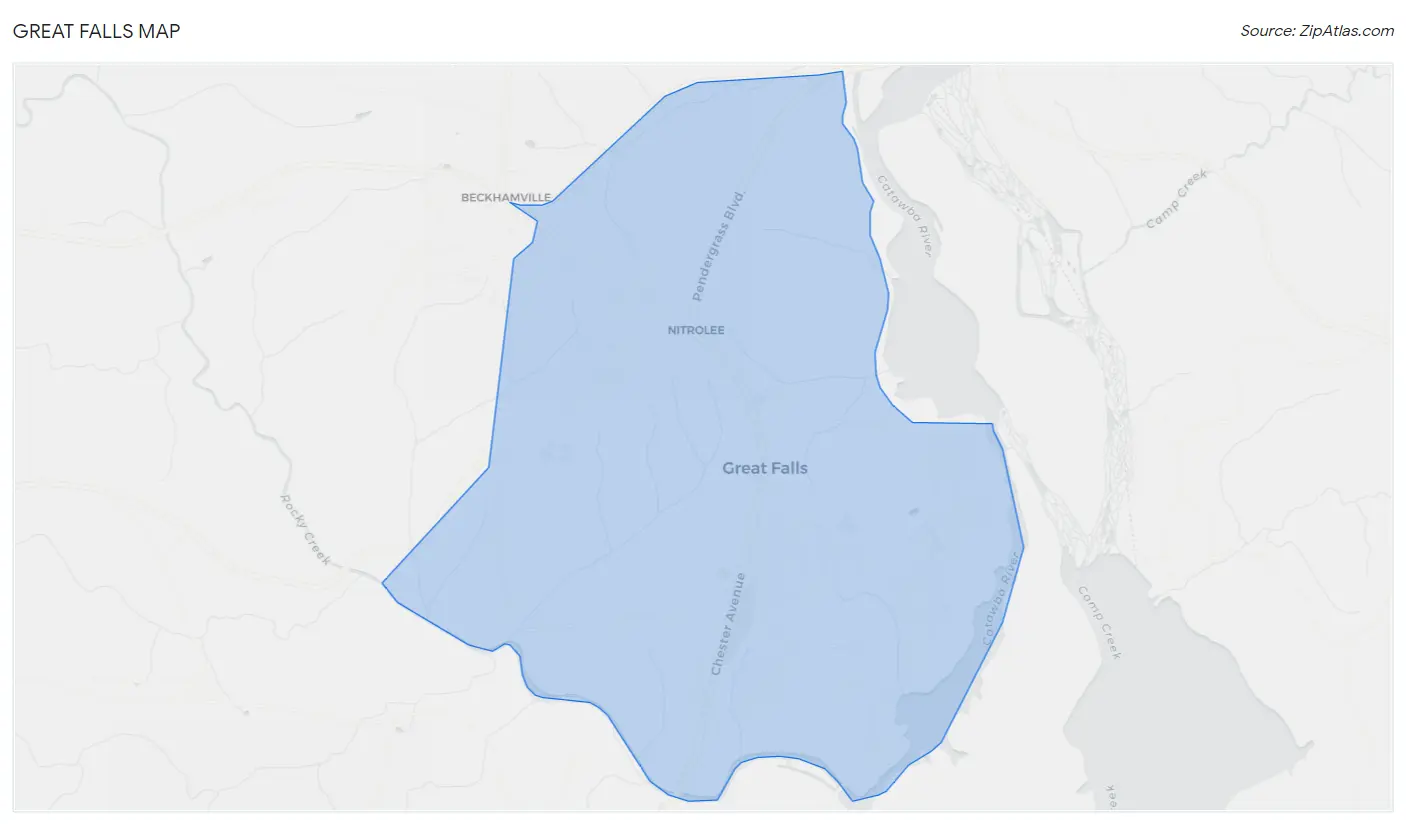
Great Falls Overview
$20,140
PER CAPITA INCOME
$53,409
AVG FAMILY INCOME
$28,804
AVG HOUSEHOLD INCOME
14.1%
WAGE / INCOME GAP [ % ]
85.9¢/ $1
WAGE / INCOME GAP [ $ ]
0.49
INEQUALITY / GINI INDEX
1,669
TOTAL POPULATION
750
MALE POPULATION
919
FEMALE POPULATION
81.61
MALES / 100 FEMALES
122.53
FEMALES / 100 MALES
39.8
MEDIAN AGE
3.4
AVG FAMILY SIZE
2.4
AVG HOUSEHOLD SIZE
576
LABOR FORCE [ PEOPLE ]
41.5%
PERCENT IN LABOR FORCE
8.2%
UNEMPLOYMENT RATE
Great Falls Zip Codes
Great Falls Area Codes
Income in Great Falls
Income Overview in Great Falls
Per Capita Income in Great Falls is $20,140, while median incomes of families and households are $53,409 and $28,804 respectively.
| Characteristic | Number | Measure |
| Per Capita Income | 1,669 | $20,140 |
| Median Family Income | 380 | $53,409 |
| Mean Family Income | 380 | $63,896 |
| Median Household Income | 688 | $28,804 |
| Mean Household Income | 688 | $48,221 |
| Income Deficit | 380 | $0 |
| Wage / Income Gap (%) | 1,669 | 14.11% |
| Wage / Income Gap ($) | 1,669 | 85.89¢ per $1 |
| Gini / Inequality Index | 1,669 | 0.49 |
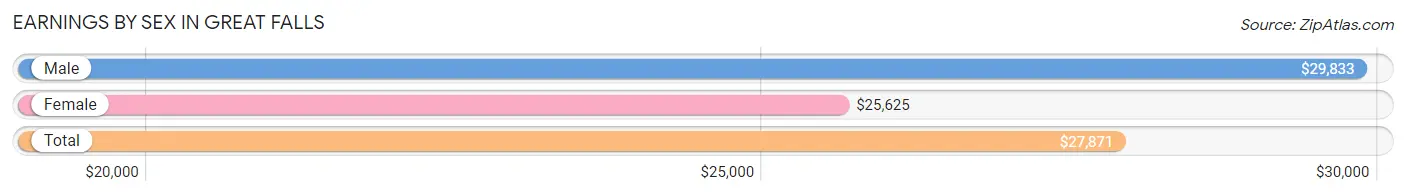
Earnings by Sex in Great Falls
Average Earnings in Great Falls are $27,871, $29,833 for men and $25,625 for women, a difference of 14.1%.
| Sex | Number | Average Earnings |
| Male | 308 (49.8%) | $29,833 |
| Female | 311 (50.2%) | $25,625 |
| Total | 619 (100.0%) | $27,871 |
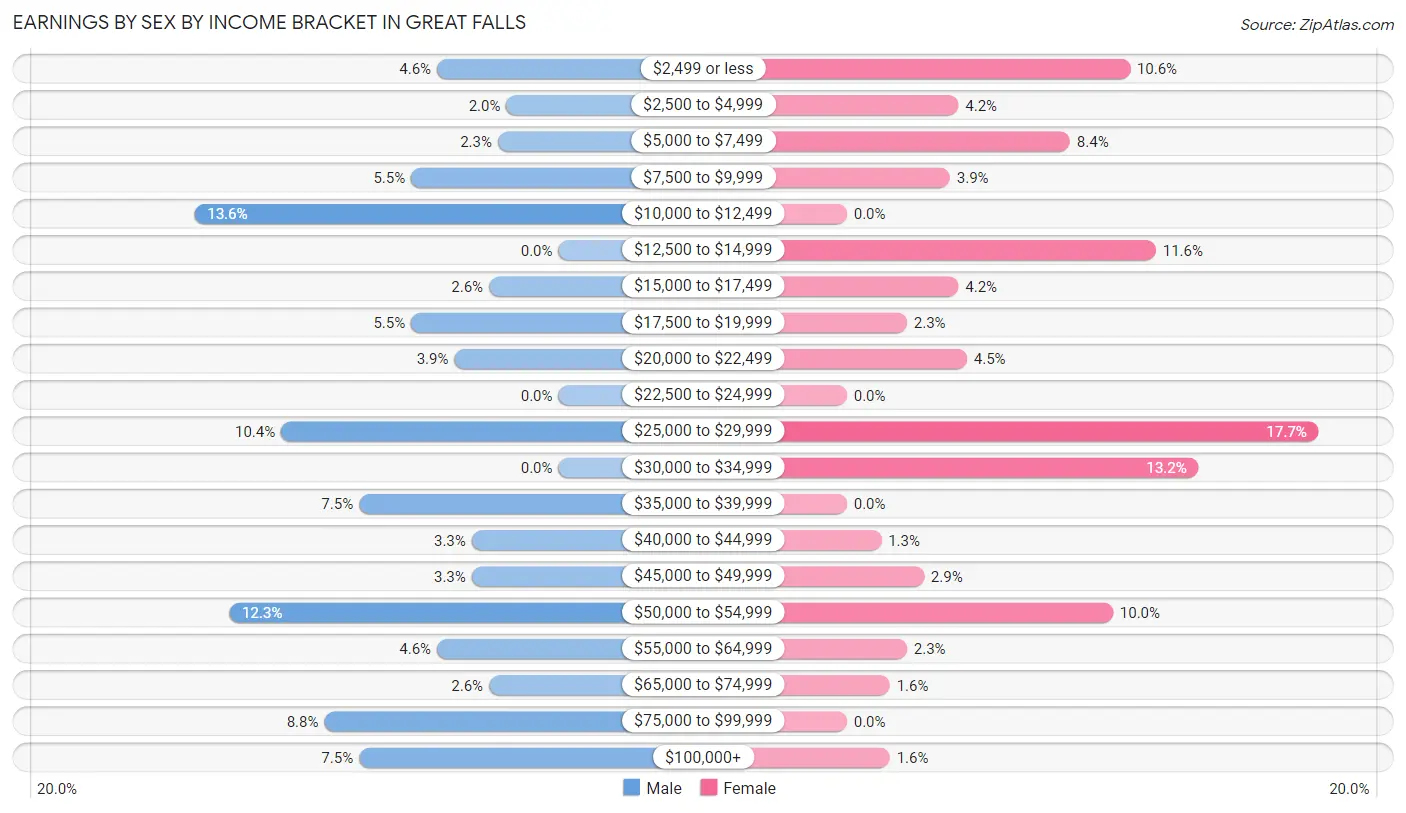
Earnings by Sex by Income Bracket in Great Falls
The most common earnings brackets in Great Falls are $10,000 to $12,499 for men (42 | 13.6%) and $25,000 to $29,999 for women (55 | 17.7%).
| Income | Male | Female |
| $2,499 or less | 14 (4.5%) | 33 (10.6%) |
| $2,500 to $4,999 | 6 (1.9%) | 13 (4.2%) |
| $5,000 to $7,499 | 7 (2.3%) | 26 (8.4%) |
| $7,500 to $9,999 | 17 (5.5%) | 12 (3.9%) |
| $10,000 to $12,499 | 42 (13.6%) | 0 (0.0%) |
| $12,500 to $14,999 | 0 (0.0%) | 36 (11.6%) |
| $15,000 to $17,499 | 8 (2.6%) | 13 (4.2%) |
| $17,500 to $19,999 | 17 (5.5%) | 7 (2.2%) |
| $20,000 to $22,499 | 12 (3.9%) | 14 (4.5%) |
| $22,500 to $24,999 | 0 (0.0%) | 0 (0.0%) |
| $25,000 to $29,999 | 32 (10.4%) | 55 (17.7%) |
| $30,000 to $34,999 | 0 (0.0%) | 41 (13.2%) |
| $35,000 to $39,999 | 23 (7.5%) | 0 (0.0%) |
| $40,000 to $44,999 | 10 (3.3%) | 4 (1.3%) |
| $45,000 to $49,999 | 10 (3.3%) | 9 (2.9%) |
| $50,000 to $54,999 | 38 (12.3%) | 31 (10.0%) |
| $55,000 to $64,999 | 14 (4.5%) | 7 (2.2%) |
| $65,000 to $74,999 | 8 (2.6%) | 5 (1.6%) |
| $75,000 to $99,999 | 27 (8.8%) | 0 (0.0%) |
| $100,000+ | 23 (7.5%) | 5 (1.6%) |
| Total | 308 (100.0%) | 311 (100.0%) |
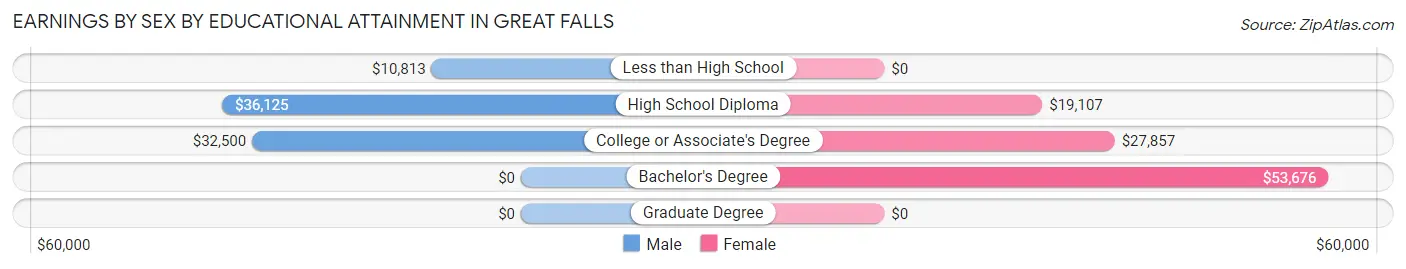
Earnings by Sex by Educational Attainment in Great Falls
Average earnings in Great Falls are $35,125 for men and $25,625 for women, a difference of 27.1%. Men with an educational attainment of high school diploma enjoy the highest average annual earnings of $36,125, while those with less than high school education earn the least with $10,813. Women with an educational attainment of bachelor's degree earn the most with the average annual earnings of $53,676, while those with high school diploma education have the smallest earnings of $19,107.
| Educational Attainment | Male Income | Female Income |
| Less than High School | $10,813 | $0 |
| High School Diploma | $36,125 | $19,107 |
| College or Associate's Degree | $32,500 | $27,857 |
| Bachelor's Degree | - | - |
| Graduate Degree | - | - |
| Total | $35,125 | $25,625 |
Family Income in Great Falls
Family Income Brackets in Great Falls
According to the Great Falls family income data, there are 79 families falling into the $75,000 to $99,999 income range, which is the most common income bracket and makes up 20.8% of all families. Conversely, the $10,000 to $14,999 income bracket is the least frequent group with only 1 families (0.3%) belonging to this category.
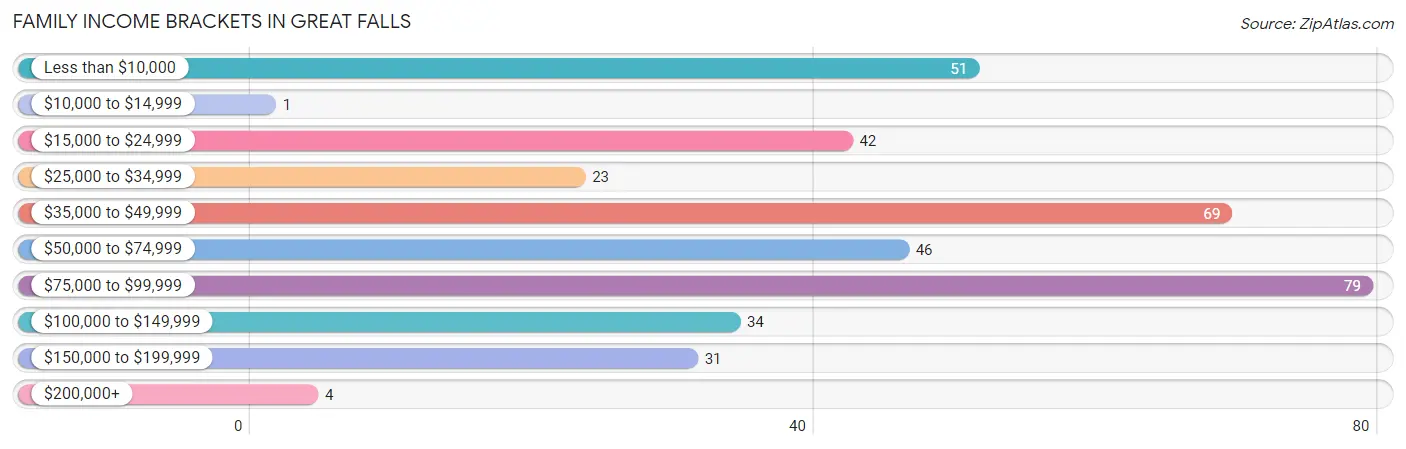
| Income Bracket | # Families | % Families |
| Less than $10,000 | 51 | 13.4% |
| $10,000 to $14,999 | 1 | 0.3% |
| $15,000 to $24,999 | 42 | 11.1% |
| $25,000 to $34,999 | 23 | 6.1% |
| $35,000 to $49,999 | 69 | 18.2% |
| $50,000 to $74,999 | 46 | 12.1% |
| $75,000 to $99,999 | 79 | 20.8% |
| $100,000 to $149,999 | 34 | 8.9% |
| $150,000 to $199,999 | 31 | 8.2% |
| $200,000+ | 4 | 1.1% |
Family Income by Famaliy Size in Great Falls
2-person families (203 | 53.4%) account for the highest median family income in Great Falls with $68,438 per family, while 2-person families (203 | 53.4%) have the highest median income of $34,219 per family member.
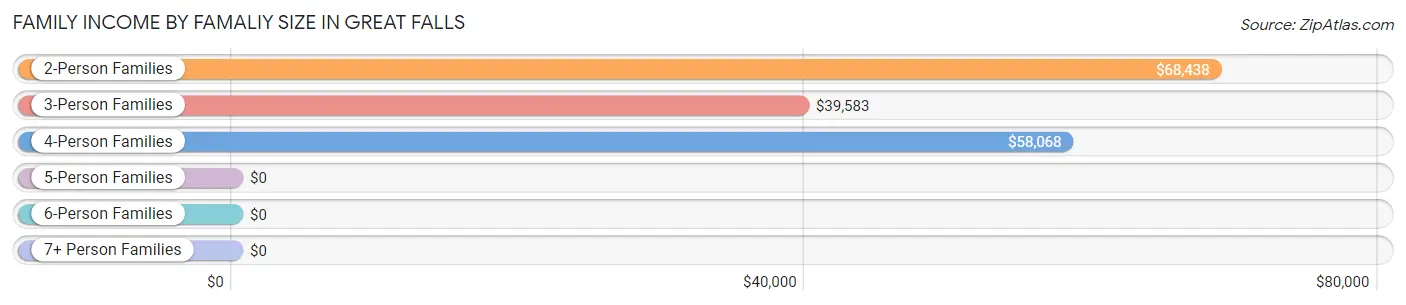
| Income Bracket | # Families | Median Income |
| 2-Person Families | 203 (53.4%) | $68,438 |
| 3-Person Families | 57 (15.0%) | $39,583 |
| 4-Person Families | 61 (16.1%) | $58,068 |
| 5-Person Families | 59 (15.5%) | $0 |
| 6-Person Families | 0 (0.0%) | $0 |
| 7+ Person Families | 0 (0.0%) | $0 |
| Total | 380 (100.0%) | $53,409 |
Family Income by Number of Earners in Great Falls
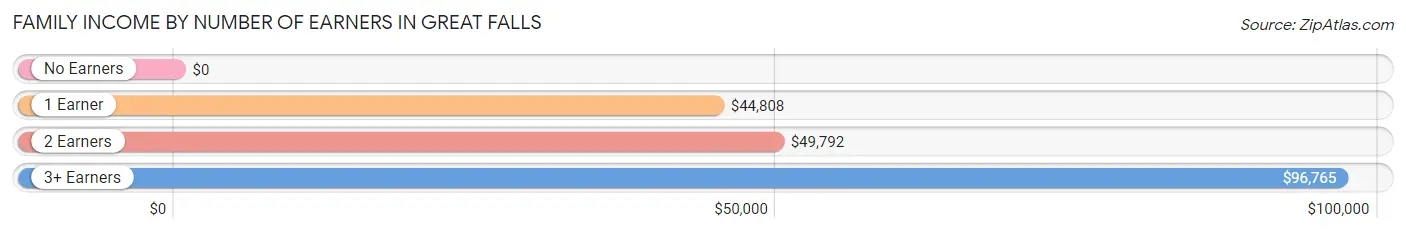
| Number of Earners | # Families | Median Income |
| No Earners | 67 (17.6%) | $0 |
| 1 Earner | 162 (42.6%) | $44,808 |
| 2 Earners | 113 (29.7%) | $49,792 |
| 3+ Earners | 38 (10.0%) | $96,765 |
| Total | 380 (100.0%) | $53,409 |
Household Income in Great Falls
Household Income Brackets in Great Falls
With 136 households falling in the category, the $15,000 to $24,999 income range is the most frequent in Great Falls, accounting for 19.8% of all households. In contrast, only 4 households (0.6%) fall into the $200,000+ income bracket, making it the least populous group.
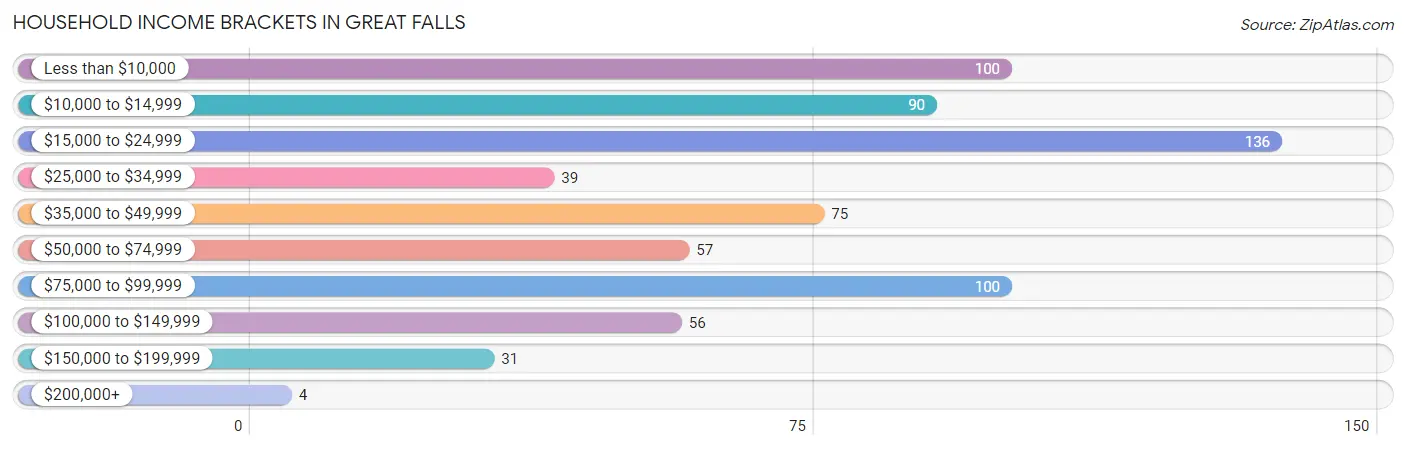
| Income Bracket | # Households | % Households |
| Less than $10,000 | 100 | 14.5% |
| $10,000 to $14,999 | 90 | 13.1% |
| $15,000 to $24,999 | 136 | 19.8% |
| $25,000 to $34,999 | 39 | 5.7% |
| $35,000 to $49,999 | 75 | 10.9% |
| $50,000 to $74,999 | 57 | 8.3% |
| $75,000 to $99,999 | 100 | 14.5% |
| $100,000 to $149,999 | 56 | 8.1% |
| $150,000 to $199,999 | 31 | 4.5% |
| $200,000+ | 4 | 0.6% |
Household Income by Householder Age in Great Falls
The median household income in Great Falls is $28,804, with the highest median household income of $77,125 found in the 25 to 44 years age bracket for the primary householder. A total of 167 households (24.3%) fall into this category. Meanwhile, the 15 to 24 years age bracket for the primary householder has the lowest median household income of $0, with 7 households (1.0%) in this group.
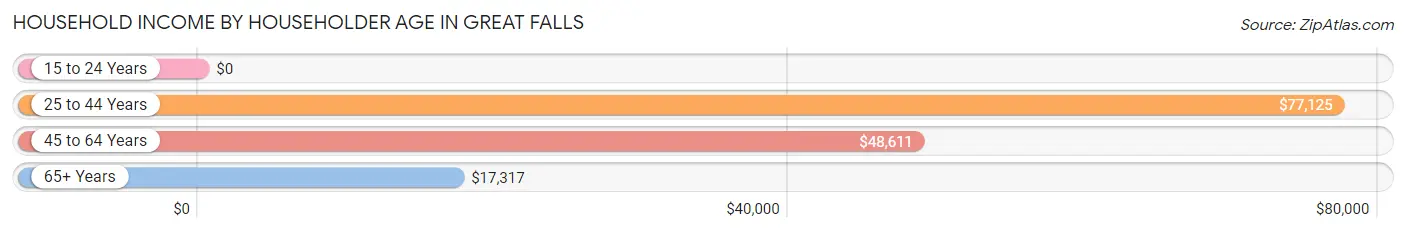
| Income Bracket | # Households | Median Income |
| 15 to 24 Years | 7 (1.0%) | $0 |
| 25 to 44 Years | 167 (24.3%) | $77,125 |
| 45 to 64 Years | 190 (27.6%) | $48,611 |
| 65+ Years | 324 (47.1%) | $17,317 |
| Total | 688 (100.0%) | $28,804 |
Poverty in Great Falls
Income Below Poverty by Sex and Age in Great Falls
With 29.9% poverty level for males and 38.4% for females among the residents of Great Falls, 16 and 17 year old males and 15 year old females are the most vulnerable to poverty, with 78 males (95.1%) and 12 females (100.0%) in their respective age groups living below the poverty level.
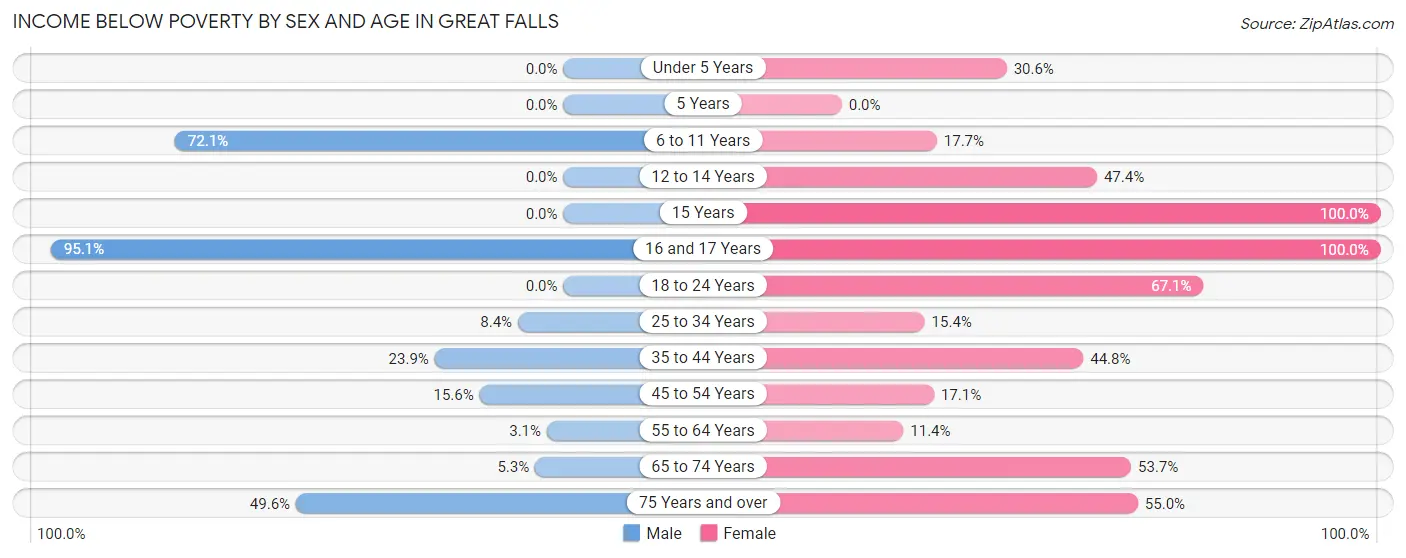
| Age Bracket | Male | Female |
| Under 5 Years | 0 (0.0%) | 15 (30.6%) |
| 5 Years | 0 (0.0%) | 0 (0.0%) |
| 6 to 11 Years | 31 (72.1%) | 12 (17.6%) |
| 12 to 14 Years | 0 (0.0%) | 9 (47.4%) |
| 15 Years | 0 (0.0%) | 12 (100.0%) |
| 16 and 17 Years | 78 (95.1%) | 42 (100.0%) |
| 18 to 24 Years | 0 (0.0%) | 53 (67.1%) |
| 25 to 34 Years | 7 (8.4%) | 24 (15.4%) |
| 35 to 44 Years | 27 (23.9%) | 26 (44.8%) |
| 45 to 54 Years | 7 (15.6%) | 26 (17.1%) |
| 55 to 64 Years | 3 (3.1%) | 4 (11.4%) |
| 65 to 74 Years | 3 (5.3%) | 58 (53.7%) |
| 75 Years and over | 68 (49.6%) | 72 (55.0%) |
| Total | 224 (29.9%) | 353 (38.4%) |
Income Above Poverty by Sex and Age in Great Falls
According to the poverty statistics in Great Falls, males aged under 5 years and females aged 5 years are the age groups that are most secure financially, with 100.0% of males and 100.0% of females in these age groups living above the poverty line.
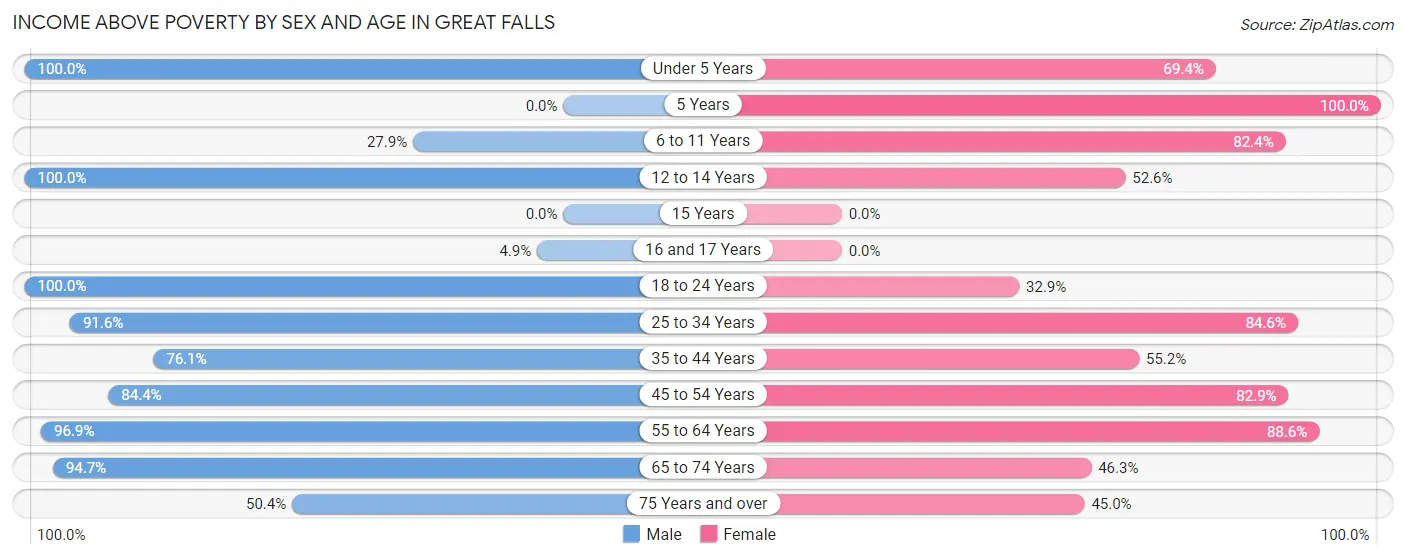
| Age Bracket | Male | Female |
| Under 5 Years | 75 (100.0%) | 34 (69.4%) |
| 5 Years | 0 (0.0%) | 10 (100.0%) |
| 6 to 11 Years | 12 (27.9%) | 56 (82.4%) |
| 12 to 14 Years | 4 (100.0%) | 10 (52.6%) |
| 15 Years | 0 (0.0%) | 0 (0.0%) |
| 16 and 17 Years | 4 (4.9%) | 0 (0.0%) |
| 18 to 24 Years | 13 (100.0%) | 26 (32.9%) |
| 25 to 34 Years | 76 (91.6%) | 132 (84.6%) |
| 35 to 44 Years | 86 (76.1%) | 32 (55.2%) |
| 45 to 54 Years | 38 (84.4%) | 126 (82.9%) |
| 55 to 64 Years | 95 (96.9%) | 31 (88.6%) |
| 65 to 74 Years | 54 (94.7%) | 50 (46.3%) |
| 75 Years and over | 69 (50.4%) | 59 (45.0%) |
| Total | 526 (70.1%) | 566 (61.6%) |
Income Below Poverty Among Married-Couple Families in Great Falls
The poverty statistics for married-couple families in Great Falls show that 17.0% or 38 of the total 224 families live below the poverty line. Families with 3 or 4 children have the highest poverty rate of 50.0%, comprising of 7 families. On the other hand, families with no children have the lowest poverty rate of 7.4%, which includes 11 families.
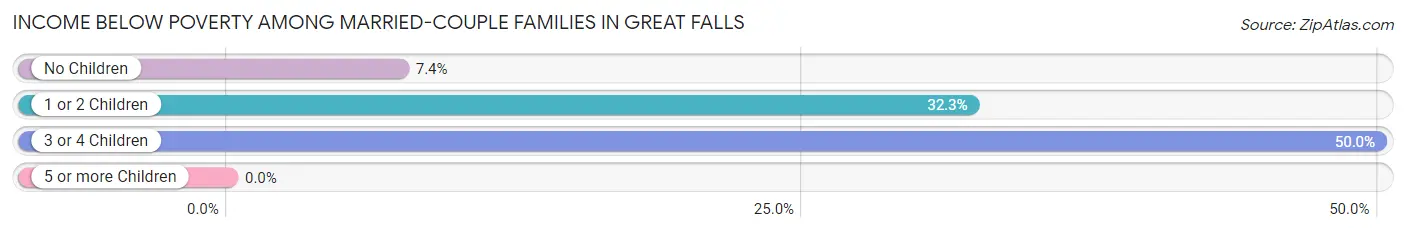
| Children | Above Poverty | Below Poverty |
| No Children | 137 (92.6%) | 11 (7.4%) |
| 1 or 2 Children | 42 (67.7%) | 20 (32.3%) |
| 3 or 4 Children | 7 (50.0%) | 7 (50.0%) |
| 5 or more Children | 0 (0.0%) | 0 (0.0%) |
| Total | 186 (83.0%) | 38 (17.0%) |
Income Below Poverty Among Single-Parent Households in Great Falls
According to the poverty data in Great Falls, 54.5% or 24 single-father households and 22.3% or 25 single-mother households are living below the poverty line. Among single-father households, those with 1 or 2 children have the highest poverty rate, with 24 households (75.0%) experiencing poverty. Likewise, among single-mother households, those with 1 or 2 children have the highest poverty rate, with 18 households (27.3%) falling below the poverty line.
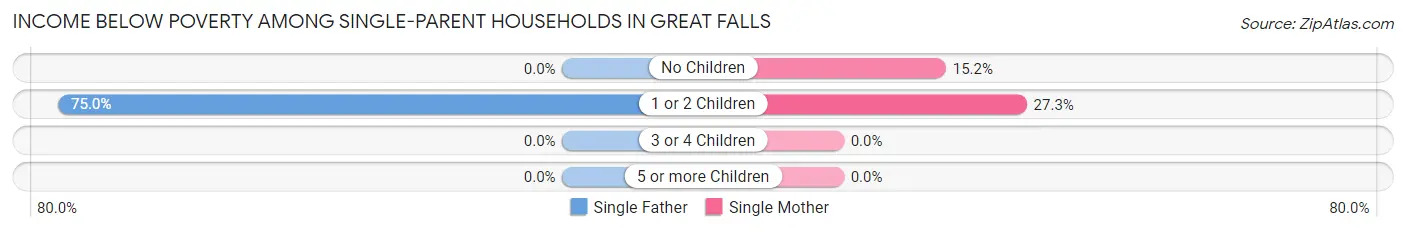
| Children | Single Father | Single Mother |
| No Children | 0 (0.0%) | 7 (15.2%) |
| 1 or 2 Children | 24 (75.0%) | 18 (27.3%) |
| 3 or 4 Children | 0 (0.0%) | 0 (0.0%) |
| 5 or more Children | 0 (0.0%) | 0 (0.0%) |
| Total | 24 (54.5%) | 25 (22.3%) |
Income Below Poverty Among Married-Couple vs Single-Parent Households in Great Falls
The poverty data for Great Falls shows that 38 of the married-couple family households (17.0%) and 49 of the single-parent households (31.4%) are living below the poverty level. Within the married-couple family households, those with 3 or 4 children have the highest poverty rate, with 7 households (50.0%) falling below the poverty line. Among the single-parent households, those with 1 or 2 children have the highest poverty rate, with 42 household (42.9%) living below poverty.
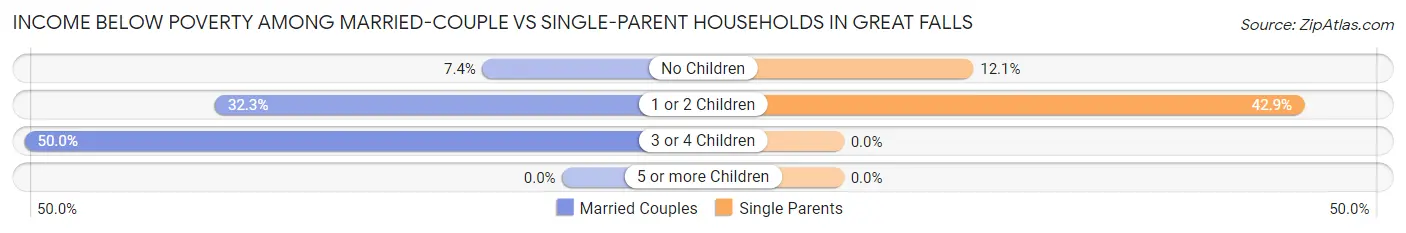
| Children | Married-Couple Families | Single-Parent Households |
| No Children | 11 (7.4%) | 7 (12.1%) |
| 1 or 2 Children | 20 (32.3%) | 42 (42.9%) |
| 3 or 4 Children | 7 (50.0%) | 0 (0.0%) |
| 5 or more Children | 0 (0.0%) | 0 (0.0%) |
| Total | 38 (17.0%) | 49 (31.4%) |
Race in Great Falls
The most populous races in Great Falls are White / Caucasian (911 | 54.6%), Black / African American (612 | 36.7%), and Two or more Races (124 | 7.4%).
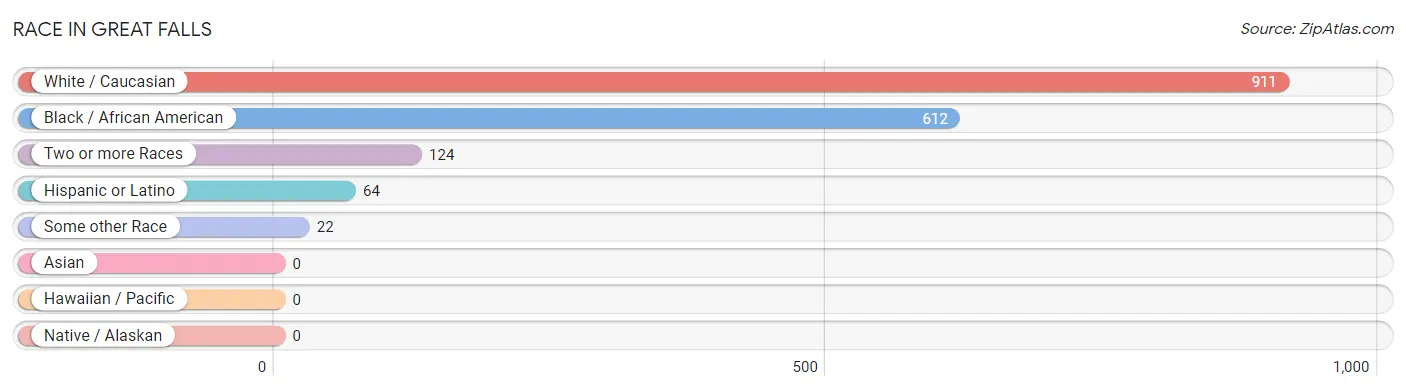
| Race | # Population | % Population |
| Asian | 0 | 0.0% |
| Black / African American | 612 | 36.7% |
| Hawaiian / Pacific | 0 | 0.0% |
| Hispanic or Latino | 64 | 3.8% |
| Native / Alaskan | 0 | 0.0% |
| White / Caucasian | 911 | 54.6% |
| Two or more Races | 124 | 7.4% |
| Some other Race | 22 | 1.3% |
| Total | 1,669 | 100.0% |
Ancestry in Great Falls
The most populous ancestries reported in Great Falls are American (191 | 11.4%), English (166 | 10.0%), Irish (100 | 6.0%), Central American (64 | 3.8%), and Honduran (64 | 3.8%), together accounting for 35.0% of all Great Falls residents.
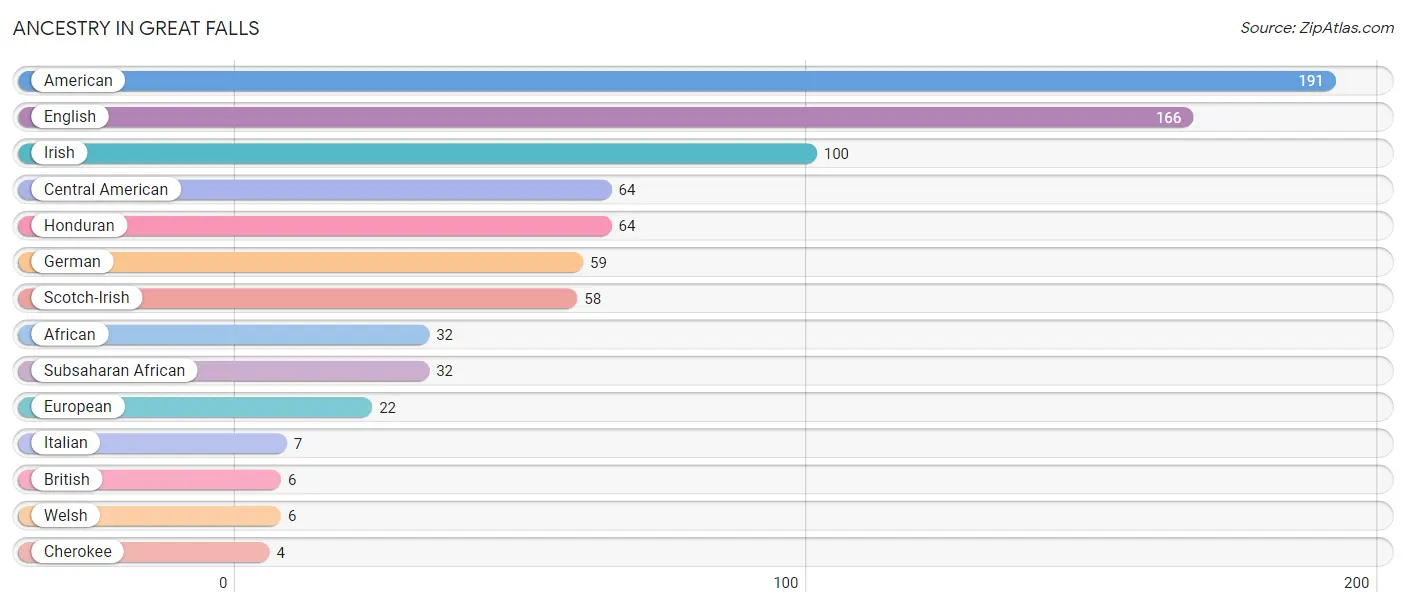
| Ancestry | # Population | % Population |
| African | 32 | 1.9% |
| American | 191 | 11.4% |
| British | 6 | 0.4% |
| Central American | 64 | 3.8% |
| Cherokee | 4 | 0.2% |
| English | 166 | 10.0% |
| European | 22 | 1.3% |
| German | 59 | 3.5% |
| Honduran | 64 | 3.8% |
| Irish | 100 | 6.0% |
| Italian | 7 | 0.4% |
| Scotch-Irish | 58 | 3.5% |
| Subsaharan African | 32 | 1.9% |
| Welsh | 6 | 0.4% | View All 14 Rows |
Immigrants in Great Falls
The most numerous immigrant groups reported in Great Falls came from Central America (64 | 3.8%), Honduras (64 | 3.8%), Latin America (64 | 3.8%), Europe (6 | 0.4%), and Northern Europe (6 | 0.4%), together accounting for 12.2% of all Great Falls residents.
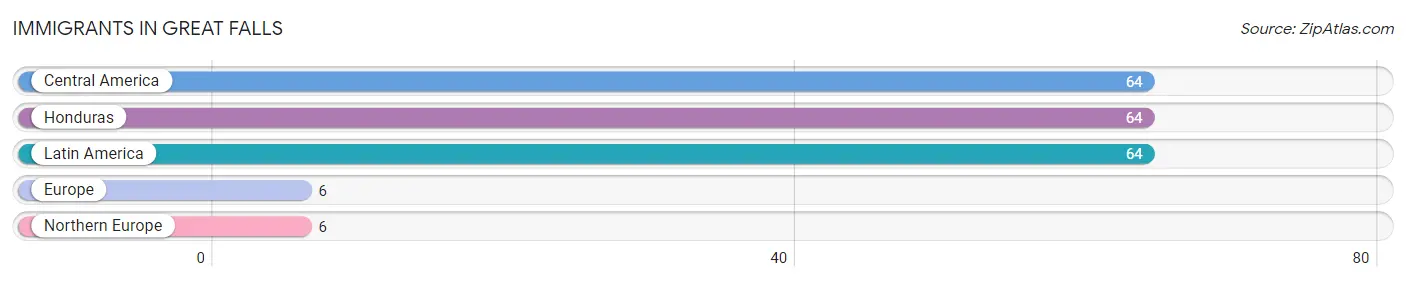
| Immigration Origin | # Population | % Population |
| Central America | 64 | 3.8% |
| Europe | 6 | 0.4% |
| Honduras | 64 | 3.8% |
| Latin America | 64 | 3.8% |
| Northern Europe | 6 | 0.4% | View All 5 Rows |
Sex and Age in Great Falls
Sex and Age in Great Falls
The most populous age groups in Great Falls are 75 to 79 Years (98 | 13.1%) for men and 50 to 54 Years (134 | 14.6%) for women.
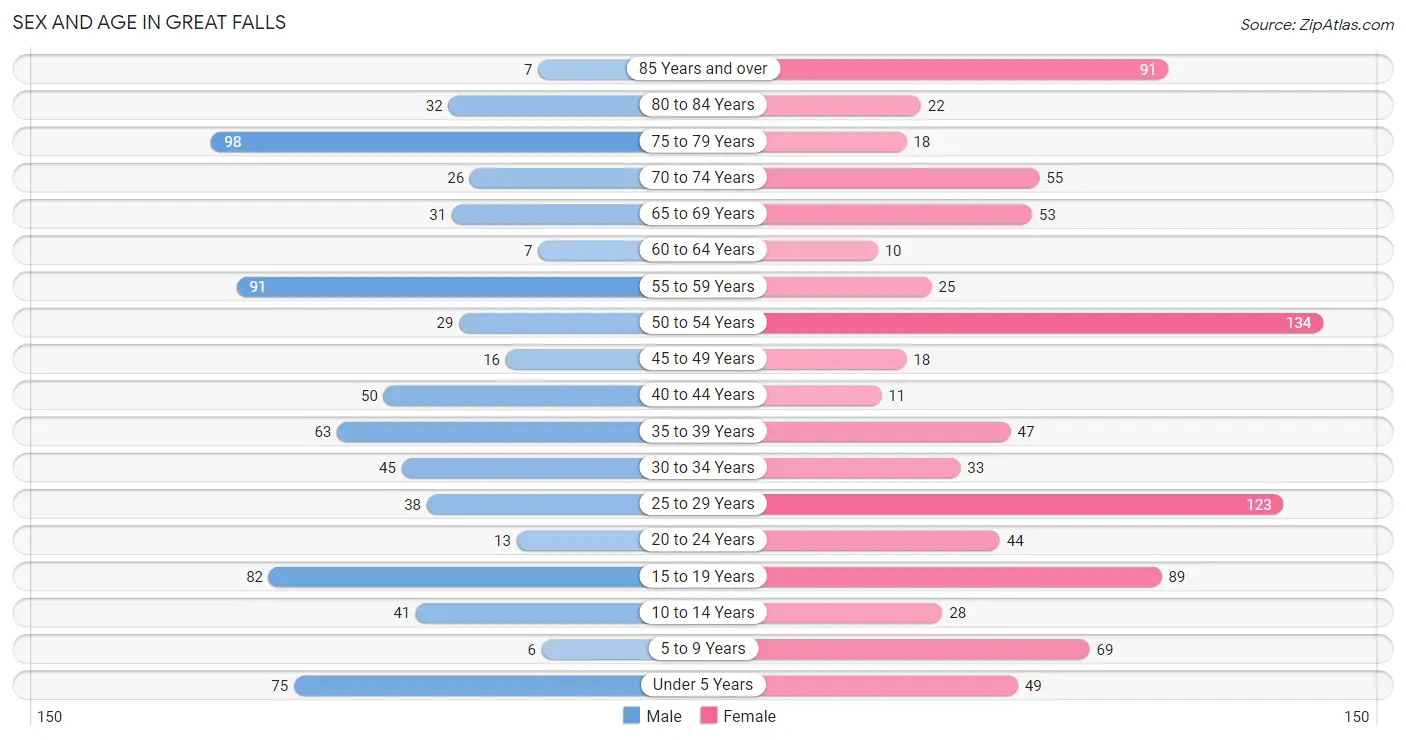
| Age Bracket | Male | Female |
| Under 5 Years | 75 (10.0%) | 49 (5.3%) |
| 5 to 9 Years | 6 (0.8%) | 69 (7.5%) |
| 10 to 14 Years | 41 (5.5%) | 28 (3.0%) |
| 15 to 19 Years | 82 (10.9%) | 89 (9.7%) |
| 20 to 24 Years | 13 (1.7%) | 44 (4.8%) |
| 25 to 29 Years | 38 (5.1%) | 123 (13.4%) |
| 30 to 34 Years | 45 (6.0%) | 33 (3.6%) |
| 35 to 39 Years | 63 (8.4%) | 47 (5.1%) |
| 40 to 44 Years | 50 (6.7%) | 11 (1.2%) |
| 45 to 49 Years | 16 (2.1%) | 18 (2.0%) |
| 50 to 54 Years | 29 (3.9%) | 134 (14.6%) |
| 55 to 59 Years | 91 (12.1%) | 25 (2.7%) |
| 60 to 64 Years | 7 (0.9%) | 10 (1.1%) |
| 65 to 69 Years | 31 (4.1%) | 53 (5.8%) |
| 70 to 74 Years | 26 (3.5%) | 55 (6.0%) |
| 75 to 79 Years | 98 (13.1%) | 18 (2.0%) |
| 80 to 84 Years | 32 (4.3%) | 22 (2.4%) |
| 85 Years and over | 7 (0.9%) | 91 (9.9%) |
| Total | 750 (100.0%) | 919 (100.0%) |
Families and Households in Great Falls
Median Family Size in Great Falls
The median family size in Great Falls is 3.41 persons per family, with married-couple families (224 | 59.0%) accounting for the largest median family size of 3.54 persons per family. On the other hand, single male/father families (44 | 11.6%) represent the smallest median family size with 3.11 persons per family.
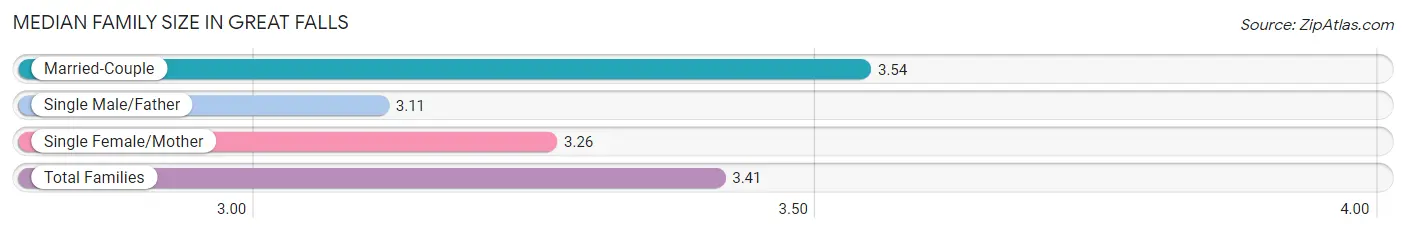
| Family Type | # Families | Family Size |
| Married-Couple | 224 (59.0%) | 3.54 |
| Single Male/Father | 44 (11.6%) | 3.11 |
| Single Female/Mother | 112 (29.5%) | 3.26 |
| Total Families | 380 (100.0%) | 3.41 |
Median Household Size in Great Falls
The median household size in Great Falls is 2.43 persons per household, with married-couple households (224 | 32.6%) accounting for the largest median household size of 3.54 persons per household. non-family households (308 | 44.8%) represent the smallest median household size with 1.14 persons per household.
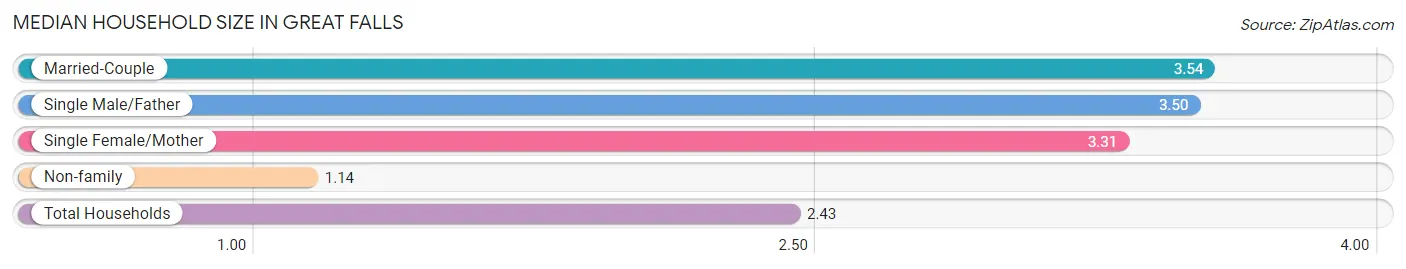
| Household Type | # Households | Household Size |
| Married-Couple | 224 (32.6%) | 3.54 |
| Single Male/Father | 44 (6.4%) | 3.50 |
| Single Female/Mother | 112 (16.3%) | 3.31 |
| Non-family | 308 (44.8%) | 1.14 |
| Total Households | 688 (100.0%) | 2.43 |
Household Size by Marriage Status in Great Falls
Out of a total of 688 households in Great Falls, 380 (55.2%) are family households, while 308 (44.8%) are nonfamily households. The most numerous type of family households are 2-person households, comprising 203, and the most common type of nonfamily households are 1-person households, comprising 283.
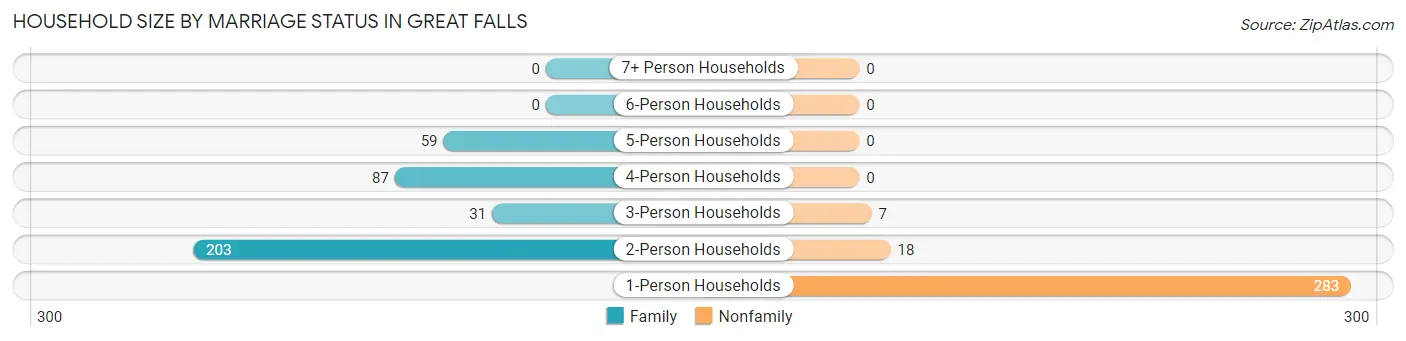
| Household Size | Family Households | Nonfamily Households |
| 1-Person Households | - | 283 (41.1%) |
| 2-Person Households | 203 (29.5%) | 18 (2.6%) |
| 3-Person Households | 31 (4.5%) | 7 (1.0%) |
| 4-Person Households | 87 (12.7%) | 0 (0.0%) |
| 5-Person Households | 59 (8.6%) | 0 (0.0%) |
| 6-Person Households | 0 (0.0%) | 0 (0.0%) |
| 7+ Person Households | 0 (0.0%) | 0 (0.0%) |
| Total | 380 (55.2%) | 308 (44.8%) |
Female Fertility in Great Falls
Fertility by Age in Great Falls
Average fertility rate in Great Falls is 111.0 births per 1,000 women. Women in the age bracket of 20 to 34 years have the highest fertility rate with 210.0 births per 1,000 women. Women in the age bracket of 20 to 34 years acount for 100.0% of all women with births.
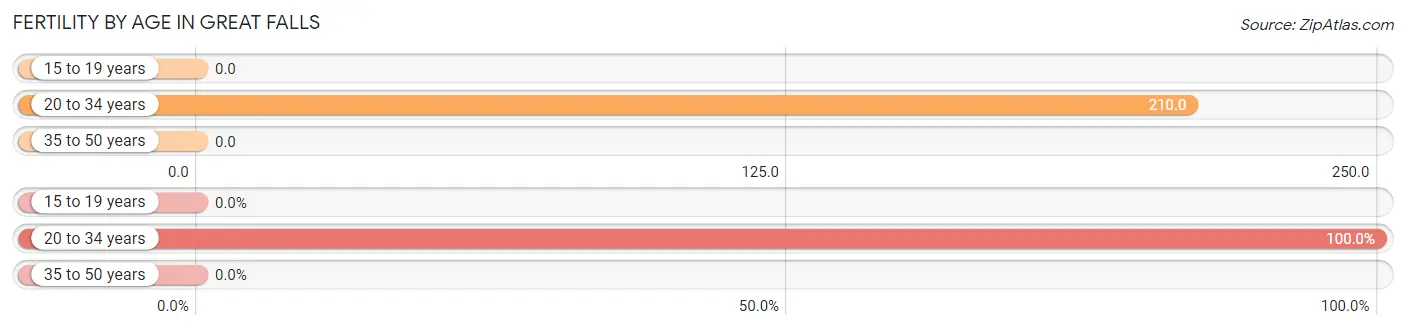
| Age Bracket | Women with Births | Births / 1,000 Women |
| 15 to 19 years | 0 (0.0%) | 0.0 |
| 20 to 34 years | 42 (100.0%) | 210.0 |
| 35 to 50 years | 0 (0.0%) | 0.0 |
| Total | 42 (100.0%) | 111.0 |
Fertility by Age by Marriage Status in Great Falls
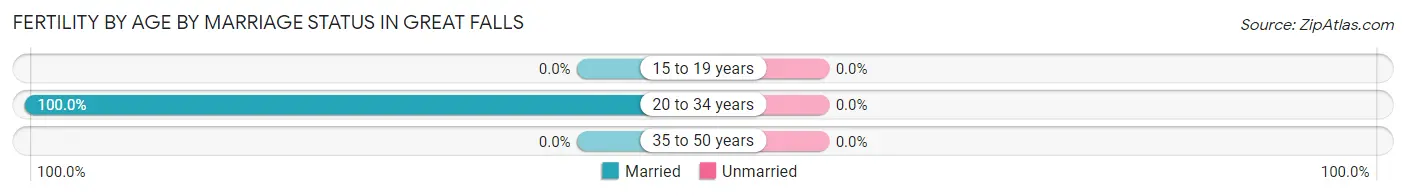
| Age Bracket | Married | Unmarried |
| 15 to 19 years | 0 (0.0%) | 0 (0.0%) |
| 20 to 34 years | 42 (100.0%) | 0 (0.0%) |
| 35 to 50 years | 0 (0.0%) | 0 (0.0%) |
| Total | 42 (100.0%) | 0 (0.0%) |
Fertility by Education in Great Falls
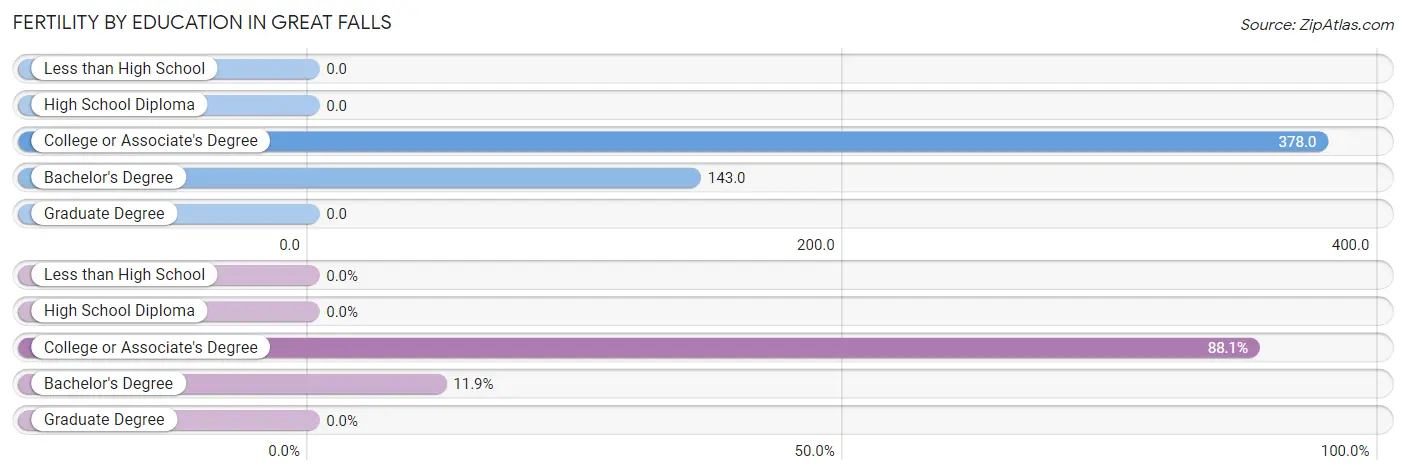
| Educational Attainment | Women with Births | Births / 1,000 Women |
| Less than High School | 0 (0.0%) | 0.0 |
| High School Diploma | 0 (0.0%) | 0.0 |
| College or Associate's Degree | 37 (88.1%) | 378.0 |
| Bachelor's Degree | 5 (11.9%) | 143.0 |
| Graduate Degree | 0 (0.0%) | 0.0 |
| Total | 42 (100.0%) | 111.0 |
Fertility by Education by Marriage Status in Great Falls
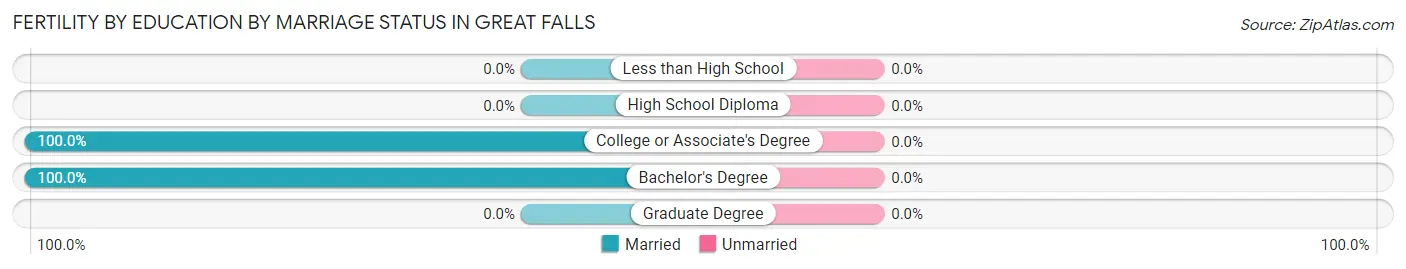
| Educational Attainment | Married | Unmarried |
| Less than High School | 0 (0.0%) | 0 (0.0%) |
| High School Diploma | 0 (0.0%) | 0 (0.0%) |
| College or Associate's Degree | 37 (100.0%) | 0 (0.0%) |
| Bachelor's Degree | 5 (100.0%) | 0 (0.0%) |
| Graduate Degree | 0 (0.0%) | 0 (0.0%) |
| Total | 42 (100.0%) | 0 (0.0%) |
Employment Characteristics in Great Falls
Employment by Class of Employer in Great Falls
Among the 524 employed individuals in Great Falls, private company employees (411 | 78.4%), not-for-profit organizations (42 | 8.0%), and local government employees (26 | 5.0%) make up the most common classes of employment.
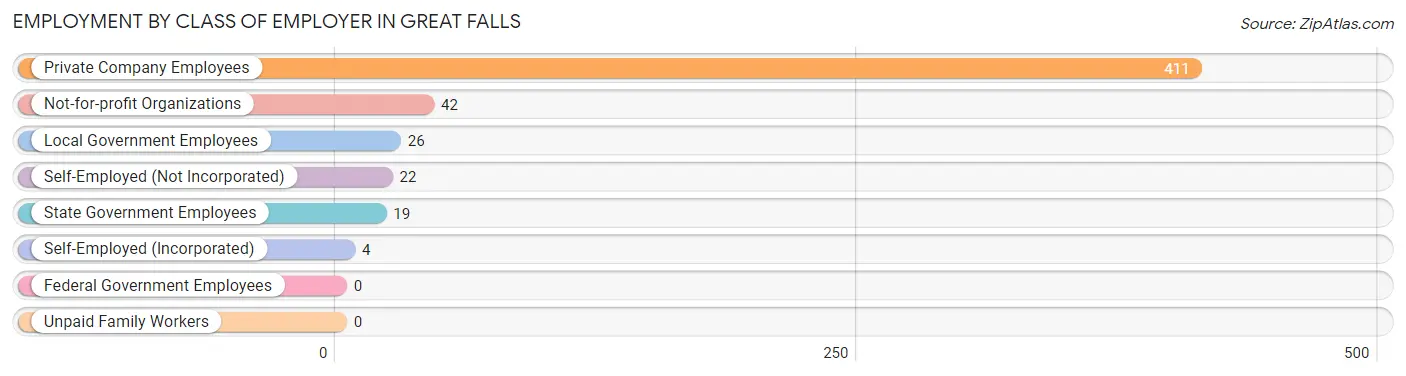
| Employer Class | # Employees | % Employees |
| Private Company Employees | 411 | 78.4% |
| Self-Employed (Incorporated) | 4 | 0.8% |
| Self-Employed (Not Incorporated) | 22 | 4.2% |
| Not-for-profit Organizations | 42 | 8.0% |
| Local Government Employees | 26 | 5.0% |
| State Government Employees | 19 | 3.6% |
| Federal Government Employees | 0 | 0.0% |
| Unpaid Family Workers | 0 | 0.0% |
| Total | 524 | 100.0% |
Employment Status by Age in Great Falls
According to the labor force statistics for Great Falls, out of the total population over 16 years of age (1,389), 41.5% or 576 individuals are in the labor force, with 8.2% or 47 of them unemployed. The age group with the highest labor force participation rate is 30 to 34 years, with 91.0% or 71 individuals in the labor force. Within the labor force, the 16 to 19 years age range has the highest percentage of unemployed individuals, with 69.2% or 9 of them being unemployed.
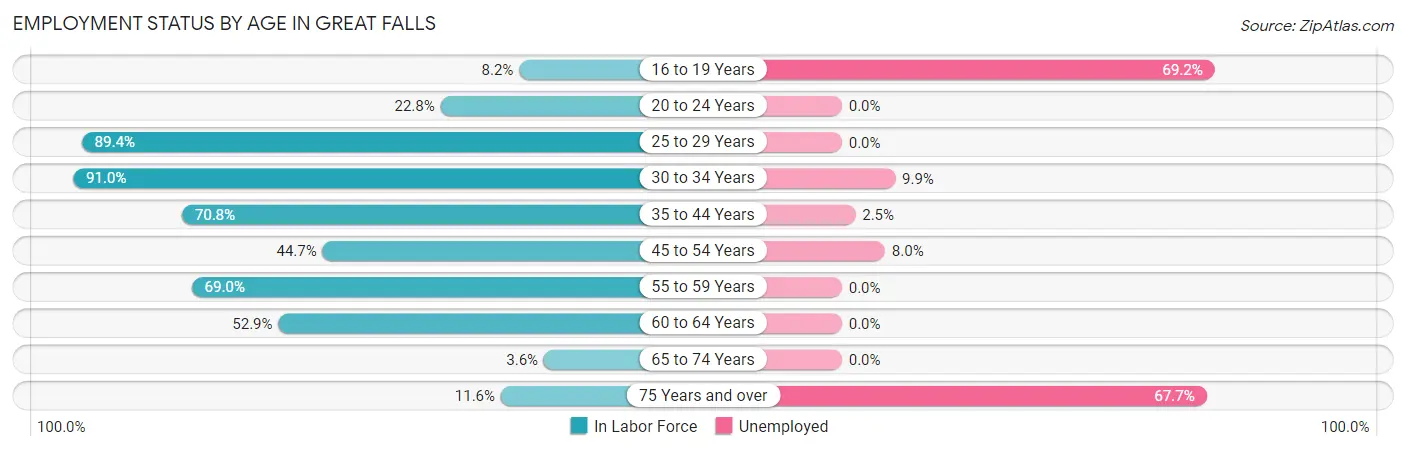
| Age Bracket | In Labor Force | Unemployed |
| 16 to 19 Years | 13 (8.2%) | 9 (69.2%) |
| 20 to 24 Years | 13 (22.8%) | 0 (0.0%) |
| 25 to 29 Years | 144 (89.4%) | 0 (0.0%) |
| 30 to 34 Years | 71 (91.0%) | 7 (9.9%) |
| 35 to 44 Years | 121 (70.8%) | 3 (2.5%) |
| 45 to 54 Years | 88 (44.7%) | 7 (8.0%) |
| 55 to 59 Years | 80 (69.0%) | 0 (0.0%) |
| 60 to 64 Years | 9 (52.9%) | 0 (0.0%) |
| 65 to 74 Years | 6 (3.6%) | 0 (0.0%) |
| 75 Years and over | 31 (11.6%) | 21 (67.7%) |
| Total | 576 (41.5%) | 47 (8.2%) |
Employment Status by Educational Attainment in Great Falls
According to labor force statistics for Great Falls, 69.3% of individuals (513) out of the total population between 25 and 64 years of age (740) are in the labor force, with 3.3% or 17 of them being unemployed. The group with the highest labor force participation rate are those with the educational attainment of bachelor's degree or higher, with 100.0% or 96 individuals in the labor force. Within the labor force, individuals with less than high school education have the highest percentage of unemployment, with 6.8% or 3 of them being unemployed.
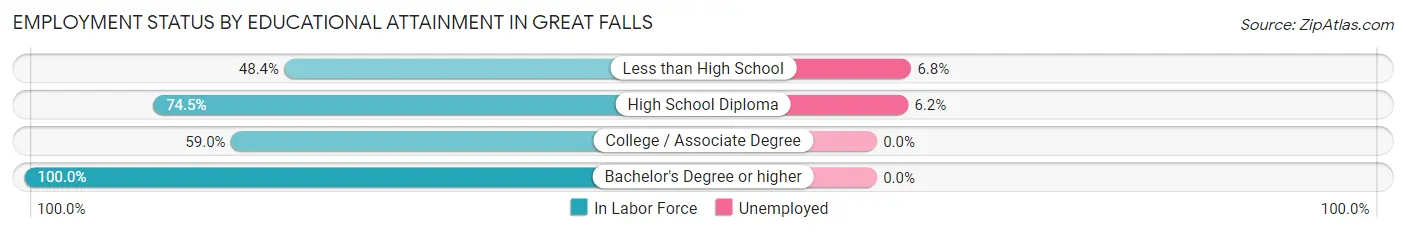
| Educational Attainment | In Labor Force | Unemployed |
| Less than High School | 44 (48.4%) | 6 (6.8%) |
| High School Diploma | 225 (74.5%) | 19 (6.2%) |
| College / Associate Degree | 148 (59.0%) | 0 (0.0%) |
| Bachelor's Degree or higher | 96 (100.0%) | 0 (0.0%) |
| Total | 513 (69.3%) | 24 (3.3%) |
Employment Occupations by Sex in Great Falls
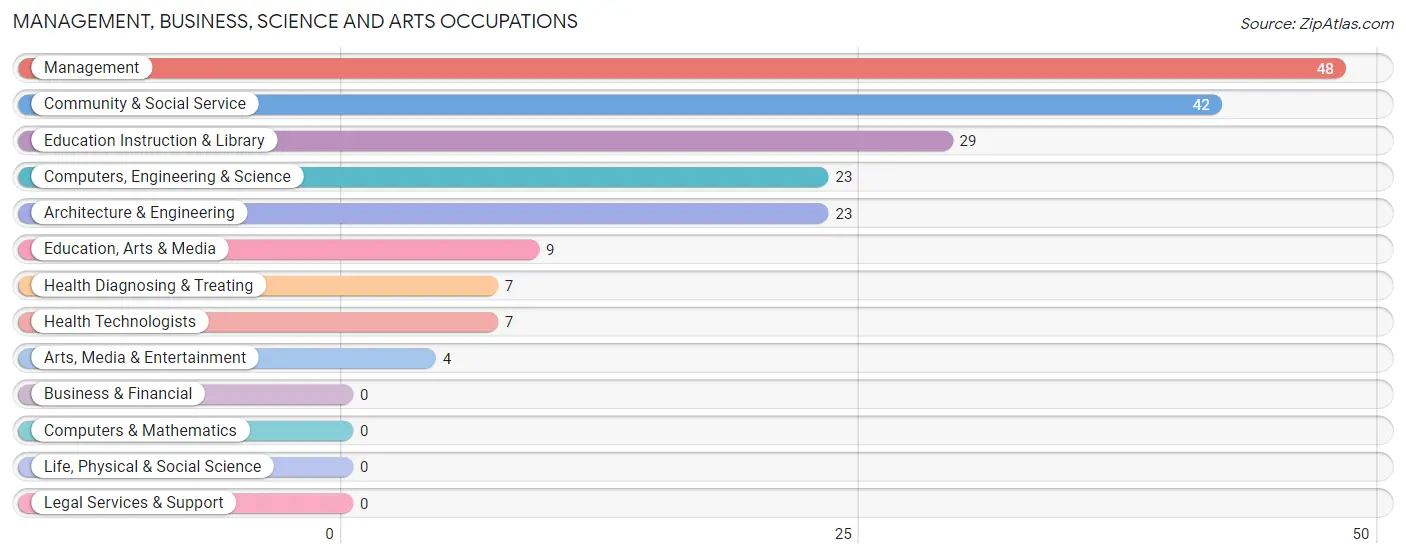
Management, Business, Science and Arts Occupations
The most common Management, Business, Science and Arts occupations in Great Falls are Management (48 | 9.1%), Community & Social Service (42 | 7.9%), Education Instruction & Library (29 | 5.5%), Computers, Engineering & Science (23 | 4.3%), and Architecture & Engineering (23 | 4.3%).
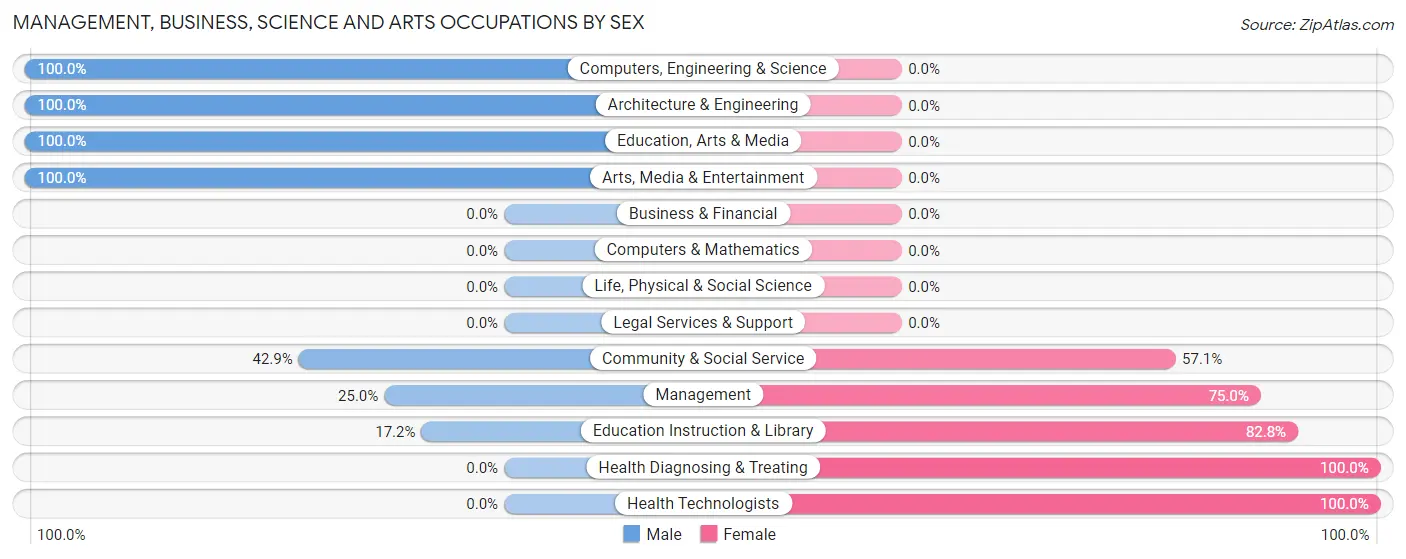
Management, Business, Science and Arts Occupations by Sex
Within the Management, Business, Science and Arts occupations in Great Falls, the most male-oriented occupations are Computers, Engineering & Science (100.0%), Architecture & Engineering (100.0%), and Education, Arts & Media (100.0%), while the most female-oriented occupations are Health Diagnosing & Treating (100.0%), Health Technologists (100.0%), and Education Instruction & Library (82.8%).
| Occupation | Male | Female |
| Management | 12 (25.0%) | 36 (75.0%) |
| Business & Financial | 0 (0.0%) | 0 (0.0%) |
| Computers, Engineering & Science | 23 (100.0%) | 0 (0.0%) |
| Computers & Mathematics | 0 (0.0%) | 0 (0.0%) |
| Architecture & Engineering | 23 (100.0%) | 0 (0.0%) |
| Life, Physical & Social Science | 0 (0.0%) | 0 (0.0%) |
| Community & Social Service | 18 (42.9%) | 24 (57.1%) |
| Education, Arts & Media | 9 (100.0%) | 0 (0.0%) |
| Legal Services & Support | 0 (0.0%) | 0 (0.0%) |
| Education Instruction & Library | 5 (17.2%) | 24 (82.8%) |
| Arts, Media & Entertainment | 4 (100.0%) | 0 (0.0%) |
| Health Diagnosing & Treating | 0 (0.0%) | 7 (100.0%) |
| Health Technologists | 0 (0.0%) | 7 (100.0%) |
| Total (Category) | 53 (44.2%) | 67 (55.8%) |
| Total (Overall) | 266 (50.3%) | 263 (49.7%) |
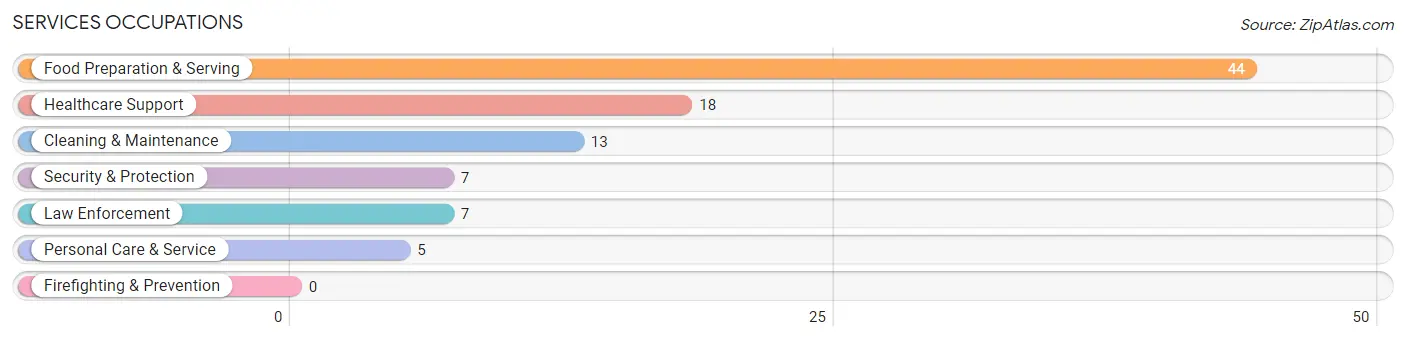
Services Occupations
The most common Services occupations in Great Falls are Food Preparation & Serving (44 | 8.3%), Healthcare Support (18 | 3.4%), Cleaning & Maintenance (13 | 2.5%), Security & Protection (7 | 1.3%), and Law Enforcement (7 | 1.3%).
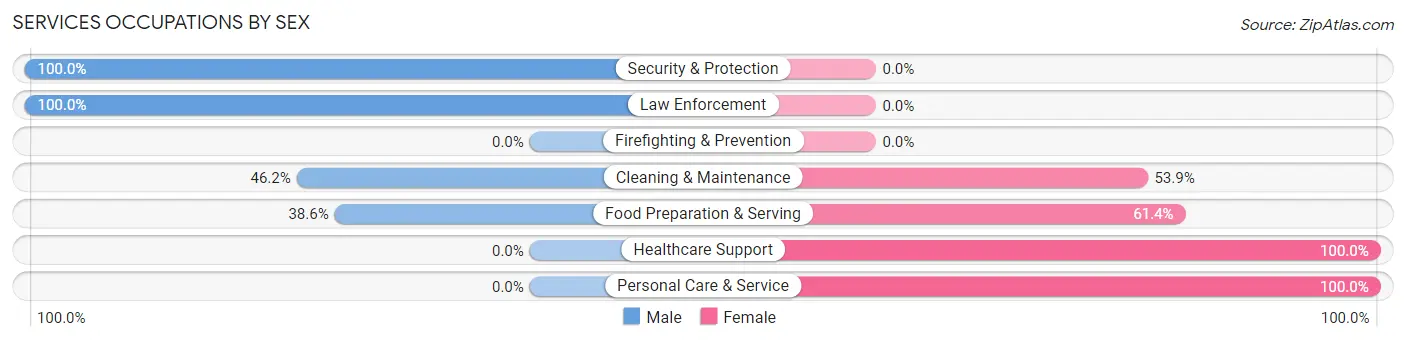
Services Occupations by Sex
Within the Services occupations in Great Falls, the most male-oriented occupations are Security & Protection (100.0%), Law Enforcement (100.0%), and Cleaning & Maintenance (46.2%), while the most female-oriented occupations are Healthcare Support (100.0%), Personal Care & Service (100.0%), and Food Preparation & Serving (61.4%).
| Occupation | Male | Female |
| Healthcare Support | 0 (0.0%) | 18 (100.0%) |
| Security & Protection | 7 (100.0%) | 0 (0.0%) |
| Firefighting & Prevention | 0 (0.0%) | 0 (0.0%) |
| Law Enforcement | 7 (100.0%) | 0 (0.0%) |
| Food Preparation & Serving | 17 (38.6%) | 27 (61.4%) |
| Cleaning & Maintenance | 6 (46.2%) | 7 (53.8%) |
| Personal Care & Service | 0 (0.0%) | 5 (100.0%) |
| Total (Category) | 30 (34.5%) | 57 (65.5%) |
| Total (Overall) | 266 (50.3%) | 263 (49.7%) |
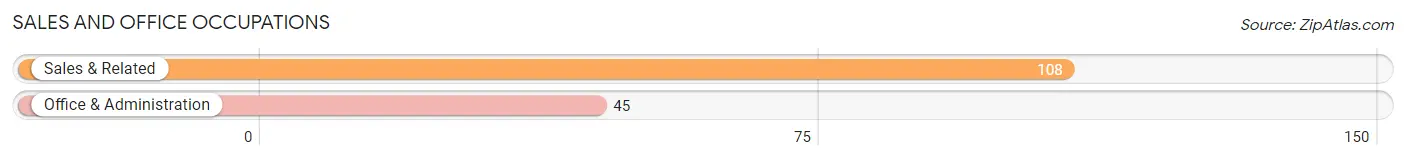
Sales and Office Occupations
The most common Sales and Office occupations in Great Falls are Sales & Related (108 | 20.4%), and Office & Administration (45 | 8.5%).
Sales and Office Occupations by Sex
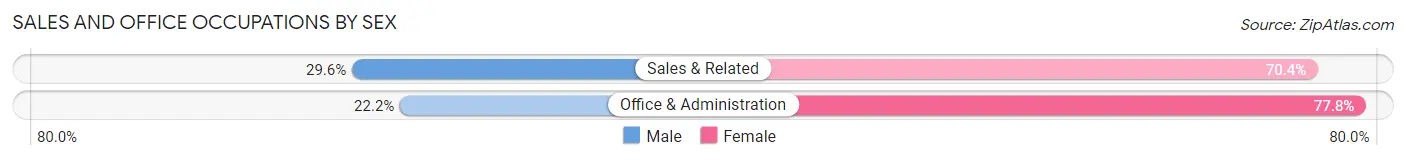
| Occupation | Male | Female |
| Sales & Related | 32 (29.6%) | 76 (70.4%) |
| Office & Administration | 10 (22.2%) | 35 (77.8%) |
| Total (Category) | 42 (27.5%) | 111 (72.6%) |
| Total (Overall) | 266 (50.3%) | 263 (49.7%) |
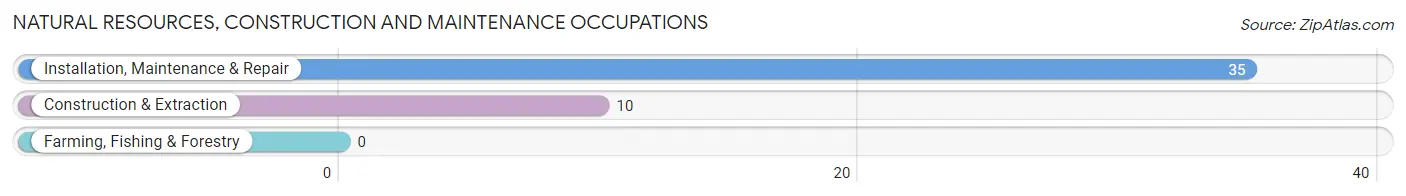
Natural Resources, Construction and Maintenance Occupations
The most common Natural Resources, Construction and Maintenance occupations in Great Falls are Installation, Maintenance & Repair (35 | 6.6%), and Construction & Extraction (10 | 1.9%).
Natural Resources, Construction and Maintenance Occupations by Sex
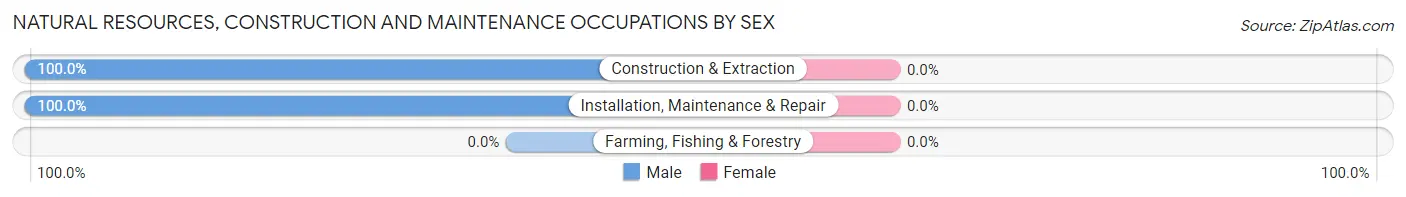
| Occupation | Male | Female |
| Farming, Fishing & Forestry | 0 (0.0%) | 0 (0.0%) |
| Construction & Extraction | 10 (100.0%) | 0 (0.0%) |
| Installation, Maintenance & Repair | 35 (100.0%) | 0 (0.0%) |
| Total (Category) | 45 (100.0%) | 0 (0.0%) |
| Total (Overall) | 266 (50.3%) | 263 (49.7%) |
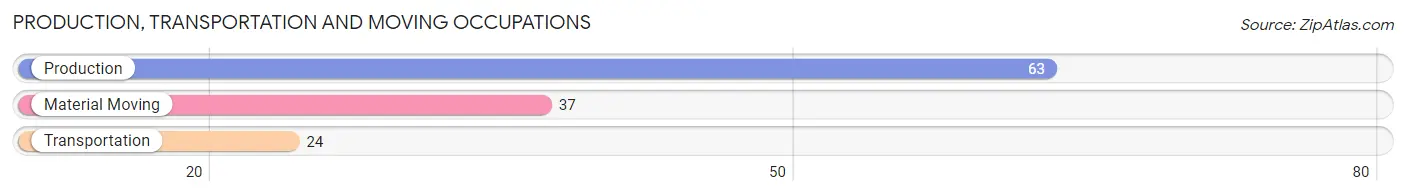
Production, Transportation and Moving Occupations
The most common Production, Transportation and Moving occupations in Great Falls are Production (63 | 11.9%), Material Moving (37 | 7.0%), and Transportation (24 | 4.5%).
Production, Transportation and Moving Occupations by Sex
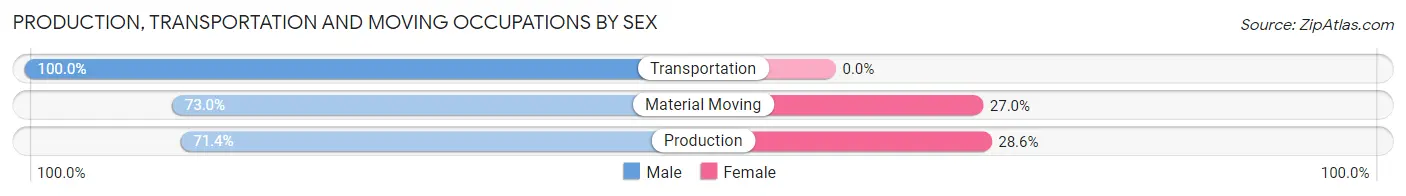
| Occupation | Male | Female |
| Production | 45 (71.4%) | 18 (28.6%) |
| Transportation | 24 (100.0%) | 0 (0.0%) |
| Material Moving | 27 (73.0%) | 10 (27.0%) |
| Total (Category) | 96 (77.4%) | 28 (22.6%) |
| Total (Overall) | 266 (50.3%) | 263 (49.7%) |
Employment Industries by Sex in Great Falls
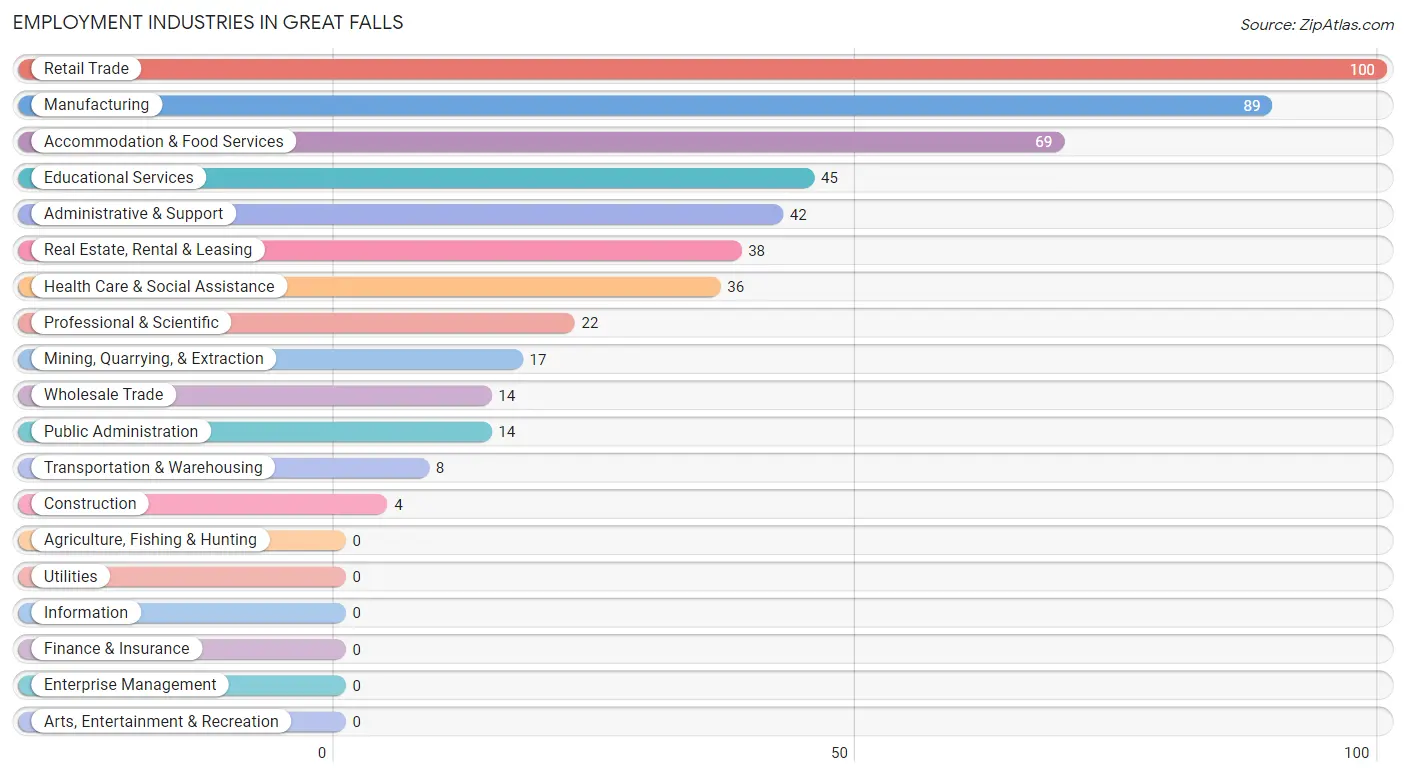
Employment Industries in Great Falls
The major employment industries in Great Falls include Retail Trade (100 | 18.9%), Manufacturing (89 | 16.8%), Accommodation & Food Services (69 | 13.0%), Educational Services (45 | 8.5%), and Administrative & Support (42 | 7.9%).
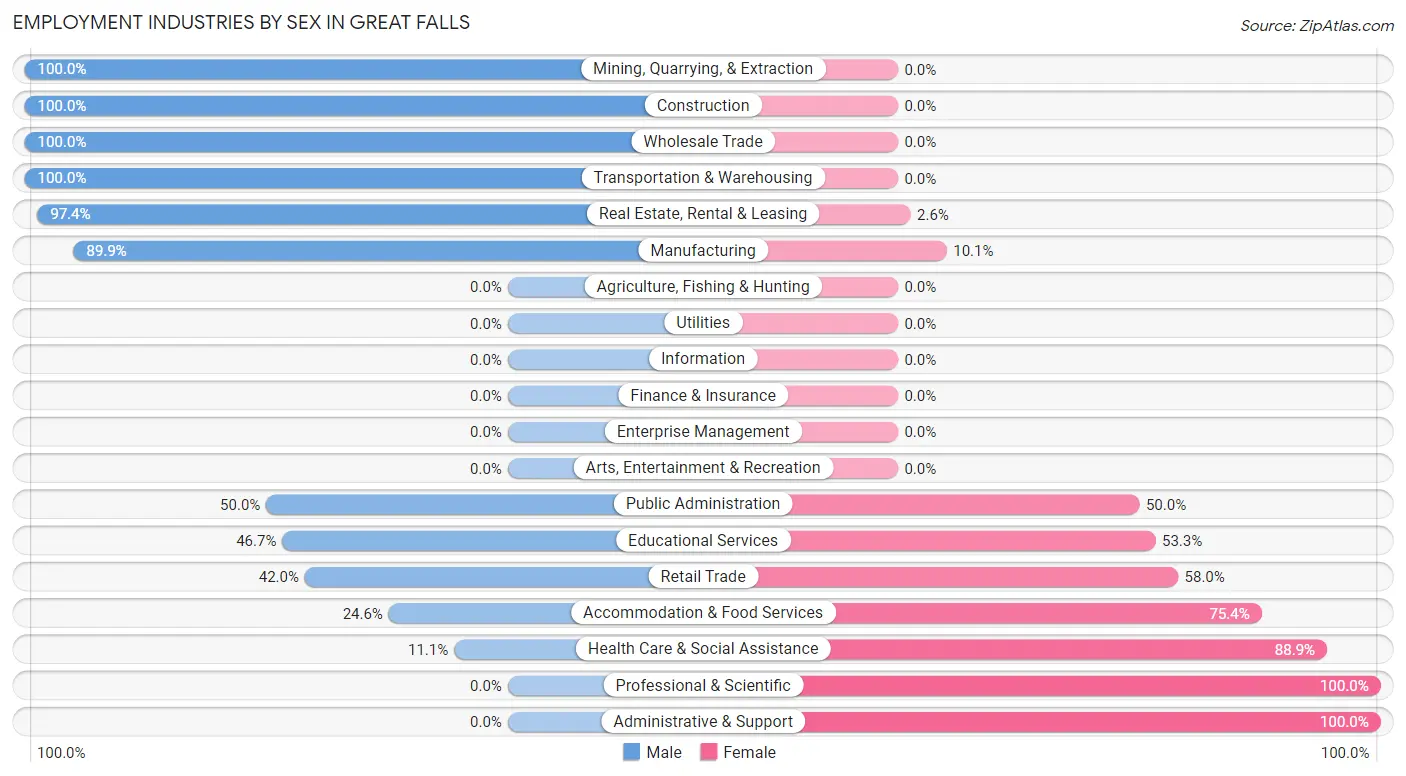
Employment Industries by Sex in Great Falls
The Great Falls industries that see more men than women are Mining, Quarrying, & Extraction (100.0%), Construction (100.0%), and Wholesale Trade (100.0%), whereas the industries that tend to have a higher number of women are Professional & Scientific (100.0%), Administrative & Support (100.0%), and Health Care & Social Assistance (88.9%).
| Industry | Male | Female |
| Agriculture, Fishing & Hunting | 0 (0.0%) | 0 (0.0%) |
| Mining, Quarrying, & Extraction | 17 (100.0%) | 0 (0.0%) |
| Construction | 4 (100.0%) | 0 (0.0%) |
| Manufacturing | 80 (89.9%) | 9 (10.1%) |
| Wholesale Trade | 14 (100.0%) | 0 (0.0%) |
| Retail Trade | 42 (42.0%) | 58 (58.0%) |
| Transportation & Warehousing | 8 (100.0%) | 0 (0.0%) |
| Utilities | 0 (0.0%) | 0 (0.0%) |
| Information | 0 (0.0%) | 0 (0.0%) |
| Finance & Insurance | 0 (0.0%) | 0 (0.0%) |
| Real Estate, Rental & Leasing | 37 (97.4%) | 1 (2.6%) |
| Professional & Scientific | 0 (0.0%) | 22 (100.0%) |
| Enterprise Management | 0 (0.0%) | 0 (0.0%) |
| Administrative & Support | 0 (0.0%) | 42 (100.0%) |
| Educational Services | 21 (46.7%) | 24 (53.3%) |
| Health Care & Social Assistance | 4 (11.1%) | 32 (88.9%) |
| Arts, Entertainment & Recreation | 0 (0.0%) | 0 (0.0%) |
| Accommodation & Food Services | 17 (24.6%) | 52 (75.4%) |
| Public Administration | 7 (50.0%) | 7 (50.0%) |
| Total | 266 (50.3%) | 263 (49.7%) |
Education in Great Falls
School Enrollment in Great Falls
The most common levels of schooling among the 326 students in Great Falls are high school (146 | 44.8%), elementary school (65 | 19.9%), and middle school (63 | 19.3%).
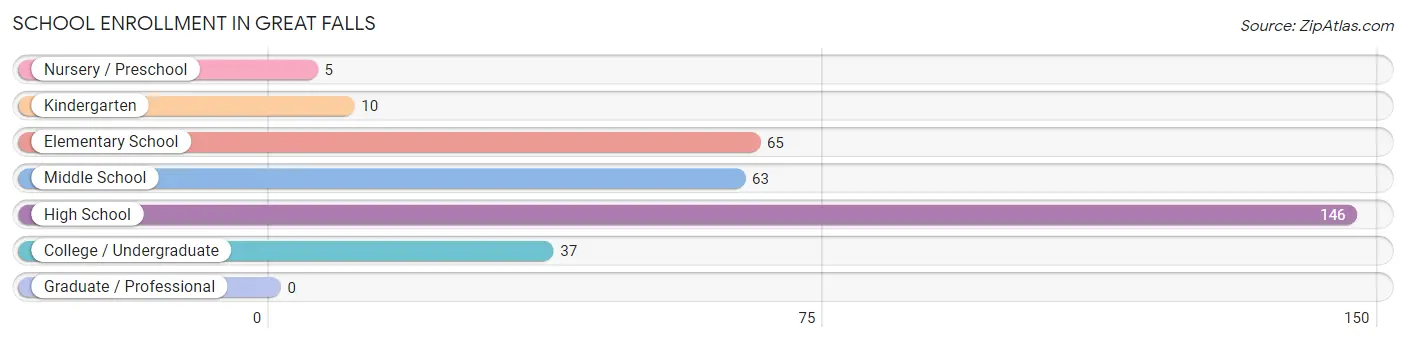
| School Level | # Students | % Students |
| Nursery / Preschool | 5 | 1.5% |
| Kindergarten | 10 | 3.1% |
| Elementary School | 65 | 19.9% |
| Middle School | 63 | 19.3% |
| High School | 146 | 44.8% |
| College / Undergraduate | 37 | 11.4% |
| Graduate / Professional | 0 | 0.0% |
| Total | 326 | 100.0% |
School Enrollment by Age by Funding Source in Great Falls
Out of a total of 326 students who are enrolled in schools in Great Falls, 42 (12.9%) attend a private institution, while the remaining 284 (87.1%) are enrolled in public schools. The age group of 10 to 14 year olds has the highest likelihood of being enrolled in private schools, with 18 (28.6% in the age bracket) enrolled. Conversely, the age group of 3 to 4 year olds has the lowest likelihood of being enrolled in a private school, with 5 (100.0% in the age bracket) attending a public institution.
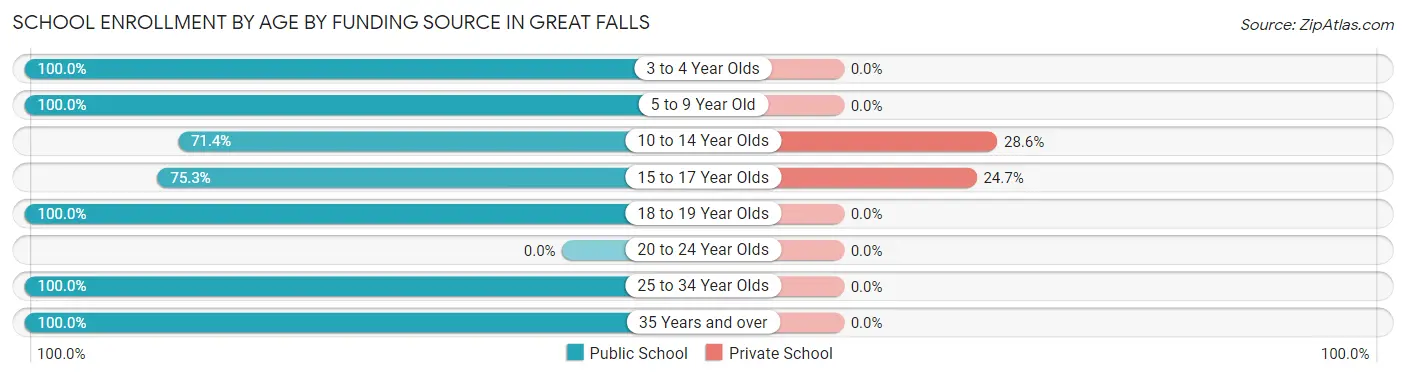
| Age Bracket | Public School | Private School |
| 3 to 4 Year Olds | 5 (100.0%) | 0 (0.0%) |
| 5 to 9 Year Old | 75 (100.0%) | 0 (0.0%) |
| 10 to 14 Year Olds | 45 (71.4%) | 18 (28.6%) |
| 15 to 17 Year Olds | 73 (75.3%) | 24 (24.7%) |
| 18 to 19 Year Olds | 26 (100.0%) | 0 (0.0%) |
| 20 to 24 Year Olds | 0 (0.0%) | 0 (0.0%) |
| 25 to 34 Year Olds | 37 (100.0%) | 0 (0.0%) |
| 35 Years and over | 23 (100.0%) | 0 (0.0%) |
| Total | 284 (87.1%) | 42 (12.9%) |
Educational Attainment by Field of Study in Great Falls
Business (42 | 30.0%), education (30 | 21.4%), science & technology (20 | 14.3%), liberal arts & history (14 | 10.0%), and physical & health sciences (13 | 9.3%) are the most common fields of study among 140 individuals in Great Falls who have obtained a bachelor's degree or higher.
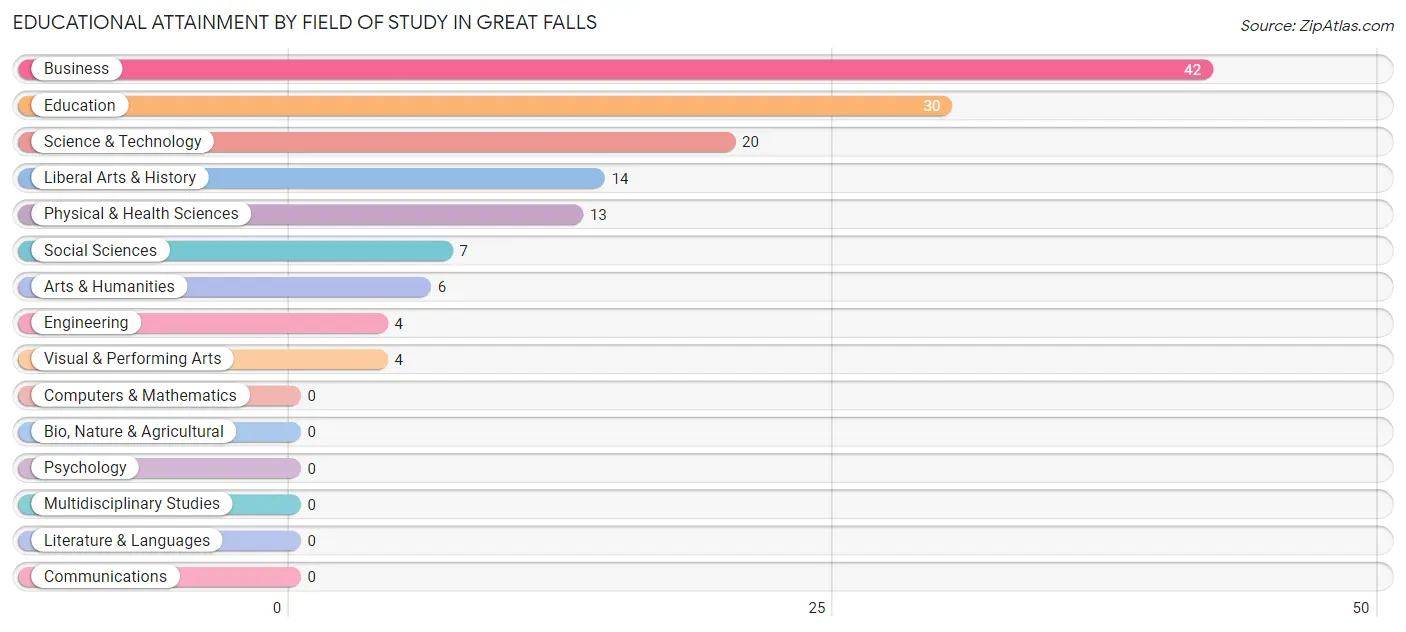
| Field of Study | # Graduates | % Graduates |
| Computers & Mathematics | 0 | 0.0% |
| Bio, Nature & Agricultural | 0 | 0.0% |
| Physical & Health Sciences | 13 | 9.3% |
| Psychology | 0 | 0.0% |
| Social Sciences | 7 | 5.0% |
| Engineering | 4 | 2.9% |
| Multidisciplinary Studies | 0 | 0.0% |
| Science & Technology | 20 | 14.3% |
| Business | 42 | 30.0% |
| Education | 30 | 21.4% |
| Literature & Languages | 0 | 0.0% |
| Liberal Arts & History | 14 | 10.0% |
| Visual & Performing Arts | 4 | 2.9% |
| Communications | 0 | 0.0% |
| Arts & Humanities | 6 | 4.3% |
| Total | 140 | 100.0% |
Transportation & Commute in Great Falls
Vehicle Availability by Sex in Great Falls
The most prevalent vehicle ownership categories in Great Falls are males with 2 vehicles (106, accounting for 40.6%) and females with 2 vehicles (55, making up 40.3%).
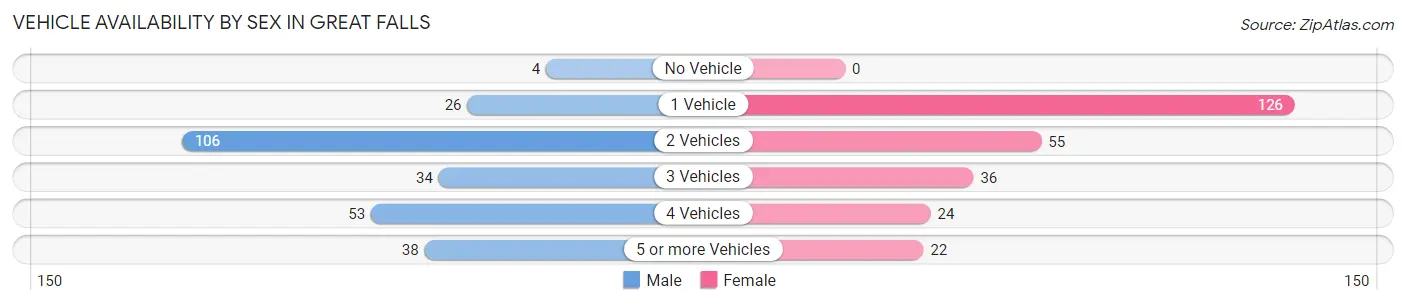
| Vehicles Available | Male | Female |
| No Vehicle | 4 (1.5%) | 0 (0.0%) |
| 1 Vehicle | 26 (10.0%) | 126 (47.9%) |
| 2 Vehicles | 106 (40.6%) | 55 (20.9%) |
| 3 Vehicles | 34 (13.0%) | 36 (13.7%) |
| 4 Vehicles | 53 (20.3%) | 24 (9.1%) |
| 5 or more Vehicles | 38 (14.6%) | 22 (8.4%) |
| Total | 261 (100.0%) | 263 (100.0%) |
Commute Time in Great Falls
The most frequently occuring commute durations in Great Falls are 25 to 29 minutes (85 commuters, 17.5%), 35 to 39 minutes (83 commuters, 17.1%), and 30 to 34 minutes (72 commuters, 14.8%).
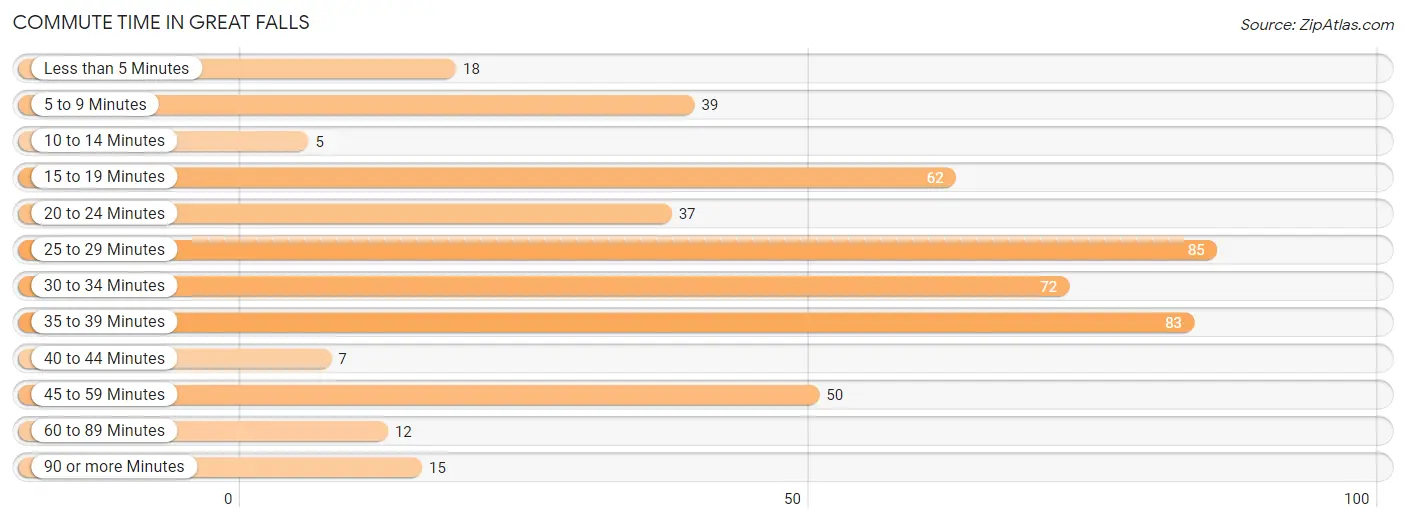
| Commute Time | # Commuters | % Commuters |
| Less than 5 Minutes | 18 | 3.7% |
| 5 to 9 Minutes | 39 | 8.0% |
| 10 to 14 Minutes | 5 | 1.0% |
| 15 to 19 Minutes | 62 | 12.8% |
| 20 to 24 Minutes | 37 | 7.6% |
| 25 to 29 Minutes | 85 | 17.5% |
| 30 to 34 Minutes | 72 | 14.8% |
| 35 to 39 Minutes | 83 | 17.1% |
| 40 to 44 Minutes | 7 | 1.4% |
| 45 to 59 Minutes | 50 | 10.3% |
| 60 to 89 Minutes | 12 | 2.5% |
| 90 or more Minutes | 15 | 3.1% |
Commute Time by Sex in Great Falls
The most common commute times in Great Falls are 25 to 29 minutes (67 commuters, 28.0%) for males and 35 to 39 minutes (59 commuters, 24.0%) for females.
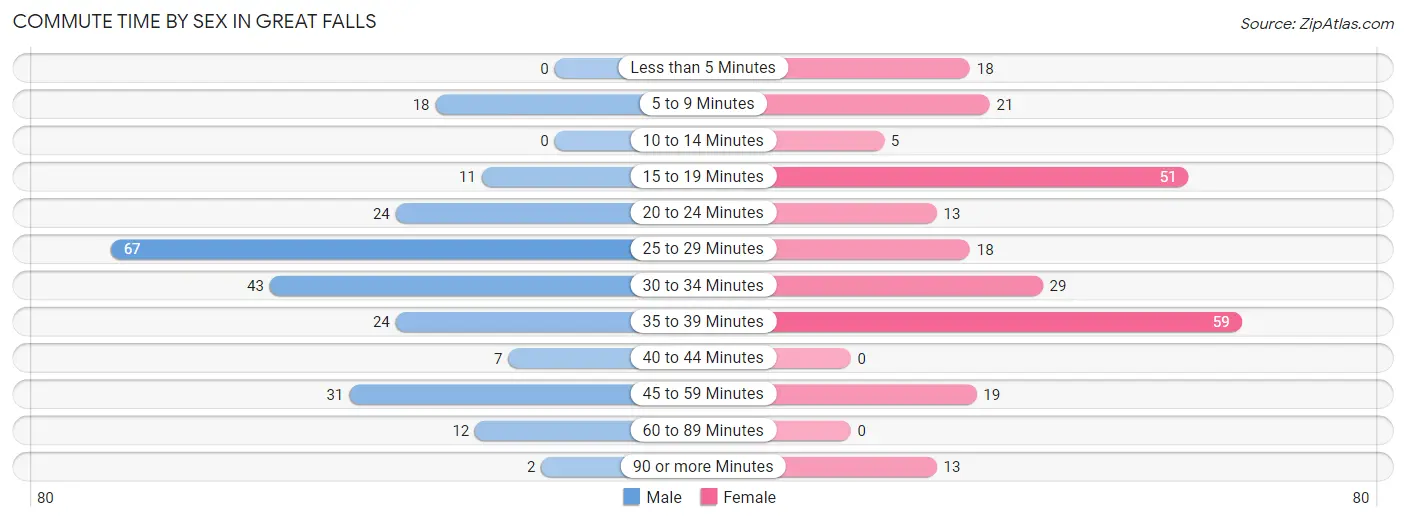
| Commute Time | Male | Female |
| Less than 5 Minutes | 0 (0.0%) | 18 (7.3%) |
| 5 to 9 Minutes | 18 (7.5%) | 21 (8.5%) |
| 10 to 14 Minutes | 0 (0.0%) | 5 (2.0%) |
| 15 to 19 Minutes | 11 (4.6%) | 51 (20.7%) |
| 20 to 24 Minutes | 24 (10.0%) | 13 (5.3%) |
| 25 to 29 Minutes | 67 (28.0%) | 18 (7.3%) |
| 30 to 34 Minutes | 43 (18.0%) | 29 (11.8%) |
| 35 to 39 Minutes | 24 (10.0%) | 59 (24.0%) |
| 40 to 44 Minutes | 7 (2.9%) | 0 (0.0%) |
| 45 to 59 Minutes | 31 (13.0%) | 19 (7.7%) |
| 60 to 89 Minutes | 12 (5.0%) | 0 (0.0%) |
| 90 or more Minutes | 2 (0.8%) | 13 (5.3%) |
Time of Departure to Work by Sex in Great Falls
The most frequent times of departure to work in Great Falls are 12:00 PM to 3:59 PM (67, 28.0%) for males and 5:00 AM to 5:29 AM (38, 15.4%) for females.
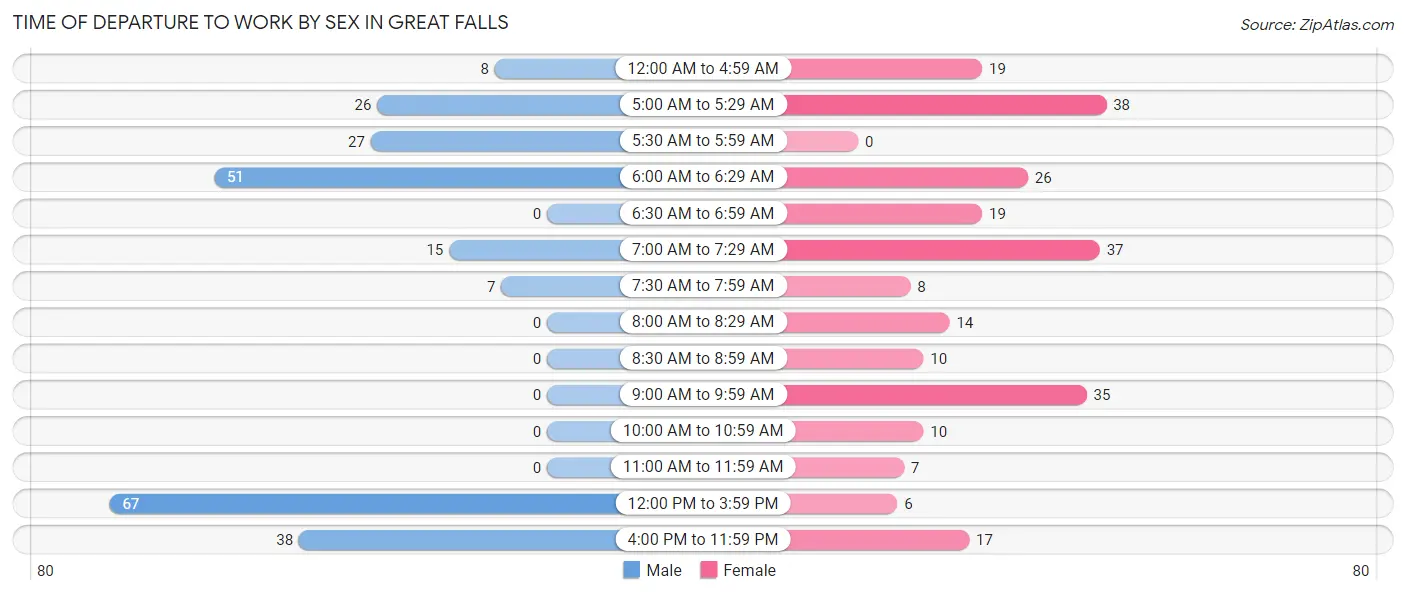
| Time of Departure | Male | Female |
| 12:00 AM to 4:59 AM | 8 (3.4%) | 19 (7.7%) |
| 5:00 AM to 5:29 AM | 26 (10.9%) | 38 (15.4%) |
| 5:30 AM to 5:59 AM | 27 (11.3%) | 0 (0.0%) |
| 6:00 AM to 6:29 AM | 51 (21.3%) | 26 (10.6%) |
| 6:30 AM to 6:59 AM | 0 (0.0%) | 19 (7.7%) |
| 7:00 AM to 7:29 AM | 15 (6.3%) | 37 (15.0%) |
| 7:30 AM to 7:59 AM | 7 (2.9%) | 8 (3.3%) |
| 8:00 AM to 8:29 AM | 0 (0.0%) | 14 (5.7%) |
| 8:30 AM to 8:59 AM | 0 (0.0%) | 10 (4.1%) |
| 9:00 AM to 9:59 AM | 0 (0.0%) | 35 (14.2%) |
| 10:00 AM to 10:59 AM | 0 (0.0%) | 10 (4.1%) |
| 11:00 AM to 11:59 AM | 0 (0.0%) | 7 (2.9%) |
| 12:00 PM to 3:59 PM | 67 (28.0%) | 6 (2.4%) |
| 4:00 PM to 11:59 PM | 38 (15.9%) | 17 (6.9%) |
| Total | 239 (100.0%) | 246 (100.0%) |
Housing Occupancy in Great Falls
Occupancy by Ownership in Great Falls
Of the total 688 dwellings in Great Falls, owner-occupied units account for 561 (81.5%), while renter-occupied units make up 127 (18.5%).
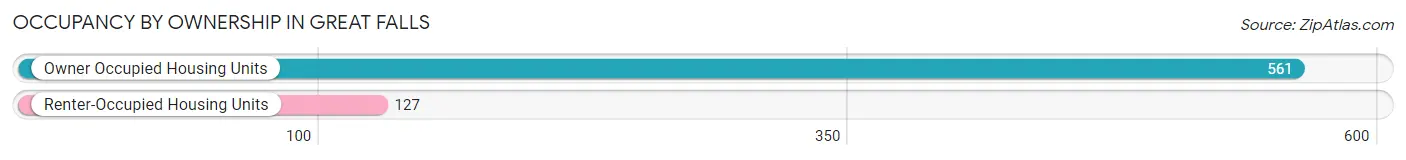
| Occupancy | # Housing Units | % Housing Units |
| Owner Occupied Housing Units | 561 | 81.5% |
| Renter-Occupied Housing Units | 127 | 18.5% |
| Total Occupied Housing Units | 688 | 100.0% |
Occupancy by Household Size in Great Falls
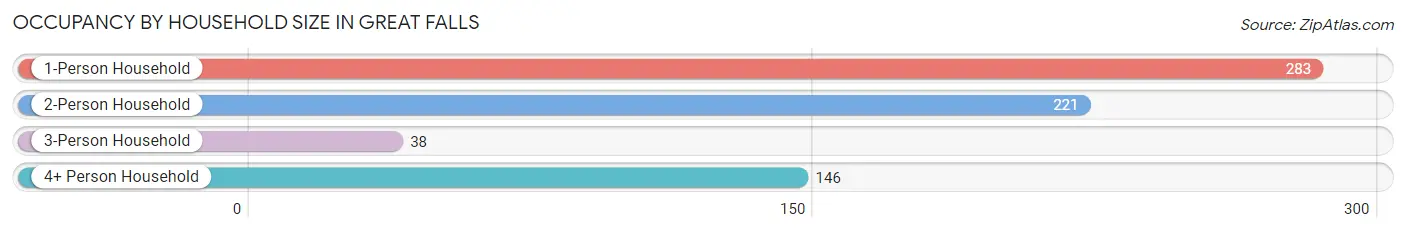
| Household Size | # Housing Units | % Housing Units |
| 1-Person Household | 283 | 41.1% |
| 2-Person Household | 221 | 32.1% |
| 3-Person Household | 38 | 5.5% |
| 4+ Person Household | 146 | 21.2% |
| Total Housing Units | 688 | 100.0% |
Occupancy by Ownership by Household Size in Great Falls
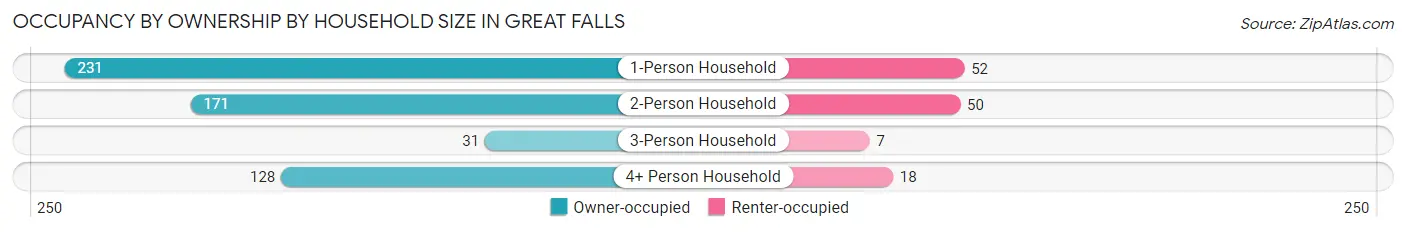
| Household Size | Owner-occupied | Renter-occupied |
| 1-Person Household | 231 (81.6%) | 52 (18.4%) |
| 2-Person Household | 171 (77.4%) | 50 (22.6%) |
| 3-Person Household | 31 (81.6%) | 7 (18.4%) |
| 4+ Person Household | 128 (87.7%) | 18 (12.3%) |
| Total Housing Units | 561 (81.5%) | 127 (18.5%) |
Occupancy by Educational Attainment in Great Falls
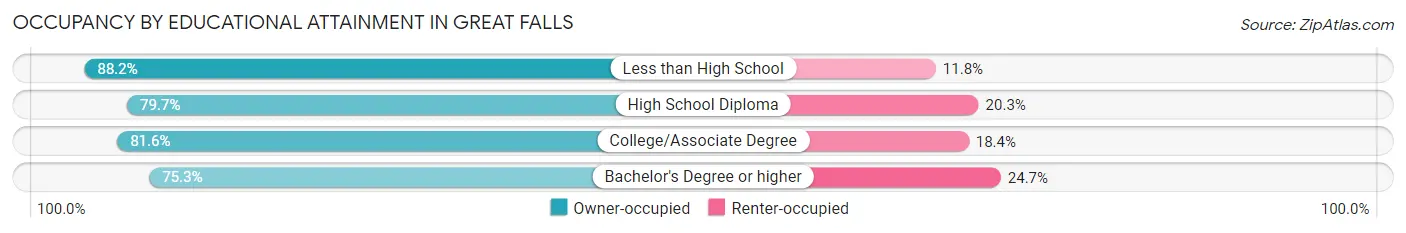
| Household Size | Owner-occupied | Renter-occupied |
| Less than High School | 134 (88.2%) | 18 (11.8%) |
| High School Diploma | 200 (79.7%) | 51 (20.3%) |
| College/Associate Degree | 160 (81.6%) | 36 (18.4%) |
| Bachelor's Degree or higher | 67 (75.3%) | 22 (24.7%) |
Occupancy by Age of Householder in Great Falls
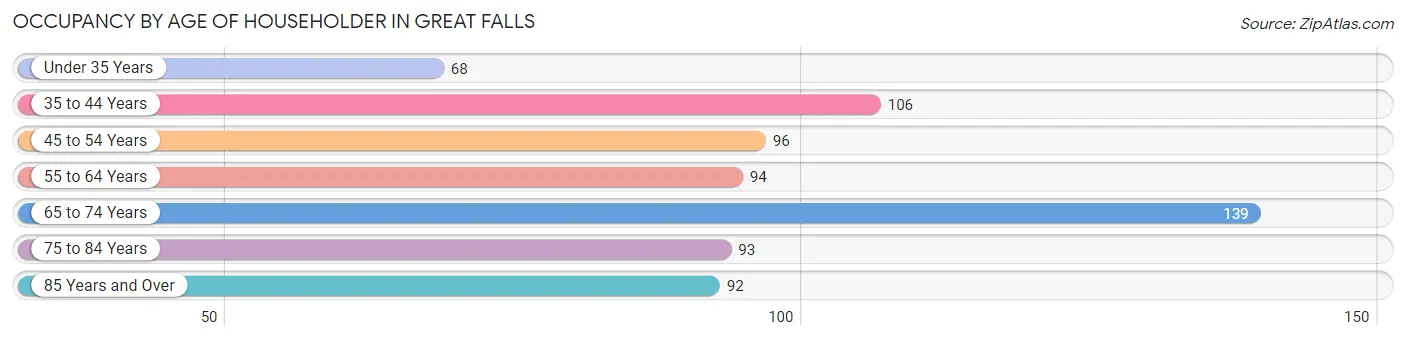
| Age Bracket | # Households | % Households |
| Under 35 Years | 68 | 9.9% |
| 35 to 44 Years | 106 | 15.4% |
| 45 to 54 Years | 96 | 14.0% |
| 55 to 64 Years | 94 | 13.7% |
| 65 to 74 Years | 139 | 20.2% |
| 75 to 84 Years | 93 | 13.5% |
| 85 Years and Over | 92 | 13.4% |
| Total | 688 | 100.0% |
Housing Finances in Great Falls
Median Income by Occupancy in Great Falls
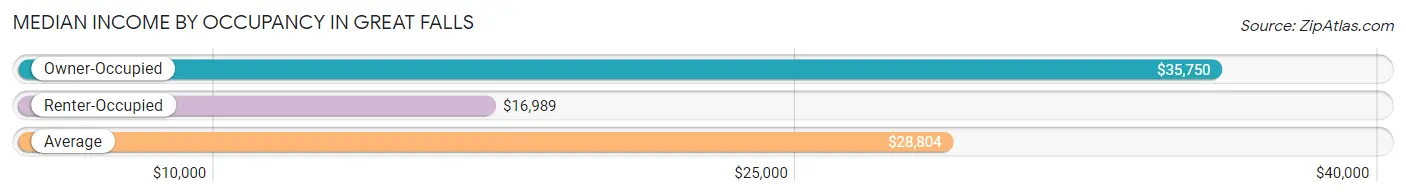
| Occupancy Type | # Households | Median Income |
| Owner-Occupied | 561 (81.5%) | $35,750 |
| Renter-Occupied | 127 (18.5%) | $16,989 |
| Average | 688 (100.0%) | $28,804 |
Occupancy by Householder Income Bracket in Great Falls
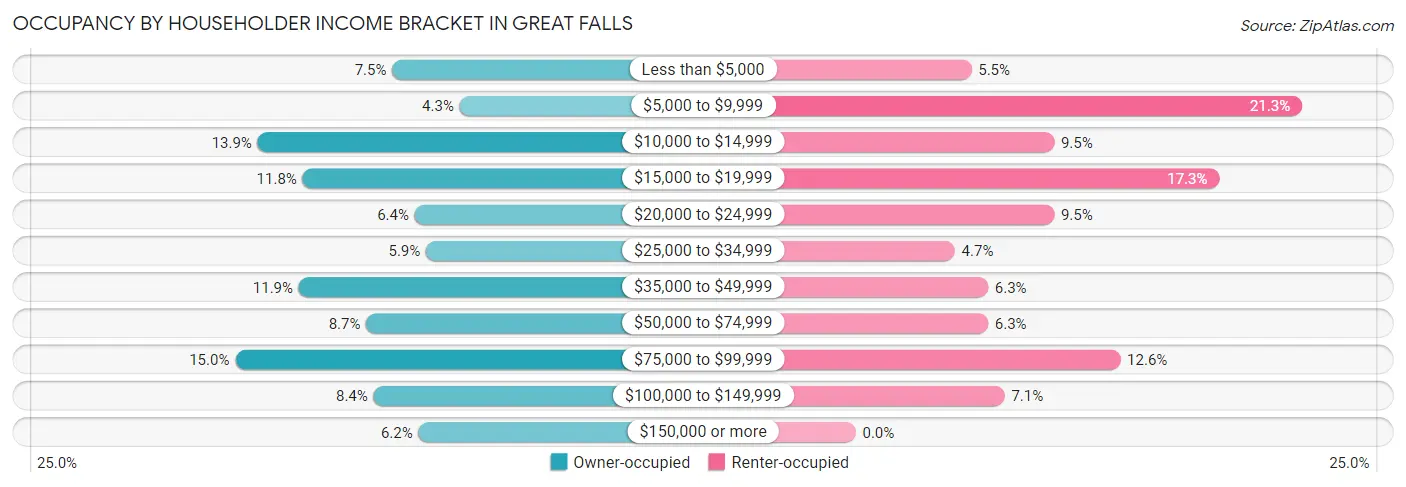
| Income Bracket | Owner-occupied | Renter-occupied |
| Less than $5,000 | 42 (7.5%) | 7 (5.5%) |
| $5,000 to $9,999 | 24 (4.3%) | 27 (21.3%) |
| $10,000 to $14,999 | 78 (13.9%) | 12 (9.5%) |
| $15,000 to $19,999 | 66 (11.8%) | 22 (17.3%) |
| $20,000 to $24,999 | 36 (6.4%) | 12 (9.5%) |
| $25,000 to $34,999 | 33 (5.9%) | 6 (4.7%) |
| $35,000 to $49,999 | 67 (11.9%) | 8 (6.3%) |
| $50,000 to $74,999 | 49 (8.7%) | 8 (6.3%) |
| $75,000 to $99,999 | 84 (15.0%) | 16 (12.6%) |
| $100,000 to $149,999 | 47 (8.4%) | 9 (7.1%) |
| $150,000 or more | 35 (6.2%) | 0 (0.0%) |
| Total | 561 (100.0%) | 127 (100.0%) |
Monthly Housing Cost Tiers in Great Falls
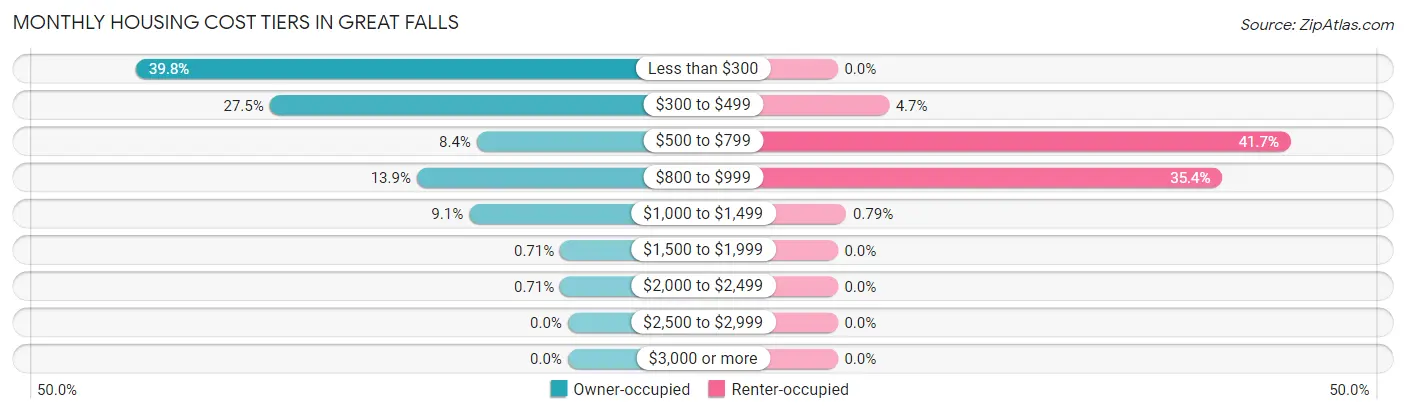
| Monthly Cost | Owner-occupied | Renter-occupied |
| Less than $300 | 223 (39.8%) | 0 (0.0%) |
| $300 to $499 | 154 (27.5%) | 6 (4.7%) |
| $500 to $799 | 47 (8.4%) | 53 (41.7%) |
| $800 to $999 | 78 (13.9%) | 45 (35.4%) |
| $1,000 to $1,499 | 51 (9.1%) | 1 (0.8%) |
| $1,500 to $1,999 | 4 (0.7%) | 0 (0.0%) |
| $2,000 to $2,499 | 4 (0.7%) | 0 (0.0%) |
| $2,500 to $2,999 | 0 (0.0%) | 0 (0.0%) |
| $3,000 or more | 0 (0.0%) | 0 (0.0%) |
| Total | 561 (100.0%) | 127 (100.0%) |
Physical Housing Characteristics in Great Falls
Housing Structures in Great Falls
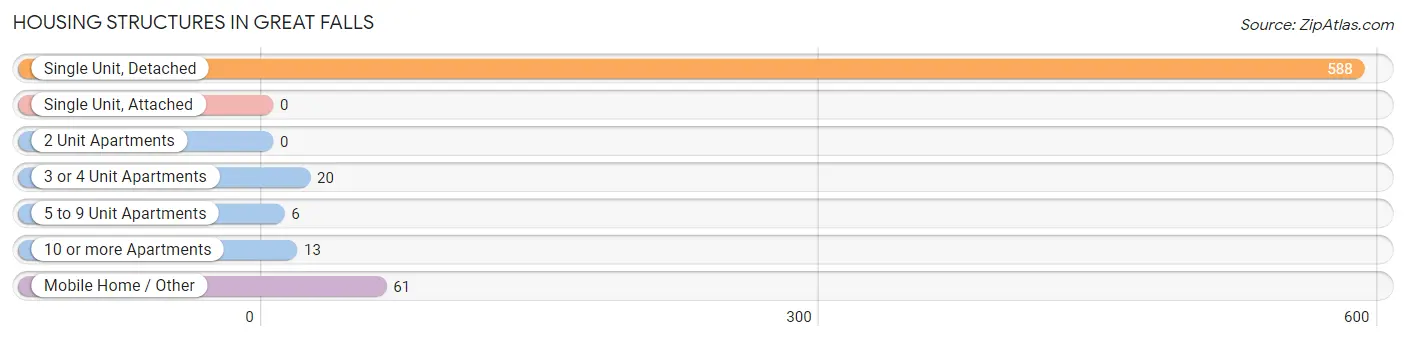
| Structure Type | # Housing Units | % Housing Units |
| Single Unit, Detached | 588 | 85.5% |
| Single Unit, Attached | 0 | 0.0% |
| 2 Unit Apartments | 0 | 0.0% |
| 3 or 4 Unit Apartments | 20 | 2.9% |
| 5 to 9 Unit Apartments | 6 | 0.9% |
| 10 or more Apartments | 13 | 1.9% |
| Mobile Home / Other | 61 | 8.9% |
| Total | 688 | 100.0% |
Housing Structures by Occupancy in Great Falls
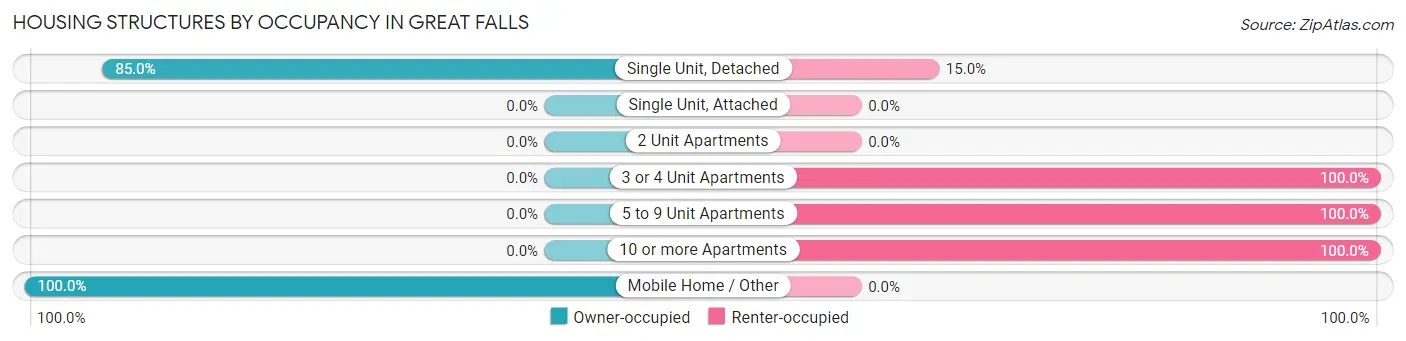
| Structure Type | Owner-occupied | Renter-occupied |
| Single Unit, Detached | 500 (85.0%) | 88 (15.0%) |
| Single Unit, Attached | 0 (0.0%) | 0 (0.0%) |
| 2 Unit Apartments | 0 (0.0%) | 0 (0.0%) |
| 3 or 4 Unit Apartments | 0 (0.0%) | 20 (100.0%) |
| 5 to 9 Unit Apartments | 0 (0.0%) | 6 (100.0%) |
| 10 or more Apartments | 0 (0.0%) | 13 (100.0%) |
| Mobile Home / Other | 61 (100.0%) | 0 (0.0%) |
| Total | 561 (81.5%) | 127 (18.5%) |
Housing Structures by Number of Rooms in Great Falls
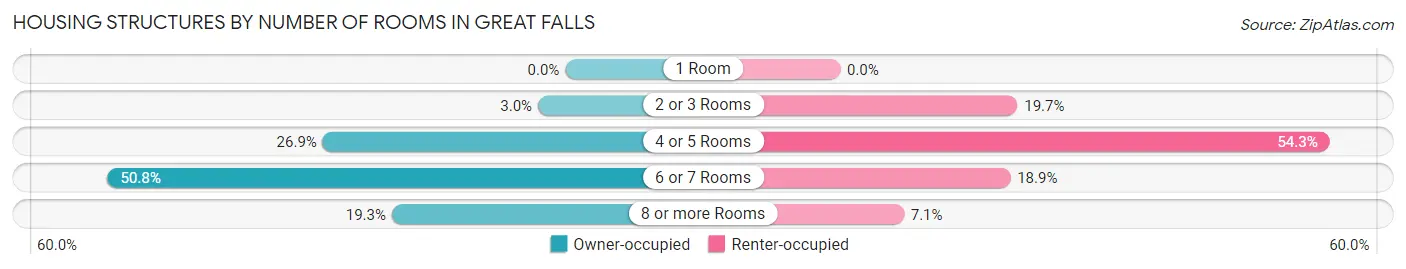
| Number of Rooms | Owner-occupied | Renter-occupied |
| 1 Room | 0 (0.0%) | 0 (0.0%) |
| 2 or 3 Rooms | 17 (3.0%) | 25 (19.7%) |
| 4 or 5 Rooms | 151 (26.9%) | 69 (54.3%) |
| 6 or 7 Rooms | 285 (50.8%) | 24 (18.9%) |
| 8 or more Rooms | 108 (19.3%) | 9 (7.1%) |
| Total | 561 (100.0%) | 127 (100.0%) |
Housing Structure by Heating Type in Great Falls
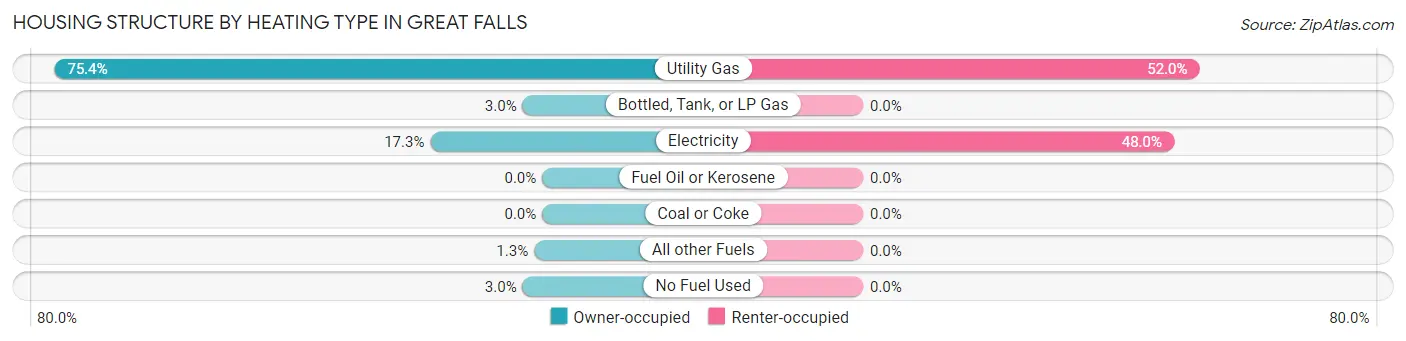
| Heating Type | Owner-occupied | Renter-occupied |
| Utility Gas | 423 (75.4%) | 66 (52.0%) |
| Bottled, Tank, or LP Gas | 17 (3.0%) | 0 (0.0%) |
| Electricity | 97 (17.3%) | 61 (48.0%) |
| Fuel Oil or Kerosene | 0 (0.0%) | 0 (0.0%) |
| Coal or Coke | 0 (0.0%) | 0 (0.0%) |
| All other Fuels | 7 (1.3%) | 0 (0.0%) |
| No Fuel Used | 17 (3.0%) | 0 (0.0%) |
| Total | 561 (100.0%) | 127 (100.0%) |
Household Vehicle Usage in Great Falls
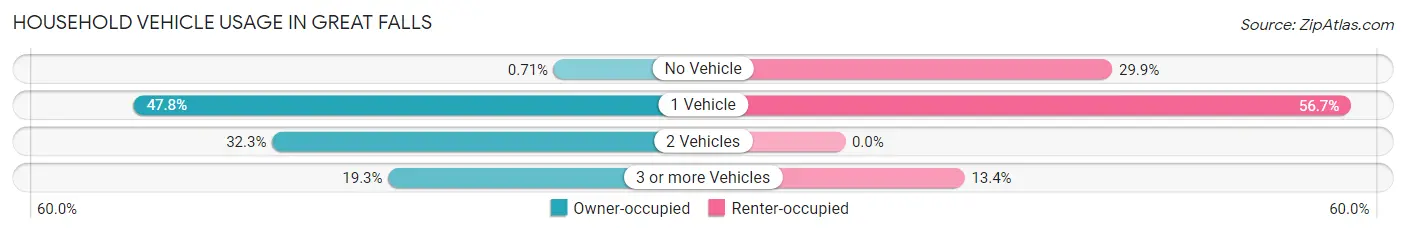
| Vehicles per Household | Owner-occupied | Renter-occupied |
| No Vehicle | 4 (0.7%) | 38 (29.9%) |
| 1 Vehicle | 268 (47.8%) | 72 (56.7%) |
| 2 Vehicles | 181 (32.3%) | 0 (0.0%) |
| 3 or more Vehicles | 108 (19.3%) | 17 (13.4%) |
| Total | 561 (100.0%) | 127 (100.0%) |
Real Estate & Mortgages in Great Falls
Real Estate and Mortgage Overview in Great Falls
| Characteristic | Without Mortgage | With Mortgage |
| Housing Units | 397 | 164 |
| Median Property Value | $40,600 | $101,200 |
| Median Household Income | $27,772 | $16 |
| Monthly Housing Costs | $247 | $0 |
| Real Estate Taxes | $432 | $0 |
Property Value by Mortgage Status in Great Falls
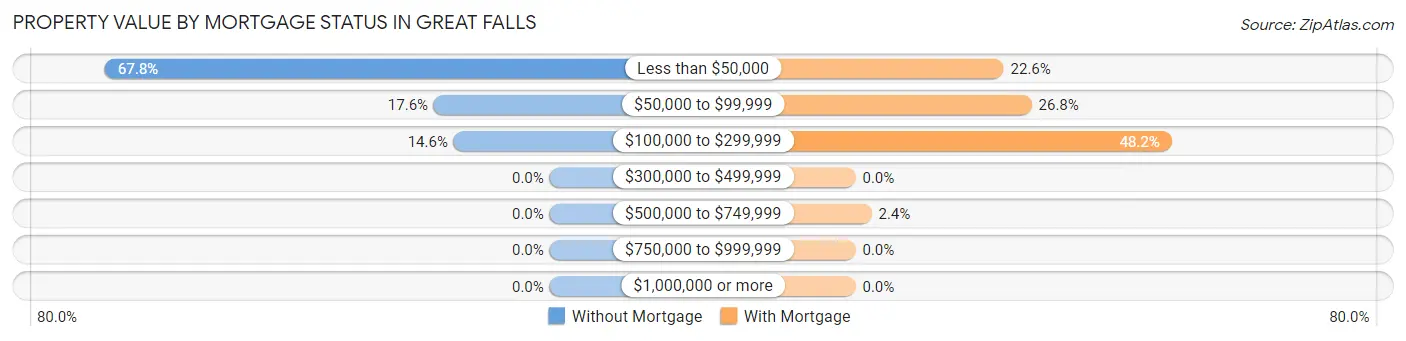
| Property Value | Without Mortgage | With Mortgage |
| Less than $50,000 | 269 (67.8%) | 37 (22.6%) |
| $50,000 to $99,999 | 70 (17.6%) | 44 (26.8%) |
| $100,000 to $299,999 | 58 (14.6%) | 79 (48.2%) |
| $300,000 to $499,999 | 0 (0.0%) | 0 (0.0%) |
| $500,000 to $749,999 | 0 (0.0%) | 4 (2.4%) |
| $750,000 to $999,999 | 0 (0.0%) | 0 (0.0%) |
| $1,000,000 or more | 0 (0.0%) | 0 (0.0%) |
| Total | 397 (100.0%) | 164 (100.0%) |
Household Income by Mortgage Status in Great Falls
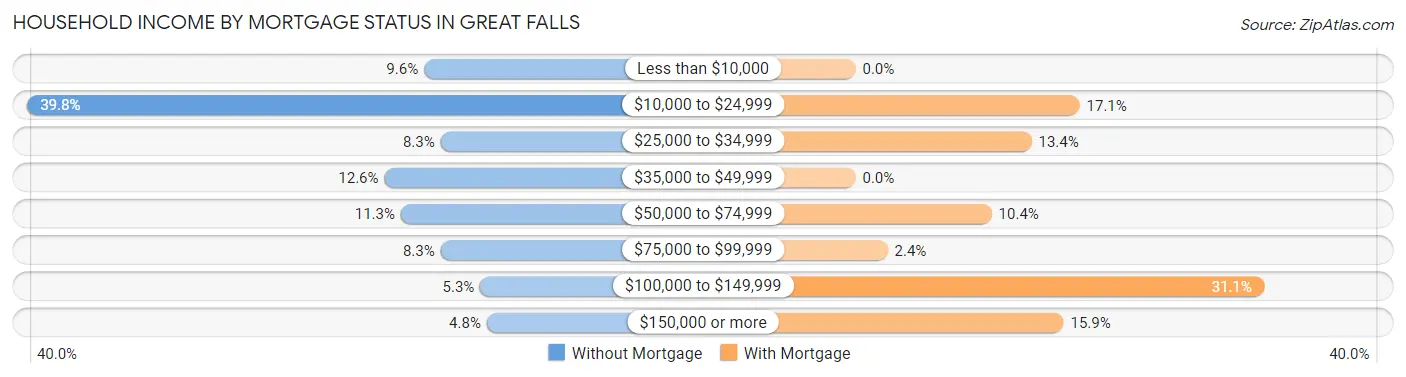
| Household Income | Without Mortgage | With Mortgage |
| Less than $10,000 | 38 (9.6%) | 0 (0.0%) |
| $10,000 to $24,999 | 158 (39.8%) | 28 (17.1%) |
| $25,000 to $34,999 | 33 (8.3%) | 22 (13.4%) |
| $35,000 to $49,999 | 50 (12.6%) | 0 (0.0%) |
| $50,000 to $74,999 | 45 (11.3%) | 17 (10.4%) |
| $75,000 to $99,999 | 33 (8.3%) | 4 (2.4%) |
| $100,000 to $149,999 | 21 (5.3%) | 51 (31.1%) |
| $150,000 or more | 19 (4.8%) | 26 (15.9%) |
| Total | 397 (100.0%) | 164 (100.0%) |
Property Value to Household Income Ratio in Great Falls
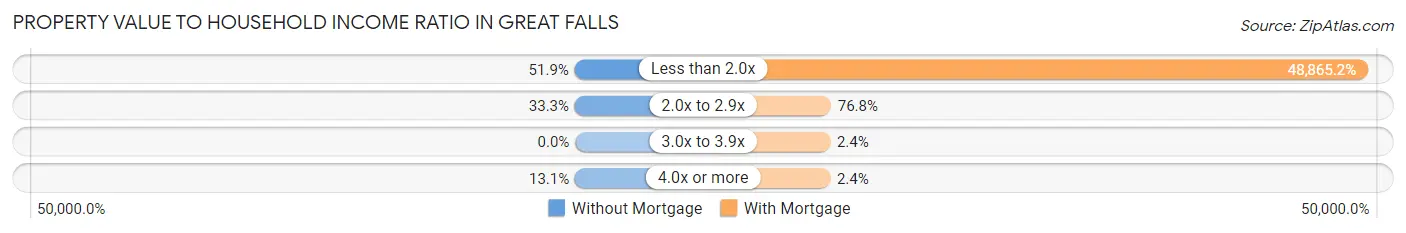
| Value-to-Income Ratio | Without Mortgage | With Mortgage |
| Less than 2.0x | 206 (51.9%) | 80,139 (48,865.2%) |
| 2.0x to 2.9x | 132 (33.3%) | 126 (76.8%) |
| 3.0x to 3.9x | 0 (0.0%) | 4 (2.4%) |
| 4.0x or more | 52 (13.1%) | 4 (2.4%) |
| Total | 397 (100.0%) | 164 (100.0%) |
Real Estate Taxes by Mortgage Status in Great Falls
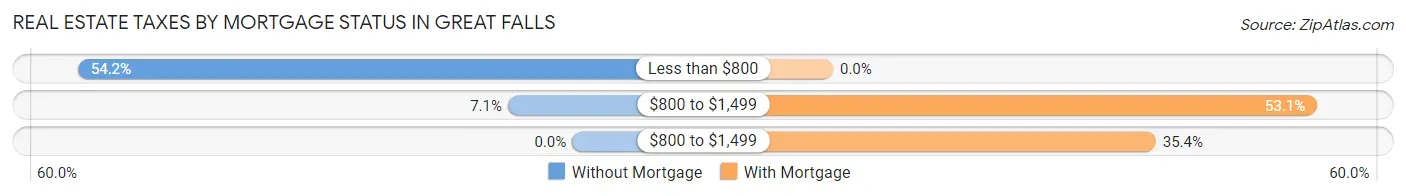
| Property Taxes | Without Mortgage | With Mortgage |
| Less than $800 | 215 (54.2%) | 0 (0.0%) |
| $800 to $1,499 | 28 (7.0%) | 87 (53.0%) |
| $800 to $1,499 | 0 (0.0%) | 58 (35.4%) |
| Total | 397 (100.0%) | 164 (100.0%) |
Health & Disability in Great Falls
Health Insurance Coverage by Age in Great Falls
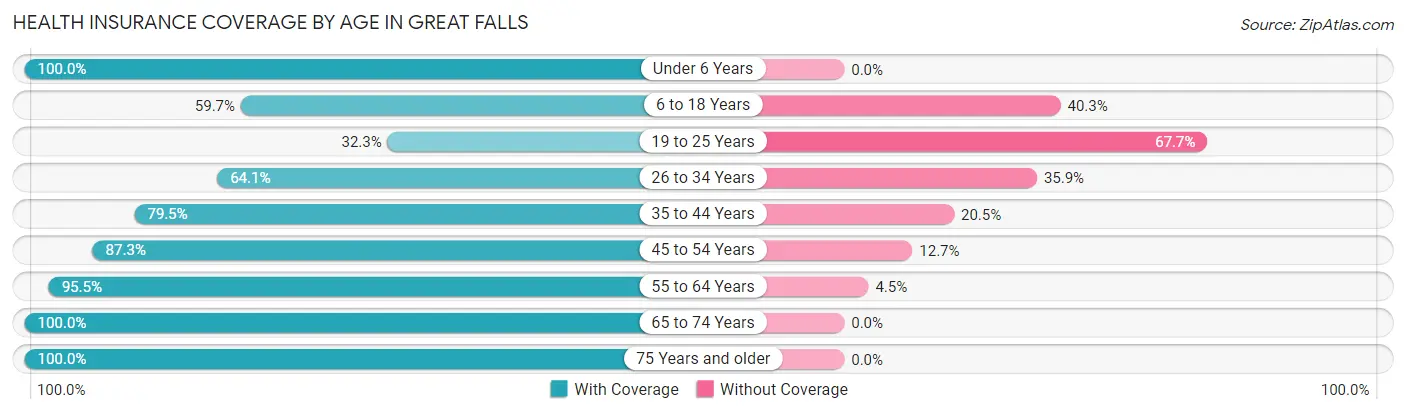
| Age Bracket | With Coverage | Without Coverage |
| Under 6 Years | 134 (100.0%) | 0 (0.0%) |
| 6 to 18 Years | 182 (59.7%) | 123 (40.3%) |
| 19 to 25 Years | 21 (32.3%) | 44 (67.7%) |
| 26 to 34 Years | 148 (64.1%) | 83 (35.9%) |
| 35 to 44 Years | 136 (79.5%) | 35 (20.5%) |
| 45 to 54 Years | 172 (87.3%) | 25 (12.7%) |
| 55 to 64 Years | 127 (95.5%) | 6 (4.5%) |
| 65 to 74 Years | 165 (100.0%) | 0 (0.0%) |
| 75 Years and older | 268 (100.0%) | 0 (0.0%) |
| Total | 1,353 (81.1%) | 316 (18.9%) |
Health Insurance Coverage by Citizenship Status in Great Falls
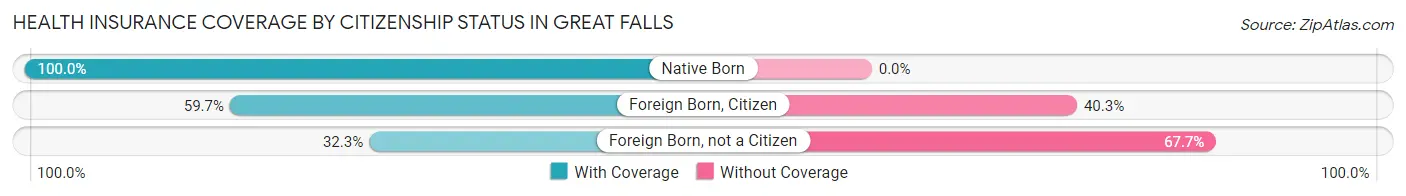
| Citizenship Status | With Coverage | Without Coverage |
| Native Born | 134 (100.0%) | 0 (0.0%) |
| Foreign Born, Citizen | 182 (59.7%) | 123 (40.3%) |
| Foreign Born, not a Citizen | 21 (32.3%) | 44 (67.7%) |
Health Insurance Coverage by Household Income in Great Falls
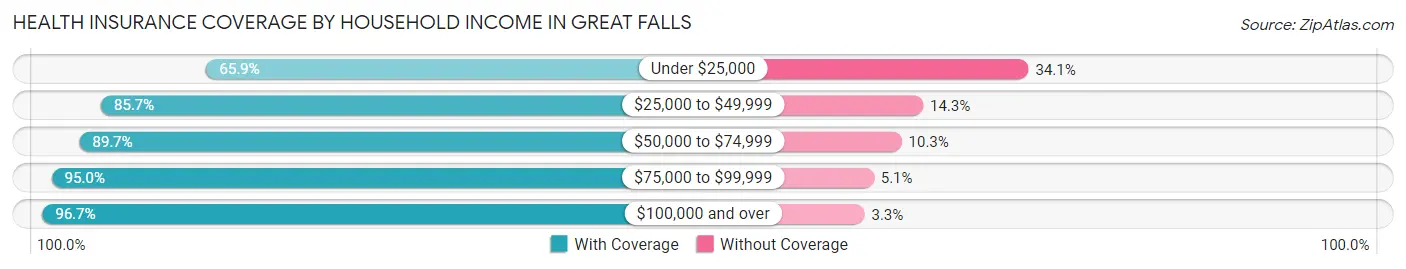
| Household Income | With Coverage | Without Coverage |
| Under $25,000 | 453 (65.9%) | 234 (34.1%) |
| $25,000 to $49,999 | 264 (85.7%) | 44 (14.3%) |
| $50,000 to $74,999 | 131 (89.7%) | 15 (10.3%) |
| $75,000 to $99,999 | 301 (95.0%) | 16 (5.1%) |
| $100,000 and over | 204 (96.7%) | 7 (3.3%) |
Public vs Private Health Insurance Coverage by Age in Great Falls
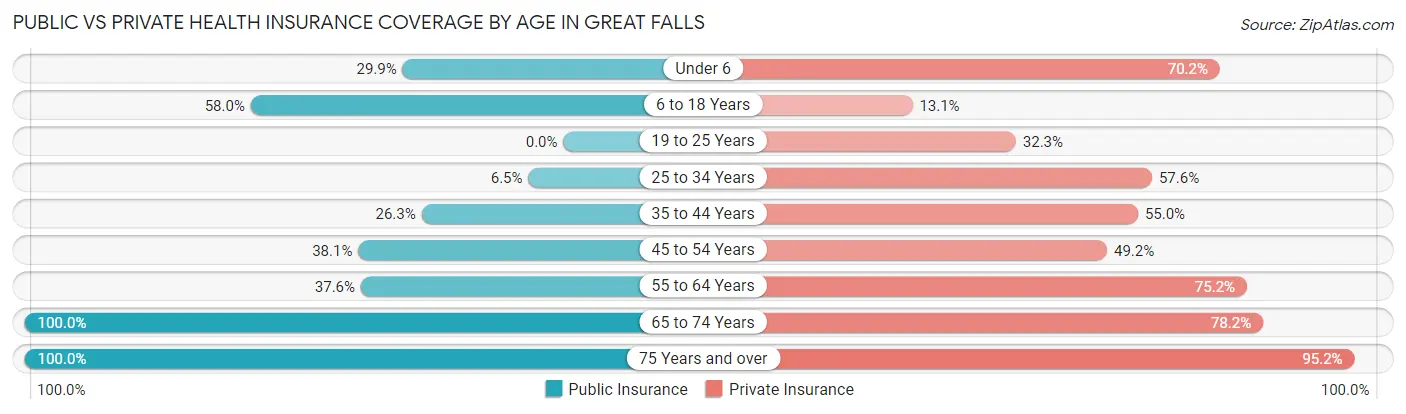
| Age Bracket | Public Insurance | Private Insurance |
| Under 6 | 40 (29.8%) | 94 (70.2%) |
| 6 to 18 Years | 177 (58.0%) | 40 (13.1%) |
| 19 to 25 Years | 0 (0.0%) | 21 (32.3%) |
| 25 to 34 Years | 15 (6.5%) | 133 (57.6%) |
| 35 to 44 Years | 45 (26.3%) | 94 (55.0%) |
| 45 to 54 Years | 75 (38.1%) | 97 (49.2%) |
| 55 to 64 Years | 50 (37.6%) | 100 (75.2%) |
| 65 to 74 Years | 165 (100.0%) | 129 (78.2%) |
| 75 Years and over | 268 (100.0%) | 255 (95.2%) |
| Total | 835 (50.0%) | 963 (57.7%) |
Disability Status by Sex by Age in Great Falls
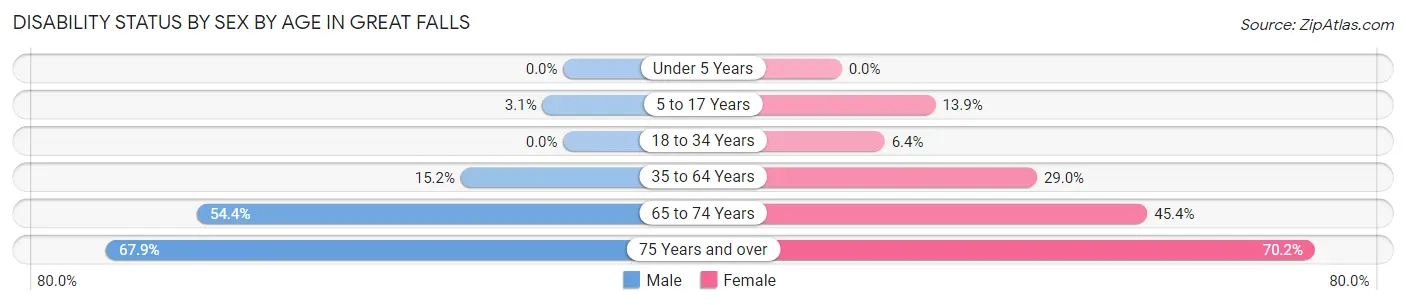
| Age Bracket | Male | Female |
| Under 5 Years | 0 (0.0%) | 0 (0.0%) |
| 5 to 17 Years | 4 (3.1%) | 21 (13.9%) |
| 18 to 34 Years | 0 (0.0%) | 15 (6.4%) |
| 35 to 64 Years | 39 (15.2%) | 71 (29.0%) |
| 65 to 74 Years | 31 (54.4%) | 49 (45.4%) |
| 75 Years and over | 93 (67.9%) | 92 (70.2%) |
Disability Class by Sex by Age in Great Falls
Disability Class: Hearing Difficulty
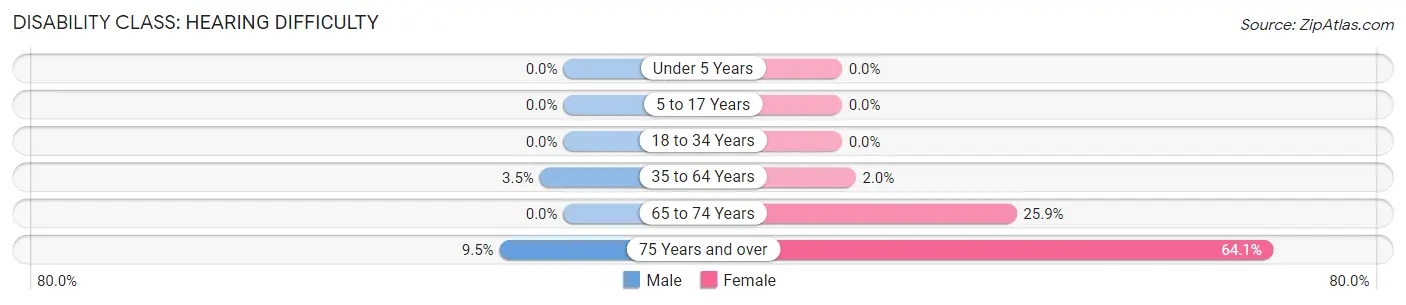
| Age Bracket | Male | Female |
| Under 5 Years | 0 (0.0%) | 0 (0.0%) |
| 5 to 17 Years | 0 (0.0%) | 0 (0.0%) |
| 18 to 34 Years | 0 (0.0%) | 0 (0.0%) |
| 35 to 64 Years | 9 (3.5%) | 5 (2.0%) |
| 65 to 74 Years | 0 (0.0%) | 28 (25.9%) |
| 75 Years and over | 13 (9.5%) | 84 (64.1%) |
Disability Class: Vision Difficulty
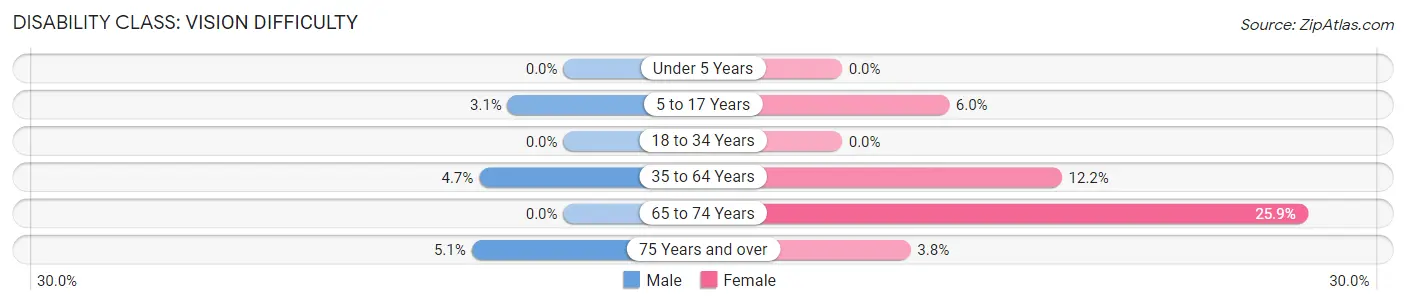
| Age Bracket | Male | Female |
| Under 5 Years | 0 (0.0%) | 0 (0.0%) |
| 5 to 17 Years | 4 (3.1%) | 9 (6.0%) |
| 18 to 34 Years | 0 (0.0%) | 0 (0.0%) |
| 35 to 64 Years | 12 (4.7%) | 30 (12.2%) |
| 65 to 74 Years | 0 (0.0%) | 28 (25.9%) |
| 75 Years and over | 7 (5.1%) | 5 (3.8%) |
Disability Class: Cognitive Difficulty
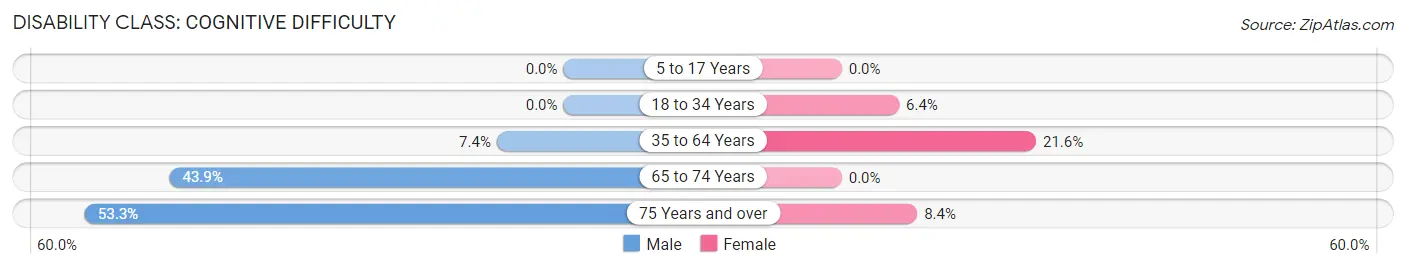
| Age Bracket | Male | Female |
| 5 to 17 Years | 0 (0.0%) | 0 (0.0%) |
| 18 to 34 Years | 0 (0.0%) | 15 (6.4%) |
| 35 to 64 Years | 19 (7.4%) | 53 (21.6%) |
| 65 to 74 Years | 25 (43.9%) | 0 (0.0%) |
| 75 Years and over | 73 (53.3%) | 11 (8.4%) |
Disability Class: Ambulatory Difficulty
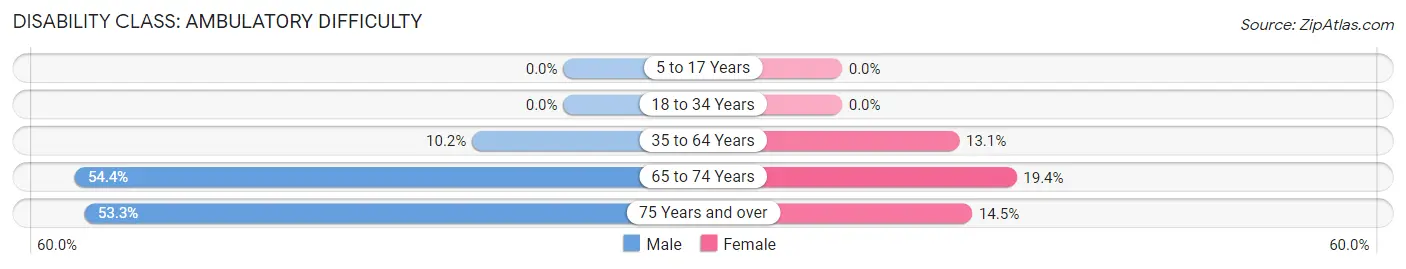
| Age Bracket | Male | Female |
| 5 to 17 Years | 0 (0.0%) | 0 (0.0%) |
| 18 to 34 Years | 0 (0.0%) | 0 (0.0%) |
| 35 to 64 Years | 26 (10.2%) | 32 (13.1%) |
| 65 to 74 Years | 31 (54.4%) | 21 (19.4%) |
| 75 Years and over | 73 (53.3%) | 19 (14.5%) |
Disability Class: Self-Care Difficulty
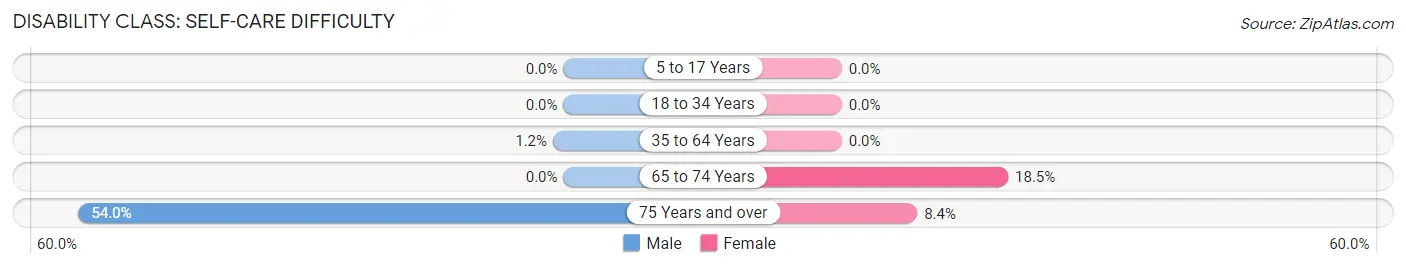
| Age Bracket | Male | Female |
| 5 to 17 Years | 0 (0.0%) | 0 (0.0%) |
| 18 to 34 Years | 0 (0.0%) | 0 (0.0%) |
| 35 to 64 Years | 3 (1.2%) | 0 (0.0%) |
| 65 to 74 Years | 0 (0.0%) | 20 (18.5%) |
| 75 Years and over | 74 (54.0%) | 11 (8.4%) |
Technology Access in Great Falls
Computing Device Access in Great Falls
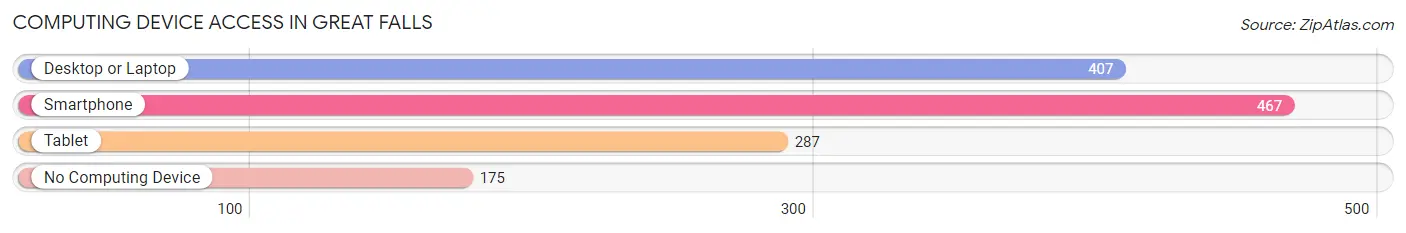
| Device Type | # Households | % Households |
| Desktop or Laptop | 407 | 59.2% |
| Smartphone | 467 | 67.9% |
| Tablet | 287 | 41.7% |
| No Computing Device | 175 | 25.4% |
| Total | 688 | 100.0% |
Internet Access in Great Falls
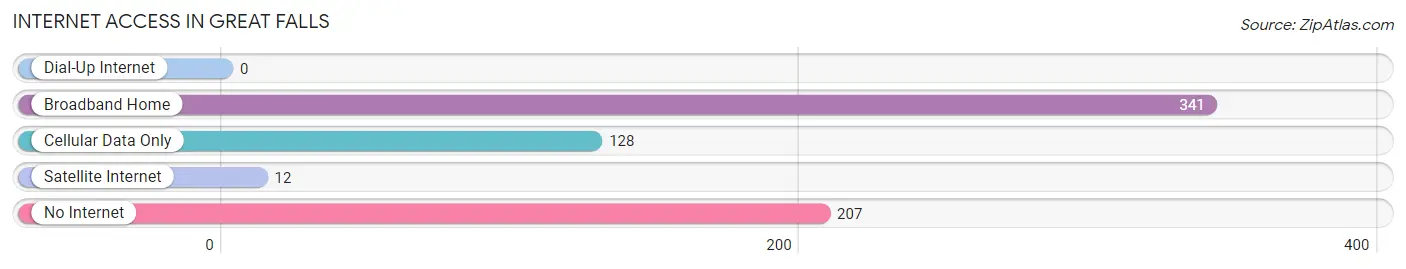
| Internet Type | # Households | % Households |
| Dial-Up Internet | 0 | 0.0% |
| Broadband Home | 341 | 49.6% |
| Cellular Data Only | 128 | 18.6% |
| Satellite Internet | 12 | 1.7% |
| No Internet | 207 | 30.1% |
| Total | 688 | 100.0% |
Great Falls Summary
Great Falls is a small town located in Chester County, South Carolina. It is situated on the Catawba River, approximately 25 miles south of Charlotte, North Carolina. The town was founded in 1845 and has a population of approximately 1,500 people.
History
The town of Great Falls was founded in 1845 by a group of settlers from the nearby town of Chester. The settlers were looking for a place to build a mill and the Catawba River provided the perfect opportunity. The settlers built a dam and a grist mill, which was the first industry in the area. The mill was a great success and soon other businesses began to open in the area.
The town was named after the Great Falls of the Catawba River, which is located just outside of town. The falls are a popular tourist attraction and are the source of the town’s water supply.
In the late 1800s, the town began to grow and prosper. The railroad came to town in 1887 and the town was incorporated in 1889. The town continued to grow and by the early 1900s, it had become a thriving community.
Geography
Great Falls is located in Chester County, South Carolina. It is situated on the Catawba River, approximately 25 miles south of Charlotte, North Carolina. The town is located in the Piedmont region of the state and is surrounded by rolling hills and forests. The town is located at an elevation of approximately 500 feet above sea level.
The climate in Great Falls is mild and humid. The average temperature in the summer is around 80 degrees Fahrenheit and the average temperature in the winter is around 40 degrees Fahrenheit. The town receives an average of 48 inches of rain per year.
Economy
The economy of Great Falls is largely based on agriculture and manufacturing. The town is home to several large farms that produce a variety of crops, including corn, soybeans, and cotton. The town also has several manufacturing plants that produce a variety of products, including furniture, textiles, and automotive parts.
The town is also home to several small businesses, including restaurants, retail stores, and service providers. The town is also home to a number of tourist attractions, including the Great Falls of the Catawba River and the Great Falls Historic District.
Demographics
As of the 2010 census, the population of Great Falls was 1,500 people. The racial makeup of the town was 94.7% White, 2.7% African American, 0.7% Native American, 0.3% Asian, and 1.6% from other races. The median household income in the town was $37,500 and the median family income was $45,000.
Great Falls is a small town with a rich history and a bright future. The town is home to a diverse population and a thriving economy. The town is a great place to live, work, and raise a family.
Common Questions
What is Per Capita Income in Great Falls?
Per Capita income in Great Falls is $20,140.
What is the Median Family Income in Great Falls?
Median Family Income in Great Falls is $53,409.
What is the Median Household income in Great Falls?
Median Household Income in Great Falls is $28,804.
What is Income or Wage Gap in Great Falls?
Income or Wage Gap in Great Falls is 14.1%.
Women in Great Falls earn 85.9 cents for every dollar earned by a man.
What is Inequality or Gini Index in Great Falls?
Inequality or Gini Index in Great Falls is 0.49.
What is the Total Population of Great Falls?
Total Population of Great Falls is 1,669.
What is the Total Male Population of Great Falls?
Total Male Population of Great Falls is 750.
What is the Total Female Population of Great Falls?
Total Female Population of Great Falls is 919.
What is the Ratio of Males per 100 Females in Great Falls?
There are 81.61 Males per 100 Females in Great Falls.
What is the Ratio of Females per 100 Males in Great Falls?
There are 122.53 Females per 100 Males in Great Falls.
What is the Median Population Age in Great Falls?
Median Population Age in Great Falls is 39.8 Years.
What is the Average Family Size in Great Falls
Average Family Size in Great Falls is 3.4 People.
What is the Average Household Size in Great Falls
Average Household Size in Great Falls is 2.4 People.
How Large is the Labor Force in Great Falls?
There are 576 People in the Labor Forcein in Great Falls.
What is the Percentage of People in the Labor Force in Great Falls?
41.5% of People are in the Labor Force in Great Falls.
What is the Unemployment Rate in Great Falls?
Unemployment Rate in Great Falls is 8.2%.