Zip Codes with the Highest Percentage of Population Employed in Architecture & Engineering in Lexington, SC
RELATED REPORTS & OPTIONS
Architecture & Engineering
Lexington
Compare Zip Codes
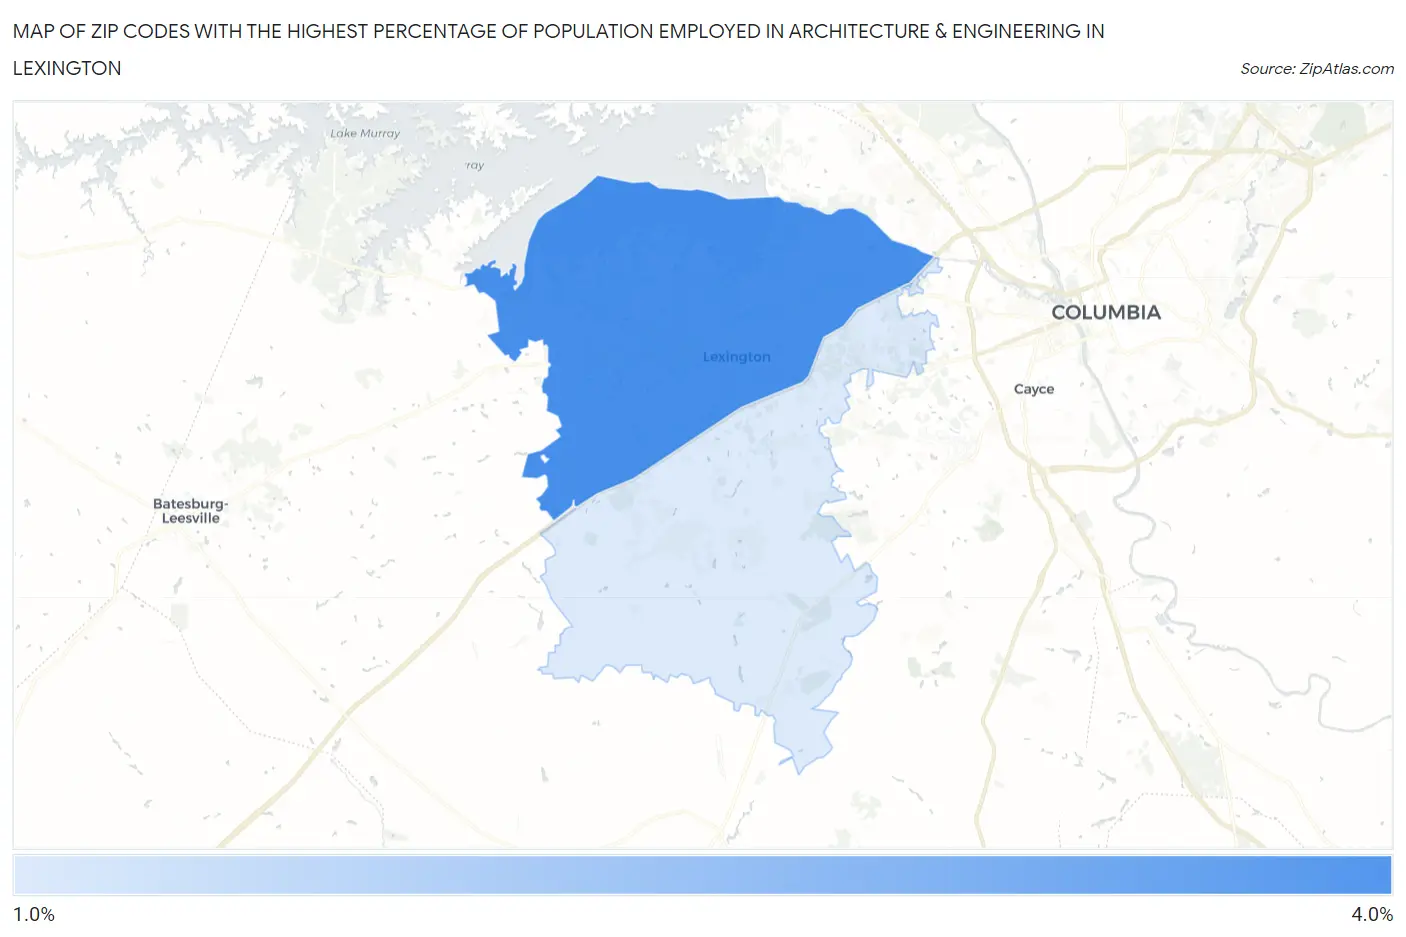
Map of Zip Codes with the Highest Percentage of Population Employed in Architecture & Engineering in Lexington
2.0%
4.0%
Zip Codes with the Highest Percentage of Population Employed in Architecture & Engineering in Lexington, SC
| Zip Code | % Employed | vs State | vs National | |
| 1. | 29072 | 4.0% | 2.2%(+1.75)#37 | 2.1%(+1.80)#2,845 |
| 2. | 29073 | 2.0% | 2.2%(-0.199)#129 | 2.1%(-0.152)#9,621 |
1
Common Questions
What are the Top Zip Codes with the Highest Percentage of Population Employed in Architecture & Engineering in Lexington, SC?
Top Zip Codes with the Highest Percentage of Population Employed in Architecture & Engineering in Lexington, SC are:
What zip code has the Highest Percentage of Population Employed in Architecture & Engineering in Lexington, SC?
29072 has the Highest Percentage of Population Employed in Architecture & Engineering in Lexington, SC with 4.0%.
What is the Percentage of Population Employed in Architecture & Engineering in Lexington, SC?
Percentage of Population Employed in Architecture & Engineering in Lexington is 2.0%.
What is the Percentage of Population Employed in Architecture & Engineering in South Carolina?
Percentage of Population Employed in Architecture & Engineering in South Carolina is 2.2%.
What is the Percentage of Population Employed in Architecture & Engineering in the United States?
Percentage of Population Employed in Architecture & Engineering in the United States is 2.1%.