Sudanese vs Immigrants from Morocco Married-Couple Family Poverty
COMPARE
Sudanese
Immigrants from Morocco
Married-Couple Family Poverty
Married-Couple Family Poverty Comparison
Sudanese
Immigrants from Morocco
5.6%
MARRIED-COUPLE FAMILY POVERTY
6.4/ 100
METRIC RATING
224th/ 347
METRIC RANK
5.4%
MARRIED-COUPLE FAMILY POVERTY
24.3/ 100
METRIC RATING
200th/ 347
METRIC RANK
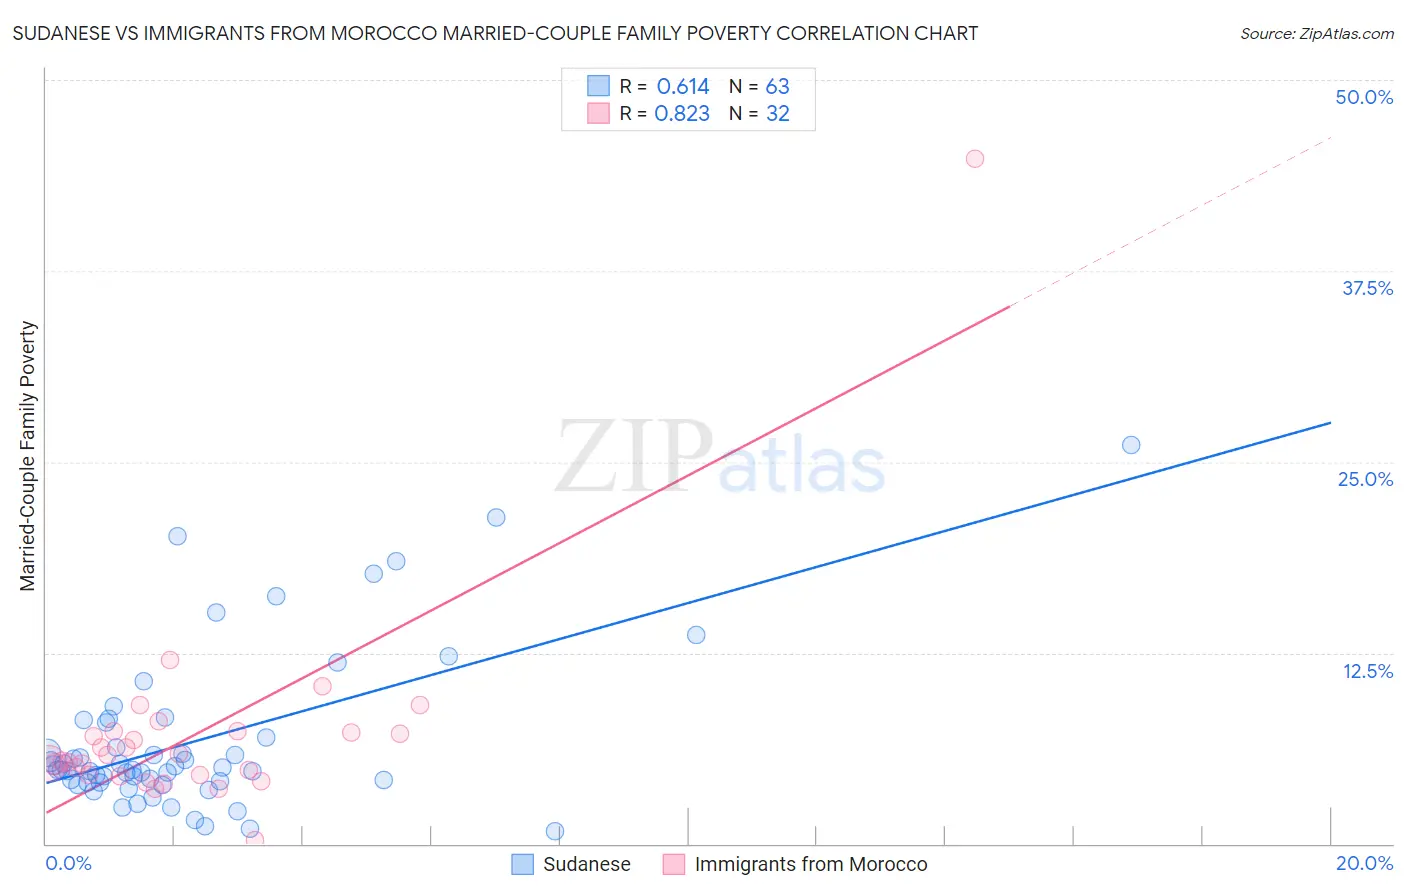
Sudanese vs Immigrants from Morocco Married-Couple Family Poverty Correlation Chart
The statistical analysis conducted on geographies consisting of 109,883,961 people shows a significant positive correlation between the proportion of Sudanese and poverty level among married-couple families in the United States with a correlation coefficient (R) of 0.614 and weighted average of 5.6%. Similarly, the statistical analysis conducted on geographies consisting of 178,420,133 people shows a very strong positive correlation between the proportion of Immigrants from Morocco and poverty level among married-couple families in the United States with a correlation coefficient (R) of 0.823 and weighted average of 5.4%, a difference of 4.3%.
Married-Couple Family Poverty Correlation Summary
| Measurement | Sudanese | Immigrants from Morocco |
| Minimum | 0.84% | 0.27% |
| Maximum | 26.1% | 44.8% |
| Range | 25.3% | 44.6% |
| Mean | 6.8% | 7.2% |
| Median | 4.9% | 5.6% |
| Interquartile 25% (IQ1) | 4.0% | 4.5% |
| Interquartile 75% (IQ3) | 7.9% | 7.3% |
| Interquartile Range (IQR) | 3.9% | 2.8% |
| Standard Deviation (Sample) | 5.2% | 7.2% |
| Standard Deviation (Population) | 5.2% | 7.1% |
Similar Demographics by Married-Couple Family Poverty
Demographics Similar to Sudanese by Married-Couple Family Poverty
In terms of married-couple family poverty, the demographic groups most similar to Sudanese are Immigrants from Fiji (5.6%, a difference of 0.11%), Immigrants from Cambodia (5.6%, a difference of 0.14%), Cajun (5.6%, a difference of 0.18%), South American (5.6%, a difference of 0.37%), and Immigrants from Zaire (5.6%, a difference of 0.38%).
| Demographics | Rating | Rank | Married-Couple Family Poverty |
| Immigrants | Nigeria | 11.3 /100 | #217 | Poor 5.5% |
| Afghans | 11.2 /100 | #218 | Poor 5.5% |
| Japanese | 9.8 /100 | #219 | Tragic 5.6% |
| Colombians | 9.2 /100 | #220 | Tragic 5.6% |
| Panamanians | 9.2 /100 | #221 | Tragic 5.6% |
| Cajuns | 6.9 /100 | #222 | Tragic 5.6% |
| Immigrants | Fiji | 6.7 /100 | #223 | Tragic 5.6% |
| Sudanese | 6.4 /100 | #224 | Tragic 5.6% |
| Immigrants | Cambodia | 6.1 /100 | #225 | Tragic 5.6% |
| South Americans | 5.7 /100 | #226 | Tragic 5.6% |
| Immigrants | Zaire | 5.6 /100 | #227 | Tragic 5.6% |
| Arabs | 5.4 /100 | #228 | Tragic 5.7% |
| Sub-Saharan Africans | 4.9 /100 | #229 | Tragic 5.7% |
| Moroccans | 4.9 /100 | #230 | Tragic 5.7% |
| Immigrants | Iraq | 4.4 /100 | #231 | Tragic 5.7% |
Demographics Similar to Immigrants from Morocco by Married-Couple Family Poverty
In terms of married-couple family poverty, the demographic groups most similar to Immigrants from Morocco are Lebanese (5.4%, a difference of 0.020%), Immigrants from Middle Africa (5.4%, a difference of 0.080%), Uruguayan (5.4%, a difference of 0.11%), Immigrants from Belarus (5.4%, a difference of 0.29%), and Liberian (5.4%, a difference of 0.31%).
| Demographics | Rating | Rank | Married-Couple Family Poverty |
| Malaysians | 29.5 /100 | #193 | Fair 5.4% |
| Immigrants | Israel | 27.8 /100 | #194 | Fair 5.4% |
| Immigrants | Azores | 27.5 /100 | #195 | Fair 5.4% |
| Spaniards | 27.4 /100 | #196 | Fair 5.4% |
| Liberians | 26.3 /100 | #197 | Fair 5.4% |
| Immigrants | Belarus | 26.2 /100 | #198 | Fair 5.4% |
| Uruguayans | 25.0 /100 | #199 | Fair 5.4% |
| Immigrants | Morocco | 24.3 /100 | #200 | Fair 5.4% |
| Lebanese | 24.1 /100 | #201 | Fair 5.4% |
| Immigrants | Middle Africa | 23.8 /100 | #202 | Fair 5.4% |
| Immigrants | Peru | 21.8 /100 | #203 | Fair 5.4% |
| Immigrants | Costa Rica | 19.4 /100 | #204 | Poor 5.4% |
| Chippewa | 18.9 /100 | #205 | Poor 5.4% |
| Osage | 18.4 /100 | #206 | Poor 5.4% |
| Immigrants | Africa | 17.6 /100 | #207 | Poor 5.5% |