Sudanese 2 or more Vehicles in Household
COMPARE
Sudanese
Select to Compare
2 or more Vehicles in Household
Sudanese 2 or more Vehicles in Household
53.6%
2+ VEHICLES AVAILABLE
4.1/ 100
METRIC RATING
227th/ 347
METRIC RANK
Sudanese 2 or more Vehicles in Household Correlation Chart
The statistical analysis conducted on geographies consisting of 110,122,172 people shows a moderate negative correlation between the proportion of Sudanese and percentage of households with 2 or more vehicles available in the United States with a correlation coefficient (R) of -0.473 and weighted average of 53.6%. On average, for every 1% (one percent) increase in Sudanese within a typical geography, there is a decrease of 2.5% in percentage of households with 2 or more vehicles available.
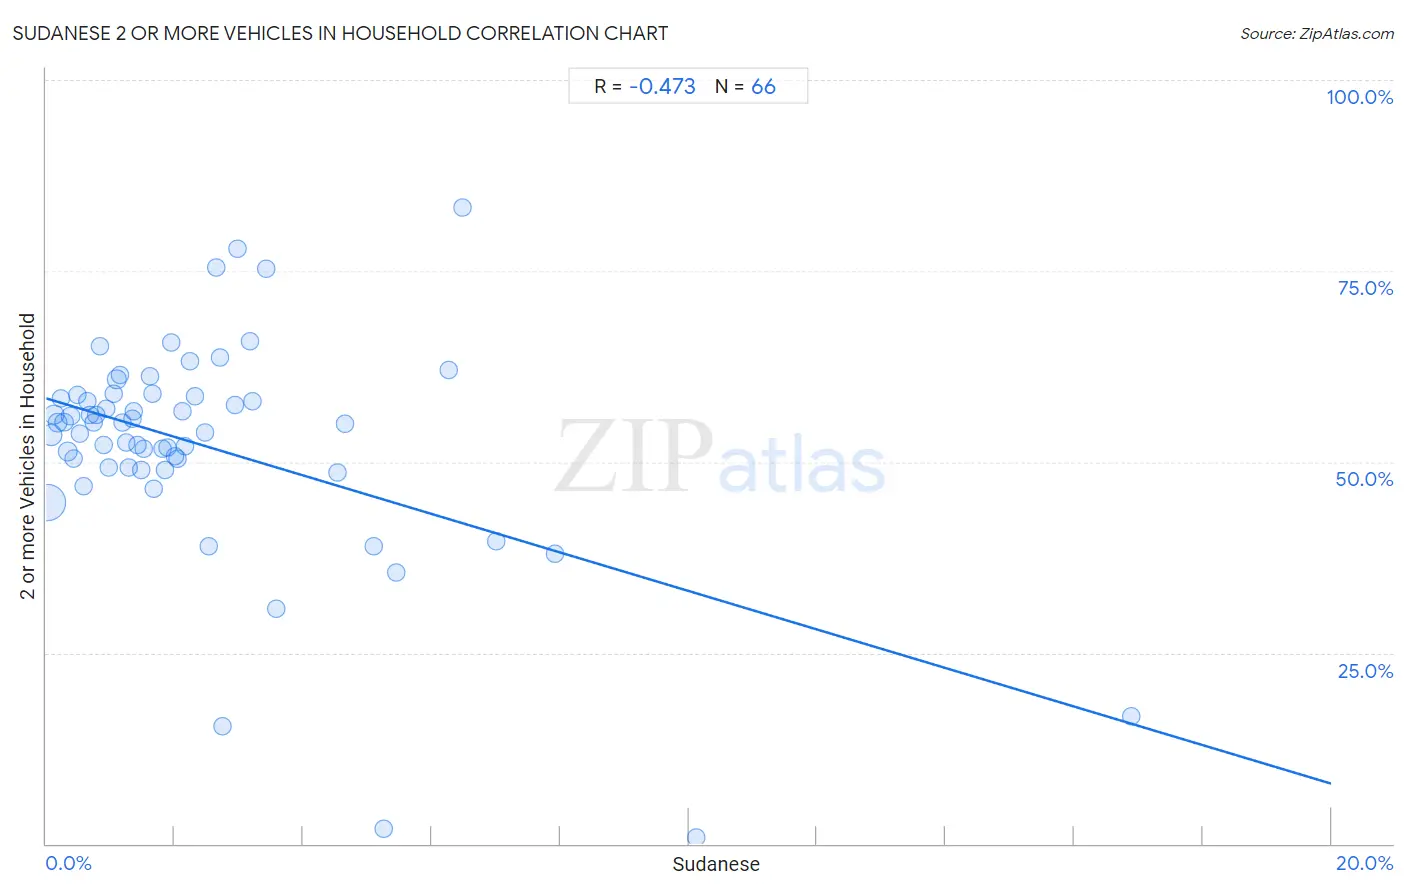
It is essential to understand that the correlation between the percentage of Sudanese and percentage of households with 2 or more vehicles available does not imply a direct cause-and-effect relationship. It remains uncertain whether the presence of Sudanese influences an upward or downward trend in the level of percentage of households with 2 or more vehicles available within an area, or if Sudanese simply ended up residing in those areas with higher or lower levels of percentage of households with 2 or more vehicles available due to other factors.
Demographics Similar to Sudanese by 2 or more Vehicles in Household
In terms of 2 or more vehicles in household, the demographic groups most similar to Sudanese are Alaska Native (53.6%, a difference of 0.060%), Immigrants from Turkey (53.6%, a difference of 0.080%), Immigrants from Nepal (53.5%, a difference of 0.14%), Panamanian (53.5%, a difference of 0.19%), and Immigrants from Eastern Africa (53.7%, a difference of 0.24%).
| Demographics | Rating | Rank | 2 or more Vehicles in Household |
| Taiwanese | 6.3 /100 | #220 | Tragic 53.9% |
| Immigrants from Singapore | 6.3 /100 | #221 | Tragic 53.9% |
| Kiowa | 6.2 /100 | #222 | Tragic 53.9% |
| Immigrants from Bosnia and Herzegovina | 5.5 /100 | #223 | Tragic 53.8% |
| Brazilians | 5.3 /100 | #224 | Tragic 53.8% |
| Immigrants from Egypt | 5.2 /100 | #225 | Tragic 53.8% |
| Immigrants from Eastern Africa | 5.1 /100 | #226 | Tragic 53.7% |
| Sudanese | 4.1 /100 | #227 | Tragic 53.6% |
| Alaska Natives | 3.9 /100 | #228 | Tragic 53.6% |
| Immigrants from Turkey | 3.8 /100 | #229 | Tragic 53.6% |
| Immigrants from Nepal | 3.6 /100 | #230 | Tragic 53.5% |
| Panamanians | 3.4 /100 | #231 | Tragic 53.5% |
| Immigrants from Guatemala | 3.2 /100 | #232 | Tragic 53.5% |
| Ugandans | 3.2 /100 | #233 | Tragic 53.5% |
| Immigrants from Switzerland | 3.0 /100 | #234 | Tragic 53.4% |
Sudanese 2 or more Vehicles in Household Correlation Summary
| Measurement | Sudanese Data | 2 or more Vehicles in Household Data |
| Minimum | 0.020% | 0.83% |
| Maximum | 16.9% | 83.4% |
| Range | 16.9% | 82.5% |
| Mean | 2.4% | 52.1% |
| Median | 1.7% | 55.1% |
| Interquartile 25% (IQ1) | 0.83% | 49.2% |
| Interquartile 75% (IQ3) | 2.9% | 58.6% |
| Interquartile Range (IQR) | 2.1% | 9.4% |
| Standard Deviation (Sample) | 2.7% | 14.5% |
| Standard Deviation (Population) | 2.7% | 14.4% |
Correlation Details
| Sudanese Percentile | Sample Size | 2 or more Vehicles in Household |
[ 0.0% - 0.5% ] 0.020% | 68,861,930 | 44.6% |
[ 0.0% - 0.5% ] 0.075% | 13,845,823 | 53.5% |
[ 0.0% - 0.5% ] 0.13% | 7,057,181 | 56.2% |
[ 0.0% - 0.5% ] 0.18% | 3,636,407 | 55.1% |
[ 0.0% - 0.5% ] 0.22% | 2,485,123 | 58.3% |
[ 0.0% - 0.5% ] 0.28% | 2,243,909 | 55.2% |
[ 0.0% - 0.5% ] 0.33% | 2,756,662 | 51.3% |
[ 0.0% - 0.5% ] 0.38% | 897,412 | 56.0% |
[ 0.0% - 0.5% ] 0.43% | 1,073,442 | 50.4% |
[ 0.0% - 0.5% ] 0.48% | 973,619 | 58.7% |
[ 0.5% - 1.0% ] 0.53% | 1,002,090 | 53.6% |
[ 0.5% - 1.0% ] 0.58% | 529,129 | 46.9% |
[ 0.5% - 1.0% ] 0.65% | 829,757 | 58.0% |
[ 0.5% - 1.0% ] 0.68% | 328,164 | 56.2% |
[ 0.5% - 1.0% ] 0.73% | 394,831 | 55.2% |
[ 0.5% - 1.0% ] 0.78% | 195,444 | 56.2% |
[ 0.5% - 1.0% ] 0.83% | 292,745 | 65.1% |
[ 0.5% - 1.0% ] 0.89% | 230,407 | 52.2% |
[ 0.5% - 1.0% ] 0.93% | 214,821 | 57.0% |
[ 0.5% - 1.0% ] 0.98% | 107,636 | 49.2% |
[ 1.0% - 1.5% ] 1.05% | 205,660 | 58.9% |
[ 1.0% - 1.5% ] 1.10% | 361,784 | 60.8% |
[ 1.0% - 1.5% ] 1.15% | 88,579 | 61.4% |
[ 1.0% - 1.5% ] 1.19% | 49,109 | 55.1% |
[ 1.0% - 1.5% ] 1.24% | 84,796 | 52.5% |
[ 1.0% - 1.5% ] 1.29% | 119,830 | 49.2% |
[ 1.0% - 1.5% ] 1.33% | 266,931 | 55.7% |
[ 1.0% - 1.5% ] 1.37% | 58,210 | 56.6% |
[ 1.0% - 1.5% ] 1.43% | 27,816 | 52.2% |
[ 1.0% - 1.5% ] 1.48% | 62,837 | 48.9% |
[ 1.5% - 2.0% ] 1.52% | 39,237 | 51.7% |
[ 1.5% - 2.0% ] 1.61% | 6,278 | 61.2% |
[ 1.5% - 2.0% ] 1.65% | 11,427 | 59.0% |
[ 1.5% - 2.0% ] 1.68% | 35,223 | 46.4% |
[ 1.5% - 2.0% ] 1.82% | 119,866 | 51.7% |
[ 1.5% - 2.0% ] 1.84% | 21,801 | 48.9% |
[ 1.5% - 2.0% ] 1.89% | 52,472 | 51.8% |
[ 1.5% - 2.0% ] 1.94% | 12,595 | 65.7% |
[ 2.0% - 2.5% ] 2.01% | 29,580 | 50.7% |
[ 2.0% - 2.5% ] 2.04% | 33,194 | 50.4% |
[ 2.0% - 2.5% ] 2.12% | 82,775 | 56.7% |
[ 2.0% - 2.5% ] 2.16% | 43,183 | 52.0% |
[ 2.0% - 2.5% ] 2.23% | 404 | 63.1% |
[ 2.0% - 2.5% ] 2.31% | 29,261 | 58.6% |
[ 2.0% - 2.5% ] 2.47% | 51,386 | 53.8% |
[ 2.5% - 3.0% ] 2.54% | 8,283 | 38.9% |
[ 2.5% - 3.0% ] 2.64% | 13,087 | 75.5% |
[ 2.5% - 3.0% ] 2.71% | 68,762 | 63.7% |
[ 2.5% - 3.0% ] 2.74% | 8,259 | 15.3% |
[ 2.5% - 3.0% ] 2.93% | 25,129 | 57.5% |
[ 2.5% - 3.0% ] 2.97% | 21,583 | 78.0% |
[ 3.0% - 3.5% ] 3.17% | 3,093 | 65.8% |
[ 3.0% - 3.5% ] 3.22% | 31,976 | 58.0% |
[ 3.0% - 3.5% ] 3.42% | 1,082 | 75.3% |
[ 3.5% - 4.0% ] 3.58% | 3,440 | 30.8% |
[ 4.5% - 5.0% ] 4.53% | 22,340 | 48.6% |
[ 4.5% - 5.0% ] 4.65% | 495 | 55.1% |
[ 5.0% - 5.5% ] 5.10% | 24,028 | 39.0% |
[ 5.0% - 5.5% ] 5.26% | 2,586 | 2.0% |
[ 5.0% - 5.5% ] 5.45% | 9,681 | 35.5% |
[ 6.0% - 6.5% ] 6.27% | 590 | 62.1% |
[ 6.0% - 6.5% ] 6.47% | 9,917 | 83.4% |
[ 7.0% - 7.5% ] 7.01% | 10,086 | 39.6% |
[ 7.5% - 8.0% ] 7.92% | 2,727 | 38.0% |
[ 10.0% - 10.5% ] 10.12% | 1,206 | 0.83% |
[ 16.5% - 17.0% ] 16.88% | 3,056 | 16.8% |