Sudanese vs African Married-Couple Family Poverty
COMPARE
Sudanese
African
Married-Couple Family Poverty
Married-Couple Family Poverty Comparison
Sudanese
Africans
5.6%
MARRIED-COUPLE FAMILY POVERTY
6.4/ 100
METRIC RATING
224th/ 347
METRIC RANK
6.0%
MARRIED-COUPLE FAMILY POVERTY
0.7/ 100
METRIC RATING
253rd/ 347
METRIC RANK
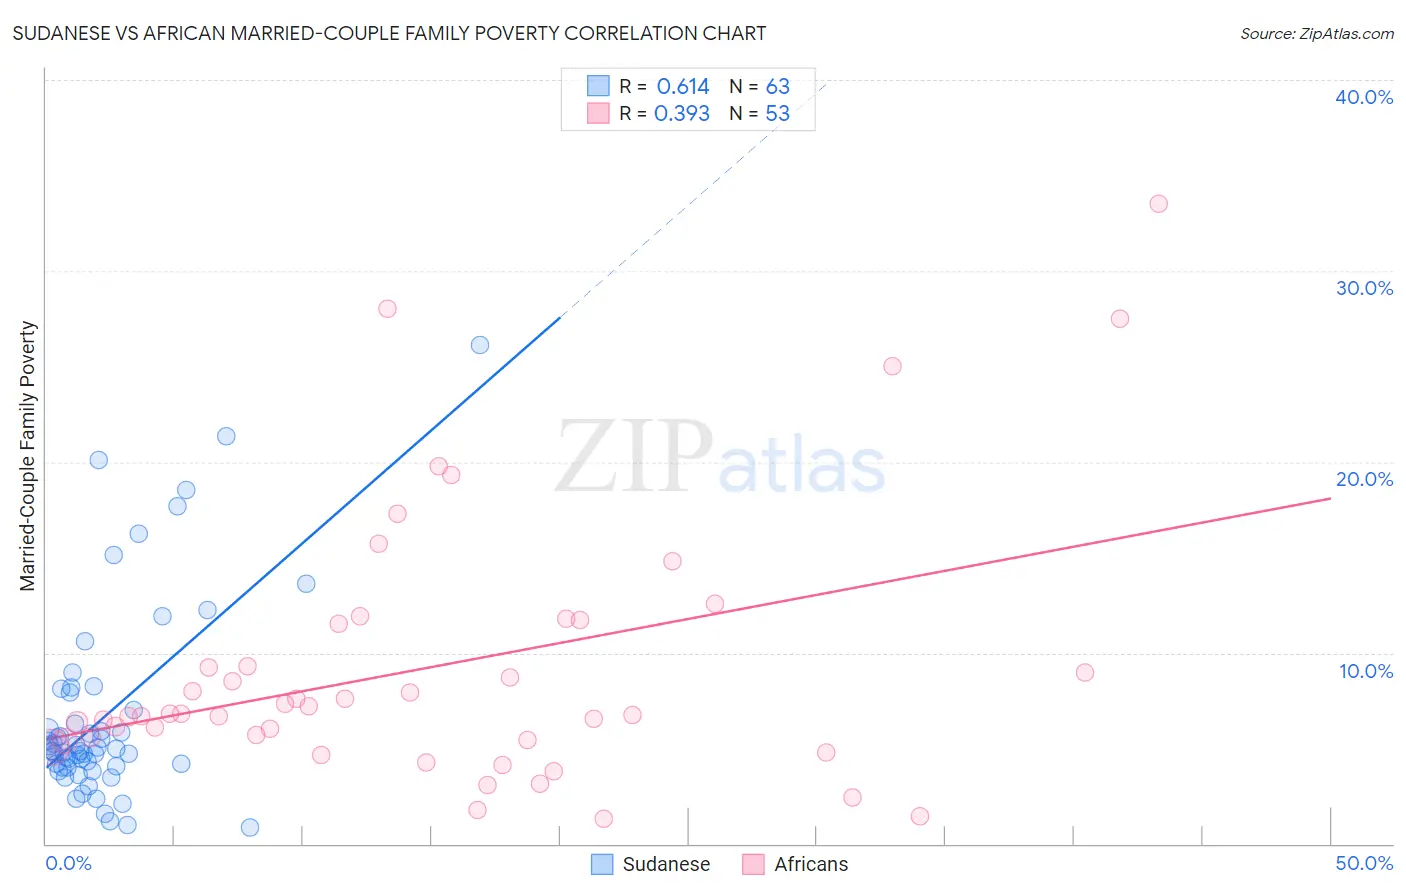
Sudanese vs African Married-Couple Family Poverty Correlation Chart
The statistical analysis conducted on geographies consisting of 109,883,961 people shows a significant positive correlation between the proportion of Sudanese and poverty level among married-couple families in the United States with a correlation coefficient (R) of 0.614 and weighted average of 5.6%. Similarly, the statistical analysis conducted on geographies consisting of 465,332,891 people shows a mild positive correlation between the proportion of Africans and poverty level among married-couple families in the United States with a correlation coefficient (R) of 0.393 and weighted average of 6.0%, a difference of 6.1%.
Married-Couple Family Poverty Correlation Summary
| Measurement | Sudanese | African |
| Minimum | 0.84% | 1.3% |
| Maximum | 26.1% | 33.5% |
| Range | 25.3% | 32.2% |
| Mean | 6.8% | 9.3% |
| Median | 4.9% | 6.8% |
| Interquartile 25% (IQ1) | 4.0% | 5.4% |
| Interquartile 75% (IQ3) | 7.9% | 11.6% |
| Interquartile Range (IQR) | 3.9% | 6.2% |
| Standard Deviation (Sample) | 5.2% | 7.0% |
| Standard Deviation (Population) | 5.2% | 6.9% |
Similar Demographics by Married-Couple Family Poverty
Demographics Similar to Sudanese by Married-Couple Family Poverty
In terms of married-couple family poverty, the demographic groups most similar to Sudanese are Immigrants from Fiji (5.6%, a difference of 0.11%), Immigrants from Cambodia (5.6%, a difference of 0.14%), Cajun (5.6%, a difference of 0.18%), South American (5.6%, a difference of 0.37%), and Immigrants from Zaire (5.6%, a difference of 0.38%).
| Demographics | Rating | Rank | Married-Couple Family Poverty |
| Immigrants | Nigeria | 11.3 /100 | #217 | Poor 5.5% |
| Afghans | 11.2 /100 | #218 | Poor 5.5% |
| Japanese | 9.8 /100 | #219 | Tragic 5.6% |
| Colombians | 9.2 /100 | #220 | Tragic 5.6% |
| Panamanians | 9.2 /100 | #221 | Tragic 5.6% |
| Cajuns | 6.9 /100 | #222 | Tragic 5.6% |
| Immigrants | Fiji | 6.7 /100 | #223 | Tragic 5.6% |
| Sudanese | 6.4 /100 | #224 | Tragic 5.6% |
| Immigrants | Cambodia | 6.1 /100 | #225 | Tragic 5.6% |
| South Americans | 5.7 /100 | #226 | Tragic 5.6% |
| Immigrants | Zaire | 5.6 /100 | #227 | Tragic 5.6% |
| Arabs | 5.4 /100 | #228 | Tragic 5.7% |
| Sub-Saharan Africans | 4.9 /100 | #229 | Tragic 5.7% |
| Moroccans | 4.9 /100 | #230 | Tragic 5.7% |
| Immigrants | Iraq | 4.4 /100 | #231 | Tragic 5.7% |
Demographics Similar to Africans by Married-Couple Family Poverty
In terms of married-couple family poverty, the demographic groups most similar to Africans are Immigrants from Somalia (6.0%, a difference of 0.060%), Immigrants from Western Asia (6.0%, a difference of 0.090%), Comanche (6.0%, a difference of 0.21%), Bangladeshi (6.0%, a difference of 0.71%), and Immigrants from Ghana (5.9%, a difference of 0.73%).
| Demographics | Rating | Rank | Married-Couple Family Poverty |
| Immigrants | Venezuela | 1.8 /100 | #246 | Tragic 5.8% |
| Iraqis | 1.4 /100 | #247 | Tragic 5.9% |
| Cree | 1.2 /100 | #248 | Tragic 5.9% |
| Tsimshian | 1.1 /100 | #249 | Tragic 5.9% |
| Immigrants | Eritrea | 1.1 /100 | #250 | Tragic 5.9% |
| Immigrants | Ghana | 1.0 /100 | #251 | Tragic 5.9% |
| Immigrants | Western Asia | 0.7 /100 | #252 | Tragic 6.0% |
| Africans | 0.7 /100 | #253 | Tragic 6.0% |
| Immigrants | Somalia | 0.7 /100 | #254 | Tragic 6.0% |
| Comanche | 0.7 /100 | #255 | Tragic 6.0% |
| Bangladeshis | 0.5 /100 | #256 | Tragic 6.0% |
| Immigrants | Burma/Myanmar | 0.5 /100 | #257 | Tragic 6.0% |
| Immigrants | Immigrants | 0.5 /100 | #258 | Tragic 6.0% |
| Alaskan Athabascans | 0.4 /100 | #259 | Tragic 6.1% |
| Jamaicans | 0.3 /100 | #260 | Tragic 6.1% |