Panamanian vs Immigrants from Poland Married-Couple Family Poverty
COMPARE
Panamanian
Immigrants from Poland
Married-Couple Family Poverty
Married-Couple Family Poverty Comparison
Panamanians
Immigrants from Poland
5.6%
MARRIED-COUPLE FAMILY POVERTY
9.2/ 100
METRIC RATING
221st/ 347
METRIC RANK
4.6%
MARRIED-COUPLE FAMILY POVERTY
98.3/ 100
METRIC RATING
96th/ 347
METRIC RANK
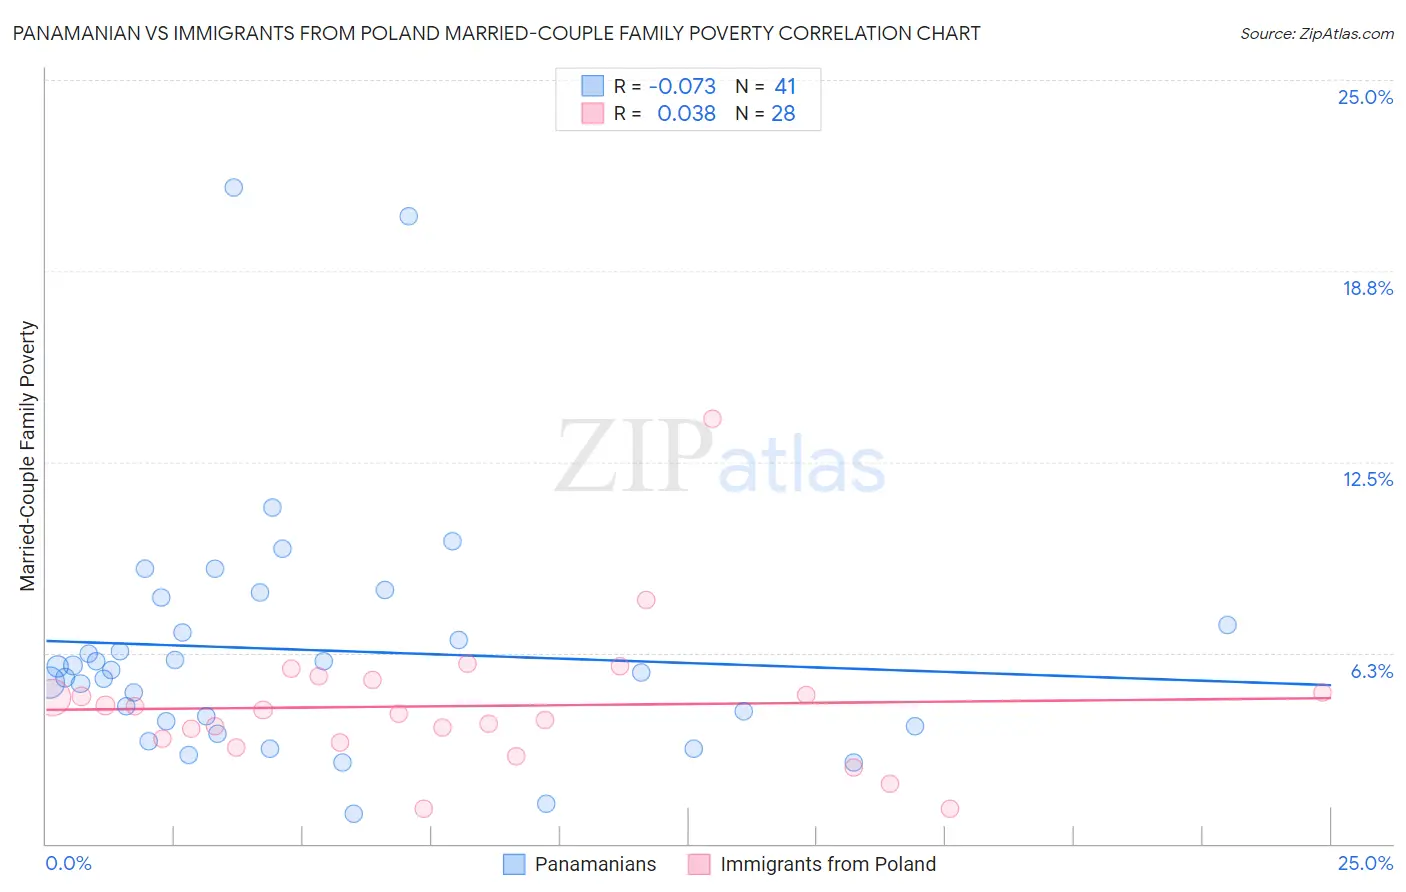
Panamanian vs Immigrants from Poland Married-Couple Family Poverty Correlation Chart
The statistical analysis conducted on geographies consisting of 279,759,434 people shows a slight negative correlation between the proportion of Panamanians and poverty level among married-couple families in the United States with a correlation coefficient (R) of -0.073 and weighted average of 5.6%. Similarly, the statistical analysis conducted on geographies consisting of 302,218,163 people shows no correlation between the proportion of Immigrants from Poland and poverty level among married-couple families in the United States with a correlation coefficient (R) of 0.038 and weighted average of 4.6%, a difference of 20.8%.
Married-Couple Family Poverty Correlation Summary
| Measurement | Panamanian | Immigrants from Poland |
| Minimum | 0.96% | 1.2% |
| Maximum | 21.5% | 13.9% |
| Range | 20.5% | 12.8% |
| Mean | 6.3% | 4.5% |
| Median | 5.7% | 4.3% |
| Interquartile 25% (IQ1) | 3.9% | 3.4% |
| Interquartile 75% (IQ3) | 7.6% | 5.2% |
| Interquartile Range (IQR) | 3.7% | 1.8% |
| Standard Deviation (Sample) | 4.1% | 2.4% |
| Standard Deviation (Population) | 4.0% | 2.3% |
Similar Demographics by Married-Couple Family Poverty
Demographics Similar to Panamanians by Married-Couple Family Poverty
In terms of married-couple family poverty, the demographic groups most similar to Panamanians are Colombian (5.6%, a difference of 0.020%), Japanese (5.6%, a difference of 0.21%), Afghan (5.5%, a difference of 0.61%), Immigrants from Nigeria (5.5%, a difference of 0.63%), and Cajun (5.6%, a difference of 0.85%).
| Demographics | Rating | Rank | Married-Couple Family Poverty |
| Iroquois | 13.1 /100 | #214 | Poor 5.5% |
| Armenians | 12.8 /100 | #215 | Poor 5.5% |
| Potawatomi | 12.4 /100 | #216 | Poor 5.5% |
| Immigrants | Nigeria | 11.3 /100 | #217 | Poor 5.5% |
| Afghans | 11.2 /100 | #218 | Poor 5.5% |
| Japanese | 9.8 /100 | #219 | Tragic 5.6% |
| Colombians | 9.2 /100 | #220 | Tragic 5.6% |
| Panamanians | 9.2 /100 | #221 | Tragic 5.6% |
| Cajuns | 6.9 /100 | #222 | Tragic 5.6% |
| Immigrants | Fiji | 6.7 /100 | #223 | Tragic 5.6% |
| Sudanese | 6.4 /100 | #224 | Tragic 5.6% |
| Immigrants | Cambodia | 6.1 /100 | #225 | Tragic 5.6% |
| South Americans | 5.7 /100 | #226 | Tragic 5.6% |
| Immigrants | Zaire | 5.6 /100 | #227 | Tragic 5.6% |
| Arabs | 5.4 /100 | #228 | Tragic 5.7% |
Demographics Similar to Immigrants from Poland by Married-Couple Family Poverty
In terms of married-couple family poverty, the demographic groups most similar to Immigrants from Poland are Immigrants from Belgium (4.6%, a difference of 0.050%), Portuguese (4.6%, a difference of 0.080%), Immigrants from Italy (4.6%, a difference of 0.12%), Korean (4.6%, a difference of 0.17%), and Immigrants from Norway (4.6%, a difference of 0.35%).
| Demographics | Rating | Rank | Married-Couple Family Poverty |
| Immigrants | Czechoslovakia | 98.5 /100 | #89 | Exceptional 4.6% |
| Immigrants | Switzerland | 98.5 /100 | #90 | Exceptional 4.6% |
| Basques | 98.5 /100 | #91 | Exceptional 4.6% |
| Immigrants | Norway | 98.4 /100 | #92 | Exceptional 4.6% |
| Koreans | 98.3 /100 | #93 | Exceptional 4.6% |
| Immigrants | Italy | 98.3 /100 | #94 | Exceptional 4.6% |
| Portuguese | 98.3 /100 | #95 | Exceptional 4.6% |
| Immigrants | Poland | 98.3 /100 | #96 | Exceptional 4.6% |
| Immigrants | Belgium | 98.2 /100 | #97 | Exceptional 4.6% |
| Native Hawaiians | 98.0 /100 | #98 | Exceptional 4.6% |
| Immigrants | Europe | 97.9 /100 | #99 | Exceptional 4.6% |
| Immigrants | Western Europe | 97.9 /100 | #100 | Exceptional 4.6% |
| Yugoslavians | 97.8 /100 | #101 | Exceptional 4.6% |
| Asians | 97.6 /100 | #102 | Exceptional 4.7% |
| Immigrants | Romania | 97.3 /100 | #103 | Exceptional 4.7% |