Panamanian Married-couple Households
COMPARE
Panamanian
Select to Compare
Married-couple Households
Panamanian Married-couple Households
45.2%
MARRIED-COUPLE HOUSEHOLDS
5.5/ 100
METRIC RATING
217th/ 347
METRIC RANK
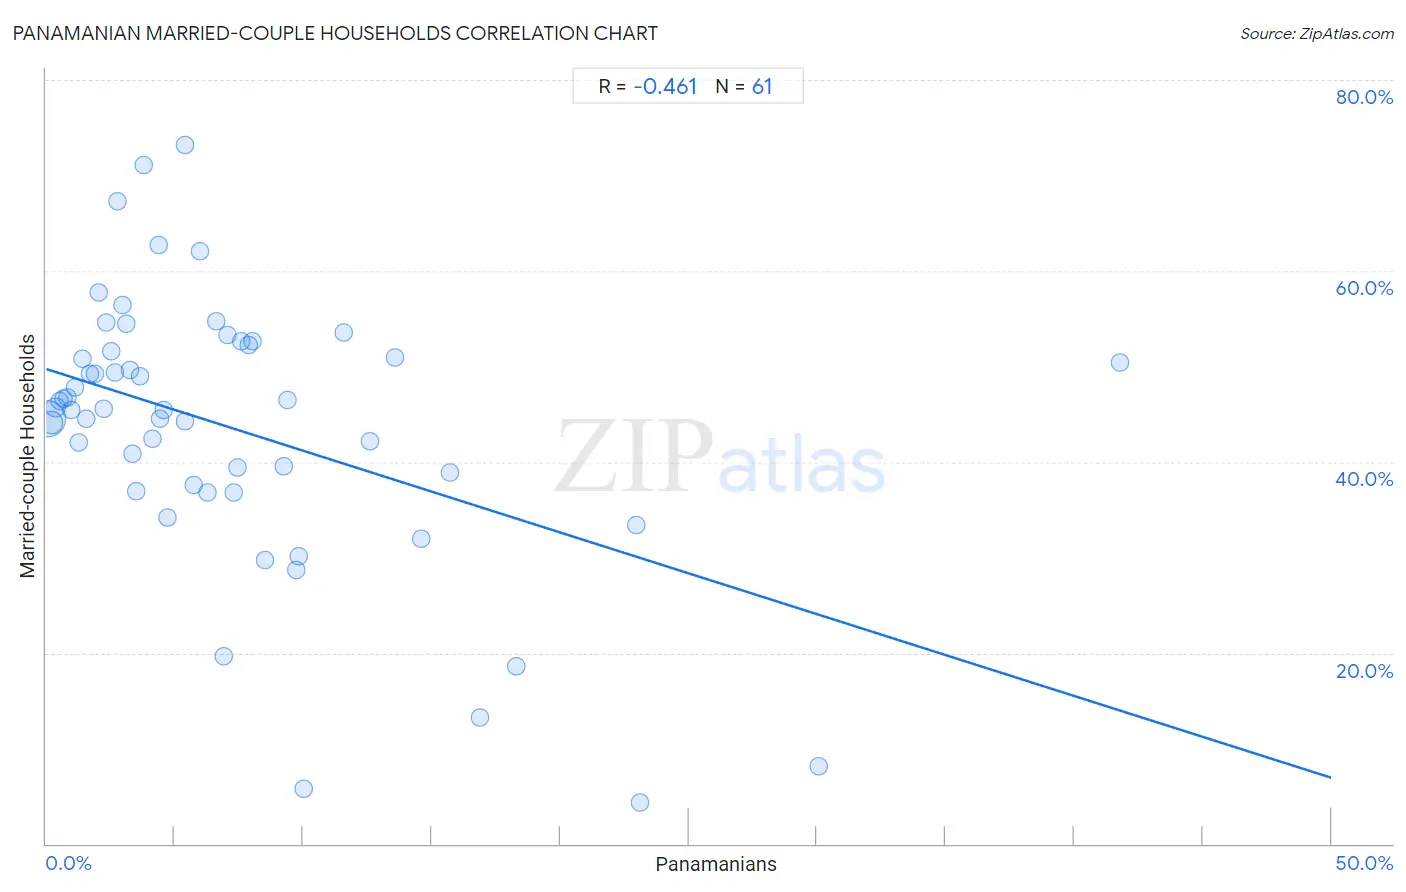
Panamanian Married-couple Households Correlation Chart
The statistical analysis conducted on geographies consisting of 281,067,413 people shows a moderate negative correlation between the proportion of Panamanians and percentage of married-couple family households in the United States with a correlation coefficient (R) of -0.461 and weighted average of 45.2%. On average, for every 1% (one percent) increase in Panamanians within a typical geography, there is a decrease of 0.86% in percentage of married-couple family households.
It is essential to understand that the correlation between the percentage of Panamanians and percentage of married-couple family households does not imply a direct cause-and-effect relationship. It remains uncertain whether the presence of Panamanians influences an upward or downward trend in the level of percentage of married-couple family households within an area, or if Panamanians simply ended up residing in those areas with higher or lower levels of percentage of married-couple family households due to other factors.
Demographics Similar to Panamanians by Married-couple Households
In terms of married-couple households, the demographic groups most similar to Panamanians are Immigrants from Nepal (45.2%, a difference of 0.020%), Immigrants from Portugal (45.2%, a difference of 0.020%), Immigrants from the Azores (45.2%, a difference of 0.030%), Nicaraguan (45.2%, a difference of 0.030%), and Japanese (45.2%, a difference of 0.040%).
| Demographics | Rating | Rank | Married-couple Households |
| Cubans | 7.7 /100 | #210 | Tragic 45.4% |
| Immigrants from Spain | 7.3 /100 | #211 | Tragic 45.3% |
| Creek | 6.4 /100 | #212 | Tragic 45.3% |
| Yakama | 5.8 /100 | #213 | Tragic 45.2% |
| Japanese | 5.7 /100 | #214 | Tragic 45.2% |
| Immigrants from Nepal | 5.6 /100 | #215 | Tragic 45.2% |
| Immigrants from Portugal | 5.6 /100 | #216 | Tragic 45.2% |
| Panamanians | 5.5 /100 | #217 | Tragic 45.2% |
| Immigrants from the Azores | 5.3 /100 | #218 | Tragic 45.2% |
| Nicaraguans | 5.3 /100 | #219 | Tragic 45.2% |
| Immigrants from Thailand | 5.1 /100 | #220 | Tragic 45.2% |
| Tlingit-Haida | 4.9 /100 | #221 | Tragic 45.1% |
| Immigrants from Laos | 4.6 /100 | #222 | Tragic 45.1% |
| Immigrants from Cambodia | 2.7 /100 | #223 | Tragic 44.9% |
| Immigrants from Micronesia | 2.6 /100 | #224 | Tragic 44.9% |
Panamanian Married-couple Households Correlation Summary
| Measurement | Panamanian Data | Married-couple Households Data |
| Minimum | 0.062% | 4.4% |
| Maximum | 41.8% | 73.1% |
| Range | 41.7% | 68.8% |
| Mean | 7.2% | 43.6% |
| Median | 4.7% | 45.6% |
| Interquartile 25% (IQ1) | 2.3% | 37.2% |
| Interquartile 75% (IQ3) | 9.3% | 51.9% |
| Interquartile Range (IQR) | 7.0% | 14.7% |
| Standard Deviation (Sample) | 7.6% | 14.2% |
| Standard Deviation (Population) | 7.6% | 14.0% |
Correlation Details
| Panamanian Percentile | Sample Size | Married-couple Households |
[ 0.0% - 0.5% ] 0.062% | 200,140,625 | 44.5% |
[ 0.0% - 0.5% ] 0.22% | 51,359,831 | 44.1% |
[ 0.0% - 0.5% ] 0.36% | 14,297,846 | 45.7% |
[ 0.5% - 1.0% ] 0.52% | 6,337,385 | 46.4% |
[ 0.5% - 1.0% ] 0.67% | 3,204,358 | 46.6% |
[ 0.5% - 1.0% ] 0.83% | 1,903,703 | 46.7% |
[ 0.5% - 1.0% ] 0.97% | 1,412,725 | 45.4% |
[ 1.0% - 1.5% ] 1.12% | 611,551 | 47.8% |
[ 1.0% - 1.5% ] 1.27% | 555,094 | 42.0% |
[ 1.0% - 1.5% ] 1.43% | 350,072 | 50.9% |
[ 1.5% - 2.0% ] 1.55% | 430,612 | 44.6% |
[ 1.5% - 2.0% ] 1.70% | 128,561 | 49.2% |
[ 1.5% - 2.0% ] 1.91% | 44,469 | 49.2% |
[ 2.0% - 2.5% ] 2.03% | 53,753 | 57.8% |
[ 2.0% - 2.5% ] 2.23% | 19,518 | 45.6% |
[ 2.0% - 2.5% ] 2.33% | 42,195 | 54.6% |
[ 2.5% - 3.0% ] 2.50% | 9,621 | 51.6% |
[ 2.5% - 3.0% ] 2.65% | 15,381 | 49.3% |
[ 2.5% - 3.0% ] 2.78% | 36,175 | 67.3% |
[ 2.5% - 3.0% ] 2.95% | 9,502 | 56.4% |
[ 3.0% - 3.5% ] 3.11% | 30,267 | 54.5% |
[ 3.0% - 3.5% ] 3.27% | 8,559 | 49.7% |
[ 3.0% - 3.5% ] 3.37% | 13,798 | 40.9% |
[ 3.5% - 4.0% ] 3.52% | 654 | 36.9% |
[ 3.5% - 4.0% ] 3.66% | 1,258 | 49.0% |
[ 3.5% - 4.0% ] 3.81% | 1,759 | 71.1% |
[ 4.0% - 4.5% ] 4.15% | 4,550 | 42.5% |
[ 4.0% - 4.5% ] 4.36% | 482 | 62.7% |
[ 4.0% - 4.5% ] 4.41% | 5,009 | 44.5% |
[ 4.5% - 5.0% ] 4.60% | 631 | 45.4% |
[ 4.5% - 5.0% ] 4.71% | 4,033 | 34.1% |
[ 5.0% - 5.5% ] 5.39% | 7,901 | 44.3% |
[ 5.0% - 5.5% ] 5.42% | 166 | 73.1% |
[ 5.5% - 6.0% ] 5.75% | 991 | 37.6% |
[ 5.5% - 6.0% ] 5.99% | 7,779 | 62.1% |
[ 6.0% - 6.5% ] 6.29% | 874 | 36.8% |
[ 6.5% - 7.0% ] 6.60% | 1,439 | 54.7% |
[ 6.5% - 7.0% ] 6.90% | 507 | 19.7% |
[ 7.0% - 7.5% ] 7.06% | 1,841 | 53.3% |
[ 7.0% - 7.5% ] 7.28% | 1,072 | 36.7% |
[ 7.0% - 7.5% ] 7.43% | 323 | 39.4% |
[ 7.5% - 8.0% ] 7.58% | 396 | 52.7% |
[ 7.5% - 8.0% ] 7.89% | 2,724 | 52.2% |
[ 8.0% - 8.5% ] 8.02% | 1,047 | 52.7% |
[ 8.0% - 8.5% ] 8.49% | 318 | 29.8% |
[ 9.0% - 9.5% ] 9.24% | 357 | 39.5% |
[ 9.0% - 9.5% ] 9.41% | 202 | 46.4% |
[ 9.5% - 10.0% ] 9.73% | 514 | 28.7% |
[ 9.5% - 10.0% ] 9.84% | 183 | 30.1% |
[ 10.0% - 10.5% ] 10.00% | 740 | 5.7% |
[ 11.5% - 12.0% ] 11.58% | 1,002 | 53.6% |
[ 12.5% - 13.0% ] 12.59% | 135 | 42.1% |
[ 13.5% - 14.0% ] 13.58% | 972 | 50.9% |
[ 14.5% - 15.0% ] 14.61% | 219 | 32.0% |
[ 15.5% - 16.0% ] 15.70% | 414 | 38.9% |
[ 16.5% - 17.0% ] 16.89% | 296 | 13.2% |
[ 18.0% - 18.5% ] 18.29% | 175 | 18.6% |
[ 22.5% - 23.0% ] 22.97% | 74 | 33.3% |
[ 23.0% - 23.5% ] 23.10% | 381 | 4.4% |
[ 30.0% - 30.5% ] 30.08% | 133 | 8.1% |
[ 41.5% - 42.0% ] 41.76% | 261 | 50.4% |