Panamanian Self-Care Disability
COMPARE
Panamanian
Select to Compare
Self-Care Disability
Panamanian Self-Care Disability
2.5%
SELF-CARE DISABILITY
6.4/ 100
METRIC RATING
210th/ 347
METRIC RANK
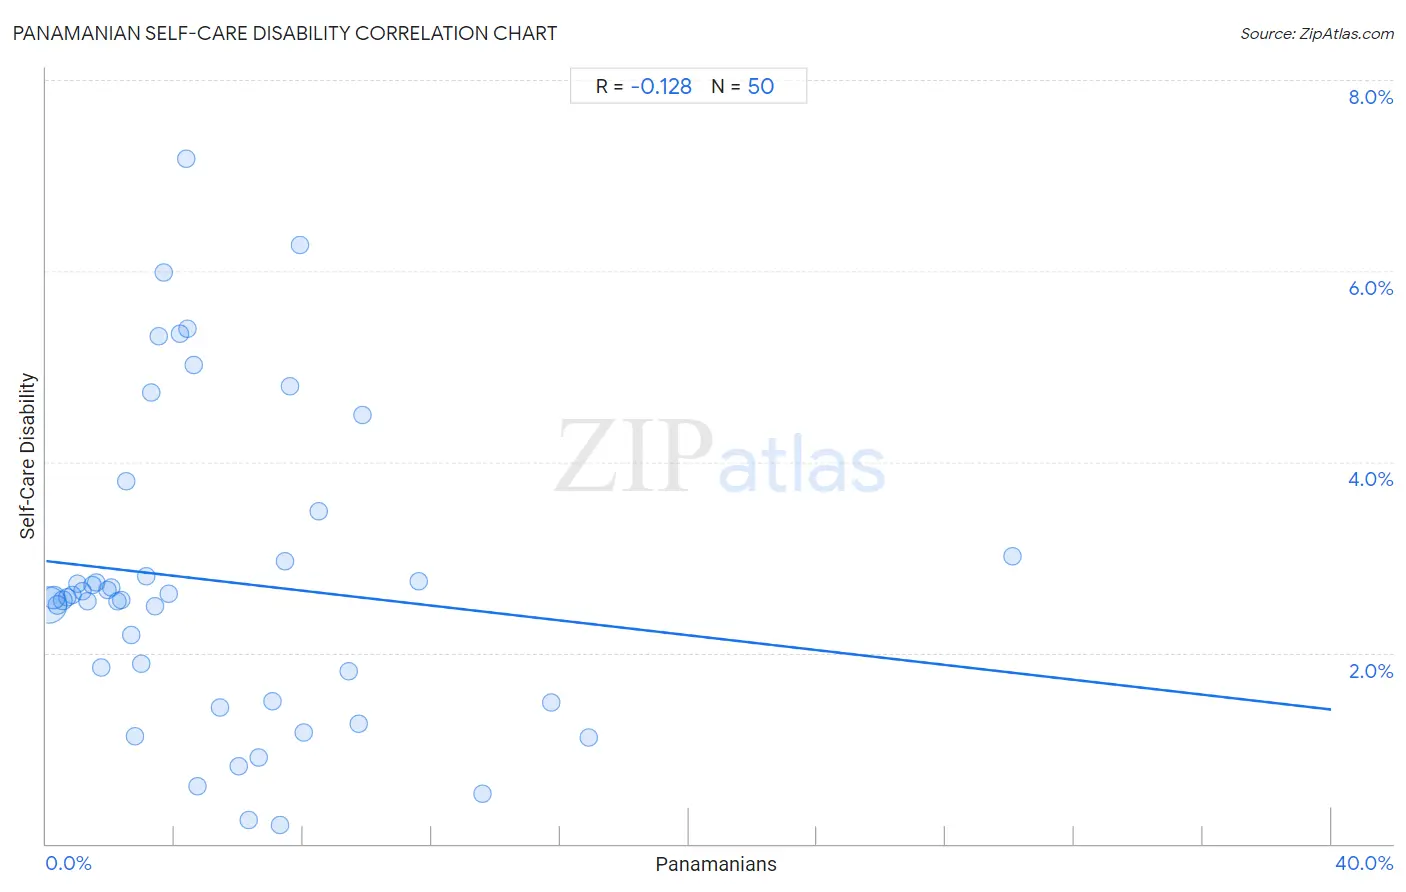
Panamanian Self-Care Disability Correlation Chart
The statistical analysis conducted on geographies consisting of 280,994,783 people shows a poor negative correlation between the proportion of Panamanians and percentage of population with self-care disability in the United States with a correlation coefficient (R) of -0.128 and weighted average of 2.5%. On average, for every 1% (one percent) increase in Panamanians within a typical geography, there is a decrease of 0.039% in percentage of population with self-care disability.
It is essential to understand that the correlation between the percentage of Panamanians and percentage of population with self-care disability does not imply a direct cause-and-effect relationship. It remains uncertain whether the presence of Panamanians influences an upward or downward trend in the level of percentage of population with self-care disability within an area, or if Panamanians simply ended up residing in those areas with higher or lower levels of percentage of population with self-care disability due to other factors.
Demographics Similar to Panamanians by Self-Care Disability
In terms of self-care disability, the demographic groups most similar to Panamanians are Malaysian (2.5%, a difference of 0.23%), Native Hawaiian (2.6%, a difference of 0.27%), Samoan (2.6%, a difference of 0.29%), Central American (2.5%, a difference of 0.38%), and Ecuadorian (2.6%, a difference of 0.39%).
| Demographics | Rating | Rank | Self-Care Disability |
| Immigrants from Lebanon | 12.4 /100 | #203 | Poor 2.5% |
| Immigrants from Bahamas | 11.9 /100 | #204 | Poor 2.5% |
| Immigrants from Russia | 11.0 /100 | #205 | Poor 2.5% |
| Alaskan Athabascans | 10.4 /100 | #206 | Poor 2.5% |
| French | 9.9 /100 | #207 | Tragic 2.5% |
| Central Americans | 8.7 /100 | #208 | Tragic 2.5% |
| Malaysians | 7.7 /100 | #209 | Tragic 2.5% |
| Panamanians | 6.4 /100 | #210 | Tragic 2.5% |
| Native Hawaiians | 5.1 /100 | #211 | Tragic 2.6% |
| Samoans | 5.1 /100 | #212 | Tragic 2.6% |
| Ecuadorians | 4.7 /100 | #213 | Tragic 2.6% |
| Immigrants from Honduras | 4.7 /100 | #214 | Tragic 2.6% |
| Immigrants from Thailand | 4.5 /100 | #215 | Tragic 2.6% |
| Whites/Caucasians | 4.4 /100 | #216 | Tragic 2.6% |
| Celtics | 4.4 /100 | #217 | Tragic 2.6% |
Panamanian Self-Care Disability Correlation Summary
| Measurement | Panamanian Data | Self-Care Disability Data |
| Minimum | 0.062% | 0.20% |
| Maximum | 30.1% | 7.2% |
| Range | 30.0% | 7.0% |
| Mean | 5.4% | 2.8% |
| Median | 3.7% | 2.6% |
| Interquartile 25% (IQ1) | 1.9% | 1.5% |
| Interquartile 75% (IQ3) | 7.4% | 3.0% |
| Interquartile Range (IQR) | 5.5% | 1.5% |
| Standard Deviation (Sample) | 5.3% | 1.6% |
| Standard Deviation (Population) | 5.3% | 1.6% |
Correlation Details
| Panamanian Percentile | Sample Size | Self-Care Disability |
[ 0.0% - 0.5% ] 0.062% | 200,128,437 | 2.5% |
[ 0.0% - 0.5% ] 0.22% | 51,344,531 | 2.6% |
[ 0.0% - 0.5% ] 0.36% | 14,276,210 | 2.5% |
[ 0.5% - 1.0% ] 0.52% | 6,338,267 | 2.5% |
[ 0.5% - 1.0% ] 0.67% | 3,200,218 | 2.6% |
[ 0.5% - 1.0% ] 0.83% | 1,900,025 | 2.6% |
[ 0.5% - 1.0% ] 0.97% | 1,409,850 | 2.7% |
[ 1.0% - 1.5% ] 1.12% | 611,870 | 2.7% |
[ 1.0% - 1.5% ] 1.27% | 553,602 | 2.5% |
[ 1.0% - 1.5% ] 1.43% | 349,324 | 2.7% |
[ 1.5% - 2.0% ] 1.55% | 428,666 | 2.7% |
[ 1.5% - 2.0% ] 1.70% | 128,561 | 1.8% |
[ 1.5% - 2.0% ] 1.91% | 44,469 | 2.7% |
[ 2.0% - 2.5% ] 2.03% | 53,753 | 2.7% |
[ 2.0% - 2.5% ] 2.23% | 19,096 | 2.5% |
[ 2.0% - 2.5% ] 2.33% | 39,295 | 2.6% |
[ 2.5% - 3.0% ] 2.50% | 9,621 | 3.8% |
[ 2.5% - 3.0% ] 2.65% | 15,381 | 2.2% |
[ 2.5% - 3.0% ] 2.78% | 36,175 | 1.1% |
[ 2.5% - 3.0% ] 2.95% | 9,367 | 1.9% |
[ 3.0% - 3.5% ] 3.11% | 30,267 | 2.8% |
[ 3.0% - 3.5% ] 3.27% | 8,559 | 4.7% |
[ 3.0% - 3.5% ] 3.37% | 12,371 | 2.5% |
[ 3.5% - 4.0% ] 3.52% | 654 | 5.3% |
[ 3.5% - 4.0% ] 3.66% | 1,258 | 6.0% |
[ 3.5% - 4.0% ] 3.81% | 1,759 | 2.6% |
[ 4.0% - 4.5% ] 4.15% | 4,550 | 5.3% |
[ 4.0% - 4.5% ] 4.36% | 482 | 7.2% |
[ 4.0% - 4.5% ] 4.41% | 5,009 | 5.4% |
[ 4.5% - 5.0% ] 4.60% | 631 | 5.0% |
[ 4.5% - 5.0% ] 4.71% | 4,033 | 0.61% |
[ 5.0% - 5.5% ] 5.39% | 7,044 | 1.4% |
[ 5.5% - 6.0% ] 5.99% | 7,779 | 0.81% |
[ 6.0% - 6.5% ] 6.29% | 874 | 0.24% |
[ 6.5% - 7.0% ] 6.60% | 1,439 | 0.90% |
[ 7.0% - 7.5% ] 7.06% | 1,841 | 1.5% |
[ 7.0% - 7.5% ] 7.28% | 1,072 | 0.20% |
[ 7.0% - 7.5% ] 7.44% | 242 | 3.0% |
[ 7.5% - 8.0% ] 7.58% | 396 | 4.8% |
[ 7.5% - 8.0% ] 7.89% | 2,724 | 6.3% |
[ 8.0% - 8.5% ] 8.02% | 1,047 | 1.2% |
[ 8.0% - 8.5% ] 8.49% | 318 | 3.5% |
[ 9.0% - 9.5% ] 9.41% | 202 | 1.8% |
[ 9.5% - 10.0% ] 9.73% | 514 | 1.3% |
[ 9.5% - 10.0% ] 9.84% | 183 | 4.5% |
[ 11.5% - 12.0% ] 11.58% | 1,002 | 2.8% |
[ 13.5% - 14.0% ] 13.58% | 972 | 0.53% |
[ 15.5% - 16.0% ] 15.70% | 414 | 1.5% |
[ 16.5% - 17.0% ] 16.89% | 296 | 1.1% |
[ 30.0% - 30.5% ] 30.08% | 133 | 3.0% |