Panamanian Disability Age 5 to 17
COMPARE
Panamanian
Select to Compare
Disability Age 5 to 17
Panamanian Disability Age 5 to 17
6.0%
DISABILITY | AGE 5 TO 17
0.6/ 100
METRIC RATING
265th/ 347
METRIC RANK
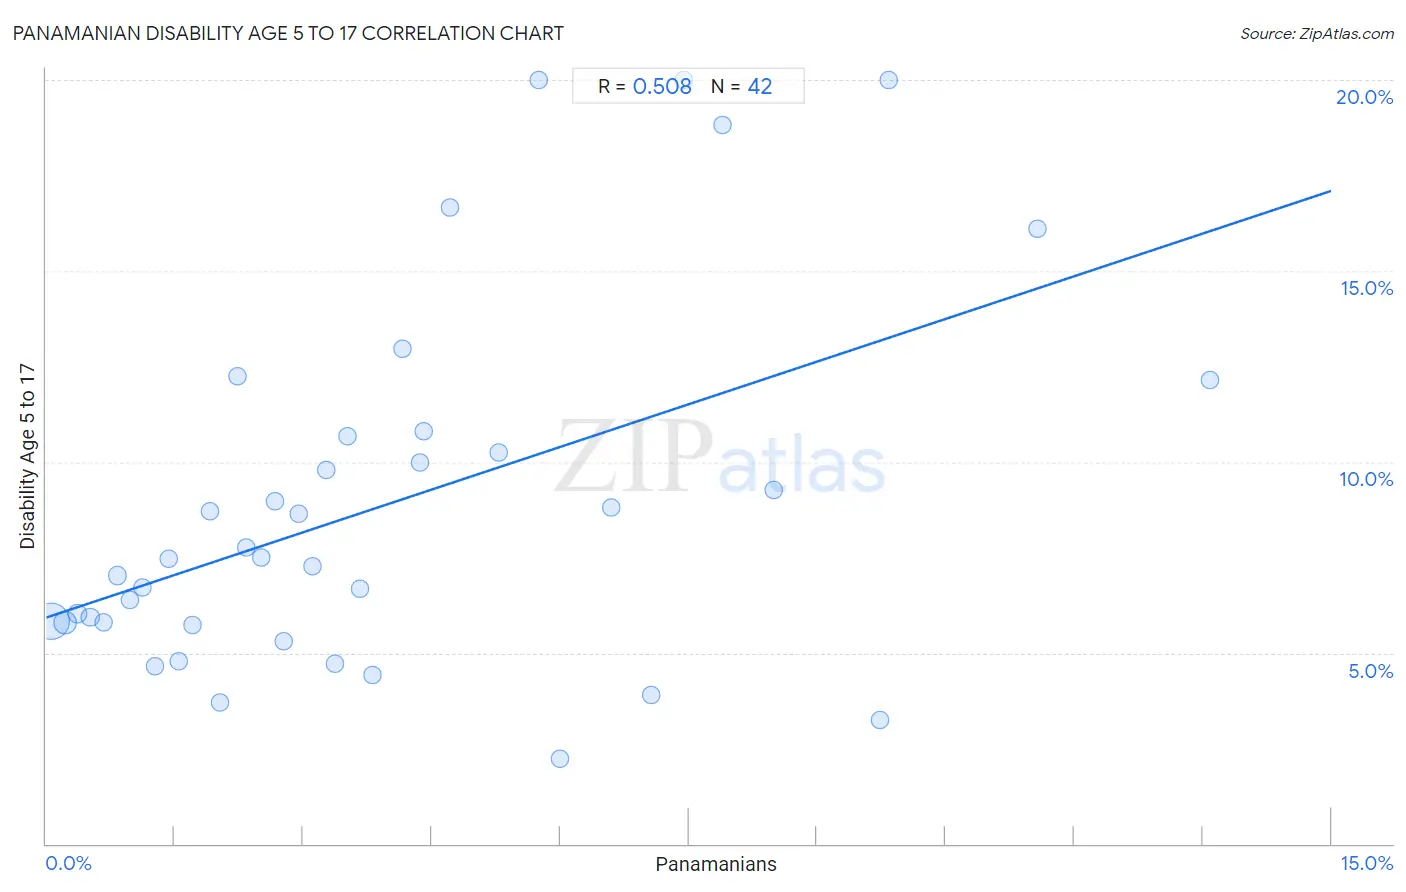
Panamanian Disability Age 5 to 17 Correlation Chart
The statistical analysis conducted on geographies consisting of 279,931,901 people shows a substantial positive correlation between the proportion of Panamanians and percentage of population with a disability between the ages 5 and 17 in the United States with a correlation coefficient (R) of 0.508 and weighted average of 6.0%. On average, for every 1% (one percent) increase in Panamanians within a typical geography, there is an increase of 0.74% in percentage of population with a disability between the ages 5 and 17.
It is essential to understand that the correlation between the percentage of Panamanians and percentage of population with a disability between the ages 5 and 17 does not imply a direct cause-and-effect relationship. It remains uncertain whether the presence of Panamanians influences an upward or downward trend in the level of percentage of population with a disability between the ages 5 and 17 within an area, or if Panamanians simply ended up residing in those areas with higher or lower levels of percentage of population with a disability between the ages 5 and 17 due to other factors.
Demographics Similar to Panamanians by Disability Age 5 to 17
In terms of disability age 5 to 17, the demographic groups most similar to Panamanians are Slovene (6.0%, a difference of 0.030%), Canadian (6.0%, a difference of 0.070%), Spanish (6.0%, a difference of 0.13%), Czechoslovakian (5.9%, a difference of 0.19%), and Immigrants from Western Africa (5.9%, a difference of 0.28%).
| Demographics | Rating | Rank | Disability Age 5 to 17 |
| Brazilians | 0.9 /100 | #258 | Tragic 5.9% |
| Slavs | 0.9 /100 | #259 | Tragic 5.9% |
| Somalis | 0.8 /100 | #260 | Tragic 5.9% |
| Immigrants from Middle Africa | 0.7 /100 | #261 | Tragic 5.9% |
| Immigrants from Western Africa | 0.7 /100 | #262 | Tragic 5.9% |
| Czechoslovakians | 0.7 /100 | #263 | Tragic 5.9% |
| Canadians | 0.6 /100 | #264 | Tragic 6.0% |
| Panamanians | 0.6 /100 | #265 | Tragic 6.0% |
| Slovenes | 0.6 /100 | #266 | Tragic 6.0% |
| Spanish | 0.5 /100 | #267 | Tragic 6.0% |
| Sioux | 0.4 /100 | #268 | Tragic 6.0% |
| Liberians | 0.4 /100 | #269 | Tragic 6.0% |
| Immigrants from Somalia | 0.4 /100 | #270 | Tragic 6.0% |
| Immigrants from Zaire | 0.2 /100 | #271 | Tragic 6.0% |
| Finns | 0.2 /100 | #272 | Tragic 6.0% |
Panamanian Disability Age 5 to 17 Correlation Summary
| Measurement | Panamanian Data | Disability Age 5 to 17 Data |
| Minimum | 0.062% | 2.2% |
| Maximum | 13.6% | 20.0% |
| Range | 13.5% | 17.8% |
| Mean | 4.0% | 8.9% |
| Median | 3.2% | 7.5% |
| Interquartile 25% (IQ1) | 1.5% | 5.8% |
| Interquartile 75% (IQ3) | 5.8% | 10.7% |
| Interquartile Range (IQR) | 4.2% | 4.9% |
| Standard Deviation (Sample) | 3.2% | 4.8% |
| Standard Deviation (Population) | 3.2% | 4.7% |
Correlation Details
| Panamanian Percentile | Sample Size | Disability Age 5 to 17 |
[ 0.0% - 0.5% ] 0.062% | 199,685,589 | 5.8% |
[ 0.0% - 0.5% ] 0.22% | 51,078,107 | 5.8% |
[ 0.0% - 0.5% ] 0.36% | 14,191,385 | 6.0% |
[ 0.5% - 1.0% ] 0.52% | 6,259,295 | 5.9% |
[ 0.5% - 1.0% ] 0.67% | 3,175,549 | 5.8% |
[ 0.5% - 1.0% ] 0.83% | 1,872,663 | 7.0% |
[ 0.5% - 1.0% ] 0.97% | 1,383,573 | 6.4% |
[ 1.0% - 1.5% ] 1.12% | 599,212 | 6.7% |
[ 1.0% - 1.5% ] 1.26% | 521,902 | 4.7% |
[ 1.0% - 1.5% ] 1.42% | 345,119 | 7.5% |
[ 1.5% - 2.0% ] 1.55% | 420,604 | 4.8% |
[ 1.5% - 2.0% ] 1.70% | 120,357 | 5.7% |
[ 1.5% - 2.0% ] 1.92% | 35,546 | 8.7% |
[ 2.0% - 2.5% ] 2.03% | 48,436 | 3.7% |
[ 2.0% - 2.5% ] 2.23% | 16,831 | 12.2% |
[ 2.0% - 2.5% ] 2.33% | 35,905 | 7.7% |
[ 2.5% - 3.0% ] 2.50% | 9,542 | 7.5% |
[ 2.5% - 3.0% ] 2.67% | 11,515 | 9.0% |
[ 2.5% - 3.0% ] 2.77% | 25,609 | 5.3% |
[ 2.5% - 3.0% ] 2.95% | 8,923 | 8.6% |
[ 3.0% - 3.5% ] 3.11% | 29,842 | 7.3% |
[ 3.0% - 3.5% ] 3.27% | 8,559 | 9.8% |
[ 3.0% - 3.5% ] 3.37% | 12,371 | 4.7% |
[ 3.5% - 4.0% ] 3.52% | 654 | 10.7% |
[ 3.5% - 4.0% ] 3.66% | 1,258 | 6.7% |
[ 3.5% - 4.0% ] 3.81% | 1,759 | 4.4% |
[ 4.0% - 4.5% ] 4.15% | 4,550 | 13.0% |
[ 4.0% - 4.5% ] 4.36% | 482 | 10.0% |
[ 4.0% - 4.5% ] 4.41% | 4,876 | 10.8% |
[ 4.5% - 5.0% ] 4.71% | 4,033 | 16.7% |
[ 5.0% - 5.5% ] 5.28% | 265 | 10.3% |
[ 5.5% - 6.0% ] 5.75% | 991 | 20.0% |
[ 5.5% - 6.0% ] 5.99% | 7,779 | 2.2% |
[ 6.5% - 7.0% ] 6.60% | 1,439 | 8.8% |
[ 7.0% - 7.5% ] 7.06% | 1,473 | 3.9% |
[ 7.0% - 7.5% ] 7.44% | 242 | 20.0% |
[ 7.5% - 8.0% ] 7.89% | 2,724 | 18.8% |
[ 8.0% - 8.5% ] 8.49% | 271 | 9.3% |
[ 9.5% - 10.0% ] 9.73% | 514 | 3.2% |
[ 9.5% - 10.0% ] 9.84% | 183 | 20.0% |
[ 11.5% - 12.0% ] 11.58% | 1,002 | 16.1% |
[ 13.5% - 14.0% ] 13.58% | 972 | 12.1% |