Panamanian 2 or more Vehicles in Household
COMPARE
Panamanian
Select to Compare
2 or more Vehicles in Household
Panamanian 2 or more Vehicles in Household
53.5%
2+ VEHICLES AVAILABLE
3.4/ 100
METRIC RATING
231st/ 347
METRIC RANK
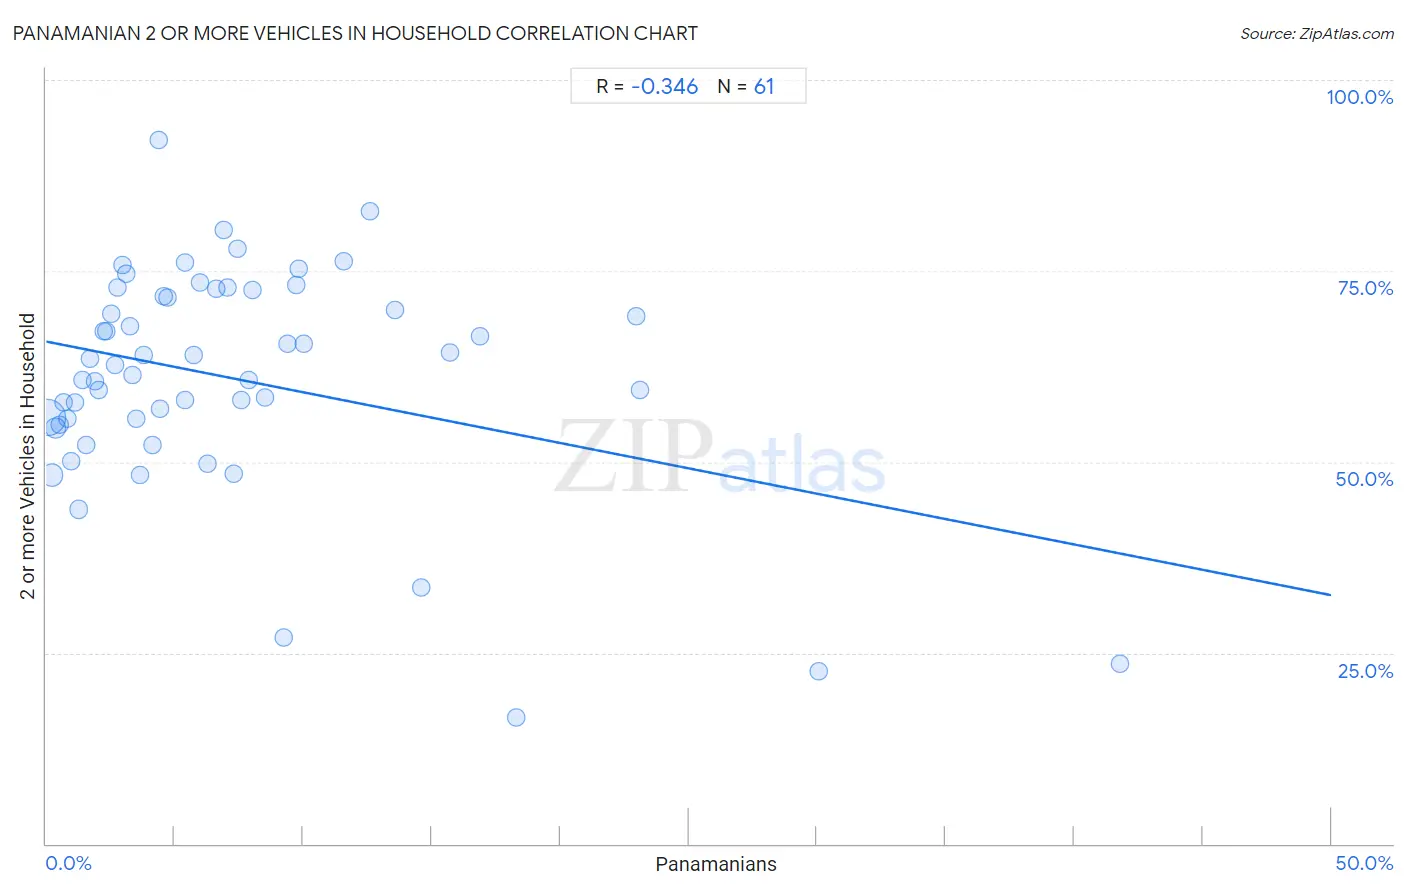
Panamanian 2 or more Vehicles in Household Correlation Chart
The statistical analysis conducted on geographies consisting of 281,077,376 people shows a mild negative correlation between the proportion of Panamanians and percentage of households with 2 or more vehicles available in the United States with a correlation coefficient (R) of -0.346 and weighted average of 53.5%. On average, for every 1% (one percent) increase in Panamanians within a typical geography, there is a decrease of 0.66% in percentage of households with 2 or more vehicles available.
It is essential to understand that the correlation between the percentage of Panamanians and percentage of households with 2 or more vehicles available does not imply a direct cause-and-effect relationship. It remains uncertain whether the presence of Panamanians influences an upward or downward trend in the level of percentage of households with 2 or more vehicles available within an area, or if Panamanians simply ended up residing in those areas with higher or lower levels of percentage of households with 2 or more vehicles available due to other factors.
Demographics Similar to Panamanians by 2 or more Vehicles in Household
In terms of 2 or more vehicles in household, the demographic groups most similar to Panamanians are Immigrants from Nepal (53.5%, a difference of 0.050%), Immigrants from Guatemala (53.5%, a difference of 0.070%), Ugandan (53.5%, a difference of 0.080%), Immigrants from Turkey (53.6%, a difference of 0.11%), and Alaska Native (53.6%, a difference of 0.13%).
| Demographics | Rating | Rank | 2 or more Vehicles in Household |
| Brazilians | 5.3 /100 | #224 | Tragic 53.8% |
| Immigrants from Egypt | 5.2 /100 | #225 | Tragic 53.8% |
| Immigrants from Eastern Africa | 5.1 /100 | #226 | Tragic 53.7% |
| Sudanese | 4.1 /100 | #227 | Tragic 53.6% |
| Alaska Natives | 3.9 /100 | #228 | Tragic 53.6% |
| Immigrants from Turkey | 3.8 /100 | #229 | Tragic 53.6% |
| Immigrants from Nepal | 3.6 /100 | #230 | Tragic 53.5% |
| Panamanians | 3.4 /100 | #231 | Tragic 53.5% |
| Immigrants from Guatemala | 3.2 /100 | #232 | Tragic 53.5% |
| Ugandans | 3.2 /100 | #233 | Tragic 53.5% |
| Immigrants from Switzerland | 3.0 /100 | #234 | Tragic 53.4% |
| Immigrants from Middle Africa | 3.0 /100 | #235 | Tragic 53.4% |
| Indonesians | 2.7 /100 | #236 | Tragic 53.4% |
| Macedonians | 2.4 /100 | #237 | Tragic 53.3% |
| Immigrants from Armenia | 2.3 /100 | #238 | Tragic 53.3% |
Panamanian 2 or more Vehicles in Household Correlation Summary
| Measurement | Panamanian Data | 2 or more Vehicles in Household Data |
| Minimum | 0.062% | 16.5% |
| Maximum | 41.8% | 92.2% |
| Range | 41.7% | 75.7% |
| Mean | 7.2% | 61.0% |
| Median | 4.7% | 62.7% |
| Interquartile 25% (IQ1) | 2.3% | 55.3% |
| Interquartile 75% (IQ3) | 9.3% | 72.1% |
| Interquartile Range (IQR) | 7.0% | 16.8% |
| Standard Deviation (Sample) | 7.6% | 14.6% |
| Standard Deviation (Population) | 7.6% | 14.5% |
Correlation Details
| Panamanian Percentile | Sample Size | 2 or more Vehicles in Household |
[ 0.0% - 0.5% ] 0.062% | 200,140,625 | 55.9% |
[ 0.0% - 0.5% ] 0.22% | 51,369,794 | 48.3% |
[ 0.0% - 0.5% ] 0.36% | 14,297,846 | 54.4% |
[ 0.5% - 1.0% ] 0.52% | 6,337,385 | 54.8% |
[ 0.5% - 1.0% ] 0.67% | 3,204,358 | 57.8% |
[ 0.5% - 1.0% ] 0.83% | 1,903,703 | 55.7% |
[ 0.5% - 1.0% ] 0.97% | 1,412,725 | 50.1% |
[ 1.0% - 1.5% ] 1.12% | 611,551 | 57.8% |
[ 1.0% - 1.5% ] 1.27% | 555,094 | 43.8% |
[ 1.0% - 1.5% ] 1.43% | 350,072 | 60.7% |
[ 1.5% - 2.0% ] 1.55% | 430,612 | 52.2% |
[ 1.5% - 2.0% ] 1.70% | 128,561 | 63.4% |
[ 1.5% - 2.0% ] 1.91% | 44,469 | 60.6% |
[ 2.0% - 2.5% ] 2.03% | 53,753 | 59.4% |
[ 2.0% - 2.5% ] 2.23% | 19,518 | 67.0% |
[ 2.0% - 2.5% ] 2.33% | 42,195 | 67.1% |
[ 2.5% - 3.0% ] 2.50% | 9,621 | 69.4% |
[ 2.5% - 3.0% ] 2.65% | 15,381 | 62.7% |
[ 2.5% - 3.0% ] 2.78% | 36,175 | 72.9% |
[ 2.5% - 3.0% ] 2.95% | 9,502 | 75.7% |
[ 3.0% - 3.5% ] 3.11% | 30,267 | 74.6% |
[ 3.0% - 3.5% ] 3.27% | 8,559 | 67.7% |
[ 3.0% - 3.5% ] 3.37% | 13,798 | 61.3% |
[ 3.5% - 4.0% ] 3.52% | 654 | 55.7% |
[ 3.5% - 4.0% ] 3.66% | 1,258 | 48.3% |
[ 3.5% - 4.0% ] 3.81% | 1,759 | 64.0% |
[ 4.0% - 4.5% ] 4.15% | 4,550 | 52.2% |
[ 4.0% - 4.5% ] 4.36% | 482 | 92.2% |
[ 4.0% - 4.5% ] 4.41% | 5,009 | 57.0% |
[ 4.5% - 5.0% ] 4.60% | 631 | 71.6% |
[ 4.5% - 5.0% ] 4.71% | 4,033 | 71.5% |
[ 5.0% - 5.5% ] 5.39% | 7,901 | 58.1% |
[ 5.0% - 5.5% ] 5.42% | 166 | 76.1% |
[ 5.5% - 6.0% ] 5.75% | 991 | 63.9% |
[ 5.5% - 6.0% ] 5.99% | 7,779 | 73.5% |
[ 6.0% - 6.5% ] 6.29% | 874 | 49.7% |
[ 6.5% - 7.0% ] 6.60% | 1,439 | 72.7% |
[ 6.5% - 7.0% ] 6.90% | 507 | 80.3% |
[ 7.0% - 7.5% ] 7.06% | 1,841 | 72.8% |
[ 7.0% - 7.5% ] 7.28% | 1,072 | 48.5% |
[ 7.0% - 7.5% ] 7.43% | 323 | 77.9% |
[ 7.5% - 8.0% ] 7.58% | 396 | 58.0% |
[ 7.5% - 8.0% ] 7.89% | 2,724 | 60.7% |
[ 8.0% - 8.5% ] 8.02% | 1,047 | 72.6% |
[ 8.0% - 8.5% ] 8.49% | 318 | 58.5% |
[ 9.0% - 9.5% ] 9.24% | 357 | 27.0% |
[ 9.0% - 9.5% ] 9.41% | 202 | 65.5% |
[ 9.5% - 10.0% ] 9.73% | 514 | 73.2% |
[ 9.5% - 10.0% ] 9.84% | 183 | 75.3% |
[ 10.0% - 10.5% ] 10.00% | 740 | 65.4% |
[ 11.5% - 12.0% ] 11.58% | 1,002 | 76.2% |
[ 12.5% - 13.0% ] 12.59% | 135 | 82.9% |
[ 13.5% - 14.0% ] 13.58% | 972 | 69.8% |
[ 14.5% - 15.0% ] 14.61% | 219 | 33.6% |
[ 15.5% - 16.0% ] 15.70% | 414 | 64.2% |
[ 16.5% - 17.0% ] 16.89% | 296 | 66.5% |
[ 18.0% - 18.5% ] 18.29% | 175 | 16.5% |
[ 22.5% - 23.0% ] 22.97% | 74 | 69.0% |
[ 23.0% - 23.5% ] 23.10% | 381 | 59.4% |
[ 30.0% - 30.5% ] 30.08% | 133 | 22.6% |
[ 41.5% - 42.0% ] 41.76% | 261 | 23.5% |