Panamanian 4 or more Vehicles in Household
COMPARE
Panamanian
Select to Compare
4 or more Vehicles in Household
Panamanian 4 or more Vehicles in Household
6.0%
4+ VEHICLES AVAILABLE
14.8/ 100
METRIC RATING
211th/ 347
METRIC RANK
Panamanian 4 or more Vehicles in Household Correlation Chart
The statistical analysis conducted on geographies consisting of 279,879,359 people shows a substantial positive correlation between the proportion of Panamanians and percentage of households with 4 or more vehicles available in the United States with a correlation coefficient (R) of 0.514 and weighted average of 6.0%. On average, for every 1% (one percent) increase in Panamanians within a typical geography, there is an increase of 0.71% in percentage of households with 4 or more vehicles available.
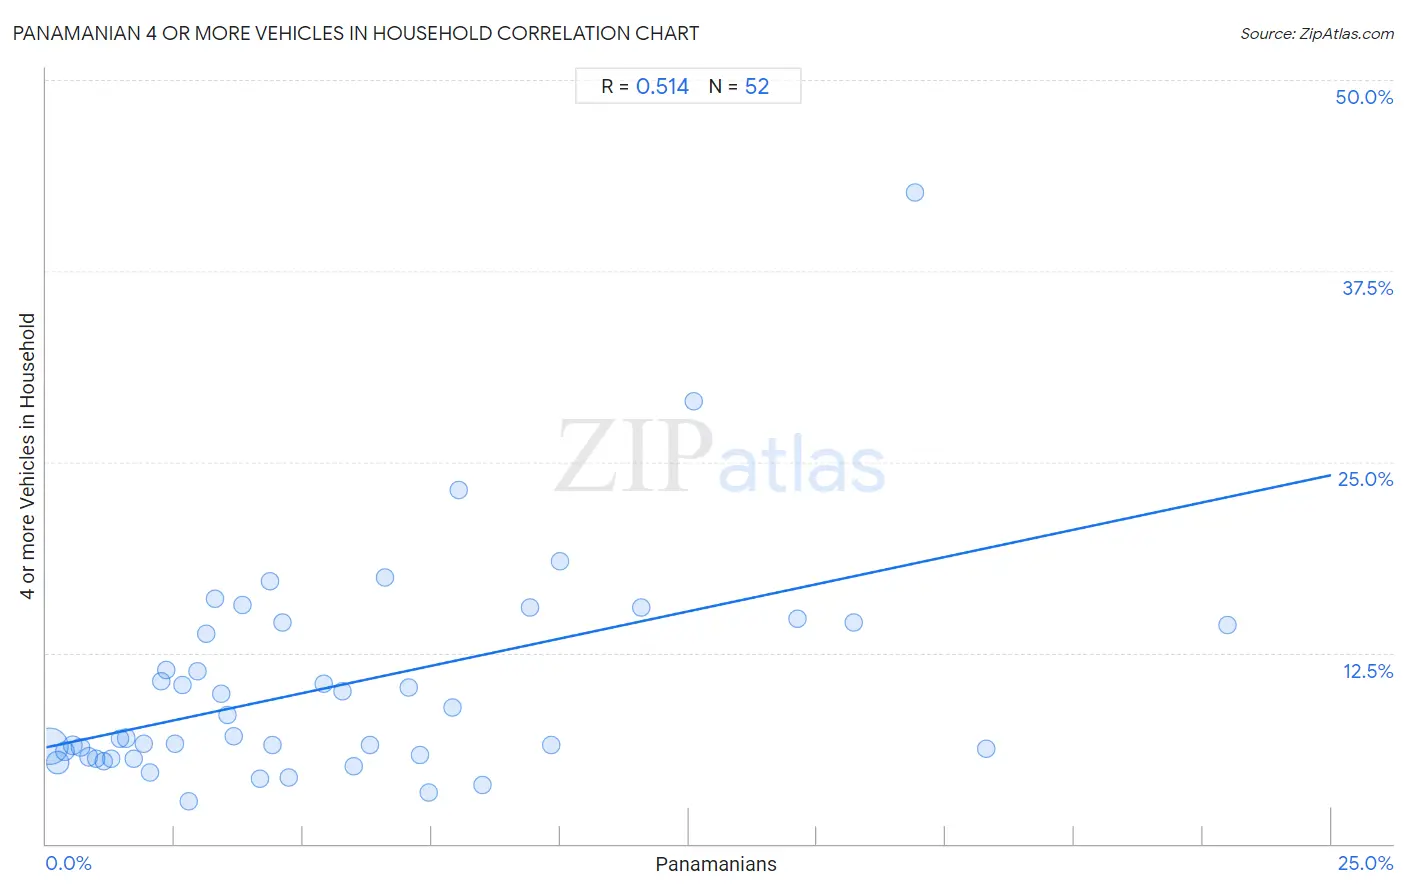
It is essential to understand that the correlation between the percentage of Panamanians and percentage of households with 4 or more vehicles available does not imply a direct cause-and-effect relationship. It remains uncertain whether the presence of Panamanians influences an upward or downward trend in the level of percentage of households with 4 or more vehicles available within an area, or if Panamanians simply ended up residing in those areas with higher or lower levels of percentage of households with 4 or more vehicles available due to other factors.
Demographics Similar to Panamanians by 4 or more Vehicles in Household
In terms of 4 or more vehicles in household, the demographic groups most similar to Panamanians are Immigrants from Egypt (6.0%, a difference of 0.020%), Immigrants from Zimbabwe (6.0%, a difference of 0.080%), Arab (6.0%, a difference of 0.080%), Immigrants from Austria (6.0%, a difference of 0.090%), and Immigrants from Honduras (6.1%, a difference of 0.13%).
| Demographics | Rating | Rank | 4 or more Vehicles in Household |
| Immigrants from Belize | 19.8 /100 | #204 | Poor 6.1% |
| Hondurans | 19.3 /100 | #205 | Poor 6.1% |
| Kenyans | 18.5 /100 | #206 | Poor 6.1% |
| Immigrants from Chile | 16.9 /100 | #207 | Poor 6.1% |
| Immigrants from Nigeria | 15.6 /100 | #208 | Poor 6.1% |
| Immigrants from Honduras | 15.4 /100 | #209 | Poor 6.1% |
| Immigrants from Zimbabwe | 15.1 /100 | #210 | Poor 6.0% |
| Panamanians | 14.8 /100 | #211 | Poor 6.0% |
| Immigrants from Egypt | 14.7 /100 | #212 | Poor 6.0% |
| Arabs | 14.4 /100 | #213 | Poor 6.0% |
| Immigrants from Austria | 14.3 /100 | #214 | Poor 6.0% |
| Immigrants from China | 13.8 /100 | #215 | Poor 6.0% |
| Immigrants from Romania | 13.8 /100 | #216 | Poor 6.0% |
| Nigerians | 12.2 /100 | #217 | Poor 6.0% |
| Immigrants from Italy | 11.0 /100 | #218 | Poor 6.0% |
Panamanian 4 or more Vehicles in Household Correlation Summary
| Measurement | Panamanian Data | 4 or more Vehicles in Household Data |
| Minimum | 0.062% | 2.8% |
| Maximum | 23.0% | 42.6% |
| Range | 22.9% | 39.9% |
| Mean | 5.6% | 10.3% |
| Median | 4.0% | 7.0% |
| Interquartile 25% (IQ1) | 2.0% | 5.7% |
| Interquartile 75% (IQ3) | 7.7% | 14.4% |
| Interquartile Range (IQR) | 5.7% | 8.7% |
| Standard Deviation (Sample) | 5.1% | 7.1% |
| Standard Deviation (Population) | 5.0% | 7.0% |
Correlation Details
| Panamanian Percentile | Sample Size | 4 or more Vehicles in Household |
[ 0.0% - 0.5% ] 0.062% | 199,743,610 | 6.4% |
[ 0.0% - 0.5% ] 0.22% | 51,107,164 | 5.3% |
[ 0.0% - 0.5% ] 0.36% | 14,003,735 | 6.0% |
[ 0.5% - 1.0% ] 0.52% | 6,218,931 | 6.4% |
[ 0.5% - 1.0% ] 0.67% | 3,187,845 | 6.3% |
[ 0.5% - 1.0% ] 0.83% | 1,858,266 | 5.7% |
[ 0.5% - 1.0% ] 0.97% | 1,400,560 | 5.6% |
[ 1.0% - 1.5% ] 1.12% | 598,793 | 5.4% |
[ 1.0% - 1.5% ] 1.27% | 543,989 | 5.5% |
[ 1.0% - 1.5% ] 1.43% | 350,072 | 6.8% |
[ 1.5% - 2.0% ] 1.55% | 430,612 | 6.9% |
[ 1.5% - 2.0% ] 1.70% | 126,967 | 5.5% |
[ 1.5% - 2.0% ] 1.91% | 38,203 | 6.5% |
[ 2.0% - 2.5% ] 2.03% | 53,213 | 4.7% |
[ 2.0% - 2.5% ] 2.23% | 19,518 | 10.7% |
[ 2.0% - 2.5% ] 2.33% | 38,719 | 11.4% |
[ 2.5% - 3.0% ] 2.50% | 7,399 | 6.6% |
[ 2.5% - 3.0% ] 2.66% | 13,298 | 10.4% |
[ 2.5% - 3.0% ] 2.78% | 36,175 | 2.8% |
[ 2.5% - 3.0% ] 2.95% | 9,502 | 11.3% |
[ 3.0% - 3.5% ] 3.11% | 30,267 | 13.8% |
[ 3.0% - 3.5% ] 3.27% | 8,559 | 16.0% |
[ 3.0% - 3.5% ] 3.41% | 6,741 | 9.8% |
[ 3.5% - 4.0% ] 3.52% | 654 | 8.4% |
[ 3.5% - 4.0% ] 3.66% | 1,258 | 7.1% |
[ 3.5% - 4.0% ] 3.81% | 1,759 | 15.6% |
[ 4.0% - 4.5% ] 4.15% | 4,550 | 4.2% |
[ 4.0% - 4.5% ] 4.36% | 482 | 17.2% |
[ 4.0% - 4.5% ] 4.41% | 5,009 | 6.5% |
[ 4.5% - 5.0% ] 4.60% | 631 | 14.5% |
[ 4.5% - 5.0% ] 4.71% | 4,033 | 4.4% |
[ 5.0% - 5.5% ] 5.39% | 7,044 | 10.5% |
[ 5.5% - 6.0% ] 5.75% | 991 | 10.0% |
[ 5.5% - 6.0% ] 5.99% | 7,779 | 5.1% |
[ 6.0% - 6.5% ] 6.29% | 874 | 6.4% |
[ 6.5% - 7.0% ] 6.60% | 1,439 | 17.4% |
[ 7.0% - 7.5% ] 7.06% | 1,841 | 10.2% |
[ 7.0% - 7.5% ] 7.28% | 1,072 | 5.8% |
[ 7.0% - 7.5% ] 7.43% | 323 | 3.3% |
[ 7.5% - 8.0% ] 7.89% | 2,724 | 8.9% |
[ 8.0% - 8.5% ] 8.02% | 1,047 | 23.2% |
[ 8.0% - 8.5% ] 8.49% | 271 | 3.8% |
[ 9.0% - 9.5% ] 9.41% | 202 | 15.5% |
[ 9.5% - 10.0% ] 9.84% | 183 | 6.5% |
[ 10.0% - 10.5% ] 10.00% | 740 | 18.5% |
[ 11.5% - 12.0% ] 11.58% | 1,002 | 15.5% |
[ 12.5% - 13.0% ] 12.59% | 135 | 28.9% |
[ 14.5% - 15.0% ] 14.61% | 219 | 14.8% |
[ 15.5% - 16.0% ] 15.70% | 414 | 14.5% |
[ 16.5% - 17.0% ] 16.89% | 296 | 42.6% |
[ 18.0% - 18.5% ] 18.29% | 175 | 6.2% |
[ 22.5% - 23.0% ] 22.97% | 74 | 14.3% |