Native Hawaiian vs Immigrants from Netherlands Married-Couple Family Poverty
COMPARE
Native Hawaiian
Immigrants from Netherlands
Married-Couple Family Poverty
Married-Couple Family Poverty Comparison
Native Hawaiians
Immigrants from Netherlands
4.6%
MARRIED-COUPLE FAMILY POVERTY
98.0/ 100
METRIC RATING
98th/ 347
METRIC RANK
4.3%
MARRIED-COUPLE FAMILY POVERTY
99.7/ 100
METRIC RATING
57th/ 347
METRIC RANK
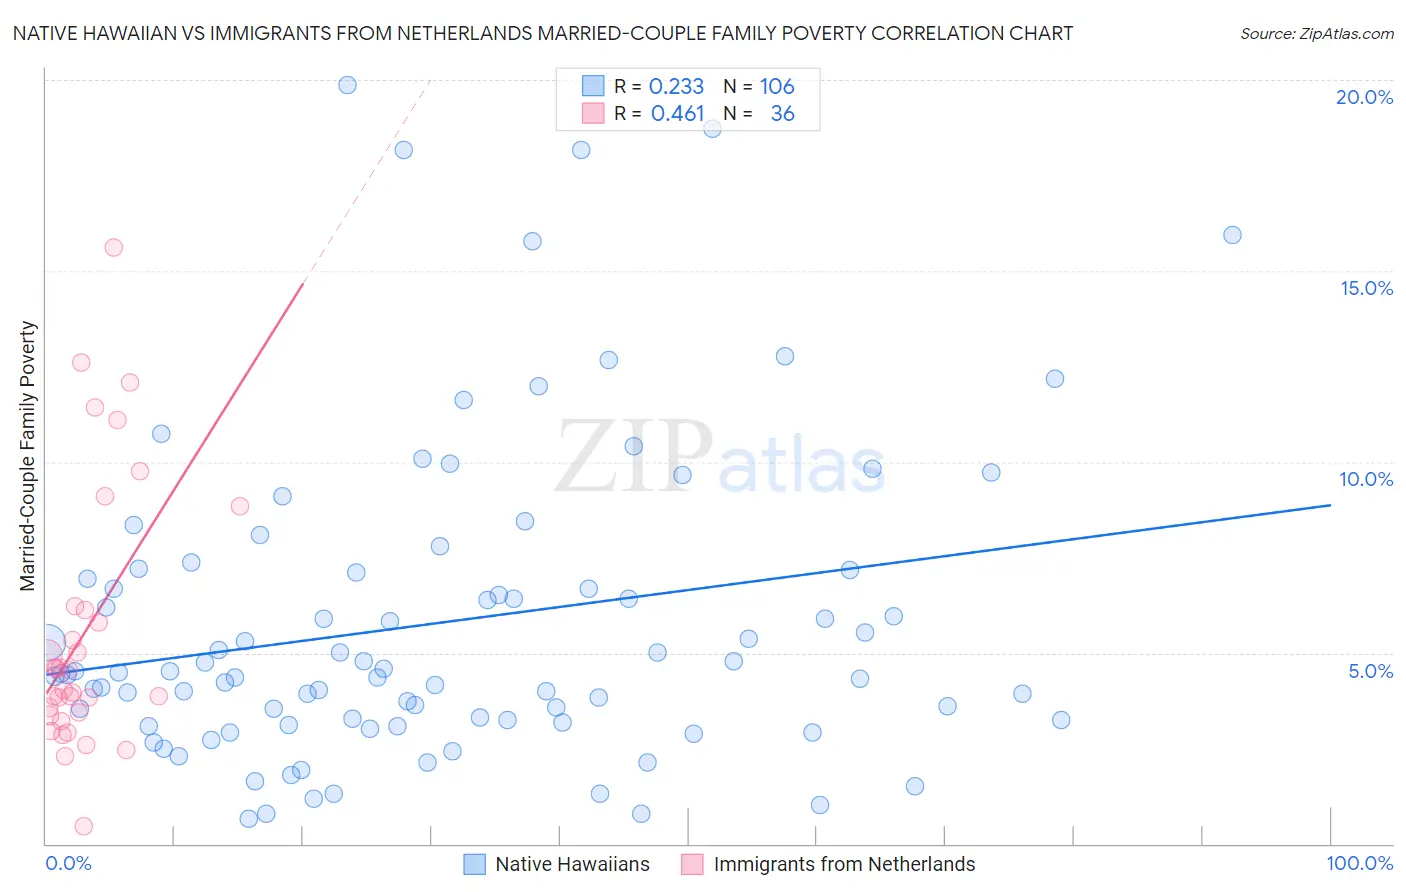
Native Hawaiian vs Immigrants from Netherlands Married-Couple Family Poverty Correlation Chart
The statistical analysis conducted on geographies consisting of 329,768,638 people shows a weak positive correlation between the proportion of Native Hawaiians and poverty level among married-couple families in the United States with a correlation coefficient (R) of 0.233 and weighted average of 4.6%. Similarly, the statistical analysis conducted on geographies consisting of 236,404,410 people shows a moderate positive correlation between the proportion of Immigrants from Netherlands and poverty level among married-couple families in the United States with a correlation coefficient (R) of 0.461 and weighted average of 4.3%, a difference of 6.5%.
Married-Couple Family Poverty Correlation Summary
| Measurement | Native Hawaiian | Immigrants from Netherlands |
| Minimum | 0.64% | 0.44% |
| Maximum | 19.9% | 15.6% |
| Range | 19.2% | 15.2% |
| Mean | 5.8% | 5.5% |
| Median | 4.5% | 4.3% |
| Interquartile 25% (IQ1) | 3.2% | 3.4% |
| Interquartile 75% (IQ3) | 7.1% | 6.2% |
| Interquartile Range (IQR) | 3.9% | 2.8% |
| Standard Deviation (Sample) | 4.1% | 3.5% |
| Standard Deviation (Population) | 4.1% | 3.4% |
Similar Demographics by Married-Couple Family Poverty
Demographics Similar to Native Hawaiians by Married-Couple Family Poverty
In terms of married-couple family poverty, the demographic groups most similar to Native Hawaiians are Immigrants from Europe (4.6%, a difference of 0.12%), Immigrants from Western Europe (4.6%, a difference of 0.22%), Yugoslavian (4.6%, a difference of 0.24%), Immigrants from Belgium (4.6%, a difference of 0.43%), and Immigrants from Poland (4.6%, a difference of 0.48%).
| Demographics | Rating | Rank | Married-Couple Family Poverty |
| Basques | 98.5 /100 | #91 | Exceptional 4.6% |
| Immigrants | Norway | 98.4 /100 | #92 | Exceptional 4.6% |
| Koreans | 98.3 /100 | #93 | Exceptional 4.6% |
| Immigrants | Italy | 98.3 /100 | #94 | Exceptional 4.6% |
| Portuguese | 98.3 /100 | #95 | Exceptional 4.6% |
| Immigrants | Poland | 98.3 /100 | #96 | Exceptional 4.6% |
| Immigrants | Belgium | 98.2 /100 | #97 | Exceptional 4.6% |
| Native Hawaiians | 98.0 /100 | #98 | Exceptional 4.6% |
| Immigrants | Europe | 97.9 /100 | #99 | Exceptional 4.6% |
| Immigrants | Western Europe | 97.9 /100 | #100 | Exceptional 4.6% |
| Yugoslavians | 97.8 /100 | #101 | Exceptional 4.6% |
| Asians | 97.6 /100 | #102 | Exceptional 4.7% |
| Immigrants | Romania | 97.3 /100 | #103 | Exceptional 4.7% |
| Immigrants | Moldova | 97.1 /100 | #104 | Exceptional 4.7% |
| Aleuts | 97.0 /100 | #105 | Exceptional 4.7% |
Demographics Similar to Immigrants from Netherlands by Married-Couple Family Poverty
In terms of married-couple family poverty, the demographic groups most similar to Immigrants from Netherlands are Immigrants from Zimbabwe (4.3%, a difference of 0.0%), Czechoslovakian (4.4%, a difference of 0.090%), French (4.3%, a difference of 0.16%), Austrian (4.3%, a difference of 0.18%), and Welsh (4.3%, a difference of 0.45%).
| Demographics | Rating | Rank | Married-Couple Family Poverty |
| Burmese | 99.7 /100 | #50 | Exceptional 4.3% |
| Immigrants | Lithuania | 99.7 /100 | #51 | Exceptional 4.3% |
| Russians | 99.7 /100 | #52 | Exceptional 4.3% |
| Welsh | 99.7 /100 | #53 | Exceptional 4.3% |
| Austrians | 99.7 /100 | #54 | Exceptional 4.3% |
| French | 99.7 /100 | #55 | Exceptional 4.3% |
| Immigrants | Zimbabwe | 99.7 /100 | #56 | Exceptional 4.3% |
| Immigrants | Netherlands | 99.7 /100 | #57 | Exceptional 4.3% |
| Czechoslovakians | 99.7 /100 | #58 | Exceptional 4.4% |
| Immigrants | Sweden | 99.6 /100 | #59 | Exceptional 4.4% |
| Tlingit-Haida | 99.6 /100 | #60 | Exceptional 4.4% |
| Okinawans | 99.6 /100 | #61 | Exceptional 4.4% |
| Immigrants | Australia | 99.6 /100 | #62 | Exceptional 4.4% |
| Immigrants | Sri Lanka | 99.6 /100 | #63 | Exceptional 4.4% |
| Immigrants | Bulgaria | 99.5 /100 | #64 | Exceptional 4.4% |