Native Hawaiian Family Households with Children
COMPARE
Native Hawaiian
Select to Compare
Family Households with Children
Native Hawaiian Family Households with Children
27.4%
FAMILY HOUSEHOLDS WITH CHILDREN
44.6/ 100
METRIC RATING
184th/ 347
METRIC RANK
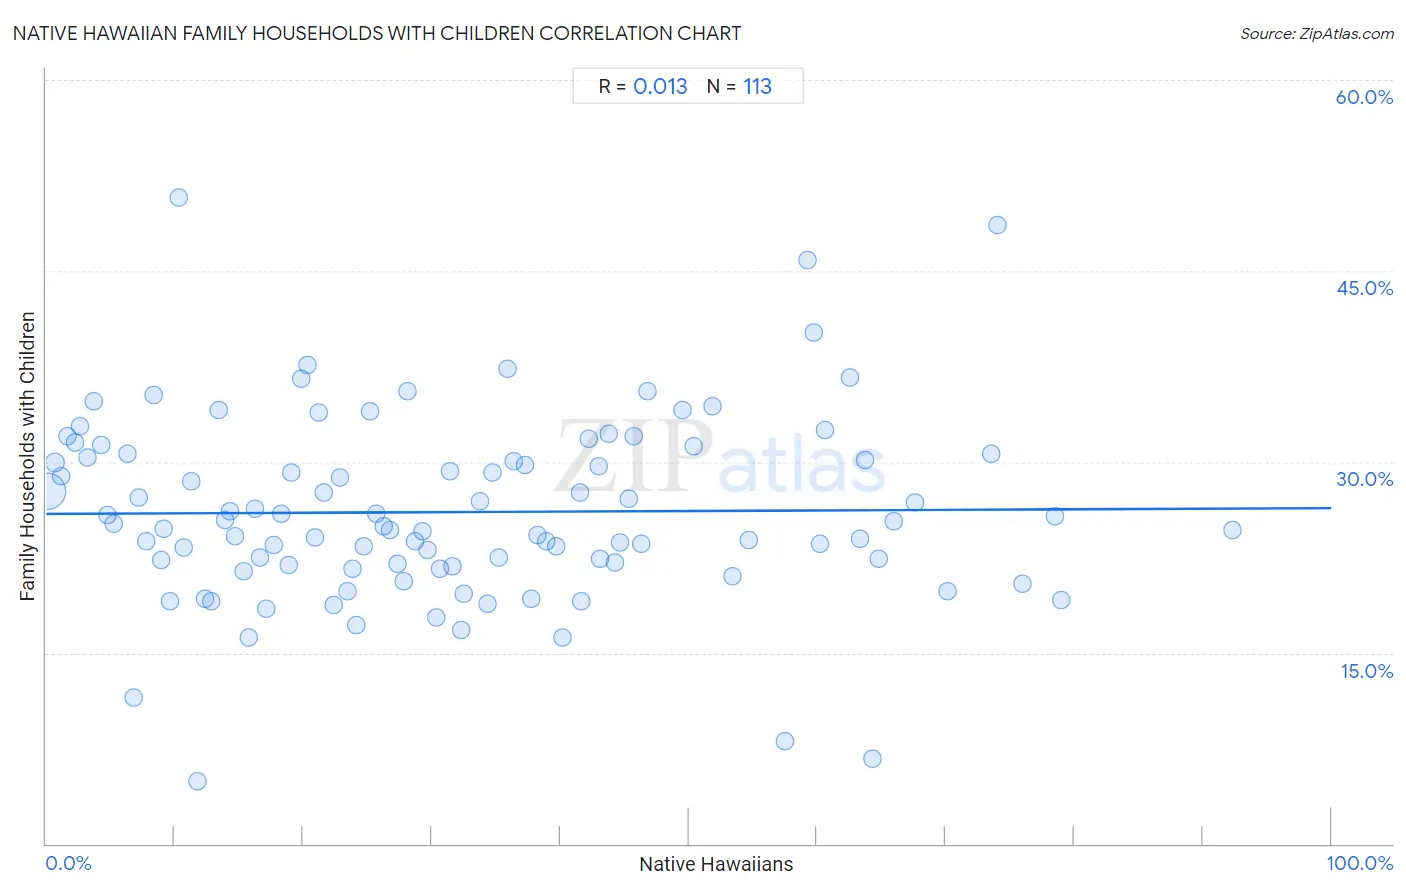
Native Hawaiian Family Households with Children Correlation Chart
The statistical analysis conducted on geographies consisting of 331,771,258 people shows no correlation between the proportion of Native Hawaiians and percentage of family households with children in the United States with a correlation coefficient (R) of 0.013 and weighted average of 27.4%. On average, for every 1% (one percent) increase in Native Hawaiians within a typical geography, there is an increase of 0.0045% in percentage of family households with children.
It is essential to understand that the correlation between the percentage of Native Hawaiians and percentage of family households with children does not imply a direct cause-and-effect relationship. It remains uncertain whether the presence of Native Hawaiians influences an upward or downward trend in the level of percentage of family households with children within an area, or if Native Hawaiians simply ended up residing in those areas with higher or lower levels of percentage of family households with children due to other factors.
Demographics Similar to Native Hawaiians by Family Households with Children
In terms of family households with children, the demographic groups most similar to Native Hawaiians are South African (27.4%, a difference of 0.010%), Puget Sound Salish (27.4%, a difference of 0.040%), Turkish (27.4%, a difference of 0.050%), Immigrants from Turkey (27.4%, a difference of 0.050%), and Aleut (27.4%, a difference of 0.050%).
| Demographics | Rating | Rank | Family Households with Children |
| Ugandans | 49.2 /100 | #177 | Average 27.4% |
| Spanish Americans | 48.9 /100 | #178 | Average 27.4% |
| Turks | 46.9 /100 | #179 | Average 27.4% |
| Immigrants from Turkey | 46.9 /100 | #180 | Average 27.4% |
| Aleuts | 46.7 /100 | #181 | Average 27.4% |
| Puget Sound Salish | 46.2 /100 | #182 | Average 27.4% |
| South Africans | 44.9 /100 | #183 | Average 27.4% |
| Native Hawaiians | 44.6 /100 | #184 | Average 27.4% |
| Delaware | 42.0 /100 | #185 | Average 27.4% |
| Immigrants from Brazil | 40.6 /100 | #186 | Average 27.4% |
| Creek | 39.8 /100 | #187 | Fair 27.4% |
| Dutch | 38.8 /100 | #188 | Fair 27.4% |
| Immigrants from Israel | 37.9 /100 | #189 | Fair 27.4% |
| Immigrants from Uruguay | 37.7 /100 | #190 | Fair 27.4% |
| Sudanese | 37.6 /100 | #191 | Fair 27.4% |
Native Hawaiian Family Households with Children Correlation Summary
| Measurement | Native Hawaiian Data | Family Households with Children Data |
| Minimum | 0.13% | 5.0% |
| Maximum | 92.3% | 50.8% |
| Range | 92.1% | 45.9% |
| Mean | 31.9% | 26.1% |
| Median | 28.7% | 25.0% |
| Interquartile 25% (IQ1) | 14.5% | 21.9% |
| Interquartile 75% (IQ3) | 45.0% | 30.5% |
| Interquartile Range (IQR) | 30.5% | 8.6% |
| Standard Deviation (Sample) | 21.4% | 7.4% |
| Standard Deviation (Population) | 21.3% | 7.3% |
Correlation Details
| Native Hawaiian Percentile | Sample Size | Family Households with Children |
[ 0.0% - 0.5% ] 0.13% | 300,129,237 | 27.7% |
[ 0.5% - 1.0% ] 0.69% | 22,041,082 | 29.9% |
[ 1.0% - 1.5% ] 1.17% | 4,400,935 | 28.9% |
[ 1.5% - 2.0% ] 1.66% | 1,438,920 | 32.0% |
[ 2.0% - 2.5% ] 2.21% | 551,003 | 31.6% |
[ 2.5% - 3.0% ] 2.65% | 156,538 | 32.8% |
[ 3.0% - 3.5% ] 3.20% | 65,879 | 30.3% |
[ 3.5% - 4.0% ] 3.70% | 38,602 | 34.7% |
[ 4.0% - 4.5% ] 4.25% | 49,517 | 31.4% |
[ 4.5% - 5.0% ] 4.72% | 49,511 | 25.8% |
[ 5.0% - 5.5% ] 5.21% | 27,265 | 25.1% |
[ 6.0% - 6.5% ] 6.32% | 7,299 | 30.6% |
[ 6.5% - 7.0% ] 6.83% | 31,585 | 11.5% |
[ 7.0% - 7.5% ] 7.18% | 6,084 | 27.2% |
[ 7.5% - 8.0% ] 7.81% | 12,778 | 23.8% |
[ 8.0% - 8.5% ] 8.34% | 66,750 | 35.2% |
[ 8.5% - 9.0% ] 8.92% | 6,493 | 22.3% |
[ 9.0% - 9.5% ] 9.19% | 3,669 | 24.7% |
[ 9.5% - 10.0% ] 9.61% | 31,825 | 19.0% |
[ 10.0% - 10.5% ] 10.30% | 17,425 | 50.8% |
[ 10.5% - 11.0% ] 10.72% | 19,843 | 23.3% |
[ 11.0% - 11.5% ] 11.24% | 1,513 | 28.5% |
[ 11.5% - 12.0% ] 11.79% | 1,680 | 5.0% |
[ 12.0% - 12.5% ] 12.39% | 464,382 | 19.3% |
[ 12.5% - 13.0% ] 12.81% | 52,995 | 19.0% |
[ 13.0% - 13.5% ] 13.39% | 102,236 | 34.1% |
[ 13.5% - 14.0% ] 13.86% | 101,514 | 25.4% |
[ 14.0% - 14.5% ] 14.35% | 103,149 | 26.2% |
[ 14.5% - 15.0% ] 14.67% | 128,020 | 24.1% |
[ 15.0% - 15.5% ] 15.41% | 6,591 | 21.4% |
[ 15.5% - 16.0% ] 15.77% | 28,431 | 16.2% |
[ 16.0% - 16.5% ] 16.25% | 163,685 | 26.3% |
[ 16.5% - 17.0% ] 16.62% | 28,537 | 22.5% |
[ 17.0% - 17.5% ] 17.14% | 51,321 | 18.5% |
[ 17.5% - 18.0% ] 17.74% | 58,669 | 23.5% |
[ 18.0% - 18.5% ] 18.31% | 4,184 | 25.9% |
[ 18.5% - 19.0% ] 18.85% | 117,714 | 21.9% |
[ 19.0% - 19.5% ] 19.11% | 71,880 | 29.2% |
[ 19.5% - 20.0% ] 19.85% | 35,154 | 36.5% |
[ 20.0% - 20.5% ] 20.36% | 97,208 | 37.6% |
[ 20.5% - 21.0% ] 20.87% | 28,826 | 24.0% |
[ 21.0% - 21.5% ] 21.22% | 21,055 | 33.9% |
[ 21.5% - 22.0% ] 21.64% | 15,015 | 27.6% |
[ 22.0% - 22.5% ] 22.35% | 13,335 | 18.8% |
[ 22.5% - 23.0% ] 22.88% | 43,342 | 28.8% |
[ 23.0% - 23.5% ] 23.43% | 3,197 | 19.9% |
[ 23.5% - 24.0% ] 23.83% | 54,915 | 21.6% |
[ 24.0% - 24.5% ] 24.16% | 7,050 | 17.2% |
[ 24.5% - 25.0% ] 24.68% | 36,062 | 23.4% |
[ 25.0% - 25.5% ] 25.22% | 2,788 | 33.9% |
[ 25.5% - 26.0% ] 25.72% | 13,666 | 25.9% |
[ 26.0% - 26.5% ] 26.30% | 2,255 | 25.0% |
[ 26.5% - 27.0% ] 26.78% | 26,147 | 24.6% |
[ 27.0% - 27.5% ] 27.32% | 63,950 | 22.0% |
[ 27.5% - 28.0% ] 27.81% | 9,568 | 20.7% |
[ 28.0% - 28.5% ] 28.13% | 49,623 | 35.6% |
[ 28.5% - 29.0% ] 28.68% | 38,553 | 23.7% |
[ 29.0% - 29.5% ] 29.29% | 7,767 | 24.5% |
[ 29.5% - 30.0% ] 29.68% | 66,780 | 23.1% |
[ 30.0% - 30.5% ] 30.35% | 3,532 | 17.8% |
[ 30.5% - 31.0% ] 30.63% | 3,542 | 21.6% |
[ 31.0% - 31.5% ] 31.44% | 4,628 | 29.2% |
[ 31.5% - 32.0% ] 31.62% | 7,704 | 21.8% |
[ 32.0% - 32.5% ] 32.33% | 2,966 | 16.8% |
[ 32.5% - 33.0% ] 32.52% | 3,484 | 19.6% |
[ 33.5% - 34.0% ] 33.76% | 55,163 | 26.9% |
[ 34.0% - 34.5% ] 34.33% | 6,216 | 18.8% |
[ 34.5% - 35.0% ] 34.69% | 1,897 | 29.2% |
[ 35.0% - 35.5% ] 35.26% | 27,351 | 22.5% |
[ 35.5% - 36.0% ] 35.92% | 27,766 | 37.4% |
[ 36.0% - 36.5% ] 36.35% | 2,421 | 30.0% |
[ 37.0% - 37.5% ] 37.28% | 5,638 | 29.8% |
[ 37.5% - 38.0% ] 37.79% | 2,625 | 19.3% |
[ 38.0% - 38.5% ] 38.18% | 11,149 | 24.2% |
[ 38.5% - 39.0% ] 38.95% | 50,453 | 23.8% |
[ 39.5% - 40.0% ] 39.66% | 49,256 | 23.4% |
[ 40.0% - 40.5% ] 40.13% | 1,834 | 16.2% |
[ 41.0% - 41.5% ] 41.50% | 547 | 27.6% |
[ 41.5% - 42.0% ] 41.66% | 1,781 | 19.0% |
[ 42.0% - 42.5% ] 42.22% | 15,863 | 31.8% |
[ 42.5% - 43.0% ] 42.99% | 4,555 | 29.6% |
[ 43.0% - 43.5% ] 43.05% | 11,029 | 22.4% |
[ 43.5% - 44.0% ] 43.78% | 4,429 | 32.2% |
[ 44.0% - 44.5% ] 44.27% | 3,587 | 22.1% |
[ 44.5% - 45.0% ] 44.65% | 4,065 | 23.7% |
[ 45.0% - 45.5% ] 45.29% | 10,042 | 27.1% |
[ 45.5% - 46.0% ] 45.76% | 17,696 | 32.0% |
[ 46.0% - 46.5% ] 46.26% | 1,096 | 23.6% |
[ 46.5% - 47.0% ] 46.76% | 3,593 | 35.5% |
[ 49.5% - 50.0% ] 49.55% | 890 | 34.1% |
[ 50.0% - 50.5% ] 50.39% | 3,832 | 31.2% |
[ 51.5% - 52.0% ] 51.81% | 4,366 | 34.4% |
[ 53.0% - 53.5% ] 53.45% | 3,686 | 21.0% |
[ 54.5% - 55.0% ] 54.72% | 3,149 | 23.9% |
[ 57.0% - 57.5% ] 57.46% | 731 | 8.0% |
[ 59.0% - 59.5% ] 59.23% | 130 | 45.8% |
[ 59.5% - 60.0% ] 59.72% | 17,857 | 40.2% |
[ 60.0% - 60.5% ] 60.21% | 480 | 23.5% |
[ 60.5% - 61.0% ] 60.59% | 51,367 | 32.5% |
[ 62.5% - 63.0% ] 62.57% | 2,872 | 36.6% |
[ 63.0% - 63.5% ] 63.35% | 4,827 | 23.9% |
[ 63.5% - 64.0% ] 63.68% | 14,129 | 30.2% |
[ 64.0% - 64.5% ] 64.30% | 902 | 6.7% |
[ 64.5% - 65.0% ] 64.76% | 210 | 22.4% |
[ 65.5% - 66.0% ] 65.97% | 3,591 | 25.3% |
[ 67.5% - 68.0% ] 67.63% | 10,307 | 26.8% |
[ 70.0% - 70.5% ] 70.09% | 3,133 | 19.8% |
[ 73.5% - 74.0% ] 73.53% | 12,370 | 30.6% |
[ 74.0% - 74.5% ] 74.07% | 324 | 48.6% |
[ 75.5% - 76.0% ] 75.96% | 2,853 | 20.5% |
[ 78.0% - 78.5% ] 78.49% | 2,436 | 25.7% |
[ 78.5% - 79.0% ] 78.97% | 4,475 | 19.1% |
[ 92.0% - 92.5% ] 92.27% | 1,436 | 24.6% |