Native Hawaiian Disability Age 5 to 17
COMPARE
Native Hawaiian
Select to Compare
Disability Age 5 to 17
Native Hawaiian Disability Age 5 to 17
5.2%
DISABILITY | AGE 5 TO 17
99.6/ 100
METRIC RATING
81st/ 347
METRIC RANK
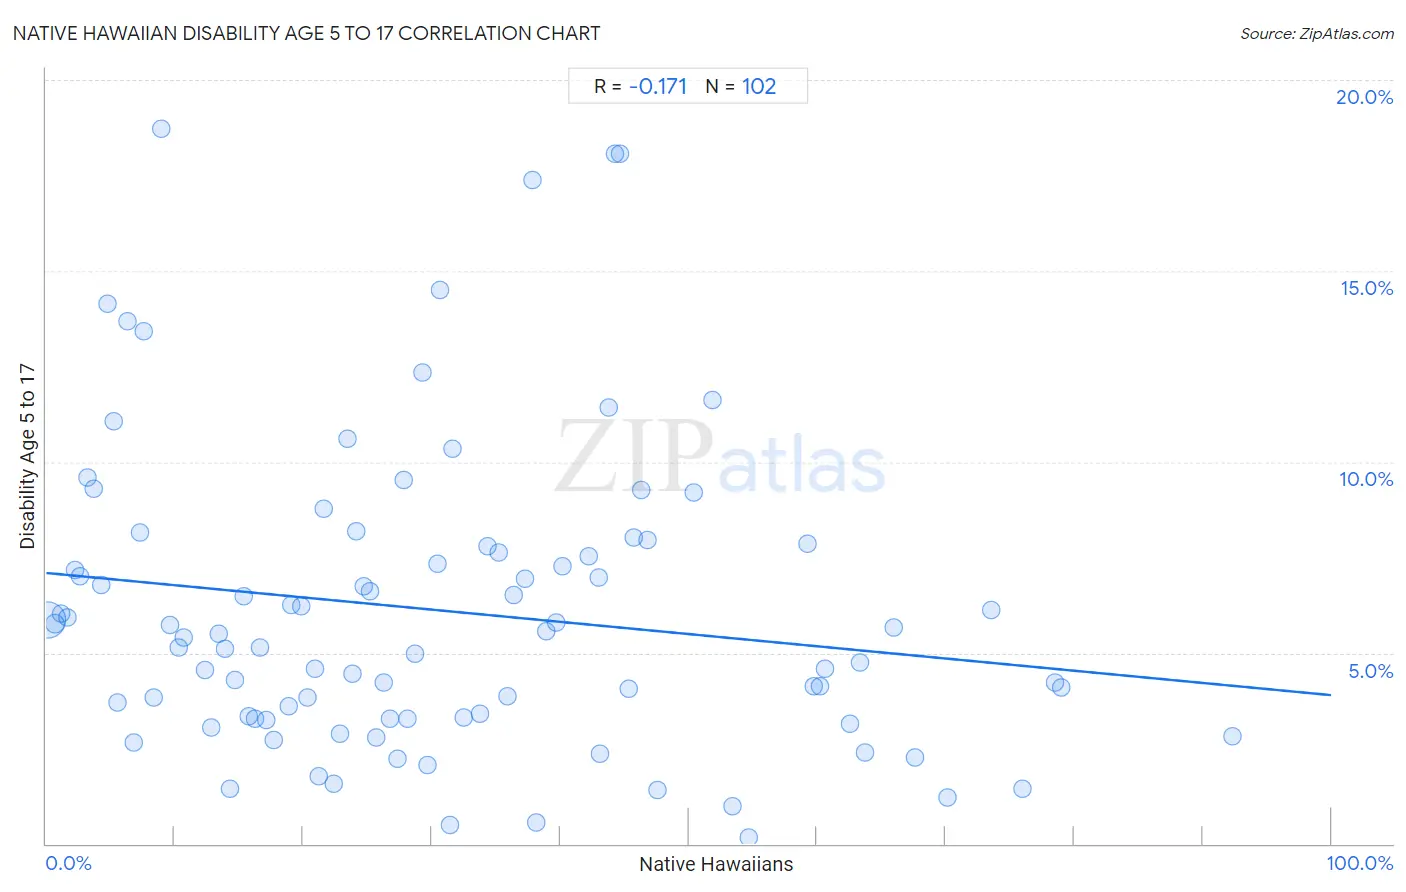
Native Hawaiian Disability Age 5 to 17 Correlation Chart
The statistical analysis conducted on geographies consisting of 329,860,359 people shows a poor negative correlation between the proportion of Native Hawaiians and percentage of population with a disability between the ages 5 and 17 in the United States with a correlation coefficient (R) of -0.171 and weighted average of 5.2%. On average, for every 1% (one percent) increase in Native Hawaiians within a typical geography, there is a decrease of 0.032% in percentage of population with a disability between the ages 5 and 17.
It is essential to understand that the correlation between the percentage of Native Hawaiians and percentage of population with a disability between the ages 5 and 17 does not imply a direct cause-and-effect relationship. It remains uncertain whether the presence of Native Hawaiians influences an upward or downward trend in the level of percentage of population with a disability between the ages 5 and 17 within an area, or if Native Hawaiians simply ended up residing in those areas with higher or lower levels of percentage of population with a disability between the ages 5 and 17 due to other factors.
Demographics Similar to Native Hawaiians by Disability Age 5 to 17
In terms of disability age 5 to 17, the demographic groups most similar to Native Hawaiians are Sri Lankan (5.2%, a difference of 0.040%), Afghan (5.2%, a difference of 0.070%), Immigrants from Cuba (5.2%, a difference of 0.10%), Immigrants from Kazakhstan (5.2%, a difference of 0.11%), and Immigrants from Sweden (5.2%, a difference of 0.11%).
| Demographics | Rating | Rank | Disability Age 5 to 17 |
| Immigrants from Romania | 99.7 /100 | #74 | Exceptional 5.2% |
| Immigrants from Moldova | 99.6 /100 | #75 | Exceptional 5.2% |
| Immigrants from Guyana | 99.6 /100 | #76 | Exceptional 5.2% |
| Immigrants from Kazakhstan | 99.6 /100 | #77 | Exceptional 5.2% |
| Immigrants from Cuba | 99.6 /100 | #78 | Exceptional 5.2% |
| Afghans | 99.6 /100 | #79 | Exceptional 5.2% |
| Sri Lankans | 99.6 /100 | #80 | Exceptional 5.2% |
| Native Hawaiians | 99.6 /100 | #81 | Exceptional 5.2% |
| Immigrants from Sweden | 99.5 /100 | #82 | Exceptional 5.2% |
| Immigrants from France | 99.5 /100 | #83 | Exceptional 5.2% |
| Immigrants from Nicaragua | 99.5 /100 | #84 | Exceptional 5.2% |
| Bulgarians | 99.4 /100 | #85 | Exceptional 5.2% |
| Immigrants from St. Vincent and the Grenadines | 99.4 /100 | #86 | Exceptional 5.2% |
| Eastern Europeans | 99.4 /100 | #87 | Exceptional 5.2% |
| Immigrants from Croatia | 99.4 /100 | #88 | Exceptional 5.2% |
Native Hawaiian Disability Age 5 to 17 Correlation Summary
| Measurement | Native Hawaiian Data | Disability Age 5 to 17 Data |
| Minimum | 0.13% | 0.15% |
| Maximum | 92.3% | 18.7% |
| Range | 92.1% | 18.6% |
| Mean | 30.9% | 6.1% |
| Median | 27.6% | 5.4% |
| Interquartile 25% (IQ1) | 14.3% | 3.3% |
| Interquartile 75% (IQ3) | 44.3% | 7.8% |
| Interquartile Range (IQR) | 29.9% | 4.5% |
| Standard Deviation (Sample) | 21.3% | 4.0% |
| Standard Deviation (Population) | 21.1% | 4.0% |
Correlation Details
| Native Hawaiian Percentile | Sample Size | Disability Age 5 to 17 |
[ 0.0% - 0.5% ] 0.13% | 298,809,684 | 5.9% |
[ 0.5% - 1.0% ] 0.68% | 21,778,524 | 5.8% |
[ 1.0% - 1.5% ] 1.17% | 4,293,965 | 6.0% |
[ 1.5% - 2.0% ] 1.66% | 1,402,680 | 5.9% |
[ 2.0% - 2.5% ] 2.20% | 512,392 | 7.2% |
[ 2.5% - 3.0% ] 2.65% | 146,766 | 7.0% |
[ 3.0% - 3.5% ] 3.21% | 45,963 | 9.6% |
[ 3.5% - 4.0% ] 3.70% | 29,337 | 9.3% |
[ 4.0% - 4.5% ] 4.27% | 34,836 | 6.8% |
[ 4.5% - 5.0% ] 4.74% | 42,887 | 14.2% |
[ 5.0% - 5.5% ] 5.21% | 21,869 | 11.1% |
[ 5.5% - 6.0% ] 5.58% | 9,775 | 3.7% |
[ 6.0% - 6.5% ] 6.37% | 5,153 | 13.7% |
[ 6.5% - 7.0% ] 6.84% | 30,233 | 2.6% |
[ 7.0% - 7.5% ] 7.26% | 936 | 8.2% |
[ 7.5% - 8.0% ] 7.63% | 5,242 | 13.4% |
[ 8.0% - 8.5% ] 8.35% | 65,618 | 3.8% |
[ 8.5% - 9.0% ] 8.92% | 6,167 | 18.7% |
[ 9.5% - 10.0% ] 9.61% | 31,450 | 5.7% |
[ 10.0% - 10.5% ] 10.29% | 16,906 | 5.1% |
[ 10.5% - 11.0% ] 10.70% | 13,064 | 5.4% |
[ 12.0% - 12.5% ] 12.39% | 463,526 | 4.5% |
[ 12.5% - 13.0% ] 12.81% | 50,793 | 3.0% |
[ 13.0% - 13.5% ] 13.39% | 102,117 | 5.5% |
[ 13.5% - 14.0% ] 13.86% | 101,514 | 5.1% |
[ 14.0% - 14.5% ] 14.35% | 103,149 | 1.4% |
[ 14.5% - 15.0% ] 14.67% | 127,370 | 4.3% |
[ 15.0% - 15.5% ] 15.42% | 6,525 | 6.5% |
[ 15.5% - 16.0% ] 15.77% | 28,343 | 3.3% |
[ 16.0% - 16.5% ] 16.25% | 163,455 | 3.3% |
[ 16.5% - 17.0% ] 16.62% | 28,537 | 5.1% |
[ 17.0% - 17.5% ] 17.14% | 50,956 | 3.2% |
[ 17.5% - 18.0% ] 17.74% | 58,669 | 2.7% |
[ 18.5% - 19.0% ] 18.85% | 117,714 | 3.6% |
[ 19.0% - 19.5% ] 19.11% | 71,880 | 6.3% |
[ 19.5% - 20.0% ] 19.85% | 34,616 | 6.2% |
[ 20.0% - 20.5% ] 20.36% | 90,923 | 3.8% |
[ 20.5% - 21.0% ] 20.87% | 28,485 | 4.6% |
[ 21.0% - 21.5% ] 21.22% | 21,055 | 1.8% |
[ 21.5% - 22.0% ] 21.64% | 15,015 | 8.8% |
[ 22.0% - 22.5% ] 22.35% | 13,335 | 1.6% |
[ 22.5% - 23.0% ] 22.88% | 38,825 | 2.9% |
[ 23.0% - 23.5% ] 23.43% | 3,073 | 10.6% |
[ 23.5% - 24.0% ] 23.83% | 54,915 | 4.5% |
[ 24.0% - 24.5% ] 24.16% | 6,892 | 8.2% |
[ 24.5% - 25.0% ] 24.68% | 36,062 | 6.7% |
[ 25.0% - 25.5% ] 25.19% | 2,211 | 6.6% |
[ 25.5% - 26.0% ] 25.72% | 13,666 | 2.8% |
[ 26.0% - 26.5% ] 26.30% | 2,255 | 4.2% |
[ 26.5% - 27.0% ] 26.78% | 26,147 | 3.3% |
[ 27.0% - 27.5% ] 27.33% | 62,578 | 2.2% |
[ 27.5% - 28.0% ] 27.81% | 8,950 | 9.5% |
[ 28.0% - 28.5% ] 28.13% | 49,623 | 3.3% |
[ 28.5% - 29.0% ] 28.71% | 30,869 | 5.0% |
[ 29.0% - 29.5% ] 29.33% | 6,850 | 12.3% |
[ 29.5% - 30.0% ] 29.68% | 64,496 | 2.1% |
[ 30.0% - 30.5% ] 30.47% | 1,290 | 7.3% |
[ 30.5% - 31.0% ] 30.60% | 2,716 | 14.5% |
[ 31.0% - 31.5% ] 31.44% | 4,628 | 0.51% |
[ 31.5% - 32.0% ] 31.62% | 7,704 | 10.3% |
[ 32.5% - 33.0% ] 32.52% | 3,484 | 3.3% |
[ 33.5% - 34.0% ] 33.75% | 51,896 | 3.4% |
[ 34.0% - 34.5% ] 34.38% | 2,830 | 7.8% |
[ 35.0% - 35.5% ] 35.26% | 27,351 | 7.6% |
[ 35.5% - 36.0% ] 35.91% | 22,701 | 3.9% |
[ 36.0% - 36.5% ] 36.36% | 1,463 | 6.5% |
[ 37.0% - 37.5% ] 37.28% | 5,638 | 6.9% |
[ 37.5% - 38.0% ] 37.82% | 1,666 | 17.4% |
[ 38.0% - 38.5% ] 38.16% | 9,177 | 0.55% |
[ 38.5% - 39.0% ] 38.95% | 50,453 | 5.6% |
[ 39.5% - 40.0% ] 39.66% | 49,256 | 5.8% |
[ 40.0% - 40.5% ] 40.13% | 1,834 | 7.3% |
[ 42.0% - 42.5% ] 42.22% | 15,863 | 7.5% |
[ 42.5% - 43.0% ] 42.99% | 4,555 | 7.0% |
[ 43.0% - 43.5% ] 43.05% | 11,029 | 2.4% |
[ 43.5% - 44.0% ] 43.77% | 4,135 | 11.4% |
[ 44.0% - 44.5% ] 44.27% | 3,587 | 18.1% |
[ 44.5% - 45.0% ] 44.66% | 3,556 | 18.1% |
[ 45.0% - 45.5% ] 45.29% | 10,042 | 4.0% |
[ 45.5% - 46.0% ] 45.76% | 17,696 | 8.0% |
[ 46.0% - 46.5% ] 46.26% | 1,096 | 9.3% |
[ 46.5% - 47.0% ] 46.76% | 3,593 | 7.9% |
[ 47.5% - 48.0% ] 47.53% | 5,026 | 1.4% |
[ 50.0% - 50.5% ] 50.39% | 3,832 | 9.2% |
[ 51.5% - 52.0% ] 51.81% | 4,366 | 11.6% |
[ 53.0% - 53.5% ] 53.45% | 3,686 | 0.97% |
[ 54.5% - 55.0% ] 54.72% | 3,149 | 0.15% |
[ 59.0% - 59.5% ] 59.23% | 130 | 7.8% |
[ 59.5% - 60.0% ] 59.72% | 17,857 | 4.1% |
[ 60.0% - 60.5% ] 60.21% | 480 | 4.1% |
[ 60.5% - 61.0% ] 60.59% | 51,367 | 4.6% |
[ 62.5% - 63.0% ] 62.57% | 2,872 | 3.1% |
[ 63.0% - 63.5% ] 63.35% | 4,827 | 4.8% |
[ 63.5% - 64.0% ] 63.68% | 14,129 | 2.4% |
[ 65.5% - 66.0% ] 65.97% | 3,553 | 5.7% |
[ 67.5% - 68.0% ] 67.63% | 10,307 | 2.2% |
[ 70.0% - 70.5% ] 70.09% | 3,133 | 1.2% |
[ 73.5% - 74.0% ] 73.53% | 12,370 | 6.1% |
[ 75.5% - 76.0% ] 75.96% | 2,853 | 1.4% |
[ 78.0% - 78.5% ] 78.49% | 2,436 | 4.2% |
[ 78.5% - 79.0% ] 78.97% | 4,475 | 4.1% |
[ 92.0% - 92.5% ] 92.27% | 1,436 | 2.8% |