Native Hawaiian College, Under 1 year
COMPARE
Native Hawaiian
Select to Compare
College, Under 1 year
Native Hawaiian College, Under 1 year
63.9%
COLLEGE, UNDER 1 YEAR
10.6/ 100
METRIC RATING
211th/ 347
METRIC RANK
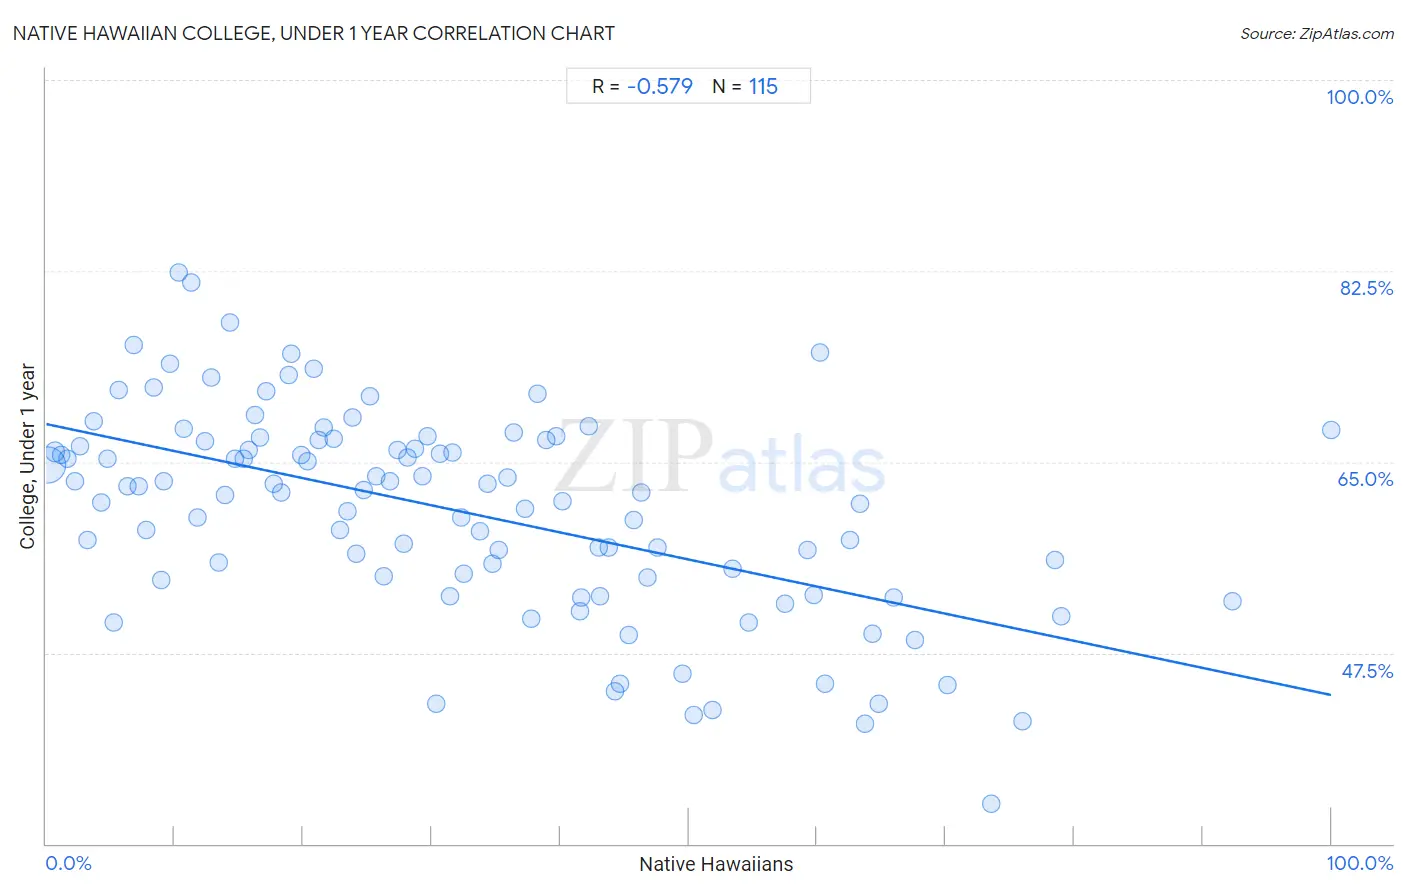
Native Hawaiian College, Under 1 year Correlation Chart
The statistical analysis conducted on geographies consisting of 332,118,930 people shows a substantial negative correlation between the proportion of Native Hawaiians and percentage of population with at least college, under 1 year education in the United States with a correlation coefficient (R) of -0.579 and weighted average of 63.9%. On average, for every 1% (one percent) increase in Native Hawaiians within a typical geography, there is a decrease of 0.25% in percentage of population with at least college, under 1 year education.
It is essential to understand that the correlation between the percentage of Native Hawaiians and percentage of population with at least college, under 1 year education does not imply a direct cause-and-effect relationship. It remains uncertain whether the presence of Native Hawaiians influences an upward or downward trend in the level of percentage of population with at least college, under 1 year education within an area, or if Native Hawaiians simply ended up residing in those areas with higher or lower levels of percentage of population with at least college, under 1 year education due to other factors.
Demographics Similar to Native Hawaiians by College, Under 1 year
In terms of college, under 1 year, the demographic groups most similar to Native Hawaiians are Immigrants from Middle Africa (63.9%, a difference of 0.010%), Ghanaian (63.9%, a difference of 0.070%), Puget Sound Salish (63.9%, a difference of 0.080%), Immigrants from Vietnam (64.0%, a difference of 0.17%), and Immigrants from South America (63.8%, a difference of 0.19%).
| Demographics | Rating | Rank | College, Under 1 year |
| Immigrants from Zaire | 14.6 /100 | #204 | Poor 64.1% |
| Peruvians | 13.7 /100 | #205 | Poor 64.1% |
| Whites/Caucasians | 12.8 /100 | #206 | Poor 64.0% |
| Colombians | 12.4 /100 | #207 | Poor 64.0% |
| Immigrants from Vietnam | 12.1 /100 | #208 | Poor 64.0% |
| Puget Sound Salish | 11.3 /100 | #209 | Poor 63.9% |
| Ghanaians | 11.2 /100 | #210 | Poor 63.9% |
| Native Hawaiians | 10.6 /100 | #211 | Poor 63.9% |
| Immigrants from Middle Africa | 10.5 /100 | #212 | Poor 63.9% |
| Immigrants from South America | 9.1 /100 | #213 | Tragic 63.8% |
| Immigrants from Nigeria | 8.8 /100 | #214 | Tragic 63.7% |
| Senegalese | 7.7 /100 | #215 | Tragic 63.6% |
| Hmong | 6.8 /100 | #216 | Tragic 63.5% |
| Immigrants from Uruguay | 5.8 /100 | #217 | Tragic 63.4% |
| Immigrants from Panama | 5.7 /100 | #218 | Tragic 63.4% |
Native Hawaiian College, Under 1 year Correlation Summary
| Measurement | Native Hawaiian Data | College, Under 1 year Data |
| Minimum | 0.13% | 33.7% |
| Maximum | 100.0% | 82.3% |
| Range | 99.9% | 48.7% |
| Mean | 32.1% | 60.5% |
| Median | 28.7% | 62.2% |
| Interquartile 25% (IQ1) | 14.3% | 54.4% |
| Interquartile 75% (IQ3) | 45.3% | 67.0% |
| Interquartile Range (IQR) | 30.9% | 12.6% |
| Standard Deviation (Sample) | 22.0% | 9.4% |
| Standard Deviation (Population) | 21.9% | 9.4% |
Correlation Details
| Native Hawaiian Percentile | Sample Size | College, Under 1 year |
[ 0.0% - 0.5% ] 0.13% | 300,354,323 | 64.7% |
[ 0.5% - 1.0% ] 0.69% | 22,097,223 | 65.9% |
[ 1.0% - 1.5% ] 1.17% | 4,436,943 | 65.7% |
[ 1.5% - 2.0% ] 1.66% | 1,445,012 | 65.3% |
[ 2.0% - 2.5% ] 2.21% | 553,014 | 63.2% |
[ 2.5% - 3.0% ] 2.65% | 156,572 | 66.4% |
[ 3.0% - 3.5% ] 3.20% | 66,935 | 57.8% |
[ 3.5% - 4.0% ] 3.70% | 39,235 | 68.8% |
[ 4.0% - 4.5% ] 4.25% | 49,876 | 61.3% |
[ 4.5% - 5.0% ] 4.72% | 49,511 | 65.3% |
[ 5.0% - 5.5% ] 5.21% | 27,265 | 50.2% |
[ 5.5% - 6.0% ] 5.61% | 12,148 | 71.6% |
[ 6.0% - 6.5% ] 6.32% | 7,377 | 62.8% |
[ 6.5% - 7.0% ] 6.83% | 31,585 | 75.7% |
[ 7.0% - 7.5% ] 7.18% | 6,084 | 62.7% |
[ 7.5% - 8.0% ] 7.81% | 12,829 | 58.7% |
[ 8.0% - 8.5% ] 8.34% | 67,378 | 71.8% |
[ 8.5% - 9.0% ] 8.92% | 6,493 | 54.1% |
[ 9.0% - 9.5% ] 9.19% | 3,669 | 63.3% |
[ 9.5% - 10.0% ] 9.61% | 31,825 | 73.9% |
[ 10.0% - 10.5% ] 10.30% | 17,425 | 82.3% |
[ 10.5% - 11.0% ] 10.71% | 20,442 | 68.0% |
[ 11.0% - 11.5% ] 11.24% | 1,513 | 81.4% |
[ 11.5% - 12.0% ] 11.79% | 1,680 | 59.9% |
[ 12.0% - 12.5% ] 12.39% | 464,382 | 66.9% |
[ 12.5% - 13.0% ] 12.81% | 52,995 | 72.8% |
[ 13.0% - 13.5% ] 13.39% | 102,236 | 55.8% |
[ 13.5% - 14.0% ] 13.86% | 101,564 | 61.9% |
[ 14.0% - 14.5% ] 14.35% | 103,149 | 77.8% |
[ 14.5% - 15.0% ] 14.67% | 128,095 | 65.3% |
[ 15.0% - 15.5% ] 15.41% | 6,591 | 65.3% |
[ 15.5% - 16.0% ] 15.77% | 28,469 | 66.1% |
[ 16.0% - 16.5% ] 16.25% | 163,685 | 69.3% |
[ 16.5% - 17.0% ] 16.62% | 28,537 | 67.3% |
[ 17.0% - 17.5% ] 17.14% | 51,321 | 71.5% |
[ 17.5% - 18.0% ] 17.74% | 58,904 | 63.0% |
[ 18.0% - 18.5% ] 18.33% | 4,996 | 62.1% |
[ 18.5% - 19.0% ] 18.85% | 117,714 | 73.0% |
[ 19.0% - 19.5% ] 19.11% | 71,880 | 74.9% |
[ 19.5% - 20.0% ] 19.85% | 35,154 | 65.7% |
[ 20.0% - 20.5% ] 20.36% | 97,208 | 65.0% |
[ 20.5% - 21.0% ] 20.86% | 28,982 | 73.5% |
[ 21.0% - 21.5% ] 21.22% | 21,055 | 67.0% |
[ 21.5% - 22.0% ] 21.64% | 15,116 | 68.1% |
[ 22.0% - 22.5% ] 22.35% | 13,335 | 67.2% |
[ 22.5% - 23.0% ] 22.88% | 43,434 | 58.7% |
[ 23.0% - 23.5% ] 23.43% | 3,197 | 60.4% |
[ 23.5% - 24.0% ] 23.83% | 54,915 | 69.1% |
[ 24.0% - 24.5% ] 24.16% | 7,050 | 56.6% |
[ 24.5% - 25.0% ] 24.68% | 36,062 | 62.4% |
[ 25.0% - 25.5% ] 25.22% | 2,788 | 71.0% |
[ 25.5% - 26.0% ] 25.72% | 13,666 | 63.7% |
[ 26.0% - 26.5% ] 26.30% | 2,255 | 54.5% |
[ 26.5% - 27.0% ] 26.78% | 26,147 | 63.2% |
[ 27.0% - 27.5% ] 27.32% | 63,950 | 66.1% |
[ 27.5% - 28.0% ] 27.81% | 9,568 | 57.5% |
[ 28.0% - 28.5% ] 28.13% | 49,623 | 65.5% |
[ 28.5% - 29.0% ] 28.68% | 38,553 | 66.2% |
[ 29.0% - 29.5% ] 29.29% | 7,767 | 63.7% |
[ 29.5% - 30.0% ] 29.68% | 66,780 | 67.4% |
[ 30.0% - 30.5% ] 30.35% | 3,532 | 42.8% |
[ 30.5% - 31.0% ] 30.64% | 3,691 | 65.8% |
[ 31.0% - 31.5% ] 31.44% | 4,628 | 52.7% |
[ 31.5% - 32.0% ] 31.62% | 7,704 | 65.9% |
[ 32.0% - 32.5% ] 32.34% | 3,145 | 59.9% |
[ 32.5% - 33.0% ] 32.52% | 3,484 | 54.8% |
[ 33.5% - 34.0% ] 33.76% | 55,269 | 58.6% |
[ 34.0% - 34.5% ] 34.33% | 6,216 | 62.9% |
[ 34.5% - 35.0% ] 34.69% | 1,897 | 55.6% |
[ 35.0% - 35.5% ] 35.26% | 27,351 | 56.9% |
[ 35.5% - 36.0% ] 35.92% | 27,766 | 63.6% |
[ 36.0% - 36.5% ] 36.35% | 2,421 | 67.7% |
[ 37.0% - 37.5% ] 37.28% | 5,638 | 60.7% |
[ 37.5% - 38.0% ] 37.79% | 2,625 | 50.6% |
[ 38.0% - 38.5% ] 38.18% | 11,149 | 71.2% |
[ 38.5% - 39.0% ] 38.95% | 50,453 | 67.0% |
[ 39.5% - 40.0% ] 39.66% | 49,256 | 67.4% |
[ 40.0% - 40.5% ] 40.13% | 1,834 | 61.4% |
[ 41.0% - 41.5% ] 41.50% | 547 | 51.3% |
[ 41.5% - 42.0% ] 41.66% | 1,781 | 52.5% |
[ 42.0% - 42.5% ] 42.22% | 15,863 | 68.2% |
[ 42.5% - 43.0% ] 42.99% | 4,555 | 57.1% |
[ 43.0% - 43.5% ] 43.05% | 11,029 | 52.7% |
[ 43.5% - 44.0% ] 43.78% | 4,429 | 57.1% |
[ 44.0% - 44.5% ] 44.27% | 3,587 | 44.0% |
[ 44.5% - 45.0% ] 44.65% | 4,065 | 44.7% |
[ 45.0% - 45.5% ] 45.29% | 10,042 | 49.1% |
[ 45.5% - 46.0% ] 45.76% | 17,696 | 59.7% |
[ 46.0% - 46.5% ] 46.26% | 1,096 | 62.2% |
[ 46.5% - 47.0% ] 46.76% | 3,593 | 54.4% |
[ 47.5% - 48.0% ] 47.53% | 5,026 | 57.2% |
[ 49.5% - 50.0% ] 49.55% | 890 | 45.5% |
[ 50.0% - 50.5% ] 50.39% | 3,832 | 41.8% |
[ 51.5% - 52.0% ] 51.81% | 4,366 | 42.3% |
[ 53.0% - 53.5% ] 53.45% | 3,686 | 55.2% |
[ 54.5% - 55.0% ] 54.72% | 3,149 | 50.2% |
[ 57.0% - 57.5% ] 57.46% | 731 | 52.0% |
[ 59.0% - 59.5% ] 59.23% | 130 | 57.0% |
[ 59.5% - 60.0% ] 59.72% | 17,857 | 52.8% |
[ 60.0% - 60.5% ] 60.21% | 480 | 75.1% |
[ 60.5% - 61.0% ] 60.59% | 51,367 | 44.7% |
[ 62.5% - 63.0% ] 62.57% | 2,872 | 57.9% |
[ 63.0% - 63.5% ] 63.35% | 4,827 | 61.2% |
[ 63.5% - 64.0% ] 63.68% | 14,129 | 41.0% |
[ 64.0% - 64.5% ] 64.30% | 902 | 49.3% |
[ 64.5% - 65.0% ] 64.76% | 210 | 42.9% |
[ 65.5% - 66.0% ] 65.97% | 3,591 | 52.6% |
[ 67.5% - 68.0% ] 67.63% | 10,307 | 48.6% |
[ 70.0% - 70.5% ] 70.09% | 3,133 | 44.5% |
[ 73.5% - 74.0% ] 73.53% | 12,370 | 33.7% |
[ 75.5% - 76.0% ] 75.96% | 2,853 | 41.2% |
[ 78.0% - 78.5% ] 78.49% | 2,436 | 56.0% |
[ 78.5% - 79.0% ] 78.97% | 4,475 | 50.8% |
[ 92.0% - 92.5% ] 92.27% | 1,436 | 52.2% |
[ 99.5% - 100.0% ] 100.00% | 53 | 67.9% |