Native Hawaiian 4 or more Vehicles in Household
COMPARE
Native Hawaiian
Select to Compare
4 or more Vehicles in Household
Native Hawaiian 4 or more Vehicles in Household
9.4%
4+ VEHICLES AVAILABLE
100.0/ 100
METRIC RATING
7th/ 347
METRIC RANK
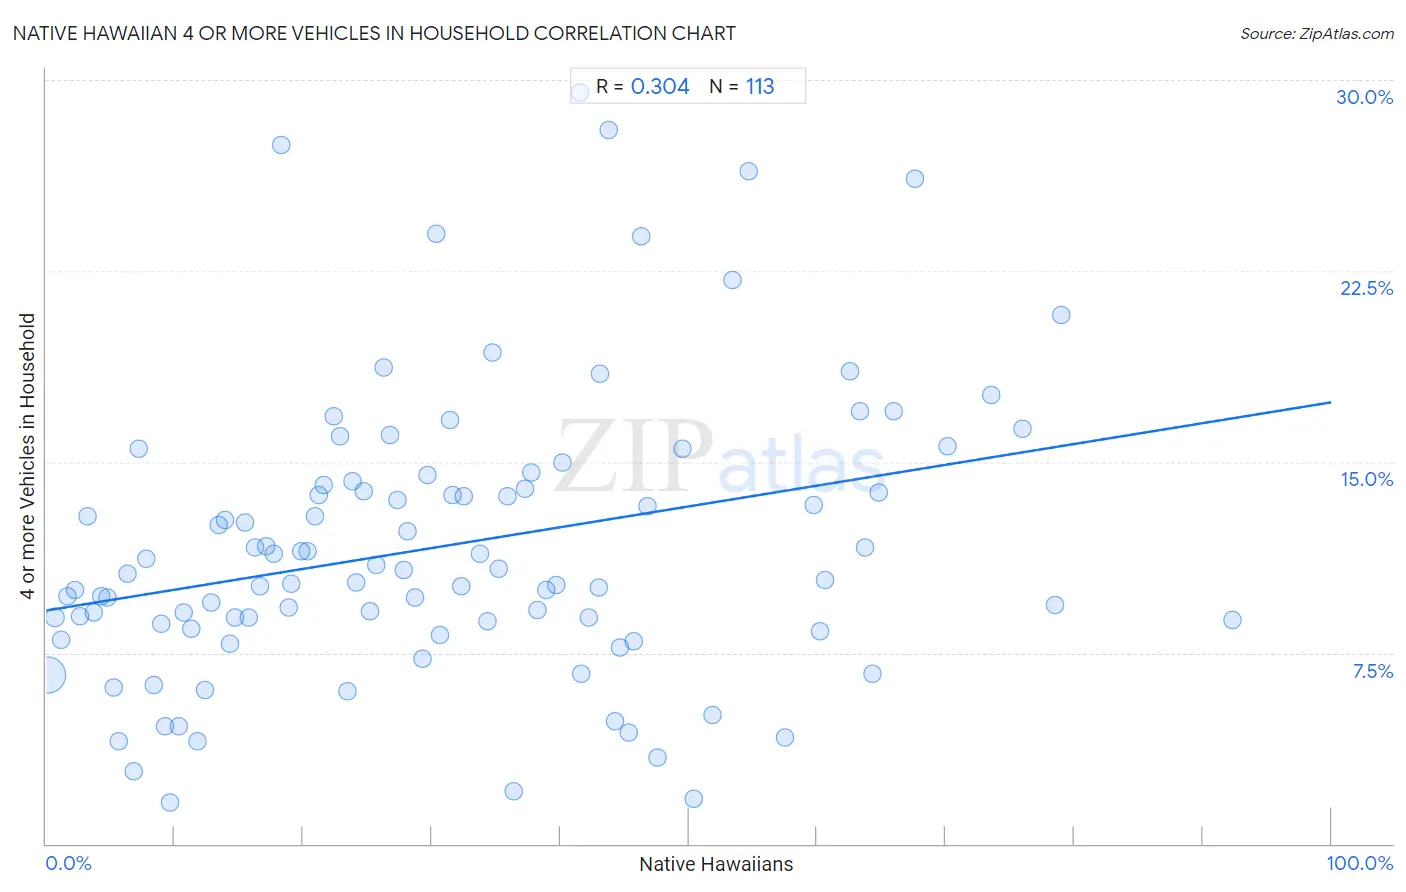
Native Hawaiian 4 or more Vehicles in Household Correlation Chart
The statistical analysis conducted on geographies consisting of 330,999,205 people shows a mild positive correlation between the proportion of Native Hawaiians and percentage of households with 4 or more vehicles available in the United States with a correlation coefficient (R) of 0.304 and weighted average of 9.4%. On average, for every 1% (one percent) increase in Native Hawaiians within a typical geography, there is an increase of 0.082% in percentage of households with 4 or more vehicles available.
It is essential to understand that the correlation between the percentage of Native Hawaiians and percentage of households with 4 or more vehicles available does not imply a direct cause-and-effect relationship. It remains uncertain whether the presence of Native Hawaiians influences an upward or downward trend in the level of percentage of households with 4 or more vehicles available within an area, or if Native Hawaiians simply ended up residing in those areas with higher or lower levels of percentage of households with 4 or more vehicles available due to other factors.
Demographics Similar to Native Hawaiians by 4 or more Vehicles in Household
In terms of 4 or more vehicles in household, the demographic groups most similar to Native Hawaiians are Puget Sound Salish (9.4%, a difference of 0.020%), Arapaho (9.4%, a difference of 0.39%), Samoan (9.2%, a difference of 1.8%), Immigrants from Fiji (9.6%, a difference of 2.6%), and Paiute (9.0%, a difference of 4.2%).
| Demographics | Rating | Rank | 4 or more Vehicles in Household |
| Yakama | 100 /100 | #1 | Exceptional 12.9% |
| Colville | 100.0 /100 | #2 | Exceptional 11.1% |
| Spanish American Indians | 100.0 /100 | #3 | Exceptional 10.8% |
| Tongans | 100.0 /100 | #4 | Exceptional 10.0% |
| Immigrants from Fiji | 100.0 /100 | #5 | Exceptional 9.6% |
| Puget Sound Salish | 100.0 /100 | #6 | Exceptional 9.4% |
| Native Hawaiians | 100.0 /100 | #7 | Exceptional 9.4% |
| Arapaho | 100.0 /100 | #8 | Exceptional 9.4% |
| Samoans | 100.0 /100 | #9 | Exceptional 9.2% |
| Paiute | 100.0 /100 | #10 | Exceptional 9.0% |
| Immigrants from Mexico | 100.0 /100 | #11 | Exceptional 9.0% |
| Mexicans | 100.0 /100 | #12 | Exceptional 8.9% |
| Hawaiians | 100.0 /100 | #13 | Exceptional 8.9% |
| Chinese | 100.0 /100 | #14 | Exceptional 8.8% |
| Shoshone | 100.0 /100 | #15 | Exceptional 8.8% |
Native Hawaiian 4 or more Vehicles in Household Correlation Summary
| Measurement | Native Hawaiian Data | 4 or more Vehicles in Household Data |
| Minimum | 0.13% | 1.6% |
| Maximum | 92.3% | 29.5% |
| Range | 92.1% | 27.9% |
| Mean | 31.2% | 11.7% |
| Median | 28.1% | 10.6% |
| Interquartile 25% (IQ1) | 14.1% | 8.5% |
| Interquartile 75% (IQ3) | 44.5% | 14.2% |
| Interquartile Range (IQR) | 30.4% | 5.6% |
| Standard Deviation (Sample) | 21.1% | 5.7% |
| Standard Deviation (Population) | 21.0% | 5.6% |
Correlation Details
| Native Hawaiian Percentile | Sample Size | 4 or more Vehicles in Household |
[ 0.0% - 0.5% ] 0.13% | 299,504,546 | 6.7% |
[ 0.5% - 1.0% ] 0.69% | 21,927,203 | 8.9% |
[ 1.0% - 1.5% ] 1.17% | 4,386,265 | 8.0% |
[ 1.5% - 2.0% ] 1.66% | 1,422,770 | 9.7% |
[ 2.0% - 2.5% ] 2.21% | 547,044 | 10.0% |
[ 2.5% - 3.0% ] 2.65% | 155,599 | 9.0% |
[ 3.0% - 3.5% ] 3.20% | 64,470 | 12.8% |
[ 3.5% - 4.0% ] 3.70% | 38,602 | 9.1% |
[ 4.0% - 4.5% ] 4.27% | 45,150 | 9.7% |
[ 4.5% - 5.0% ] 4.72% | 49,511 | 9.7% |
[ 5.0% - 5.5% ] 5.21% | 23,245 | 6.1% |
[ 5.5% - 6.0% ] 5.61% | 11,989 | 4.0% |
[ 6.0% - 6.5% ] 6.32% | 7,377 | 10.6% |
[ 6.5% - 7.0% ] 6.83% | 30,855 | 2.8% |
[ 7.0% - 7.5% ] 7.18% | 6,084 | 15.5% |
[ 7.5% - 8.0% ] 7.81% | 12,829 | 11.2% |
[ 8.0% - 8.5% ] 8.34% | 66,750 | 6.2% |
[ 8.5% - 9.0% ] 8.92% | 6,493 | 8.6% |
[ 9.0% - 9.5% ] 9.21% | 2,573 | 4.6% |
[ 9.5% - 10.0% ] 9.61% | 31,825 | 1.6% |
[ 10.0% - 10.5% ] 10.29% | 17,282 | 4.6% |
[ 10.5% - 11.0% ] 10.71% | 20,442 | 9.1% |
[ 11.0% - 11.5% ] 11.30% | 1,018 | 8.4% |
[ 11.5% - 12.0% ] 11.79% | 1,680 | 4.0% |
[ 12.0% - 12.5% ] 12.39% | 463,526 | 6.1% |
[ 12.5% - 13.0% ] 12.81% | 52,995 | 9.5% |
[ 13.0% - 13.5% ] 13.39% | 102,236 | 12.5% |
[ 13.5% - 14.0% ] 13.86% | 101,514 | 12.7% |
[ 14.0% - 14.5% ] 14.35% | 103,149 | 7.8% |
[ 14.5% - 15.0% ] 14.67% | 128,020 | 8.9% |
[ 15.0% - 15.5% ] 15.42% | 6,485 | 12.6% |
[ 15.5% - 16.0% ] 15.77% | 28,431 | 8.9% |
[ 16.0% - 16.5% ] 16.25% | 163,455 | 11.6% |
[ 16.5% - 17.0% ] 16.62% | 28,537 | 10.1% |
[ 17.0% - 17.5% ] 17.14% | 50,956 | 11.7% |
[ 17.5% - 18.0% ] 17.74% | 58,904 | 11.4% |
[ 18.0% - 18.5% ] 18.31% | 4,184 | 27.5% |
[ 18.5% - 19.0% ] 18.85% | 117,714 | 9.3% |
[ 19.0% - 19.5% ] 19.11% | 71,880 | 10.2% |
[ 19.5% - 20.0% ] 19.85% | 35,154 | 11.5% |
[ 20.0% - 20.5% ] 20.36% | 97,208 | 11.5% |
[ 20.5% - 21.0% ] 20.87% | 28,826 | 12.9% |
[ 21.0% - 21.5% ] 21.22% | 21,055 | 13.7% |
[ 21.5% - 22.0% ] 21.64% | 15,116 | 14.1% |
[ 22.0% - 22.5% ] 22.35% | 13,335 | 16.8% |
[ 22.5% - 23.0% ] 22.88% | 43,342 | 16.0% |
[ 23.0% - 23.5% ] 23.43% | 3,197 | 6.0% |
[ 23.5% - 24.0% ] 23.83% | 54,915 | 14.2% |
[ 24.0% - 24.5% ] 24.16% | 7,050 | 10.3% |
[ 24.5% - 25.0% ] 24.68% | 36,062 | 13.8% |
[ 25.0% - 25.5% ] 25.19% | 2,211 | 9.1% |
[ 25.5% - 26.0% ] 25.72% | 13,666 | 11.0% |
[ 26.0% - 26.5% ] 26.30% | 2,255 | 18.7% |
[ 26.5% - 27.0% ] 26.78% | 26,147 | 16.0% |
[ 27.0% - 27.5% ] 27.32% | 63,950 | 13.5% |
[ 27.5% - 28.0% ] 27.81% | 9,568 | 10.8% |
[ 28.0% - 28.5% ] 28.13% | 49,623 | 12.3% |
[ 28.5% - 29.0% ] 28.68% | 38,553 | 9.7% |
[ 29.0% - 29.5% ] 29.29% | 7,767 | 7.3% |
[ 29.5% - 30.0% ] 29.68% | 66,780 | 14.5% |
[ 30.0% - 30.5% ] 30.35% | 3,532 | 24.0% |
[ 30.5% - 31.0% ] 30.63% | 3,542 | 8.2% |
[ 31.0% - 31.5% ] 31.44% | 4,628 | 16.7% |
[ 31.5% - 32.0% ] 31.62% | 7,704 | 13.7% |
[ 32.0% - 32.5% ] 32.33% | 2,966 | 10.1% |
[ 32.5% - 33.0% ] 32.52% | 3,484 | 13.6% |
[ 33.5% - 34.0% ] 33.76% | 55,163 | 11.4% |
[ 34.0% - 34.5% ] 34.33% | 6,216 | 8.7% |
[ 34.5% - 35.0% ] 34.69% | 1,897 | 19.3% |
[ 35.0% - 35.5% ] 35.26% | 27,351 | 10.8% |
[ 35.5% - 36.0% ] 35.92% | 27,766 | 13.6% |
[ 36.0% - 36.5% ] 36.36% | 1,463 | 2.1% |
[ 37.0% - 37.5% ] 37.28% | 5,638 | 13.9% |
[ 37.5% - 38.0% ] 37.79% | 2,625 | 14.6% |
[ 38.0% - 38.5% ] 38.18% | 11,149 | 9.2% |
[ 38.5% - 39.0% ] 38.95% | 50,453 | 10.0% |
[ 39.5% - 40.0% ] 39.66% | 49,256 | 10.2% |
[ 40.0% - 40.5% ] 40.13% | 1,834 | 15.0% |
[ 41.0% - 41.5% ] 41.50% | 547 | 29.5% |
[ 41.5% - 42.0% ] 41.66% | 1,781 | 6.7% |
[ 42.0% - 42.5% ] 42.22% | 15,863 | 8.9% |
[ 42.5% - 43.0% ] 42.99% | 4,555 | 10.1% |
[ 43.0% - 43.5% ] 43.05% | 11,029 | 18.5% |
[ 43.5% - 44.0% ] 43.78% | 4,429 | 28.0% |
[ 44.0% - 44.5% ] 44.27% | 3,587 | 4.8% |
[ 44.5% - 45.0% ] 44.65% | 4,065 | 7.7% |
[ 45.0% - 45.5% ] 45.29% | 10,042 | 4.4% |
[ 45.5% - 46.0% ] 45.76% | 17,696 | 8.0% |
[ 46.0% - 46.5% ] 46.26% | 1,096 | 23.9% |
[ 46.5% - 47.0% ] 46.76% | 3,593 | 13.3% |
[ 47.5% - 48.0% ] 47.53% | 5,026 | 3.4% |
[ 49.5% - 50.0% ] 49.55% | 890 | 15.5% |
[ 50.0% - 50.5% ] 50.39% | 3,832 | 1.8% |
[ 51.5% - 52.0% ] 51.81% | 4,366 | 5.1% |
[ 53.0% - 53.5% ] 53.45% | 3,686 | 22.1% |
[ 54.5% - 55.0% ] 54.72% | 3,149 | 26.4% |
[ 57.0% - 57.5% ] 57.46% | 731 | 4.2% |
[ 59.5% - 60.0% ] 59.72% | 17,857 | 13.3% |
[ 60.0% - 60.5% ] 60.21% | 480 | 8.3% |
[ 60.5% - 61.0% ] 60.59% | 51,367 | 10.3% |
[ 62.5% - 63.0% ] 62.57% | 2,872 | 18.6% |
[ 63.0% - 63.5% ] 63.35% | 4,827 | 17.0% |
[ 63.5% - 64.0% ] 63.68% | 14,129 | 11.6% |
[ 64.0% - 64.5% ] 64.30% | 902 | 6.7% |
[ 64.5% - 65.0% ] 64.76% | 210 | 13.8% |
[ 65.5% - 66.0% ] 65.97% | 3,553 | 17.0% |
[ 67.5% - 68.0% ] 67.63% | 10,307 | 26.1% |
[ 70.0% - 70.5% ] 70.09% | 3,133 | 15.6% |
[ 73.5% - 74.0% ] 73.53% | 12,370 | 17.6% |
[ 75.5% - 76.0% ] 75.96% | 2,853 | 16.3% |
[ 78.0% - 78.5% ] 78.49% | 2,436 | 9.4% |
[ 78.5% - 79.0% ] 78.97% | 4,475 | 20.8% |
[ 92.0% - 92.5% ] 92.27% | 1,436 | 8.8% |