Immigrants from Scotland Self-Care Disability

COMPARE

Immigrants from Scotland
Race
Ancestry
AfghanAfricanAlaska NativeAlaskan AthabascanAlbanianAleutAlsatianAmericanApacheArabArapahoArgentineanArmenianAssyrian/Chaldean/SyriacAustralianAustrianBahamianBangladeshiBarbadianBasqueBelgianBelizeanBermudanBhutaneseBlackfeetBolivianBrazilianBritishBritish West IndianBulgarianBurmeseCajunCambodianCanadianCape VerdeanCarpatho RusynCelticCentral AmericanCentral American IndianCherokeeCheyenneChickasawChileanChineseChippewaChoctawColombianColvilleComancheCosta RicanCreeCreekCroatianCrowCubanCypriotCzechCzechoslovakianDanishDelawareDominicanDutchDutch West IndianEastern EuropeanEcuadorianEgyptianEnglishEstonianEthiopianEuropeanFijianFilipinoFinnishFrenchFrench American IndianFrench CanadianGermanGerman RussianGhanaianGreekGuamanian/ChamorroGuatemalanGuyaneseHaitianHmongHonduranHopiHoumaHungarianIcelanderIndian (Asian)IndonesianInupiatIranianIraqiIrishIroquoisIsraeliItalianJamaicanJapaneseJordanianKenyanKiowaKoreanLaotianLatvianLebaneseLiberianLithuanianLumbeeLuxembourgerMacedonianMalaysianMalteseMarshalleseMenomineeMexicanMexican American IndianMongolianMoroccanNative HawaiianNavajoNepaleseNew ZealanderNicaraguanNigerianNorthern EuropeanNorwegianOkinawanOsageOttawaPaiutePakistaniPalestinianPanamanianParaguayanPennsylvania GermanPeruvianPimaPolishPortuguesePotawatomiPuebloPuerto RicanPuget Sound SalishRomanianRussianSalvadoranSamoanScandinavianScotch-IrishScottishSeminoleSenegaleseSerbianShoshoneSierra LeoneanSiouxSlavicSlovakSloveneSomaliSouth AfricanSouth AmericanSouth American IndianSoviet UnionSpaniardSpanishSpanish AmericanSpanish American IndianSri LankanSubsaharan AfricanSudaneseSwedishSwissSyrianTaiwaneseThaiTlingit-HaidaTohono O'OdhamTonganTrinidadian and TobagonianTsimshianTurkishU.S. Virgin IslanderUgandanUkrainianUruguayanUteVenezuelanVietnameseWelshWest IndianYakamaYaquiYugoslavianYumanYup'ikZimbabwean
Immigration
NonimmigrantsImmigrantsAfghanistanAfricaAlbaniaArgentinaArmeniaAsiaAustraliaAustriaBahamasBangladeshBarbadosBelarusBelgiumBelizeBoliviaBosnia and HerzegovinaBrazilBulgariaBurma/MyanmarCabo VerdeCambodiaCameroonCanadaCaribbeanCentral AmericaChileChinaColombiaCongoCosta RicaCroatiaCubaCzechoslovakiaDenmarkDominicaDominican RepublicEastern AfricaEastern AsiaEastern EuropeEcuadorEgyptEl SalvadorEnglandEritreaEthiopiaEuropeFijiFranceGermanyGhanaGreeceGrenadaGuatemalaGuyanaHaitiHondurasHong KongHungaryIndiaIndonesiaIranIraqIrelandIsraelItalyJamaicaJapanJordanKazakhstanKenyaKoreaKuwaitLaosLatin AmericaLatviaLebanonLiberiaLithuaniaMalaysiaMexicoMicronesiaMiddle AfricaMoldovaMoroccoNepalNetherlandsNicaraguaNigeriaNorth AmericaNorth MacedoniaNorthern AfricaNorthern EuropeNorwayOceaniaPakistanPanamaPeruPhilippinesPolandPortugalRomaniaRussiaSaudi ArabiaScotlandSenegalSerbiaSierra LeoneSingaporeSomaliaSouth AfricaSouth AmericaSouth Central AsiaSouth Eastern AsiaSouthern EuropeSpainSri LankaSt. Vincent and the GrenadinesSudanSwedenSwitzerlandSyriaTaiwanThailandTrinidad and TobagoTurkeyUgandaUkraineUruguayUzbekistanVenezuelaVietnamWest IndiesWestern AfricaWestern AsiaWestern EuropeYemenZaireZimbabweAzores
Select to Compare
Race
Ancestry
AfghanAfricanAlaska NativeAlaskan AthabascanAlbanianAleutAlsatianAmericanApacheArabArapahoArgentineanArmenianAssyrian/Chaldean/SyriacAustralianAustrianBahamianBangladeshiBarbadianBasqueBelgianBelizeanBermudanBhutaneseBlackfeetBolivianBrazilianBritishBritish West IndianBulgarianBurmeseCajunCambodianCanadianCape VerdeanCarpatho RusynCelticCentral AmericanCentral American IndianCherokeeCheyenneChickasawChileanChineseChippewaChoctawColombianColvilleComancheCosta RicanCreeCreekCroatianCrowCubanCypriotCzechCzechoslovakianDanishDelawareDominicanDutchDutch West IndianEastern EuropeanEcuadorianEgyptianEnglishEstonianEthiopianEuropeanFijianFilipinoFinnishFrenchFrench American IndianFrench CanadianGermanGerman RussianGhanaianGreekGuamanian/ChamorroGuatemalanGuyaneseHaitianHmongHonduranHopiHoumaHungarianIcelanderIndian (Asian)IndonesianInupiatIranianIraqiIrishIroquoisIsraeliItalianJamaicanJapaneseJordanianKenyanKiowaKoreanLaotianLatvianLebaneseLiberianLithuanianLumbeeLuxembourgerMacedonianMalaysianMalteseMarshalleseMenomineeMexicanMexican American IndianMongolianMoroccanNative HawaiianNavajoNepaleseNew ZealanderNicaraguanNigerianNorthern EuropeanNorwegianOkinawanOsageOttawaPaiutePakistaniPalestinianPanamanianParaguayanPennsylvania GermanPeruvianPimaPolishPortuguesePotawatomiPuebloPuerto RicanPuget Sound SalishRomanianRussianSalvadoranSamoanScandinavianScotch-IrishScottishSeminoleSenegaleseSerbianShoshoneSierra LeoneanSiouxSlavicSlovakSloveneSomaliSouth AfricanSouth AmericanSouth American IndianSoviet UnionSpaniardSpanishSpanish AmericanSpanish American IndianSri LankanSubsaharan AfricanSudaneseSwedishSwissSyrianTaiwaneseThaiTlingit-HaidaTohono O'OdhamTonganTrinidadian and TobagonianTsimshianTurkishU.S. Virgin IslanderUgandanUkrainianUruguayanUteVenezuelanVietnameseWelshWest IndianYakamaYaquiYugoslavianYumanYup'ikZimbabwean
Immigration
NonimmigrantsImmigrantsAfghanistanAfricaAlbaniaArgentinaArmeniaAsiaAustraliaAustriaBahamasBangladeshBarbadosBelarusBelgiumBelizeBoliviaBosnia and HerzegovinaBrazilBulgariaBurma/MyanmarCabo VerdeCambodiaCameroonCanadaCaribbeanCentral AmericaChileChinaColombiaCongoCosta RicaCroatiaCubaCzechoslovakiaDenmarkDominicaDominican RepublicEastern AfricaEastern AsiaEastern EuropeEcuadorEgyptEl SalvadorEnglandEritreaEthiopiaEuropeFijiFranceGermanyGhanaGreeceGrenadaGuatemalaGuyanaHaitiHondurasHong KongHungaryIndiaIndonesiaIranIraqIrelandIsraelItalyJamaicaJapanJordanKazakhstanKenyaKoreaKuwaitLaosLatin AmericaLatviaLebanonLiberiaLithuaniaMalaysiaMexicoMicronesiaMiddle AfricaMoldovaMoroccoNepalNetherlandsNicaraguaNigeriaNorth AmericaNorth MacedoniaNorthern AfricaNorthern EuropeNorwayOceaniaPakistanPanamaPeruPhilippinesPolandPortugalRomaniaRussiaSaudi ArabiaSenegalSerbiaSierra LeoneSingaporeSomaliaSouth AfricaSouth AmericaSouth Central AsiaSouth Eastern AsiaSouthern EuropeSpainSri LankaSt. Vincent and the GrenadinesSudanSwedenSwitzerlandSyriaTaiwanThailandTrinidad and TobagoTurkeyUgandaUkraineUruguayUzbekistanVenezuelaVietnamWest IndiesWestern AfricaWestern AsiaWestern EuropeYemenZaireZimbabweAzores
Self-Care Disability
Income
Poverty
Unemployment
Labor Participation
Family Structure
Vehicle Availability
Education Level
Disability

Immigrants from Scotland Self-Care Disability
Exceptional

2.4%
SELF-CARE DISABILITY
95.7/ 100
METRIC RATING
101st/ 347
METRIC RANK

Immigrants from Scotland Self-Care Disability Correlation Chart

The statistical analysis conducted on geographies consisting of 196,308,216 people shows a substantial positive correlation between the proportion of Immigrants from Scotland and percentage of population with self-care disability in the United States with a correlation coefficient (R) of 0.523 and weighted average of 2.4%. On average, for every 1% (one percent) increase in Immigrants from Scotland within a typical geography, there is an increase of 0.82% in percentage of population with self-care disability.
Immigrants from Scotland Self-Care Disability
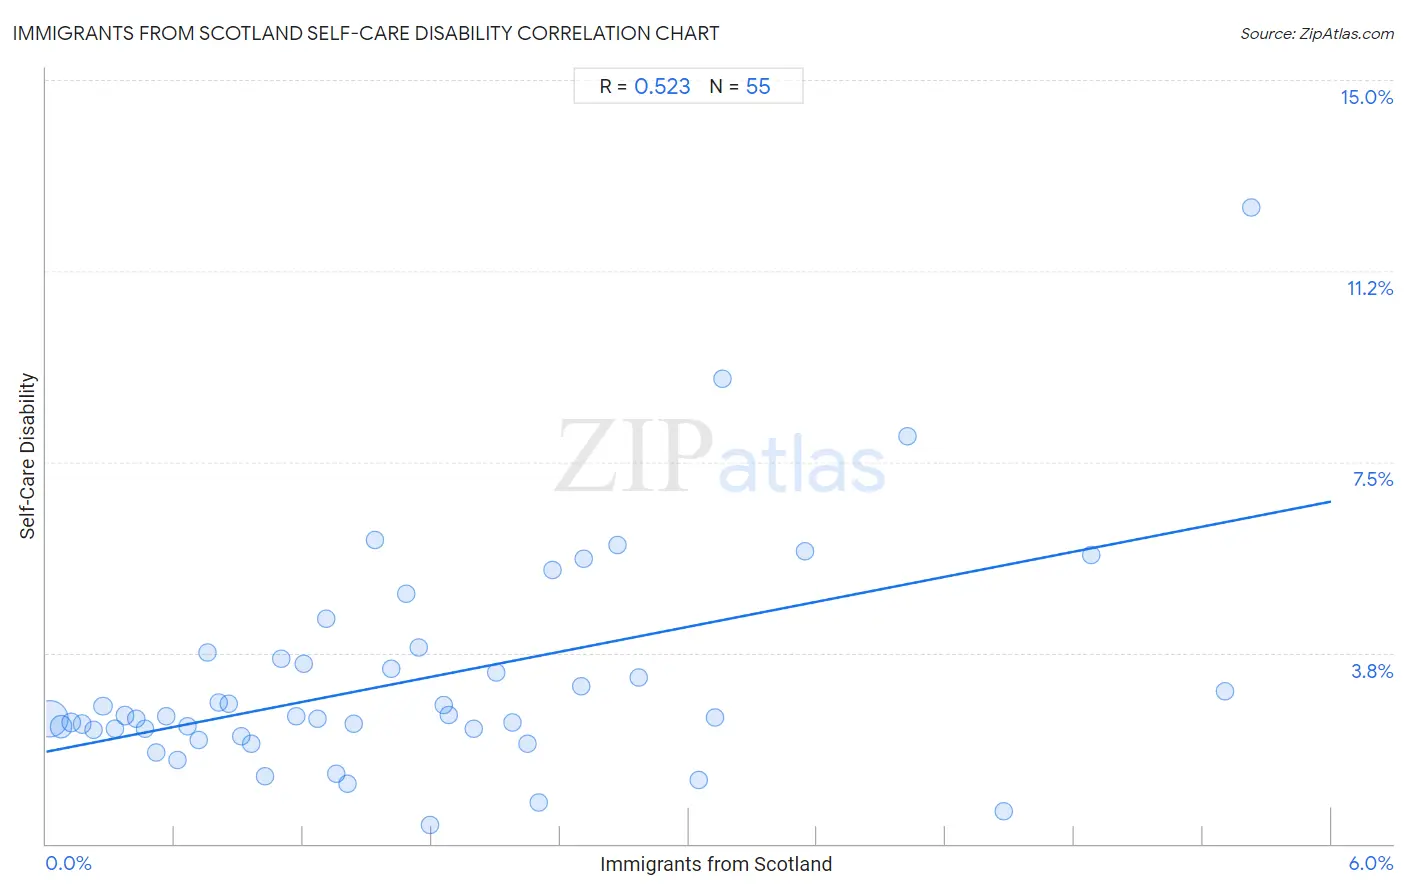
It is essential to understand that the correlation between the percentage of Immigrants from Scotland and percentage of population with self-care disability does not imply a direct cause-and-effect relationship. It remains uncertain whether the presence of Immigrants from Scotland influences an upward or downward trend in the level of percentage of population with self-care disability within an area, or if Immigrants from Scotland simply ended up residing in those areas with higher or lower levels of percentage of population with self-care disability due to other factors.

Demographics Similar to Immigrants from Scotland by Self-Care Disability

In terms of self-care disability, the demographic groups most similar to Immigrants from Scotland are European (2.4%, a difference of 0.040%), Immigrants from Israel (2.4%, a difference of 0.15%), Croatian (2.4%, a difference of 0.18%), Alsatian (2.4%, a difference of 0.21%), and Immigrants from Poland (2.4%, a difference of 0.22%).
DemographicsRating | RankSelf-Care Disability
Macedonians
96.9
/100
|
#94
Exceptional
2.4%
Immigrants from Asia
96.9
/100
|
#95
Exceptional
2.4%
Immigrants from Chile
96.7
/100
|
#96
Exceptional
2.4%
Swiss
96.6
/100
|
#97
Exceptional
2.4%
Immigrants from Poland
96.4
/100
|
#98
Exceptional
2.4%
Immigrants from Israel
96.1
/100
|
#99
Exceptional
2.4%
Europeans
95.8
/100
|
#100
Exceptional
2.4%
Immigrants from Scotland
95.7
/100
|
#101
Exceptional
2.4%
Croatians
95.0
/100
|
#102
Exceptional
2.4%
Alsatians
94.9
/100
|
#103
Exceptional
2.4%
Bhutanese
94.5
/100
|
#104
Exceptional
2.4%
Carpatho Rusyns
94.4
/100
|
#105
Exceptional
2.4%
Immigrants from Indonesia
94.3
/100
|
#106
Exceptional
2.4%
British
94.3
/100
|
#107
Exceptional
2.4%
Greeks
94.1
/100
|
#108
Exceptional
2.4%

Immigrants from Scotland Self-Care Disability Correlation Summary

MeasurementImmigrants from Scotland DataSelf-Care Disability Data
Minimum0.020%0.37%
Maximum5.6%12.5%
Range5.6%12.1%
Mean1.7%3.2%
Median1.4%2.5%
Interquartile 25% (IQ1)0.66%2.2%
Interquartile 75% (IQ3)2.4%3.6%
Interquartile Range (IQR)1.7%1.4%
Standard Deviation (Sample)1.4%2.1%
Standard Deviation (Population)1.4%2.1%

Correlation Details

Immigrants from Scotland PercentileSample SizeSelf-Care Disability
[
0.0%
-
0.5%
]
0.020%
142,116,4182.5%
[
0.0%
-
0.5%
]
0.069%
31,283,4982.3%
[
0.0%
-
0.5%
]
0.12%
10,213,8142.4%
[
0.0%
-
0.5%
]
0.17%
4,800,9992.3%
[
0.0%
-
0.5%
]
0.22%
2,921,3742.2%
[
0.0%
-
0.5%
]
0.27%
1,412,1612.7%
[
0.0%
-
0.5%
]
0.32%
997,7482.3%
[
0.0%
-
0.5%
]
0.37%
591,5402.5%
[
0.0%
-
0.5%
]
0.42%
420,2072.5%
[
0.0%
-
0.5%
]
0.46%
383,6922.3%
[
0.5%
-
1.0%
]
0.51%
308,0061.8%
[
0.5%
-
1.0%
]
0.56%
108,6042.5%
[
0.5%
-
1.0%
]
0.61%
156,9381.6%
[
0.5%
-
1.0%
]
0.66%
103,1602.3%
[
0.5%
-
1.0%
]
0.71%
111,9812.0%
[
0.5%
-
1.0%
]
0.75%
32,2313.8%
[
0.5%
-
1.0%
]
0.81%
21,6132.8%
[
0.5%
-
1.0%
]
0.85%
60,6542.8%
[
0.5%
-
1.0%
]
0.91%
26,1002.1%
[
0.5%
-
1.0%
]
0.96%
33,6842.0%
[
1.0%
-
1.5%
]
1.02%
20,4821.3%
[
1.0%
-
1.5%
]
1.10%
4,4563.6%
[
1.0%
-
1.5%
]
1.17%
18,3252.5%
[
1.0%
-
1.5%
]
1.20%
6,4123.5%
[
1.0%
-
1.5%
]
1.26%
21,9792.5%
[
1.0%
-
1.5%
]
1.31%
1,5284.4%
[
1.0%
-
1.5%
]
1.35%
34,2111.4%
[
1.0%
-
1.5%
]
1.41%
18,8561.2%
[
1.0%
-
1.5%
]
1.43%
3,9042.4%
[
1.5%
-
2.0%
]
1.53%
3916.0%
[
1.5%
-
2.0%
]
1.61%
12,6783.4%
[
1.5%
-
2.0%
]
1.68%
3,3294.9%
[
1.5%
-
2.0%
]
1.74%
8,5683.9%
[
1.5%
-
2.0%
]
1.79%
2790.37%
[
1.5%
-
2.0%
]
1.86%
9,6952.7%
[
1.5%
-
2.0%
]
1.88%
3,1912.5%
[
1.5%
-
2.0%
]
2.00%
9,5132.2%
[
2.0%
-
2.5%
]
2.10%
2383.4%
[
2.0%
-
2.5%
]
2.18%
2,1602.4%
[
2.0%
-
2.5%
]
2.24%
3,9202.0%
[
2.0%
-
2.5%
]
2.30%
1,2600.80%
[
2.0%
-
2.5%
]
2.36%
2545.4%
[
2.0%
-
2.5%
]
2.50%
2403.1%
[
2.5%
-
3.0%
]
2.51%
5985.6%
[
2.5%
-
3.0%
]
2.67%
1,4625.9%
[
2.5%
-
3.0%
]
2.77%
4,8803.3%
[
3.0%
-
3.5%
]
3.04%
3,1201.2%
[
3.0%
-
3.5%
]
3.12%
1,8242.5%
[
3.0%
-
3.5%
]
3.16%
8879.1%
[
3.5%
-
4.0%
]
3.54%
1,1015.7%
[
4.0%
-
4.5%
]
4.02%
5478.0%
[
4.0%
-
4.5%
]
4.47%
4700.65%
[
4.5%
-
5.0%
]
4.88%
1,8245.7%
[
5.5%
-
6.0%
]
5.50%
9813.0%
[
5.5%
-
6.0%
]
5.63%
23112.5%