Immigrants from Scotland Disability Age 5 to 17
COMPARE
Immigrants from Scotland
Select to Compare
Disability Age 5 to 17
Immigrants from Scotland Disability Age 5 to 17
5.6%
DISABILITY | AGE 5 TO 17
61.9/ 100
METRIC RATING
164th/ 347
METRIC RANK
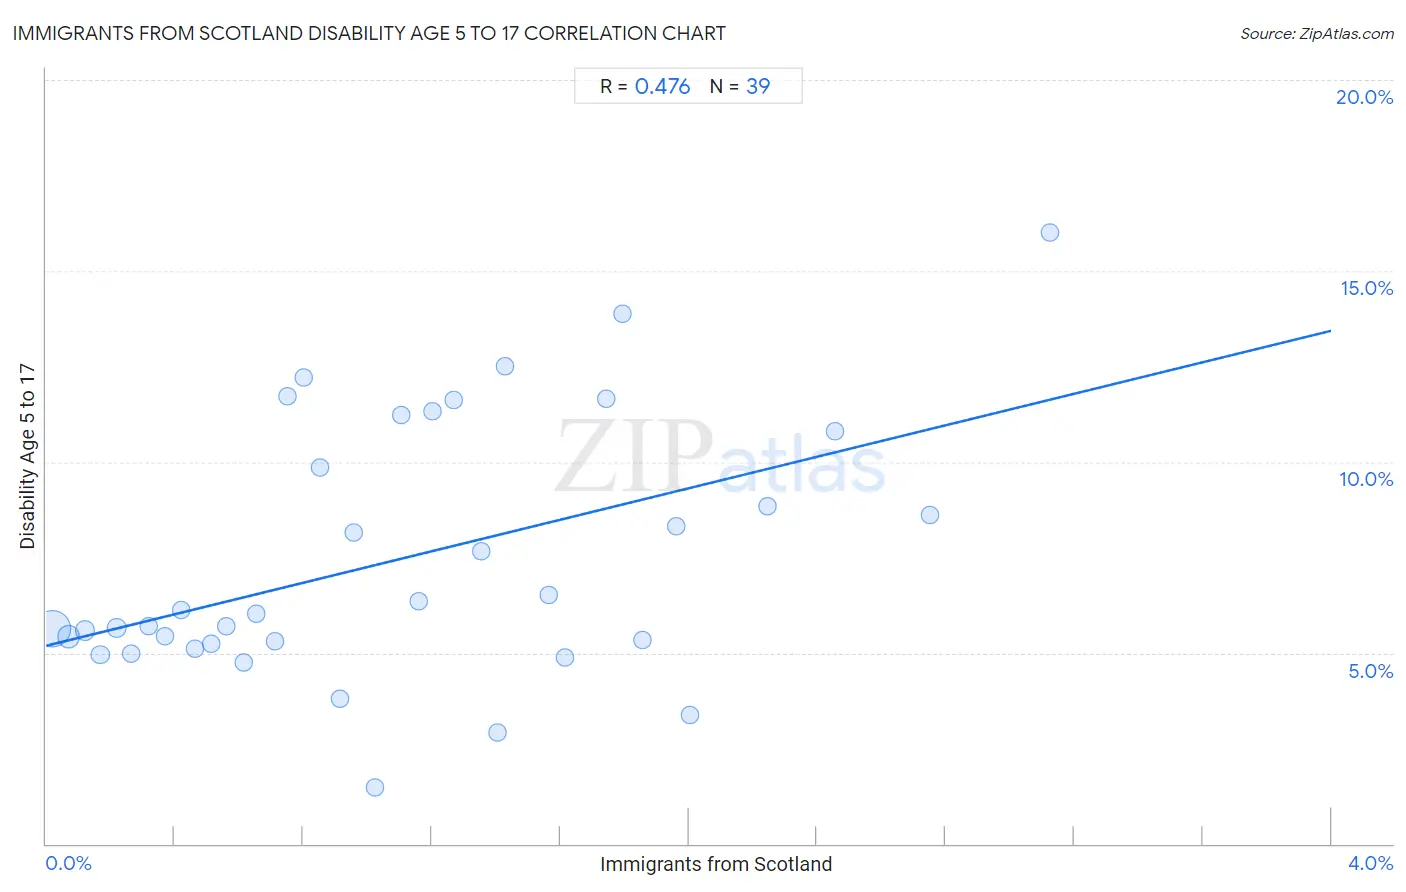
Immigrants from Scotland Disability Age 5 to 17 Correlation Chart
The statistical analysis conducted on geographies consisting of 195,273,569 people shows a moderate positive correlation between the proportion of Immigrants from Scotland and percentage of population with a disability between the ages 5 and 17 in the United States with a correlation coefficient (R) of 0.476 and weighted average of 5.6%. On average, for every 1% (one percent) increase in Immigrants from Scotland within a typical geography, there is an increase of 2.1% in percentage of population with a disability between the ages 5 and 17.
It is essential to understand that the correlation between the percentage of Immigrants from Scotland and percentage of population with a disability between the ages 5 and 17 does not imply a direct cause-and-effect relationship. It remains uncertain whether the presence of Immigrants from Scotland influences an upward or downward trend in the level of percentage of population with a disability between the ages 5 and 17 within an area, or if Immigrants from Scotland simply ended up residing in those areas with higher or lower levels of percentage of population with a disability between the ages 5 and 17 due to other factors.
Demographics Similar to Immigrants from Scotland by Disability Age 5 to 17
In terms of disability age 5 to 17, the demographic groups most similar to Immigrants from Scotland are Lebanese (5.6%, a difference of 0.030%), Greek (5.6%, a difference of 0.070%), Immigrants from Southern Europe (5.6%, a difference of 0.11%), Immigrants from Burma/Myanmar (5.6%, a difference of 0.13%), and Zimbabwean (5.5%, a difference of 0.29%).
| Demographics | Rating | Rank | Disability Age 5 to 17 |
| Immigrants from Costa Rica | 77.9 /100 | #157 | Good 5.5% |
| Immigrants from Nepal | 77.1 /100 | #158 | Good 5.5% |
| Immigrants from Zimbabwe | 75.3 /100 | #159 | Good 5.5% |
| South Africans | 73.3 /100 | #160 | Good 5.5% |
| Immigrants from Saudi Arabia | 69.1 /100 | #161 | Good 5.5% |
| Zimbabweans | 67.2 /100 | #162 | Good 5.5% |
| Immigrants from Southern Europe | 64.0 /100 | #163 | Good 5.6% |
| Immigrants from Scotland | 61.9 /100 | #164 | Good 5.6% |
| Lebanese | 61.4 /100 | #165 | Good 5.6% |
| Greeks | 60.6 /100 | #166 | Good 5.6% |
| Immigrants from Burma/Myanmar | 59.3 /100 | #167 | Average 5.6% |
| Iraqis | 56.0 /100 | #168 | Average 5.6% |
| Immigrants from Norway | 55.7 /100 | #169 | Average 5.6% |
| Serbians | 54.0 /100 | #170 | Average 5.6% |
| Immigrants from Iraq | 53.9 /100 | #171 | Average 5.6% |
Immigrants from Scotland Disability Age 5 to 17 Correlation Summary
| Measurement | Immigrants from Scotland Data | Disability Age 5 to 17 Data |
| Minimum | 0.020% | 1.5% |
| Maximum | 3.1% | 16.0% |
| Range | 3.1% | 14.5% |
| Mean | 1.1% | 7.4% |
| Median | 0.96% | 6.0% |
| Interquartile 25% (IQ1) | 0.46% | 5.2% |
| Interquartile 75% (IQ3) | 1.6% | 10.8% |
| Interquartile Range (IQR) | 1.1% | 5.6% |
| Standard Deviation (Sample) | 0.78% | 3.4% |
| Standard Deviation (Population) | 0.77% | 3.3% |
Correlation Details
| Immigrants from Scotland Percentile | Sample Size | Disability Age 5 to 17 |
[ 0.0% - 0.5% ] 0.020% | 141,869,274 | 5.6% |
[ 0.0% - 0.5% ] 0.069% | 31,124,261 | 5.4% |
[ 0.0% - 0.5% ] 0.12% | 10,127,023 | 5.6% |
[ 0.0% - 0.5% ] 0.17% | 4,707,938 | 5.0% |
[ 0.0% - 0.5% ] 0.22% | 2,827,812 | 5.7% |
[ 0.0% - 0.5% ] 0.27% | 1,367,845 | 5.0% |
[ 0.0% - 0.5% ] 0.32% | 930,465 | 5.7% |
[ 0.0% - 0.5% ] 0.37% | 548,112 | 5.4% |
[ 0.0% - 0.5% ] 0.42% | 384,772 | 6.1% |
[ 0.0% - 0.5% ] 0.46% | 357,832 | 5.1% |
[ 0.5% - 1.0% ] 0.51% | 294,108 | 5.2% |
[ 0.5% - 1.0% ] 0.56% | 93,891 | 5.7% |
[ 0.5% - 1.0% ] 0.61% | 135,632 | 4.8% |
[ 0.5% - 1.0% ] 0.65% | 86,891 | 6.0% |
[ 0.5% - 1.0% ] 0.71% | 106,490 | 5.3% |
[ 0.5% - 1.0% ] 0.75% | 29,108 | 11.7% |
[ 0.5% - 1.0% ] 0.80% | 19,559 | 12.2% |
[ 0.5% - 1.0% ] 0.85% | 52,318 | 9.8% |
[ 0.5% - 1.0% ] 0.91% | 18,598 | 3.8% |
[ 0.5% - 1.0% ] 0.96% | 33,165 | 8.1% |
[ 1.0% - 1.5% ] 1.02% | 16,632 | 1.5% |
[ 1.0% - 1.5% ] 1.11% | 2,983 | 11.2% |
[ 1.0% - 1.5% ] 1.16% | 20,151 | 6.3% |
[ 1.0% - 1.5% ] 1.20% | 4,744 | 11.3% |
[ 1.0% - 1.5% ] 1.27% | 18,759 | 11.6% |
[ 1.0% - 1.5% ] 1.35% | 33,544 | 7.7% |
[ 1.0% - 1.5% ] 1.41% | 18,856 | 2.9% |
[ 1.0% - 1.5% ] 1.43% | 1,612 | 12.5% |
[ 1.5% - 2.0% ] 1.57% | 2,044 | 6.5% |
[ 1.5% - 2.0% ] 1.61% | 10,912 | 4.9% |
[ 1.5% - 2.0% ] 1.74% | 5,570 | 11.6% |
[ 1.5% - 2.0% ] 1.79% | 279 | 13.9% |
[ 1.5% - 2.0% ] 1.86% | 7,430 | 5.3% |
[ 1.5% - 2.0% ] 1.96% | 1,172 | 8.3% |
[ 2.0% - 2.5% ] 2.00% | 6,535 | 3.4% |
[ 2.0% - 2.5% ] 2.24% | 3,920 | 8.8% |
[ 2.0% - 2.5% ] 2.45% | 163 | 10.8% |
[ 2.5% - 3.0% ] 2.75% | 1,345 | 8.6% |
[ 3.0% - 3.5% ] 3.12% | 1,824 | 16.0% |