Immigrants from Scotland GED/Equivalency
COMPARE
Immigrants from Scotland
Select to Compare
GED/Equivalency
Immigrants from Scotland GED/Equivalency
88.2%
GED/EQUIVALENCY
99.6/ 100
METRIC RATING
43rd/ 347
METRIC RANK
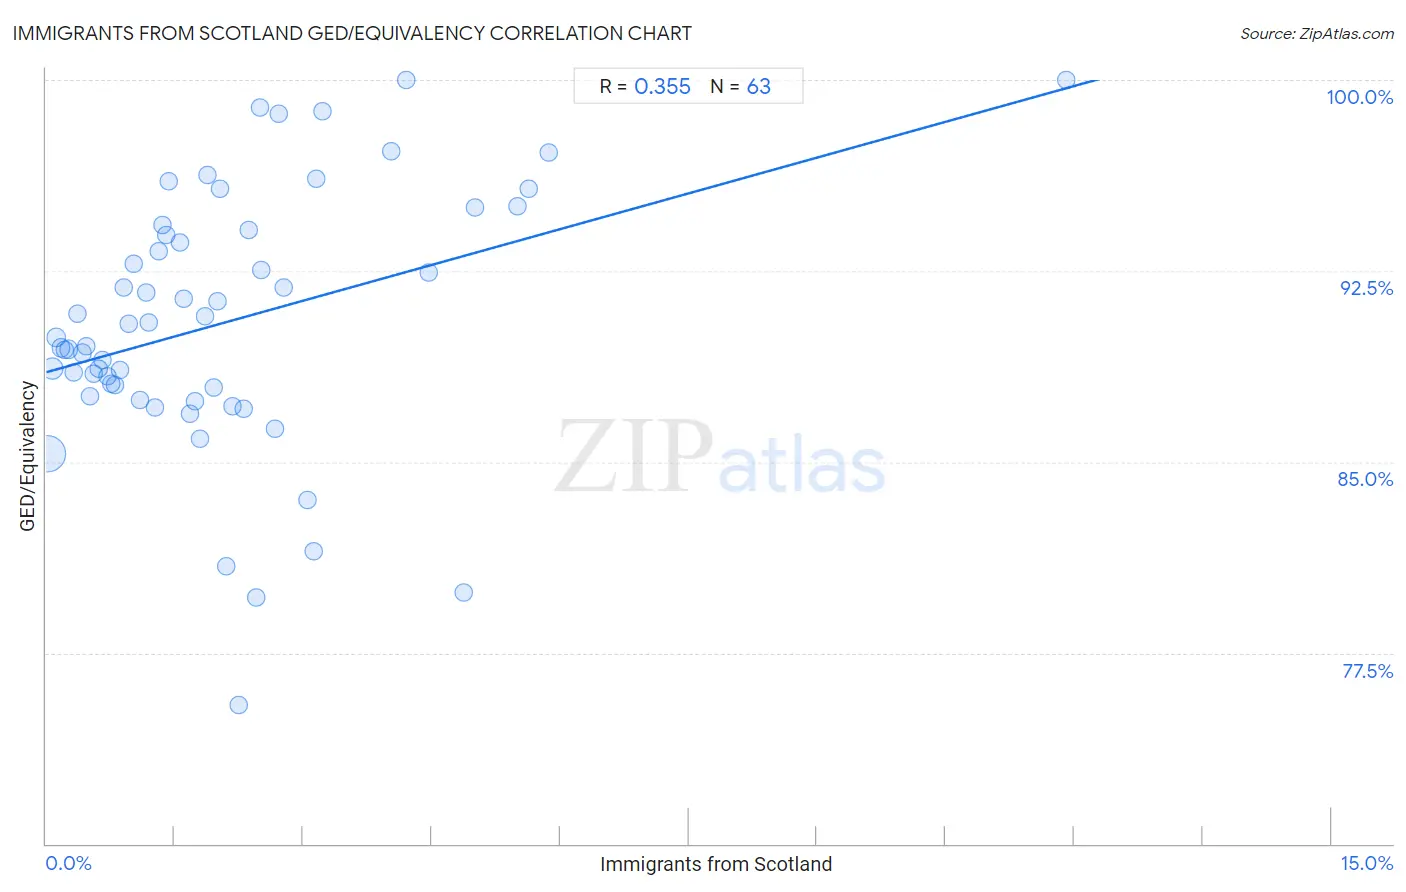
Immigrants from Scotland GED/Equivalency Correlation Chart
The statistical analysis conducted on geographies consisting of 196,397,786 people shows a mild positive correlation between the proportion of Immigrants from Scotland and percentage of population with at least ged/equivalency education in the United States with a correlation coefficient (R) of 0.355 and weighted average of 88.2%. On average, for every 1% (one percent) increase in Immigrants from Scotland within a typical geography, there is an increase of 0.94% in percentage of population with at least ged/equivalency education.
It is essential to understand that the correlation between the percentage of Immigrants from Scotland and percentage of population with at least ged/equivalency education does not imply a direct cause-and-effect relationship. It remains uncertain whether the presence of Immigrants from Scotland influences an upward or downward trend in the level of percentage of population with at least ged/equivalency education within an area, or if Immigrants from Scotland simply ended up residing in those areas with higher or lower levels of percentage of population with at least ged/equivalency education due to other factors.
Demographics Similar to Immigrants from Scotland by GED/Equivalency
In terms of ged/equivalency, the demographic groups most similar to Immigrants from Scotland are Cambodian (88.2%, a difference of 0.0%), Finnish (88.2%, a difference of 0.030%), Macedonian (88.1%, a difference of 0.030%), Italian (88.2%, a difference of 0.050%), and Immigrants from Israel (88.2%, a difference of 0.070%).
| Demographics | Rating | Rank | GED/Equivalency |
| Immigrants from Belgium | 99.7 /100 | #36 | Exceptional 88.3% |
| Immigrants from Austria | 99.7 /100 | #37 | Exceptional 88.3% |
| Burmese | 99.7 /100 | #38 | Exceptional 88.3% |
| Immigrants from Israel | 99.6 /100 | #39 | Exceptional 88.2% |
| Italians | 99.6 /100 | #40 | Exceptional 88.2% |
| Finns | 99.6 /100 | #41 | Exceptional 88.2% |
| Cambodians | 99.6 /100 | #42 | Exceptional 88.2% |
| Immigrants from Scotland | 99.6 /100 | #43 | Exceptional 88.2% |
| Macedonians | 99.5 /100 | #44 | Exceptional 88.1% |
| Czechs | 99.5 /100 | #45 | Exceptional 88.1% |
| Immigrants from Switzerland | 99.5 /100 | #46 | Exceptional 88.1% |
| Immigrants from Latvia | 99.5 /100 | #47 | Exceptional 88.1% |
| Greeks | 99.5 /100 | #48 | Exceptional 88.1% |
| Australians | 99.5 /100 | #49 | Exceptional 88.1% |
| Immigrants from Korea | 99.5 /100 | #50 | Exceptional 88.1% |
Immigrants from Scotland GED/Equivalency Correlation Summary
| Measurement | Immigrants from Scotland Data | GED/Equivalency Data |
| Minimum | 0.020% | 75.4% |
| Maximum | 11.9% | 100.0% |
| Range | 11.9% | 24.6% |
| Mean | 2.1% | 90.5% |
| Median | 1.7% | 89.9% |
| Interquartile 25% (IQ1) | 0.75% | 87.6% |
| Interquartile 75% (IQ3) | 2.7% | 94.1% |
| Interquartile Range (IQR) | 1.9% | 6.5% |
| Standard Deviation (Sample) | 1.9% | 5.1% |
| Standard Deviation (Population) | 1.9% | 5.1% |
Correlation Details
| Immigrants from Scotland Percentile | Sample Size | GED/Equivalency |
[ 0.0% - 0.5% ] 0.020% | 142,116,418 | 85.3% |
[ 0.0% - 0.5% ] 0.069% | 31,283,498 | 88.7% |
[ 0.0% - 0.5% ] 0.12% | 10,234,253 | 89.9% |
[ 0.0% - 0.5% ] 0.17% | 4,814,112 | 89.5% |
[ 0.0% - 0.5% ] 0.22% | 2,927,462 | 89.4% |
[ 0.0% - 0.5% ] 0.27% | 1,423,089 | 89.4% |
[ 0.0% - 0.5% ] 0.32% | 1,001,319 | 88.5% |
[ 0.0% - 0.5% ] 0.37% | 591,540 | 90.8% |
[ 0.0% - 0.5% ] 0.42% | 420,893 | 89.3% |
[ 0.0% - 0.5% ] 0.46% | 383,692 | 89.6% |
[ 0.5% - 1.0% ] 0.51% | 308,006 | 87.6% |
[ 0.5% - 1.0% ] 0.56% | 110,700 | 88.5% |
[ 0.5% - 1.0% ] 0.61% | 156,938 | 88.6% |
[ 0.5% - 1.0% ] 0.66% | 108,196 | 89.0% |
[ 0.5% - 1.0% ] 0.71% | 113,635 | 88.3% |
[ 0.5% - 1.0% ] 0.75% | 32,359 | 88.1% |
[ 0.5% - 1.0% ] 0.81% | 22,354 | 88.0% |
[ 0.5% - 1.0% ] 0.85% | 60,654 | 88.6% |
[ 0.5% - 1.0% ] 0.91% | 26,979 | 91.9% |
[ 0.5% - 1.0% ] 0.96% | 33,684 | 90.4% |
[ 1.0% - 1.5% ] 1.02% | 20,482 | 92.8% |
[ 1.0% - 1.5% ] 1.10% | 5,265 | 87.4% |
[ 1.0% - 1.5% ] 1.16% | 22,289 | 91.6% |
[ 1.0% - 1.5% ] 1.20% | 6,412 | 90.5% |
[ 1.0% - 1.5% ] 1.26% | 21,979 | 87.1% |
[ 1.0% - 1.5% ] 1.31% | 1,528 | 93.3% |
[ 1.0% - 1.5% ] 1.35% | 34,211 | 94.3% |
[ 1.0% - 1.5% ] 1.40% | 19,360 | 93.9% |
[ 1.0% - 1.5% ] 1.43% | 8,022 | 96.0% |
[ 1.5% - 2.0% ] 1.56% | 2,435 | 93.6% |
[ 1.5% - 2.0% ] 1.61% | 12,678 | 91.4% |
[ 1.5% - 2.0% ] 1.68% | 3,329 | 86.9% |
[ 1.5% - 2.0% ] 1.74% | 8,568 | 87.4% |
[ 1.5% - 2.0% ] 1.79% | 279 | 85.9% |
[ 1.5% - 2.0% ] 1.86% | 9,695 | 90.7% |
[ 1.5% - 2.0% ] 1.88% | 5,063 | 96.3% |
[ 1.5% - 2.0% ] 1.96% | 1,172 | 87.9% |
[ 1.5% - 2.0% ] 2.00% | 9,513 | 91.3% |
[ 2.0% - 2.5% ] 2.03% | 2,900 | 95.7% |
[ 2.0% - 2.5% ] 2.10% | 238 | 80.9% |
[ 2.0% - 2.5% ] 2.18% | 2,160 | 87.2% |
[ 2.0% - 2.5% ] 2.24% | 3,920 | 75.4% |
[ 2.0% - 2.5% ] 2.30% | 1,260 | 87.1% |
[ 2.0% - 2.5% ] 2.36% | 254 | 94.1% |
[ 2.0% - 2.5% ] 2.45% | 163 | 79.7% |
[ 2.0% - 2.5% ] 2.50% | 240 | 98.9% |
[ 2.5% - 3.0% ] 2.51% | 598 | 92.5% |
[ 2.5% - 3.0% ] 2.67% | 1,462 | 86.3% |
[ 2.5% - 3.0% ] 2.71% | 6,051 | 98.7% |
[ 2.5% - 3.0% ] 2.77% | 4,880 | 91.8% |
[ 3.0% - 3.5% ] 3.04% | 3,120 | 83.5% |
[ 3.0% - 3.5% ] 3.12% | 1,824 | 81.5% |
[ 3.0% - 3.5% ] 3.16% | 887 | 96.1% |
[ 3.0% - 3.5% ] 3.23% | 837 | 98.8% |
[ 4.0% - 4.5% ] 4.02% | 547 | 97.2% |
[ 4.0% - 4.5% ] 4.20% | 143 | 100.0% |
[ 4.0% - 4.5% ] 4.47% | 470 | 92.4% |
[ 4.5% - 5.0% ] 4.88% | 1,824 | 79.9% |
[ 5.0% - 5.5% ] 5.00% | 20 | 95.0% |
[ 5.5% - 6.0% ] 5.50% | 981 | 95.0% |
[ 5.5% - 6.0% ] 5.63% | 231 | 95.7% |
[ 5.5% - 6.0% ] 5.86% | 631 | 97.1% |
[ 11.5% - 12.0% ] 11.90% | 84 | 100.0% |