Immigrants from Panama Self-Care Disability

COMPARE

Immigrants from Panama
Race
Ancestry
AfghanAfricanAlaska NativeAlaskan AthabascanAlbanianAleutAlsatianAmericanApacheArabArapahoArgentineanArmenianAssyrian/Chaldean/SyriacAustralianAustrianBahamianBangladeshiBarbadianBasqueBelgianBelizeanBermudanBhutaneseBlackfeetBolivianBrazilianBritishBritish West IndianBulgarianBurmeseCajunCambodianCanadianCape VerdeanCarpatho RusynCelticCentral AmericanCentral American IndianCherokeeCheyenneChickasawChileanChineseChippewaChoctawColombianColvilleComancheCosta RicanCreeCreekCroatianCrowCubanCypriotCzechCzechoslovakianDanishDelawareDominicanDutchDutch West IndianEastern EuropeanEcuadorianEgyptianEnglishEstonianEthiopianEuropeanFijianFilipinoFinnishFrenchFrench American IndianFrench CanadianGermanGerman RussianGhanaianGreekGuamanian/ChamorroGuatemalanGuyaneseHaitianHmongHonduranHopiHoumaHungarianIcelanderIndian (Asian)IndonesianInupiatIranianIraqiIrishIroquoisIsraeliItalianJamaicanJapaneseJordanianKenyanKiowaKoreanLaotianLatvianLebaneseLiberianLithuanianLumbeeLuxembourgerMacedonianMalaysianMalteseMarshalleseMenomineeMexicanMexican American IndianMongolianMoroccanNative HawaiianNavajoNepaleseNew ZealanderNicaraguanNigerianNorthern EuropeanNorwegianOkinawanOsageOttawaPaiutePakistaniPalestinianPanamanianParaguayanPennsylvania GermanPeruvianPimaPolishPortuguesePotawatomiPuebloPuerto RicanPuget Sound SalishRomanianRussianSalvadoranSamoanScandinavianScotch-IrishScottishSeminoleSenegaleseSerbianShoshoneSierra LeoneanSiouxSlavicSlovakSloveneSomaliSouth AfricanSouth AmericanSouth American IndianSoviet UnionSpaniardSpanishSpanish AmericanSpanish American IndianSri LankanSubsaharan AfricanSudaneseSwedishSwissSyrianTaiwaneseThaiTlingit-HaidaTohono O'OdhamTonganTrinidadian and TobagonianTsimshianTurkishU.S. Virgin IslanderUgandanUkrainianUruguayanUteVenezuelanVietnameseWelshWest IndianYakamaYaquiYugoslavianYumanYup'ikZimbabwean
Immigration
NonimmigrantsImmigrantsAfghanistanAfricaAlbaniaArgentinaArmeniaAsiaAustraliaAustriaBahamasBangladeshBarbadosBelarusBelgiumBelizeBoliviaBosnia and HerzegovinaBrazilBulgariaBurma/MyanmarCabo VerdeCambodiaCameroonCanadaCaribbeanCentral AmericaChileChinaColombiaCongoCosta RicaCroatiaCubaCzechoslovakiaDenmarkDominicaDominican RepublicEastern AfricaEastern AsiaEastern EuropeEcuadorEgyptEl SalvadorEnglandEritreaEthiopiaEuropeFijiFranceGermanyGhanaGreeceGrenadaGuatemalaGuyanaHaitiHondurasHong KongHungaryIndiaIndonesiaIranIraqIrelandIsraelItalyJamaicaJapanJordanKazakhstanKenyaKoreaKuwaitLaosLatin AmericaLatviaLebanonLiberiaLithuaniaMalaysiaMexicoMicronesiaMiddle AfricaMoldovaMoroccoNepalNetherlandsNicaraguaNigeriaNorth AmericaNorth MacedoniaNorthern AfricaNorthern EuropeNorwayOceaniaPakistanPanamaPeruPhilippinesPolandPortugalRomaniaRussiaSaudi ArabiaScotlandSenegalSerbiaSierra LeoneSingaporeSomaliaSouth AfricaSouth AmericaSouth Central AsiaSouth Eastern AsiaSouthern EuropeSpainSri LankaSt. Vincent and the GrenadinesSudanSwedenSwitzerlandSyriaTaiwanThailandTrinidad and TobagoTurkeyUgandaUkraineUruguayUzbekistanVenezuelaVietnamWest IndiesWestern AfricaWestern AsiaWestern EuropeYemenZaireZimbabweAzores
Select to Compare
Race
Ancestry
AfghanAfricanAlaska NativeAlaskan AthabascanAlbanianAleutAlsatianAmericanApacheArabArapahoArgentineanArmenianAssyrian/Chaldean/SyriacAustralianAustrianBahamianBangladeshiBarbadianBasqueBelgianBelizeanBermudanBhutaneseBlackfeetBolivianBrazilianBritishBritish West IndianBulgarianBurmeseCajunCambodianCanadianCape VerdeanCarpatho RusynCelticCentral AmericanCentral American IndianCherokeeCheyenneChickasawChileanChineseChippewaChoctawColombianColvilleComancheCosta RicanCreeCreekCroatianCrowCubanCypriotCzechCzechoslovakianDanishDelawareDominicanDutchDutch West IndianEastern EuropeanEcuadorianEgyptianEnglishEstonianEthiopianEuropeanFijianFilipinoFinnishFrenchFrench American IndianFrench CanadianGermanGerman RussianGhanaianGreekGuamanian/ChamorroGuatemalanGuyaneseHaitianHmongHonduranHopiHoumaHungarianIcelanderIndian (Asian)IndonesianInupiatIranianIraqiIrishIroquoisIsraeliItalianJamaicanJapaneseJordanianKenyanKiowaKoreanLaotianLatvianLebaneseLiberianLithuanianLumbeeLuxembourgerMacedonianMalaysianMalteseMarshalleseMenomineeMexicanMexican American IndianMongolianMoroccanNative HawaiianNavajoNepaleseNew ZealanderNicaraguanNigerianNorthern EuropeanNorwegianOkinawanOsageOttawaPaiutePakistaniPalestinianPanamanianParaguayanPennsylvania GermanPeruvianPimaPolishPortuguesePotawatomiPuebloPuerto RicanPuget Sound SalishRomanianRussianSalvadoranSamoanScandinavianScotch-IrishScottishSeminoleSenegaleseSerbianShoshoneSierra LeoneanSiouxSlavicSlovakSloveneSomaliSouth AfricanSouth AmericanSouth American IndianSoviet UnionSpaniardSpanishSpanish AmericanSpanish American IndianSri LankanSubsaharan AfricanSudaneseSwedishSwissSyrianTaiwaneseThaiTlingit-HaidaTohono O'OdhamTonganTrinidadian and TobagonianTsimshianTurkishU.S. Virgin IslanderUgandanUkrainianUruguayanUteVenezuelanVietnameseWelshWest IndianYakamaYaquiYugoslavianYumanYup'ikZimbabwean
Immigration
NonimmigrantsImmigrantsAfghanistanAfricaAlbaniaArgentinaArmeniaAsiaAustraliaAustriaBahamasBangladeshBarbadosBelarusBelgiumBelizeBoliviaBosnia and HerzegovinaBrazilBulgariaBurma/MyanmarCabo VerdeCambodiaCameroonCanadaCaribbeanCentral AmericaChileChinaColombiaCongoCosta RicaCroatiaCubaCzechoslovakiaDenmarkDominicaDominican RepublicEastern AfricaEastern AsiaEastern EuropeEcuadorEgyptEl SalvadorEnglandEritreaEthiopiaEuropeFijiFranceGermanyGhanaGreeceGrenadaGuatemalaGuyanaHaitiHondurasHong KongHungaryIndiaIndonesiaIranIraqIrelandIsraelItalyJamaicaJapanJordanKazakhstanKenyaKoreaKuwaitLaosLatin AmericaLatviaLebanonLiberiaLithuaniaMalaysiaMexicoMicronesiaMiddle AfricaMoldovaMoroccoNepalNetherlandsNicaraguaNigeriaNorth AmericaNorth MacedoniaNorthern AfricaNorthern EuropeNorwayOceaniaPakistanPeruPhilippinesPolandPortugalRomaniaRussiaSaudi ArabiaScotlandSenegalSerbiaSierra LeoneSingaporeSomaliaSouth AfricaSouth AmericaSouth Central AsiaSouth Eastern AsiaSouthern EuropeSpainSri LankaSt. Vincent and the GrenadinesSudanSwedenSwitzerlandSyriaTaiwanThailandTrinidad and TobagoTurkeyUgandaUkraineUruguayUzbekistanVenezuelaVietnamWest IndiesWestern AfricaWestern AsiaWestern EuropeYemenZaireZimbabweAzores
Self-Care Disability
Income
Poverty
Unemployment
Labor Participation
Family Structure
Vehicle Availability
Education Level
Disability

Immigrants from Panama Self-Care Disability
Tragic

2.6%
SELF-CARE DISABILITY
1.2/ 100
METRIC RATING
239th/ 347
METRIC RANK

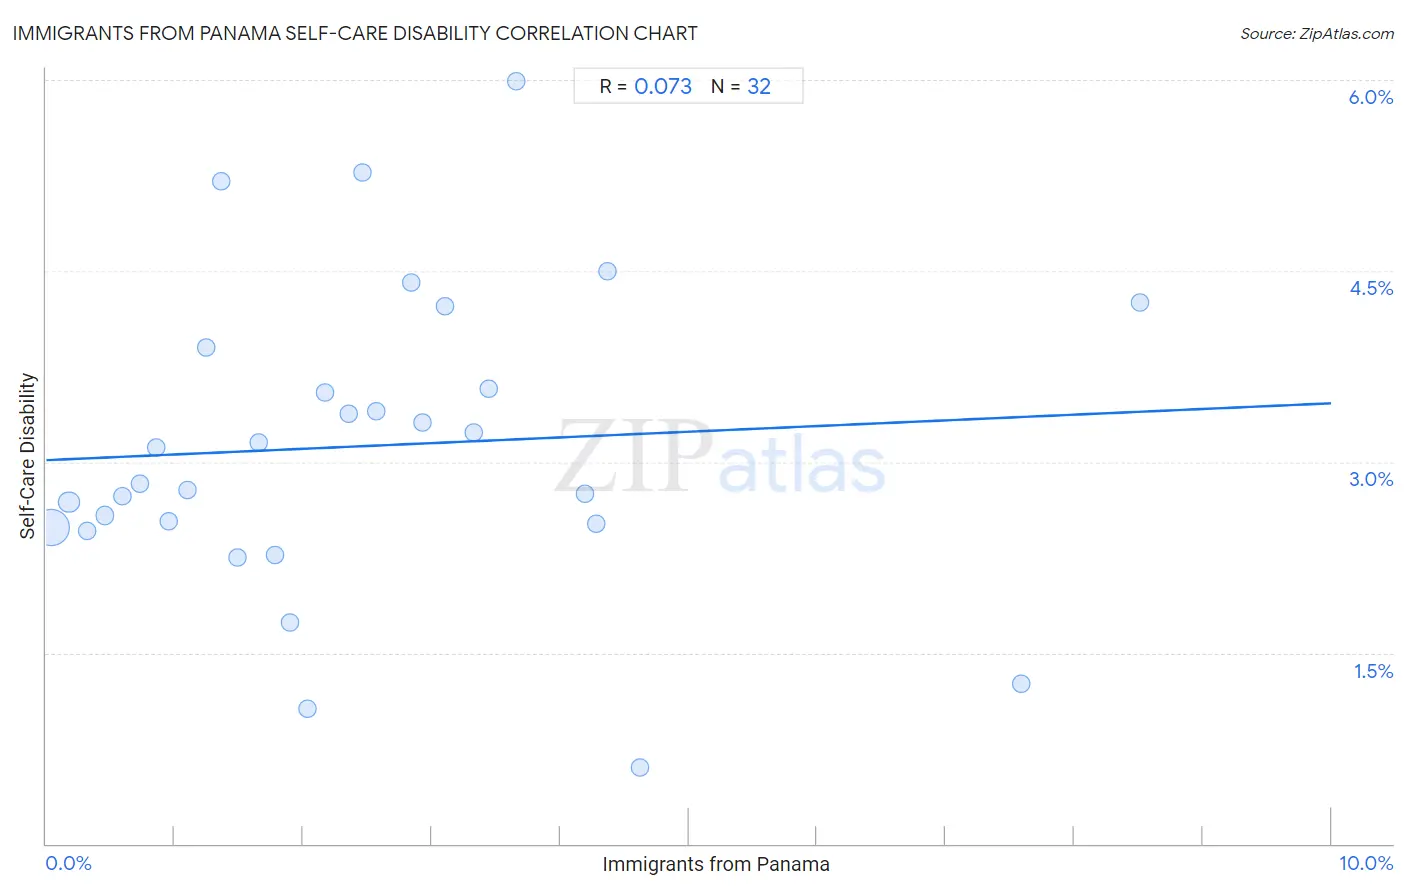
Immigrants from Panama Self-Care Disability Correlation Chart

The statistical analysis conducted on geographies consisting of 221,140,353 people shows a slight positive correlation between the proportion of Immigrants from Panama and percentage of population with self-care disability in the United States with a correlation coefficient (R) of 0.073 and weighted average of 2.6%. On average, for every 1% (one percent) increase in Immigrants from Panama within a typical geography, there is an increase of 0.045% in percentage of population with self-care disability.
Immigrants from Panama Self-Care Disability
It is essential to understand that the correlation between the percentage of Immigrants from Panama and percentage of population with self-care disability does not imply a direct cause-and-effect relationship. It remains uncertain whether the presence of Immigrants from Panama influences an upward or downward trend in the level of percentage of population with self-care disability within an area, or if Immigrants from Panama simply ended up residing in those areas with higher or lower levels of percentage of population with self-care disability due to other factors.

Demographics Similar to Immigrants from Panama by Self-Care Disability

In terms of self-care disability, the demographic groups most similar to Immigrants from Panama are Marshallese (2.6%, a difference of 0.030%), Senegalese (2.6%, a difference of 0.040%), Immigrants from Syria (2.6%, a difference of 0.20%), Immigrants from Senegal (2.6%, a difference of 0.31%), and Spanish (2.6%, a difference of 0.43%).
DemographicsRating | RankSelf-Care Disability
Albanians
2.2
/100
|
#232
Tragic
2.6%
Liberians
2.1
/100
|
#233
Tragic
2.6%
Vietnamese
2.1
/100
|
#234
Tragic
2.6%
Bahamians
2.0
/100
|
#235
Tragic
2.6%
Bermudans
1.9
/100
|
#236
Tragic
2.6%
Immigrants from Senegal
1.6
/100
|
#237
Tragic
2.6%
Senegalese
1.3
/100
|
#238
Tragic
2.6%
Immigrants from Panama
1.2
/100
|
#239
Tragic
2.6%
Marshallese
1.2
/100
|
#240
Tragic
2.6%
Immigrants from Syria
1.0
/100
|
#241
Tragic
2.6%
Spanish
0.8
/100
|
#242
Tragic
2.6%
Hawaiians
0.8
/100
|
#243
Tragic
2.6%
Yuman
0.8
/100
|
#244
Tragic
2.6%
Immigrants from Western Asia
0.6
/100
|
#245
Tragic
2.6%
Cheyenne
0.6
/100
|
#246
Tragic
2.6%

Immigrants from Panama Self-Care Disability Correlation Summary

MeasurementImmigrants from Panama DataSelf-Care Disability Data
Minimum0.042%0.60%
Maximum8.5%6.0%
Range8.5%5.4%
Mean2.5%3.1%
Median2.1%3.0%
Interquartile 25% (IQ1)1.0%2.5%
Interquartile 75% (IQ3)3.4%3.7%
Interquartile Range (IQR)2.4%1.2%
Standard Deviation (Sample)2.0%1.2%
Standard Deviation (Population)1.9%1.2%

Correlation Details

Immigrants from Panama PercentileSample SizeSelf-Care Disability
[
0.0%
-
0.5%
]
0.042%
177,232,7742.5%
[
0.0%
-
0.5%
]
0.18%
30,553,7152.7%
[
0.0%
-
0.5%
]
0.32%
6,812,2452.5%
[
0.0%
-
0.5%
]
0.45%
3,118,9722.6%
[
0.5%
-
1.0%
]
0.59%
1,459,2622.7%
[
0.5%
-
1.0%
]
0.73%
909,9242.8%
[
0.5%
-
1.0%
]
0.85%
293,7763.1%
[
0.5%
-
1.0%
]
0.96%
255,6312.5%
[
1.0%
-
1.5%
]
1.10%
170,8282.8%
[
1.0%
-
1.5%
]
1.24%
167,2383.9%
[
1.0%
-
1.5%
]
1.36%
4,3965.2%
[
1.0%
-
1.5%
]
1.49%
34,2262.2%
[
1.5%
-
2.0%
]
1.66%
18,7653.2%
[
1.5%
-
2.0%
]
1.78%
37,5082.3%
[
1.5%
-
2.0%
]
1.90%
1,8411.7%
[
2.0%
-
2.5%
]
2.03%
24,4131.1%
[
2.0%
-
2.5%
]
2.17%
4,1053.5%
[
2.0%
-
2.5%
]
2.36%
19,2163.4%
[
2.0%
-
2.5%
]
2.47%
1,4605.3%
[
2.5%
-
3.0%
]
2.57%
3,7753.4%
[
2.5%
-
3.0%
]
2.84%
1,6534.4%
[
2.5%
-
3.0%
]
2.93%
4443.3%
[
3.0%
-
3.5%
]
3.11%
6444.2%
[
3.0%
-
3.5%
]
3.33%
7,2993.2%
[
3.0%
-
3.5%
]
3.45%
5223.6%
[
3.5%
-
4.0%
]
3.66%
1,2586.0%
[
4.0%
-
4.5%
]
4.19%
1,0022.8%
[
4.0%
-
4.5%
]
4.28%
1,3322.5%
[
4.0%
-
4.5%
]
4.37%
1834.5%
[
4.5%
-
5.0%
]
4.62%
1,3850.60%
[
7.5%
-
8.0%
]
7.59%
5141.3%
[
8.5%
-
9.0%
]
8.51%
474.3%