Immigrants from Panama vs Costa Rican Married-Couple Family Poverty
COMPARE
Immigrants from Panama
Costa Rican
Married-Couple Family Poverty
Married-Couple Family Poverty Comparison
Immigrants from Panama
Costa Ricans
5.8%
MARRIED-COUPLE FAMILY POVERTY
2.5/ 100
METRIC RATING
241st/ 347
METRIC RANK
5.1%
MARRIED-COUPLE FAMILY POVERTY
61.5/ 100
METRIC RATING
167th/ 347
METRIC RANK
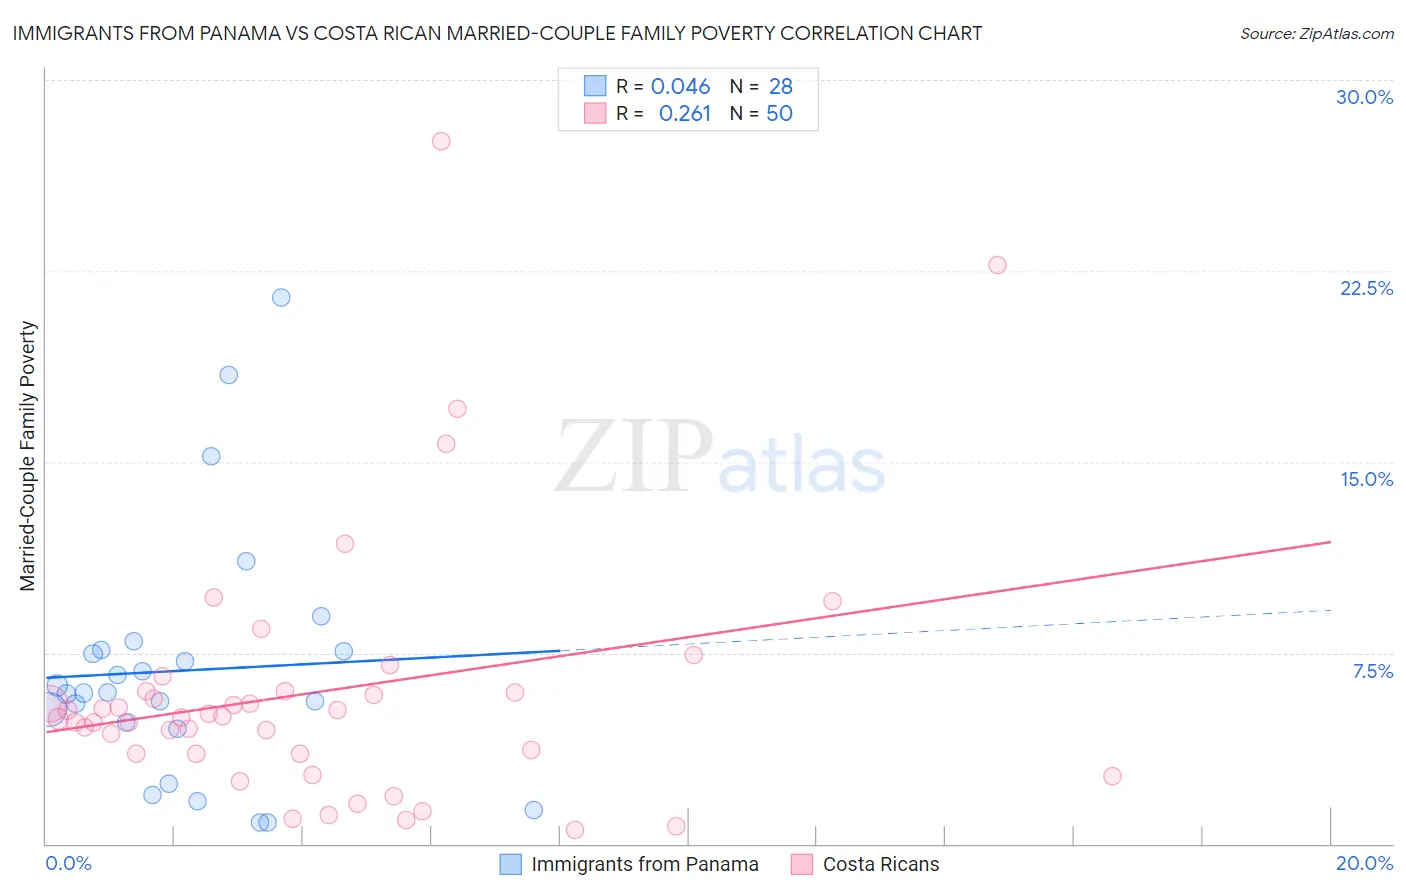
Immigrants from Panama vs Costa Rican Married-Couple Family Poverty Correlation Chart
The statistical analysis conducted on geographies consisting of 220,360,551 people shows no correlation between the proportion of Immigrants from Panama and poverty level among married-couple families in the United States with a correlation coefficient (R) of 0.046 and weighted average of 5.8%. Similarly, the statistical analysis conducted on geographies consisting of 252,586,429 people shows a weak positive correlation between the proportion of Costa Ricans and poverty level among married-couple families in the United States with a correlation coefficient (R) of 0.261 and weighted average of 5.1%, a difference of 12.2%.
Married-Couple Family Poverty Correlation Summary
| Measurement | Immigrants from Panama | Costa Rican |
| Minimum | 0.83% | 0.54% |
| Maximum | 21.5% | 27.6% |
| Range | 20.6% | 27.0% |
| Mean | 6.8% | 6.0% |
| Median | 5.9% | 5.0% |
| Interquartile 25% (IQ1) | 4.6% | 3.5% |
| Interquartile 75% (IQ3) | 7.6% | 6.0% |
| Interquartile Range (IQR) | 2.9% | 2.5% |
| Standard Deviation (Sample) | 4.9% | 5.2% |
| Standard Deviation (Population) | 4.8% | 5.1% |
Similar Demographics by Married-Couple Family Poverty
Demographics Similar to Immigrants from Panama by Married-Couple Family Poverty
In terms of married-couple family poverty, the demographic groups most similar to Immigrants from Panama are Fijian (5.8%, a difference of 0.020%), Immigrants from Western Africa (5.8%, a difference of 0.090%), Venezuelan (5.8%, a difference of 0.19%), Cherokee (5.8%, a difference of 0.22%), and Somali (5.8%, a difference of 0.24%).
| Demographics | Rating | Rank | Married-Couple Family Poverty |
| Immigrants | Uruguay | 3.7 /100 | #234 | Tragic 5.7% |
| Immigrants | Sudan | 3.5 /100 | #235 | Tragic 5.7% |
| Ghanaians | 3.3 /100 | #236 | Tragic 5.7% |
| Immigrants | South America | 3.1 /100 | #237 | Tragic 5.7% |
| Cherokee | 2.7 /100 | #238 | Tragic 5.8% |
| Venezuelans | 2.7 /100 | #239 | Tragic 5.8% |
| Fijians | 2.5 /100 | #240 | Tragic 5.8% |
| Immigrants | Panama | 2.5 /100 | #241 | Tragic 5.8% |
| Immigrants | Western Africa | 2.4 /100 | #242 | Tragic 5.8% |
| Somalis | 2.3 /100 | #243 | Tragic 5.8% |
| Chickasaw | 2.3 /100 | #244 | Tragic 5.8% |
| Immigrants | Afghanistan | 2.1 /100 | #245 | Tragic 5.8% |
| Immigrants | Venezuela | 1.8 /100 | #246 | Tragic 5.8% |
| Iraqis | 1.4 /100 | #247 | Tragic 5.9% |
| Cree | 1.2 /100 | #248 | Tragic 5.9% |
Demographics Similar to Costa Ricans by Married-Couple Family Poverty
In terms of married-couple family poverty, the demographic groups most similar to Costa Ricans are Paraguayan (5.1%, a difference of 0.0%), Immigrants from Malaysia (5.1%, a difference of 0.090%), Hawaiian (5.1%, a difference of 0.10%), Sierra Leonean (5.1%, a difference of 0.34%), and Immigrants from Jordan (5.1%, a difference of 0.65%).
| Demographics | Rating | Rank | Married-Couple Family Poverty |
| Pennsylvania Germans | 68.5 /100 | #160 | Good 5.1% |
| Ethiopians | 68.1 /100 | #161 | Good 5.1% |
| Immigrants | Jordan | 66.5 /100 | #162 | Good 5.1% |
| Sierra Leoneans | 64.1 /100 | #163 | Good 5.1% |
| Hawaiians | 62.3 /100 | #164 | Good 5.1% |
| Immigrants | Malaysia | 62.2 /100 | #165 | Good 5.1% |
| Paraguayans | 61.5 /100 | #166 | Good 5.1% |
| Costa Ricans | 61.5 /100 | #167 | Good 5.1% |
| Immigrants | Uganda | 54.9 /100 | #168 | Average 5.2% |
| Ottawa | 54.5 /100 | #169 | Average 5.2% |
| Immigrants | Argentina | 54.4 /100 | #170 | Average 5.2% |
| Bermudans | 52.9 /100 | #171 | Average 5.2% |
| Immigrants | Northern Africa | 51.3 /100 | #172 | Average 5.2% |
| Alsatians | 51.2 /100 | #173 | Average 5.2% |
| Immigrants | Eastern Africa | 50.0 /100 | #174 | Average 5.2% |