Immigrants from Panama GED/Equivalency

COMPARE

Immigrants from Panama
Race
Ancestry
AfghanAfricanAlaska NativeAlaskan AthabascanAlbanianAleutAlsatianAmericanApacheArabArapahoArgentineanArmenianAssyrian/Chaldean/SyriacAustralianAustrianBahamianBangladeshiBarbadianBasqueBelgianBelizeanBermudanBhutaneseBlackfeetBolivianBrazilianBritishBritish West IndianBulgarianBurmeseCajunCambodianCanadianCape VerdeanCarpatho RusynCelticCentral AmericanCentral American IndianCherokeeCheyenneChickasawChileanChineseChippewaChoctawColombianColvilleComancheCosta RicanCreeCreekCroatianCrowCubanCypriotCzechCzechoslovakianDanishDelawareDominicanDutchDutch West IndianEastern EuropeanEcuadorianEgyptianEnglishEstonianEthiopianEuropeanFijianFilipinoFinnishFrenchFrench American IndianFrench CanadianGermanGerman RussianGhanaianGreekGuamanian/ChamorroGuatemalanGuyaneseHaitianHmongHonduranHopiHoumaHungarianIcelanderIndian (Asian)IndonesianInupiatIranianIraqiIrishIroquoisIsraeliItalianJamaicanJapaneseJordanianKenyanKiowaKoreanLaotianLatvianLebaneseLiberianLithuanianLumbeeLuxembourgerMacedonianMalaysianMalteseMarshalleseMenomineeMexicanMexican American IndianMongolianMoroccanNative HawaiianNavajoNepaleseNew ZealanderNicaraguanNigerianNorthern EuropeanNorwegianOkinawanOsageOttawaPaiutePakistaniPalestinianPanamanianParaguayanPennsylvania GermanPeruvianPimaPolishPortuguesePotawatomiPuebloPuerto RicanPuget Sound SalishRomanianRussianSalvadoranSamoanScandinavianScotch-IrishScottishSeminoleSenegaleseSerbianShoshoneSierra LeoneanSiouxSlavicSlovakSloveneSomaliSouth AfricanSouth AmericanSouth American IndianSoviet UnionSpaniardSpanishSpanish AmericanSpanish American IndianSri LankanSubsaharan AfricanSudaneseSwedishSwissSyrianTaiwaneseThaiTlingit-HaidaTohono O'OdhamTonganTrinidadian and TobagonianTsimshianTurkishU.S. Virgin IslanderUgandanUkrainianUruguayanUteVenezuelanVietnameseWelshWest IndianYakamaYaquiYugoslavianYumanYup'ikZimbabwean
Immigration
NonimmigrantsImmigrantsAfghanistanAfricaAlbaniaArgentinaArmeniaAsiaAustraliaAustriaBahamasBangladeshBarbadosBelarusBelgiumBelizeBoliviaBosnia and HerzegovinaBrazilBulgariaBurma/MyanmarCabo VerdeCambodiaCameroonCanadaCaribbeanCentral AmericaChileChinaColombiaCongoCosta RicaCroatiaCubaCzechoslovakiaDenmarkDominicaDominican RepublicEastern AfricaEastern AsiaEastern EuropeEcuadorEgyptEl SalvadorEnglandEritreaEthiopiaEuropeFijiFranceGermanyGhanaGreeceGrenadaGuatemalaGuyanaHaitiHondurasHong KongHungaryIndiaIndonesiaIranIraqIrelandIsraelItalyJamaicaJapanJordanKazakhstanKenyaKoreaKuwaitLaosLatin AmericaLatviaLebanonLiberiaLithuaniaMalaysiaMexicoMicronesiaMiddle AfricaMoldovaMoroccoNepalNetherlandsNicaraguaNigeriaNorth AmericaNorth MacedoniaNorthern AfricaNorthern EuropeNorwayOceaniaPakistanPanamaPeruPhilippinesPolandPortugalRomaniaRussiaSaudi ArabiaScotlandSenegalSerbiaSierra LeoneSingaporeSomaliaSouth AfricaSouth AmericaSouth Central AsiaSouth Eastern AsiaSouthern EuropeSpainSri LankaSt. Vincent and the GrenadinesSudanSwedenSwitzerlandSyriaTaiwanThailandTrinidad and TobagoTurkeyUgandaUkraineUruguayUzbekistanVenezuelaVietnamWest IndiesWestern AfricaWestern AsiaWestern EuropeYemenZaireZimbabweAzores
Select to Compare
Race
Ancestry
AfghanAfricanAlaska NativeAlaskan AthabascanAlbanianAleutAlsatianAmericanApacheArabArapahoArgentineanArmenianAssyrian/Chaldean/SyriacAustralianAustrianBahamianBangladeshiBarbadianBasqueBelgianBelizeanBermudanBhutaneseBlackfeetBolivianBrazilianBritishBritish West IndianBulgarianBurmeseCajunCambodianCanadianCape VerdeanCarpatho RusynCelticCentral AmericanCentral American IndianCherokeeCheyenneChickasawChileanChineseChippewaChoctawColombianColvilleComancheCosta RicanCreeCreekCroatianCrowCubanCypriotCzechCzechoslovakianDanishDelawareDominicanDutchDutch West IndianEastern EuropeanEcuadorianEgyptianEnglishEstonianEthiopianEuropeanFijianFilipinoFinnishFrenchFrench American IndianFrench CanadianGermanGerman RussianGhanaianGreekGuamanian/ChamorroGuatemalanGuyaneseHaitianHmongHonduranHopiHoumaHungarianIcelanderIndian (Asian)IndonesianInupiatIranianIraqiIrishIroquoisIsraeliItalianJamaicanJapaneseJordanianKenyanKiowaKoreanLaotianLatvianLebaneseLiberianLithuanianLumbeeLuxembourgerMacedonianMalaysianMalteseMarshalleseMenomineeMexicanMexican American IndianMongolianMoroccanNative HawaiianNavajoNepaleseNew ZealanderNicaraguanNigerianNorthern EuropeanNorwegianOkinawanOsageOttawaPaiutePakistaniPalestinianPanamanianParaguayanPennsylvania GermanPeruvianPimaPolishPortuguesePotawatomiPuebloPuerto RicanPuget Sound SalishRomanianRussianSalvadoranSamoanScandinavianScotch-IrishScottishSeminoleSenegaleseSerbianShoshoneSierra LeoneanSiouxSlavicSlovakSloveneSomaliSouth AfricanSouth AmericanSouth American IndianSoviet UnionSpaniardSpanishSpanish AmericanSpanish American IndianSri LankanSubsaharan AfricanSudaneseSwedishSwissSyrianTaiwaneseThaiTlingit-HaidaTohono O'OdhamTonganTrinidadian and TobagonianTsimshianTurkishU.S. Virgin IslanderUgandanUkrainianUruguayanUteVenezuelanVietnameseWelshWest IndianYakamaYaquiYugoslavianYumanYup'ikZimbabwean
Immigration
NonimmigrantsImmigrantsAfghanistanAfricaAlbaniaArgentinaArmeniaAsiaAustraliaAustriaBahamasBangladeshBarbadosBelarusBelgiumBelizeBoliviaBosnia and HerzegovinaBrazilBulgariaBurma/MyanmarCabo VerdeCambodiaCameroonCanadaCaribbeanCentral AmericaChileChinaColombiaCongoCosta RicaCroatiaCubaCzechoslovakiaDenmarkDominicaDominican RepublicEastern AfricaEastern AsiaEastern EuropeEcuadorEgyptEl SalvadorEnglandEritreaEthiopiaEuropeFijiFranceGermanyGhanaGreeceGrenadaGuatemalaGuyanaHaitiHondurasHong KongHungaryIndiaIndonesiaIranIraqIrelandIsraelItalyJamaicaJapanJordanKazakhstanKenyaKoreaKuwaitLaosLatin AmericaLatviaLebanonLiberiaLithuaniaMalaysiaMexicoMicronesiaMiddle AfricaMoldovaMoroccoNepalNetherlandsNicaraguaNigeriaNorth AmericaNorth MacedoniaNorthern AfricaNorthern EuropeNorwayOceaniaPakistanPeruPhilippinesPolandPortugalRomaniaRussiaSaudi ArabiaScotlandSenegalSerbiaSierra LeoneSingaporeSomaliaSouth AfricaSouth AmericaSouth Central AsiaSouth Eastern AsiaSouthern EuropeSpainSri LankaSt. Vincent and the GrenadinesSudanSwedenSwitzerlandSyriaTaiwanThailandTrinidad and TobagoTurkeyUgandaUkraineUruguayUzbekistanVenezuelaVietnamWest IndiesWestern AfricaWestern AsiaWestern EuropeYemenZaireZimbabweAzores
GED/Equivalency
Income
Poverty
Unemployment
Labor Participation
Family Structure
Vehicle Availability
Education Level
Disability

Immigrants from Panama GED/Equivalency
Tragic

84.4%
GED/EQUIVALENCY
4.1/ 100
METRIC RATING
233rd/ 347
METRIC RANK

Immigrants from Panama GED/Equivalency Correlation Chart

The statistical analysis conducted on geographies consisting of 221,184,524 people shows a moderate negative correlation between the proportion of Immigrants from Panama and percentage of population with at least ged/equivalency education in the United States with a correlation coefficient (R) of -0.479 and weighted average of 84.4%. On average, for every 1% (one percent) increase in Immigrants from Panama within a typical geography, there is a decrease of 0.91% in percentage of population with at least ged/equivalency education.
Immigrants from Panama GED/Equivalency
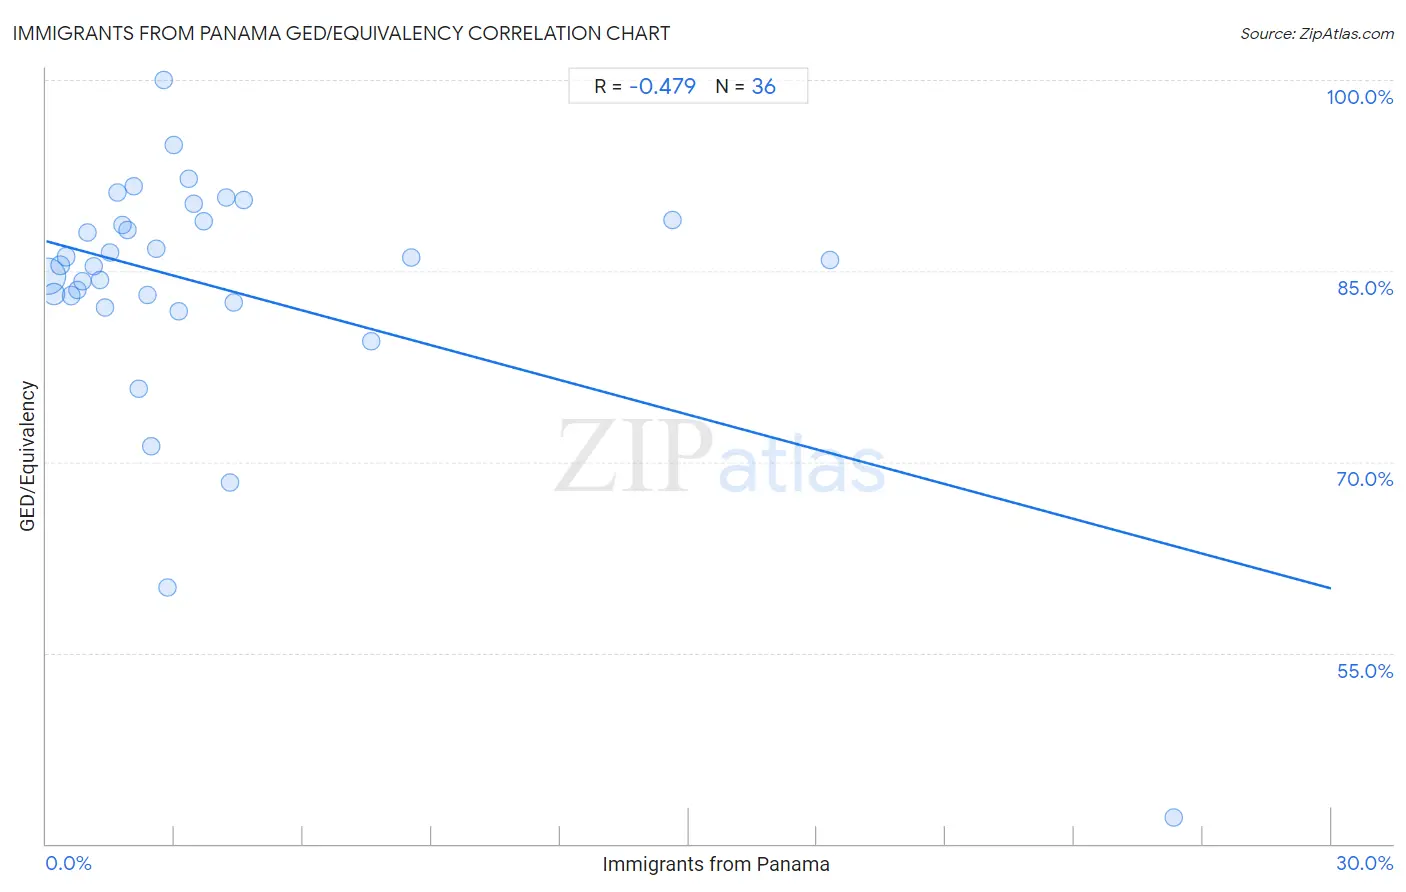
It is essential to understand that the correlation between the percentage of Immigrants from Panama and percentage of population with at least ged/equivalency education does not imply a direct cause-and-effect relationship. It remains uncertain whether the presence of Immigrants from Panama influences an upward or downward trend in the level of percentage of population with at least ged/equivalency education within an area, or if Immigrants from Panama simply ended up residing in those areas with higher or lower levels of percentage of population with at least ged/equivalency education due to other factors.

Demographics Similar to Immigrants from Panama by GED/Equivalency

In terms of ged/equivalency, the demographic groups most similar to Immigrants from Panama are Immigrants from South America (84.4%, a difference of 0.010%), Immigrants from Middle Africa (84.4%, a difference of 0.030%), Immigrants from Colombia (84.4%, a difference of 0.050%), Immigrants from Uruguay (84.4%, a difference of 0.060%), and Immigrants from Nigeria (84.3%, a difference of 0.070%).
DemographicsRating | RankGED/Equivalency
Immigrants from Zaire
5.5
/100
|
#226
Tragic
84.5%
Immigrants from Costa Rica
5.4
/100
|
#227
Tragic
84.5%
Immigrants from Liberia
4.9
/100
|
#228
Tragic
84.4%
Immigrants from Uruguay
4.6
/100
|
#229
Tragic
84.4%
Immigrants from Colombia
4.5
/100
|
#230
Tragic
84.4%
Immigrants from Middle Africa
4.3
/100
|
#231
Tragic
84.4%
Immigrants from South America
4.2
/100
|
#232
Tragic
84.4%
Immigrants from Panama
4.1
/100
|
#233
Tragic
84.4%
Immigrants from Nigeria
3.6
/100
|
#234
Tragic
84.3%
Ghanaians
3.5
/100
|
#235
Tragic
84.3%
Immigrants from Eritrea
3.5
/100
|
#236
Tragic
84.3%
Sub-Saharan Africans
3.0
/100
|
#237
Tragic
84.2%
Immigrants from Peru
2.7
/100
|
#238
Tragic
84.2%
Immigrants from Bahamas
2.6
/100
|
#239
Tragic
84.2%
Immigrants from South Eastern Asia
2.5
/100
|
#240
Tragic
84.1%

Immigrants from Panama GED/Equivalency Correlation Summary

MeasurementImmigrants from Panama DataGED/Equivalency Data
Minimum0.042%42.1%
Maximum26.3%100.0%
Range26.3%57.9%
Mean3.9%83.8%
Median2.4%85.7%
Interquartile 25% (IQ1)1.2%82.8%
Interquartile 75% (IQ3)3.9%88.9%
Interquartile Range (IQR)2.8%6.1%
Standard Deviation (Sample)5.4%10.2%
Standard Deviation (Population)5.3%10.1%

Correlation Details

Immigrants from Panama PercentileSample SizeGED/Equivalency
[
0.0%
-
0.5%
]
0.042%
177,252,03784.6%
[
0.0%
-
0.5%
]
0.18%
30,566,96383.2%
[
0.0%
-
0.5%
]
0.32%
6,809,69885.4%
[
0.0%
-
0.5%
]
0.45%
3,120,89186.1%
[
0.5%
-
1.0%
]
0.59%
1,462,73083.1%
[
0.5%
-
1.0%
]
0.73%
910,31883.5%
[
0.5%
-
1.0%
]
0.85%
295,32884.2%
[
0.5%
-
1.0%
]
0.96%
258,72588.0%
[
1.0%
-
1.5%
]
1.10%
170,82885.4%
[
1.0%
-
1.5%
]
1.24%
167,23884.3%
[
1.0%
-
1.5%
]
1.36%
4,39682.1%
[
1.0%
-
1.5%
]
1.49%
34,22686.5%
[
1.5%
-
2.0%
]
1.66%
18,76591.2%
[
1.5%
-
2.0%
]
1.78%
37,50888.6%
[
1.5%
-
2.0%
]
1.88%
2,76088.3%
[
2.0%
-
2.5%
]
2.03%
24,41391.6%
[
2.0%
-
2.5%
]
2.17%
4,10575.8%
[
2.0%
-
2.5%
]
2.36%
19,21683.1%
[
2.0%
-
2.5%
]
2.47%
1,46071.2%
[
2.5%
-
3.0%
]
2.57%
4,09286.8%
[
2.5%
-
3.0%
]
2.73%
403100.0%
[
2.5%
-
3.0%
]
2.84%
1,65360.2%
[
2.5%
-
3.0%
]
2.97%
1,24794.9%
[
3.0%
-
3.5%
]
3.11%
64481.8%
[
3.0%
-
3.5%
]
3.33%
7,29992.2%
[
3.0%
-
3.5%
]
3.45%
52290.3%
[
3.5%
-
4.0%
]
3.66%
2,18388.9%
[
4.0%
-
4.5%
]
4.19%
1,00290.7%
[
4.0%
-
4.5%
]
4.28%
1,33268.4%
[
4.0%
-
4.5%
]
4.37%
18382.6%
[
4.5%
-
5.0%
]
4.62%
1,38590.6%
[
7.5%
-
8.0%
]
7.59%
51479.5%
[
8.5%
-
9.0%
]
8.51%
4786.0%
[
14.5%
-
15.0%
]
14.61%
21989.0%
[
18.0%
-
18.5%
]
18.29%
17585.9%
[
26.0%
-
26.5%
]
26.32%
1942.1%