Immigrants from Panama 4 or more Vehicles in Household

COMPARE

Immigrants from Panama
Race
Ancestry
AfghanAfricanAlaska NativeAlaskan AthabascanAlbanianAleutAlsatianAmericanApacheArabArapahoArgentineanArmenianAssyrian/Chaldean/SyriacAustralianAustrianBahamianBangladeshiBarbadianBasqueBelgianBelizeanBermudanBhutaneseBlackfeetBolivianBrazilianBritishBritish West IndianBulgarianBurmeseCajunCambodianCanadianCape VerdeanCarpatho RusynCelticCentral AmericanCentral American IndianCherokeeCheyenneChickasawChileanChineseChippewaChoctawColombianColvilleComancheCosta RicanCreeCreekCroatianCrowCubanCypriotCzechCzechoslovakianDanishDelawareDominicanDutchDutch West IndianEastern EuropeanEcuadorianEgyptianEnglishEstonianEthiopianEuropeanFijianFilipinoFinnishFrenchFrench American IndianFrench CanadianGermanGerman RussianGhanaianGreekGuamanian/ChamorroGuatemalanGuyaneseHaitianHmongHonduranHopiHoumaHungarianIcelanderIndian (Asian)IndonesianInupiatIranianIraqiIrishIroquoisIsraeliItalianJamaicanJapaneseJordanianKenyanKiowaKoreanLaotianLatvianLebaneseLiberianLithuanianLumbeeLuxembourgerMacedonianMalaysianMalteseMarshalleseMenomineeMexicanMexican American IndianMongolianMoroccanNative HawaiianNavajoNepaleseNew ZealanderNicaraguanNigerianNorthern EuropeanNorwegianOkinawanOsageOttawaPaiutePakistaniPalestinianPanamanianParaguayanPennsylvania GermanPeruvianPimaPolishPortuguesePotawatomiPuebloPuerto RicanPuget Sound SalishRomanianRussianSalvadoranSamoanScandinavianScotch-IrishScottishSeminoleSenegaleseSerbianShoshoneSierra LeoneanSiouxSlavicSlovakSloveneSomaliSouth AfricanSouth AmericanSouth American IndianSoviet UnionSpaniardSpanishSpanish AmericanSpanish American IndianSri LankanSubsaharan AfricanSudaneseSwedishSwissSyrianTaiwaneseThaiTlingit-HaidaTohono O'OdhamTonganTrinidadian and TobagonianTsimshianTurkishU.S. Virgin IslanderUgandanUkrainianUruguayanUteVenezuelanVietnameseWelshWest IndianYakamaYaquiYugoslavianYumanYup'ikZimbabwean
Immigration
NonimmigrantsImmigrantsAfghanistanAfricaAlbaniaArgentinaArmeniaAsiaAustraliaAustriaBahamasBangladeshBarbadosBelarusBelgiumBelizeBoliviaBosnia and HerzegovinaBrazilBulgariaBurma/MyanmarCabo VerdeCambodiaCameroonCanadaCaribbeanCentral AmericaChileChinaColombiaCongoCosta RicaCroatiaCubaCzechoslovakiaDenmarkDominicaDominican RepublicEastern AfricaEastern AsiaEastern EuropeEcuadorEgyptEl SalvadorEnglandEritreaEthiopiaEuropeFijiFranceGermanyGhanaGreeceGrenadaGuatemalaGuyanaHaitiHondurasHong KongHungaryIndiaIndonesiaIranIraqIrelandIsraelItalyJamaicaJapanJordanKazakhstanKenyaKoreaKuwaitLaosLatin AmericaLatviaLebanonLiberiaLithuaniaMalaysiaMexicoMicronesiaMiddle AfricaMoldovaMoroccoNepalNetherlandsNicaraguaNigeriaNorth AmericaNorth MacedoniaNorthern AfricaNorthern EuropeNorwayOceaniaPakistanPanamaPeruPhilippinesPolandPortugalRomaniaRussiaSaudi ArabiaScotlandSenegalSerbiaSierra LeoneSingaporeSomaliaSouth AfricaSouth AmericaSouth Central AsiaSouth Eastern AsiaSouthern EuropeSpainSri LankaSt. Vincent and the GrenadinesSudanSwedenSwitzerlandSyriaTaiwanThailandTrinidad and TobagoTurkeyUgandaUkraineUruguayUzbekistanVenezuelaVietnamWest IndiesWestern AfricaWestern AsiaWestern EuropeYemenZaireZimbabweAzores
Select to Compare
Race
Ancestry
AfghanAfricanAlaska NativeAlaskan AthabascanAlbanianAleutAlsatianAmericanApacheArabArapahoArgentineanArmenianAssyrian/Chaldean/SyriacAustralianAustrianBahamianBangladeshiBarbadianBasqueBelgianBelizeanBermudanBhutaneseBlackfeetBolivianBrazilianBritishBritish West IndianBulgarianBurmeseCajunCambodianCanadianCape VerdeanCarpatho RusynCelticCentral AmericanCentral American IndianCherokeeCheyenneChickasawChileanChineseChippewaChoctawColombianColvilleComancheCosta RicanCreeCreekCroatianCrowCubanCypriotCzechCzechoslovakianDanishDelawareDominicanDutchDutch West IndianEastern EuropeanEcuadorianEgyptianEnglishEstonianEthiopianEuropeanFijianFilipinoFinnishFrenchFrench American IndianFrench CanadianGermanGerman RussianGhanaianGreekGuamanian/ChamorroGuatemalanGuyaneseHaitianHmongHonduranHopiHoumaHungarianIcelanderIndian (Asian)IndonesianInupiatIranianIraqiIrishIroquoisIsraeliItalianJamaicanJapaneseJordanianKenyanKiowaKoreanLaotianLatvianLebaneseLiberianLithuanianLumbeeLuxembourgerMacedonianMalaysianMalteseMarshalleseMenomineeMexicanMexican American IndianMongolianMoroccanNative HawaiianNavajoNepaleseNew ZealanderNicaraguanNigerianNorthern EuropeanNorwegianOkinawanOsageOttawaPaiutePakistaniPalestinianPanamanianParaguayanPennsylvania GermanPeruvianPimaPolishPortuguesePotawatomiPuebloPuerto RicanPuget Sound SalishRomanianRussianSalvadoranSamoanScandinavianScotch-IrishScottishSeminoleSenegaleseSerbianShoshoneSierra LeoneanSiouxSlavicSlovakSloveneSomaliSouth AfricanSouth AmericanSouth American IndianSoviet UnionSpaniardSpanishSpanish AmericanSpanish American IndianSri LankanSubsaharan AfricanSudaneseSwedishSwissSyrianTaiwaneseThaiTlingit-HaidaTohono O'OdhamTonganTrinidadian and TobagonianTsimshianTurkishU.S. Virgin IslanderUgandanUkrainianUruguayanUteVenezuelanVietnameseWelshWest IndianYakamaYaquiYugoslavianYumanYup'ikZimbabwean
Immigration
NonimmigrantsImmigrantsAfghanistanAfricaAlbaniaArgentinaArmeniaAsiaAustraliaAustriaBahamasBangladeshBarbadosBelarusBelgiumBelizeBoliviaBosnia and HerzegovinaBrazilBulgariaBurma/MyanmarCabo VerdeCambodiaCameroonCanadaCaribbeanCentral AmericaChileChinaColombiaCongoCosta RicaCroatiaCubaCzechoslovakiaDenmarkDominicaDominican RepublicEastern AfricaEastern AsiaEastern EuropeEcuadorEgyptEl SalvadorEnglandEritreaEthiopiaEuropeFijiFranceGermanyGhanaGreeceGrenadaGuatemalaGuyanaHaitiHondurasHong KongHungaryIndiaIndonesiaIranIraqIrelandIsraelItalyJamaicaJapanJordanKazakhstanKenyaKoreaKuwaitLaosLatin AmericaLatviaLebanonLiberiaLithuaniaMalaysiaMexicoMicronesiaMiddle AfricaMoldovaMoroccoNepalNetherlandsNicaraguaNigeriaNorth AmericaNorth MacedoniaNorthern AfricaNorthern EuropeNorwayOceaniaPakistanPeruPhilippinesPolandPortugalRomaniaRussiaSaudi ArabiaScotlandSenegalSerbiaSierra LeoneSingaporeSomaliaSouth AfricaSouth AmericaSouth Central AsiaSouth Eastern AsiaSouthern EuropeSpainSri LankaSt. Vincent and the GrenadinesSudanSwedenSwitzerlandSyriaTaiwanThailandTrinidad and TobagoTurkeyUgandaUkraineUruguayUzbekistanVenezuelaVietnamWest IndiesWestern AfricaWestern AsiaWestern EuropeYemenZaireZimbabweAzores
4 or more Vehicles in Household
Income
Poverty
Unemployment
Labor Participation
Family Structure
Vehicle Availability
Education Level
Disability

Immigrants from Panama 4 or more Vehicles in Household
Tragic

5.7%
4+ VEHICLES AVAILABLE
1.5/ 100
METRIC RATING
254th/ 347
METRIC RANK

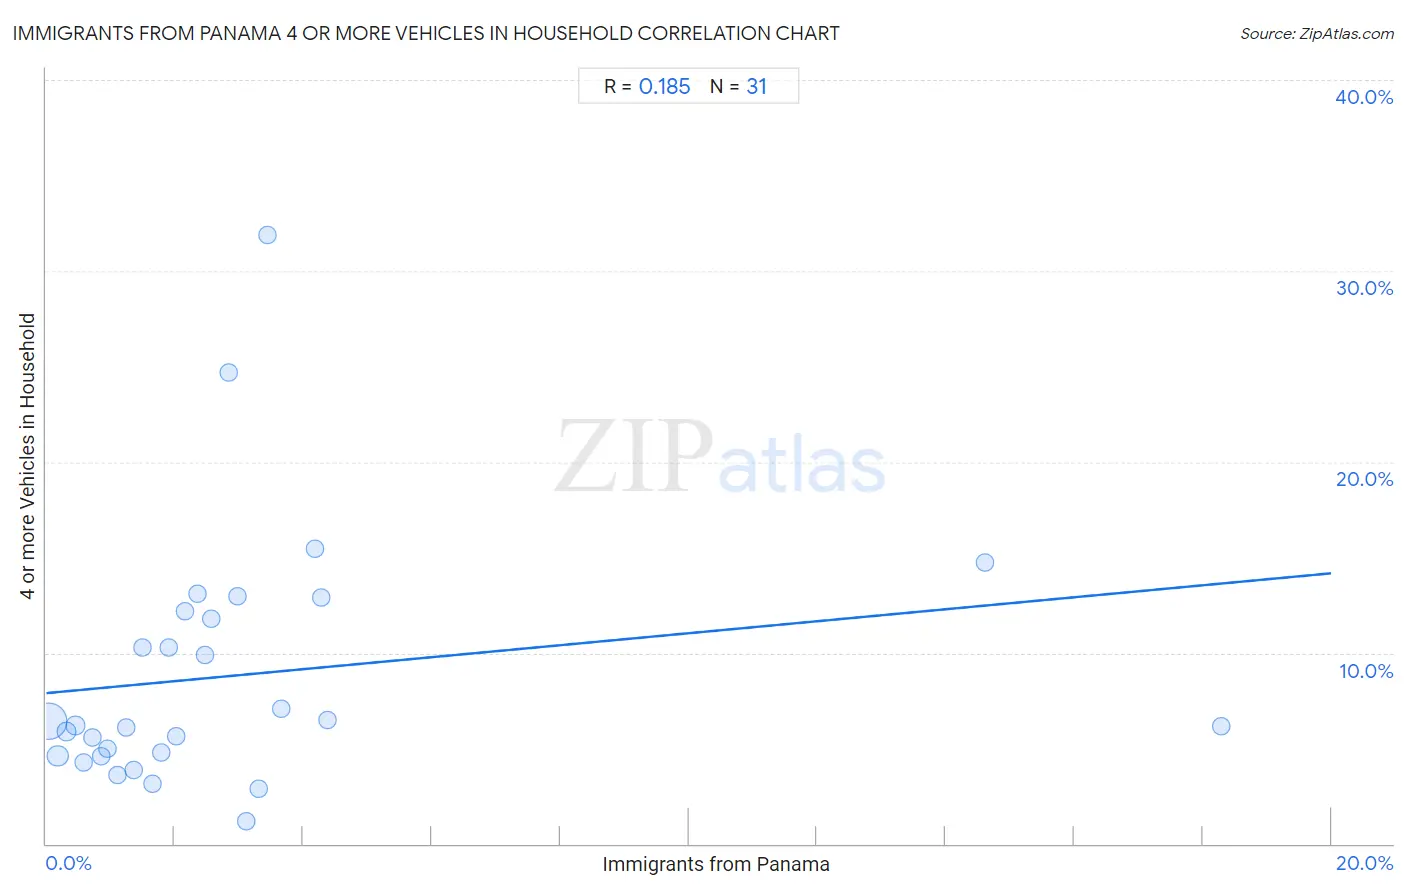
Immigrants from Panama 4 or more Vehicles in Household Correlation Chart

The statistical analysis conducted on geographies consisting of 220,402,511 people shows a poor positive correlation between the proportion of Immigrants from Panama and percentage of households with 4 or more vehicles available in the United States with a correlation coefficient (R) of 0.185 and weighted average of 5.7%. On average, for every 1% (one percent) increase in Immigrants from Panama within a typical geography, there is an increase of 0.31% in percentage of households with 4 or more vehicles available.
Immigrants from Panama 4 or more Vehicles in Household
It is essential to understand that the correlation between the percentage of Immigrants from Panama and percentage of households with 4 or more vehicles available does not imply a direct cause-and-effect relationship. It remains uncertain whether the presence of Immigrants from Panama influences an upward or downward trend in the level of percentage of households with 4 or more vehicles available within an area, or if Immigrants from Panama simply ended up residing in those areas with higher or lower levels of percentage of households with 4 or more vehicles available due to other factors.

Demographics Similar to Immigrants from Panama by 4 or more Vehicles in Household

In terms of 4 or more vehicles in household, the demographic groups most similar to Immigrants from Panama are Yup'ik (5.7%, a difference of 0.090%), Immigrants from Turkey (5.7%, a difference of 0.12%), Immigrants from Cuba (5.7%, a difference of 0.14%), Immigrants from Northern Africa (5.6%, a difference of 0.20%), and Immigrants from Lithuania (5.6%, a difference of 0.34%).
DemographicsRating | Rank4 or more Vehicles in Household
Immigrants from Ethiopia
2.4
/100
|
#247
Tragic
5.7%
Immigrants from Eastern Africa
2.4
/100
|
#248
Tragic
5.7%
Immigrants from Southern Europe
2.3
/100
|
#249
Tragic
5.7%
Immigrants from Europe
2.3
/100
|
#250
Tragic
5.7%
Ugandans
2.2
/100
|
#251
Tragic
5.7%
Sub-Saharan Africans
2.1
/100
|
#252
Tragic
5.7%
Immigrants from Cuba
1.6
/100
|
#253
Tragic
5.7%
Immigrants from Panama
1.5
/100
|
#254
Tragic
5.7%
Yup'ik
1.5
/100
|
#255
Tragic
5.7%
Immigrants from Turkey
1.5
/100
|
#256
Tragic
5.7%
Immigrants from Northern Africa
1.4
/100
|
#257
Tragic
5.6%
Immigrants from Lithuania
1.4
/100
|
#258
Tragic
5.6%
Immigrants from France
1.3
/100
|
#259
Tragic
5.6%
Uruguayans
1.3
/100
|
#260
Tragic
5.6%
Sudanese
1.2
/100
|
#261
Tragic
5.6%

Immigrants from Panama 4 or more Vehicles in Household Correlation Summary

MeasurementImmigrants from Panama Data4 or more Vehicles in Household Data
Minimum0.042%1.2%
Maximum18.3%31.9%
Range18.2%30.7%
Mean2.9%8.8%
Median2.0%6.2%
Interquartile 25% (IQ1)0.95%4.6%
Interquartile 75% (IQ3)3.3%12.2%
Interquartile Range (IQR)2.4%7.6%
Standard Deviation (Sample)3.8%6.5%
Standard Deviation (Population)3.8%6.4%

Correlation Details

Immigrants from Panama PercentileSample Size4 or more Vehicles in Household
[
0.0%
-
0.5%
]
0.042%
176,664,4606.4%
[
0.0%
-
0.5%
]
0.18%
30,482,7294.6%
[
0.0%
-
0.5%
]
0.32%
6,788,8225.9%
[
0.0%
-
0.5%
]
0.45%
3,097,0196.2%
[
0.5%
-
1.0%
]
0.59%
1,437,0494.3%
[
0.5%
-
1.0%
]
0.73%
907,2985.6%
[
0.5%
-
1.0%
]
0.85%
293,7764.6%
[
0.5%
-
1.0%
]
0.95%
245,8875.0%
[
1.0%
-
1.5%
]
1.10%
164,0923.6%
[
1.0%
-
1.5%
]
1.24%
166,6216.1%
[
1.0%
-
1.5%
]
1.36%
4,3963.9%
[
1.0%
-
1.5%
]
1.49%
34,22610.3%
[
1.5%
-
2.0%
]
1.66%
18,7653.1%
[
1.5%
-
2.0%
]
1.78%
37,5084.8%
[
1.5%
-
2.0%
]
1.90%
1,84110.3%
[
2.0%
-
2.5%
]
2.03%
24,4135.6%
[
2.0%
-
2.5%
]
2.17%
4,10512.2%
[
2.0%
-
2.5%
]
2.36%
19,21613.1%
[
2.0%
-
2.5%
]
2.47%
1,4609.9%
[
2.5%
-
3.0%
]
2.56%
35111.8%
[
2.5%
-
3.0%
]
2.84%
1,65324.7%
[
2.5%
-
3.0%
]
2.97%
1,24713.0%
[
3.0%
-
3.5%
]
3.11%
6441.2%
[
3.0%
-
3.5%
]
3.31%
2422.9%
[
3.0%
-
3.5%
]
3.45%
52231.9%
[
3.5%
-
4.0%
]
3.66%
1,2587.1%
[
4.0%
-
4.5%
]
4.19%
1,00215.5%
[
4.0%
-
4.5%
]
4.28%
1,33212.9%
[
4.0%
-
4.5%
]
4.37%
1836.5%
[
14.5%
-
15.0%
]
14.61%
21914.8%
[
18.0%
-
18.5%
]
18.29%
1756.2%