Immigrants from Panama vs Okinawan Married-Couple Family Poverty
COMPARE
Immigrants from Panama
Okinawan
Married-Couple Family Poverty
Married-Couple Family Poverty Comparison
Immigrants from Panama
Okinawans
5.8%
MARRIED-COUPLE FAMILY POVERTY
2.5/ 100
METRIC RATING
241st/ 347
METRIC RANK
4.4%
MARRIED-COUPLE FAMILY POVERTY
99.6/ 100
METRIC RATING
61st/ 347
METRIC RANK
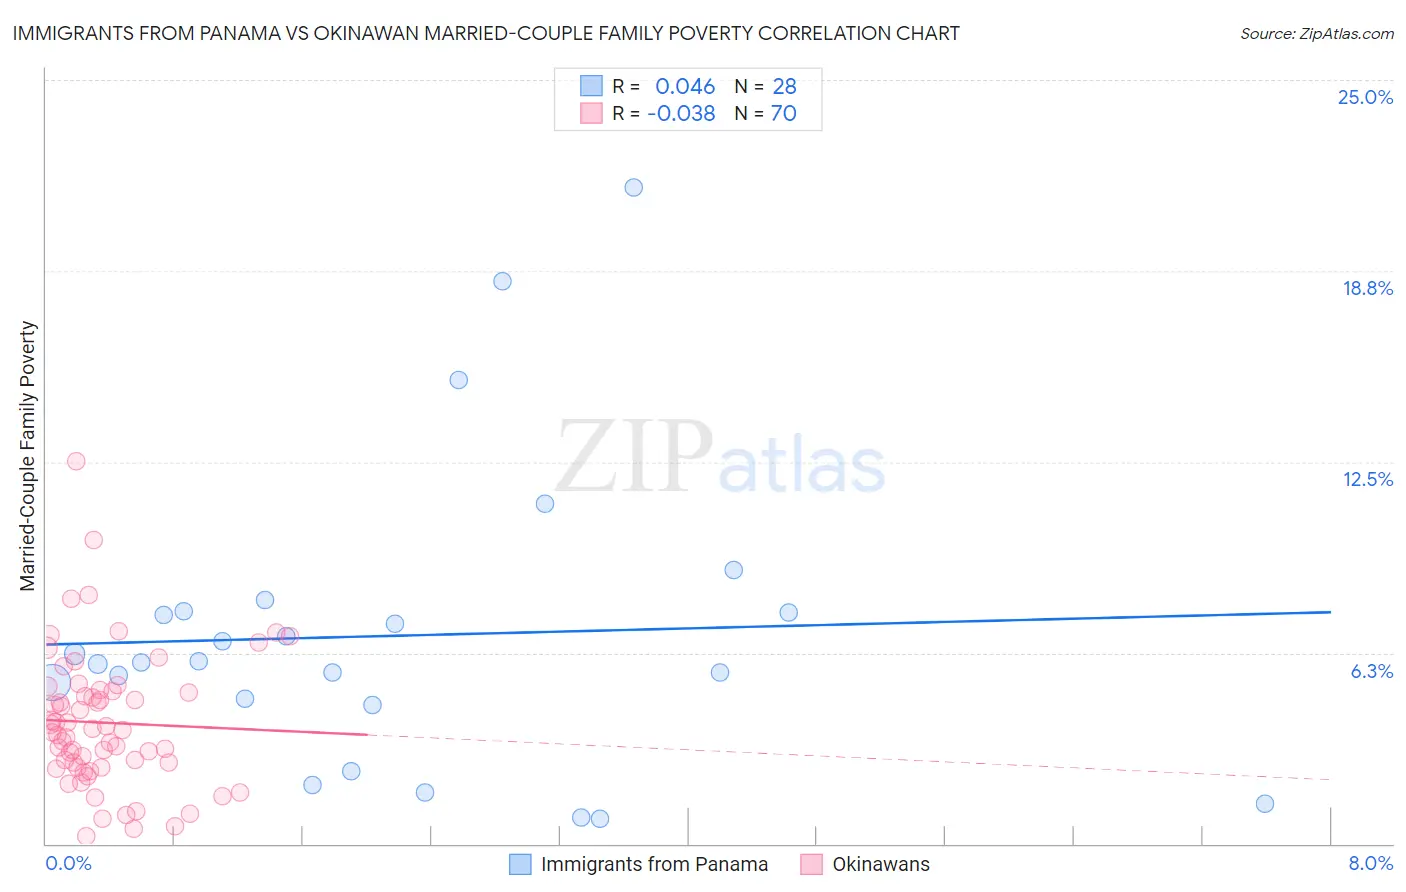
Immigrants from Panama vs Okinawan Married-Couple Family Poverty Correlation Chart
The statistical analysis conducted on geographies consisting of 220,360,551 people shows no correlation between the proportion of Immigrants from Panama and poverty level among married-couple families in the United States with a correlation coefficient (R) of 0.046 and weighted average of 5.8%. Similarly, the statistical analysis conducted on geographies consisting of 73,604,889 people shows no correlation between the proportion of Okinawans and poverty level among married-couple families in the United States with a correlation coefficient (R) of -0.038 and weighted average of 4.4%, a difference of 31.8%.
Married-Couple Family Poverty Correlation Summary
| Measurement | Immigrants from Panama | Okinawan |
| Minimum | 0.83% | 0.25% |
| Maximum | 21.5% | 12.5% |
| Range | 20.6% | 12.3% |
| Mean | 6.8% | 4.0% |
| Median | 5.9% | 3.7% |
| Interquartile 25% (IQ1) | 4.6% | 2.5% |
| Interquartile 75% (IQ3) | 7.6% | 5.0% |
| Interquartile Range (IQR) | 2.9% | 2.5% |
| Standard Deviation (Sample) | 4.9% | 2.2% |
| Standard Deviation (Population) | 4.8% | 2.2% |
Similar Demographics by Married-Couple Family Poverty
Demographics Similar to Immigrants from Panama by Married-Couple Family Poverty
In terms of married-couple family poverty, the demographic groups most similar to Immigrants from Panama are Fijian (5.8%, a difference of 0.020%), Immigrants from Western Africa (5.8%, a difference of 0.090%), Venezuelan (5.8%, a difference of 0.19%), Cherokee (5.8%, a difference of 0.22%), and Somali (5.8%, a difference of 0.24%).
| Demographics | Rating | Rank | Married-Couple Family Poverty |
| Immigrants | Uruguay | 3.7 /100 | #234 | Tragic 5.7% |
| Immigrants | Sudan | 3.5 /100 | #235 | Tragic 5.7% |
| Ghanaians | 3.3 /100 | #236 | Tragic 5.7% |
| Immigrants | South America | 3.1 /100 | #237 | Tragic 5.7% |
| Cherokee | 2.7 /100 | #238 | Tragic 5.8% |
| Venezuelans | 2.7 /100 | #239 | Tragic 5.8% |
| Fijians | 2.5 /100 | #240 | Tragic 5.8% |
| Immigrants | Panama | 2.5 /100 | #241 | Tragic 5.8% |
| Immigrants | Western Africa | 2.4 /100 | #242 | Tragic 5.8% |
| Somalis | 2.3 /100 | #243 | Tragic 5.8% |
| Chickasaw | 2.3 /100 | #244 | Tragic 5.8% |
| Immigrants | Afghanistan | 2.1 /100 | #245 | Tragic 5.8% |
| Immigrants | Venezuela | 1.8 /100 | #246 | Tragic 5.8% |
| Iraqis | 1.4 /100 | #247 | Tragic 5.9% |
| Cree | 1.2 /100 | #248 | Tragic 5.9% |
Demographics Similar to Okinawans by Married-Couple Family Poverty
In terms of married-couple family poverty, the demographic groups most similar to Okinawans are Immigrants from Australia (4.4%, a difference of 0.010%), Tlingit-Haida (4.4%, a difference of 0.11%), Immigrants from Sweden (4.4%, a difference of 0.18%), Immigrants from Sri Lanka (4.4%, a difference of 0.37%), and Czechoslovakian (4.4%, a difference of 0.73%).
| Demographics | Rating | Rank | Married-Couple Family Poverty |
| Austrians | 99.7 /100 | #54 | Exceptional 4.3% |
| French | 99.7 /100 | #55 | Exceptional 4.3% |
| Immigrants | Zimbabwe | 99.7 /100 | #56 | Exceptional 4.3% |
| Immigrants | Netherlands | 99.7 /100 | #57 | Exceptional 4.3% |
| Czechoslovakians | 99.7 /100 | #58 | Exceptional 4.4% |
| Immigrants | Sweden | 99.6 /100 | #59 | Exceptional 4.4% |
| Tlingit-Haida | 99.6 /100 | #60 | Exceptional 4.4% |
| Okinawans | 99.6 /100 | #61 | Exceptional 4.4% |
| Immigrants | Australia | 99.6 /100 | #62 | Exceptional 4.4% |
| Immigrants | Sri Lanka | 99.6 /100 | #63 | Exceptional 4.4% |
| Immigrants | Bulgaria | 99.5 /100 | #64 | Exceptional 4.4% |
| Macedonians | 99.4 /100 | #65 | Exceptional 4.4% |
| Immigrants | Serbia | 99.4 /100 | #66 | Exceptional 4.4% |
| Immigrants | Canada | 99.4 /100 | #67 | Exceptional 4.4% |
| Slavs | 99.4 /100 | #68 | Exceptional 4.4% |