Immigrants from Panama 1 or more Vehicles in Household

COMPARE

Immigrants from Panama
Race
Ancestry
AfghanAfricanAlaska NativeAlaskan AthabascanAlbanianAleutAlsatianAmericanApacheArabArapahoArgentineanArmenianAssyrian/Chaldean/SyriacAustralianAustrianBahamianBangladeshiBarbadianBasqueBelgianBelizeanBermudanBhutaneseBlackfeetBolivianBrazilianBritishBritish West IndianBulgarianBurmeseCajunCambodianCanadianCape VerdeanCarpatho RusynCelticCentral AmericanCentral American IndianCherokeeCheyenneChickasawChileanChineseChippewaChoctawColombianColvilleComancheCosta RicanCreeCreekCroatianCrowCubanCypriotCzechCzechoslovakianDanishDelawareDominicanDutchDutch West IndianEastern EuropeanEcuadorianEgyptianEnglishEstonianEthiopianEuropeanFijianFilipinoFinnishFrenchFrench American IndianFrench CanadianGermanGerman RussianGhanaianGreekGuamanian/ChamorroGuatemalanGuyaneseHaitianHmongHonduranHopiHoumaHungarianIcelanderIndian (Asian)IndonesianInupiatIranianIraqiIrishIroquoisIsraeliItalianJamaicanJapaneseJordanianKenyanKiowaKoreanLaotianLatvianLebaneseLiberianLithuanianLumbeeLuxembourgerMacedonianMalaysianMalteseMarshalleseMenomineeMexicanMexican American IndianMongolianMoroccanNative HawaiianNavajoNepaleseNew ZealanderNicaraguanNigerianNorthern EuropeanNorwegianOkinawanOsageOttawaPaiutePakistaniPalestinianPanamanianParaguayanPennsylvania GermanPeruvianPimaPolishPortuguesePotawatomiPuebloPuerto RicanPuget Sound SalishRomanianRussianSalvadoranSamoanScandinavianScotch-IrishScottishSeminoleSenegaleseSerbianShoshoneSierra LeoneanSiouxSlavicSlovakSloveneSomaliSouth AfricanSouth AmericanSouth American IndianSoviet UnionSpaniardSpanishSpanish AmericanSpanish American IndianSri LankanSubsaharan AfricanSudaneseSwedishSwissSyrianTaiwaneseThaiTlingit-HaidaTohono O'OdhamTonganTrinidadian and TobagonianTsimshianTurkishU.S. Virgin IslanderUgandanUkrainianUruguayanUteVenezuelanVietnameseWelshWest IndianYakamaYaquiYugoslavianYumanYup'ikZimbabwean
Immigration
NonimmigrantsImmigrantsAfghanistanAfricaAlbaniaArgentinaArmeniaAsiaAustraliaAustriaBahamasBangladeshBarbadosBelarusBelgiumBelizeBoliviaBosnia and HerzegovinaBrazilBulgariaBurma/MyanmarCabo VerdeCambodiaCameroonCanadaCaribbeanCentral AmericaChileChinaColombiaCongoCosta RicaCroatiaCubaCzechoslovakiaDenmarkDominicaDominican RepublicEastern AfricaEastern AsiaEastern EuropeEcuadorEgyptEl SalvadorEnglandEritreaEthiopiaEuropeFijiFranceGermanyGhanaGreeceGrenadaGuatemalaGuyanaHaitiHondurasHong KongHungaryIndiaIndonesiaIranIraqIrelandIsraelItalyJamaicaJapanJordanKazakhstanKenyaKoreaKuwaitLaosLatin AmericaLatviaLebanonLiberiaLithuaniaMalaysiaMexicoMicronesiaMiddle AfricaMoldovaMoroccoNepalNetherlandsNicaraguaNigeriaNorth AmericaNorth MacedoniaNorthern AfricaNorthern EuropeNorwayOceaniaPakistanPanamaPeruPhilippinesPolandPortugalRomaniaRussiaSaudi ArabiaScotlandSenegalSerbiaSierra LeoneSingaporeSomaliaSouth AfricaSouth AmericaSouth Central AsiaSouth Eastern AsiaSouthern EuropeSpainSri LankaSt. Vincent and the GrenadinesSudanSwedenSwitzerlandSyriaTaiwanThailandTrinidad and TobagoTurkeyUgandaUkraineUruguayUzbekistanVenezuelaVietnamWest IndiesWestern AfricaWestern AsiaWestern EuropeYemenZaireZimbabweAzores
Select to Compare
Race
Ancestry
AfghanAfricanAlaska NativeAlaskan AthabascanAlbanianAleutAlsatianAmericanApacheArabArapahoArgentineanArmenianAssyrian/Chaldean/SyriacAustralianAustrianBahamianBangladeshiBarbadianBasqueBelgianBelizeanBermudanBhutaneseBlackfeetBolivianBrazilianBritishBritish West IndianBulgarianBurmeseCajunCambodianCanadianCape VerdeanCarpatho RusynCelticCentral AmericanCentral American IndianCherokeeCheyenneChickasawChileanChineseChippewaChoctawColombianColvilleComancheCosta RicanCreeCreekCroatianCrowCubanCypriotCzechCzechoslovakianDanishDelawareDominicanDutchDutch West IndianEastern EuropeanEcuadorianEgyptianEnglishEstonianEthiopianEuropeanFijianFilipinoFinnishFrenchFrench American IndianFrench CanadianGermanGerman RussianGhanaianGreekGuamanian/ChamorroGuatemalanGuyaneseHaitianHmongHonduranHopiHoumaHungarianIcelanderIndian (Asian)IndonesianInupiatIranianIraqiIrishIroquoisIsraeliItalianJamaicanJapaneseJordanianKenyanKiowaKoreanLaotianLatvianLebaneseLiberianLithuanianLumbeeLuxembourgerMacedonianMalaysianMalteseMarshalleseMenomineeMexicanMexican American IndianMongolianMoroccanNative HawaiianNavajoNepaleseNew ZealanderNicaraguanNigerianNorthern EuropeanNorwegianOkinawanOsageOttawaPaiutePakistaniPalestinianPanamanianParaguayanPennsylvania GermanPeruvianPimaPolishPortuguesePotawatomiPuebloPuerto RicanPuget Sound SalishRomanianRussianSalvadoranSamoanScandinavianScotch-IrishScottishSeminoleSenegaleseSerbianShoshoneSierra LeoneanSiouxSlavicSlovakSloveneSomaliSouth AfricanSouth AmericanSouth American IndianSoviet UnionSpaniardSpanishSpanish AmericanSpanish American IndianSri LankanSubsaharan AfricanSudaneseSwedishSwissSyrianTaiwaneseThaiTlingit-HaidaTohono O'OdhamTonganTrinidadian and TobagonianTsimshianTurkishU.S. Virgin IslanderUgandanUkrainianUruguayanUteVenezuelanVietnameseWelshWest IndianYakamaYaquiYugoslavianYumanYup'ikZimbabwean
Immigration
NonimmigrantsImmigrantsAfghanistanAfricaAlbaniaArgentinaArmeniaAsiaAustraliaAustriaBahamasBangladeshBarbadosBelarusBelgiumBelizeBoliviaBosnia and HerzegovinaBrazilBulgariaBurma/MyanmarCabo VerdeCambodiaCameroonCanadaCaribbeanCentral AmericaChileChinaColombiaCongoCosta RicaCroatiaCubaCzechoslovakiaDenmarkDominicaDominican RepublicEastern AfricaEastern AsiaEastern EuropeEcuadorEgyptEl SalvadorEnglandEritreaEthiopiaEuropeFijiFranceGermanyGhanaGreeceGrenadaGuatemalaGuyanaHaitiHondurasHong KongHungaryIndiaIndonesiaIranIraqIrelandIsraelItalyJamaicaJapanJordanKazakhstanKenyaKoreaKuwaitLaosLatin AmericaLatviaLebanonLiberiaLithuaniaMalaysiaMexicoMicronesiaMiddle AfricaMoldovaMoroccoNepalNetherlandsNicaraguaNigeriaNorth AmericaNorth MacedoniaNorthern AfricaNorthern EuropeNorwayOceaniaPakistanPeruPhilippinesPolandPortugalRomaniaRussiaSaudi ArabiaScotlandSenegalSerbiaSierra LeoneSingaporeSomaliaSouth AfricaSouth AmericaSouth Central AsiaSouth Eastern AsiaSouthern EuropeSpainSri LankaSt. Vincent and the GrenadinesSudanSwedenSwitzerlandSyriaTaiwanThailandTrinidad and TobagoTurkeyUgandaUkraineUruguayUzbekistanVenezuelaVietnamWest IndiesWestern AfricaWestern AsiaWestern EuropeYemenZaireZimbabweAzores
1 or more Vehicles in Household
Income
Poverty
Unemployment
Labor Participation
Family Structure
Vehicle Availability
Education Level
Disability

Immigrants from Panama 1 or more Vehicles in Household
Tragic

85.4%
1+ VEHICLES AVAILABLE
0.0/ 100
METRIC RATING
301st/ 347
METRIC RANK

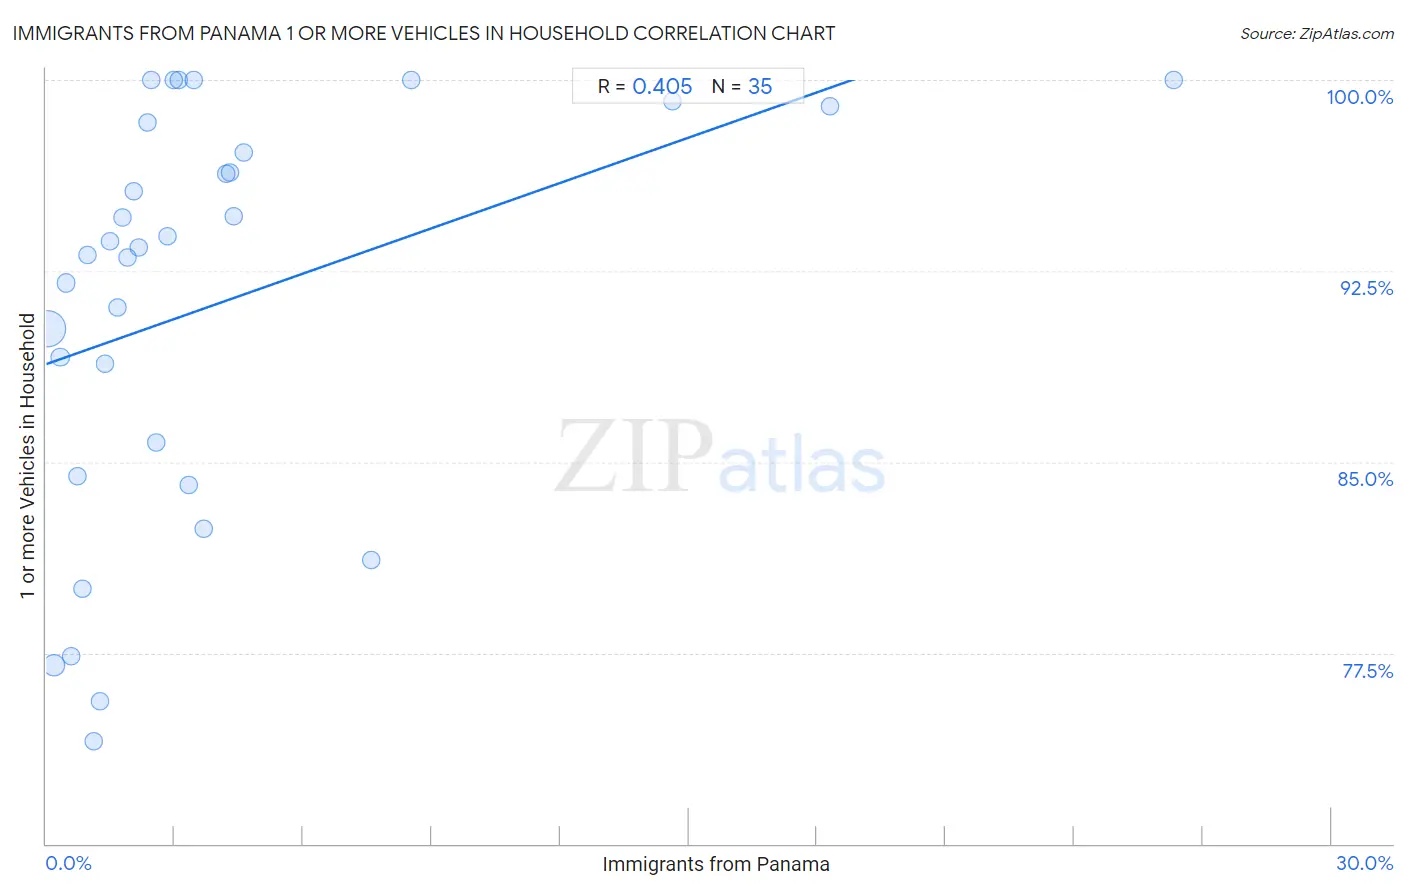
Immigrants from Panama 1 or more Vehicles in Household Correlation Chart

The statistical analysis conducted on geographies consisting of 221,156,465 people shows a moderate positive correlation between the proportion of Immigrants from Panama and percentage of households with 1 or more vehicles available in the United States with a correlation coefficient (R) of 0.405 and weighted average of 85.4%. On average, for every 1% (one percent) increase in Immigrants from Panama within a typical geography, there is an increase of 0.59% in percentage of households with 1 or more vehicles available.
Immigrants from Panama 1 or more Vehicles in Household
It is essential to understand that the correlation between the percentage of Immigrants from Panama and percentage of households with 1 or more vehicles available does not imply a direct cause-and-effect relationship. It remains uncertain whether the presence of Immigrants from Panama influences an upward or downward trend in the level of percentage of households with 1 or more vehicles available within an area, or if Immigrants from Panama simply ended up residing in those areas with higher or lower levels of percentage of households with 1 or more vehicles available due to other factors.

Demographics Similar to Immigrants from Panama by 1 or more Vehicles in Household

In terms of 1 or more vehicles in household, the demographic groups most similar to Immigrants from Panama are Moroccan (85.4%, a difference of 0.020%), Immigrants from Russia (85.4%, a difference of 0.040%), Yuman (85.5%, a difference of 0.050%), Immigrants from Greece (85.4%, a difference of 0.050%), and Immigrants from Ukraine (85.2%, a difference of 0.22%).
DemographicsRating | Rank1 or more Vehicles in Household
Alaskan Athabascans
0.0
/100
|
#294
Tragic
86.0%
Immigrants from Jamaica
0.0
/100
|
#295
Tragic
85.8%
Immigrants from Spain
0.0
/100
|
#296
Tragic
85.8%
Paraguayans
0.0
/100
|
#297
Tragic
85.7%
Belizeans
0.0
/100
|
#298
Tragic
85.7%
Yuman
0.0
/100
|
#299
Tragic
85.5%
Immigrants from Russia
0.0
/100
|
#300
Tragic
85.4%
Immigrants from Panama
0.0
/100
|
#301
Tragic
85.4%
Moroccans
0.0
/100
|
#302
Tragic
85.4%
Immigrants from Greece
0.0
/100
|
#303
Tragic
85.4%
Immigrants from Ukraine
0.0
/100
|
#304
Tragic
85.2%
Immigrants from China
0.0
/100
|
#305
Tragic
84.9%
Immigrants from Western Africa
0.0
/100
|
#306
Tragic
84.9%
Tohono O'odham
0.0
/100
|
#307
Tragic
84.7%
Immigrants from Belize
0.0
/100
|
#308
Tragic
84.7%

Immigrants from Panama 1 or more Vehicles in Household Correlation Summary

MeasurementImmigrants from Panama Data1 or more Vehicles in Household Data
Minimum0.042%74.0%
Maximum26.3%100.0%
Range26.3%26.0%
Mean4.0%91.2%
Median2.4%93.4%
Interquartile 25% (IQ1)1.1%84.4%
Interquartile 75% (IQ3)4.2%98.3%
Interquartile Range (IQR)3.1%13.9%
Standard Deviation (Sample)5.4%8.0%
Standard Deviation (Population)5.4%7.9%

Correlation Details

Immigrants from Panama PercentileSample Size1 or more Vehicles in Household
[
0.0%
-
0.5%
]
0.042%
177,245,34090.2%
[
0.0%
-
0.5%
]
0.18%
30,554,26377.0%
[
0.0%
-
0.5%
]
0.32%
6,808,25889.1%
[
0.0%
-
0.5%
]
0.45%
3,119,55992.0%
[
0.5%
-
1.0%
]
0.59%
1,462,01277.4%
[
0.5%
-
1.0%
]
0.73%
910,31884.4%
[
0.5%
-
1.0%
]
0.85%
295,32880.0%
[
0.5%
-
1.0%
]
0.96%
255,19293.1%
[
1.0%
-
1.5%
]
1.10%
170,82874.0%
[
1.0%
-
1.5%
]
1.24%
167,23875.6%
[
1.0%
-
1.5%
]
1.36%
4,39688.9%
[
1.0%
-
1.5%
]
1.49%
34,22693.7%
[
1.5%
-
2.0%
]
1.66%
18,76591.1%
[
1.5%
-
2.0%
]
1.78%
37,50894.6%
[
1.5%
-
2.0%
]
1.90%
1,84193.0%
[
2.0%
-
2.5%
]
2.03%
24,41395.6%
[
2.0%
-
2.5%
]
2.17%
4,10593.4%
[
2.0%
-
2.5%
]
2.36%
19,21698.3%
[
2.0%
-
2.5%
]
2.47%
1,460100.0%
[
2.5%
-
3.0%
]
2.57%
3,77585.8%
[
2.5%
-
3.0%
]
2.84%
1,65393.9%
[
2.5%
-
3.0%
]
2.97%
1,247100.0%
[
3.0%
-
3.5%
]
3.11%
644100.0%
[
3.0%
-
3.5%
]
3.33%
7,29984.1%
[
3.0%
-
3.5%
]
3.45%
522100.0%
[
3.5%
-
4.0%
]
3.66%
2,18382.4%
[
4.0%
-
4.5%
]
4.19%
1,00296.3%
[
4.0%
-
4.5%
]
4.28%
1,33296.4%
[
4.0%
-
4.5%
]
4.37%
18394.6%
[
4.5%
-
5.0%
]
4.62%
1,38597.1%
[
7.5%
-
8.0%
]
7.59%
51481.1%
[
8.5%
-
9.0%
]
8.51%
47100.0%
[
14.5%
-
15.0%
]
14.61%
21999.2%
[
18.0%
-
18.5%
]
18.29%
17599.0%
[
26.0%
-
26.5%
]
26.32%
19100.0%